
Abstract
Exhaust gases generated by fossil fuel combustion significantly contribute to air pollution and climate change, emphasizing the need for efficient combustion diagnostics. OH radicals are key indicators of flame behavior; however, conventional laser-induced fluorescence (LIF) techniques are impractical for industrial monitoring due to their complexity. In this study, wavelength modulation spectroscopy (WMS) employing a near-infrared laser at 1.49 μm was used to measure OH radical concentrations, incorporating a correction for spectral interference from H2O. A wavelength division multiplexer (WDM) was used to enable the simultaneous operation of two lasers at 1.49 μm (OH) and 1.39 μm (H2O, temperature), allowing for correction of water interference. OH concentrations were determined using both WMS and direct absorption spectroscopy (DAS), and the results were evaluated through comparison with CHEMKIN simulations. The proposed dual-laser system demonstrated reliable and interference-corrected quantification of OH radicals in methane (CH4)/air premixed flames over a range of equivalence ratios. Comparisons with thermocouple-based temperature measurements and CHEMKIN-predicted species concentrations confirmed the reliability of the proposed technique. This study highlights the robustness and applicability of WMS-based OH diagnostics for combustion monitoring and demonstrates the potential for future implementation in industrial burner systems.
This is a visual representation of the abstract.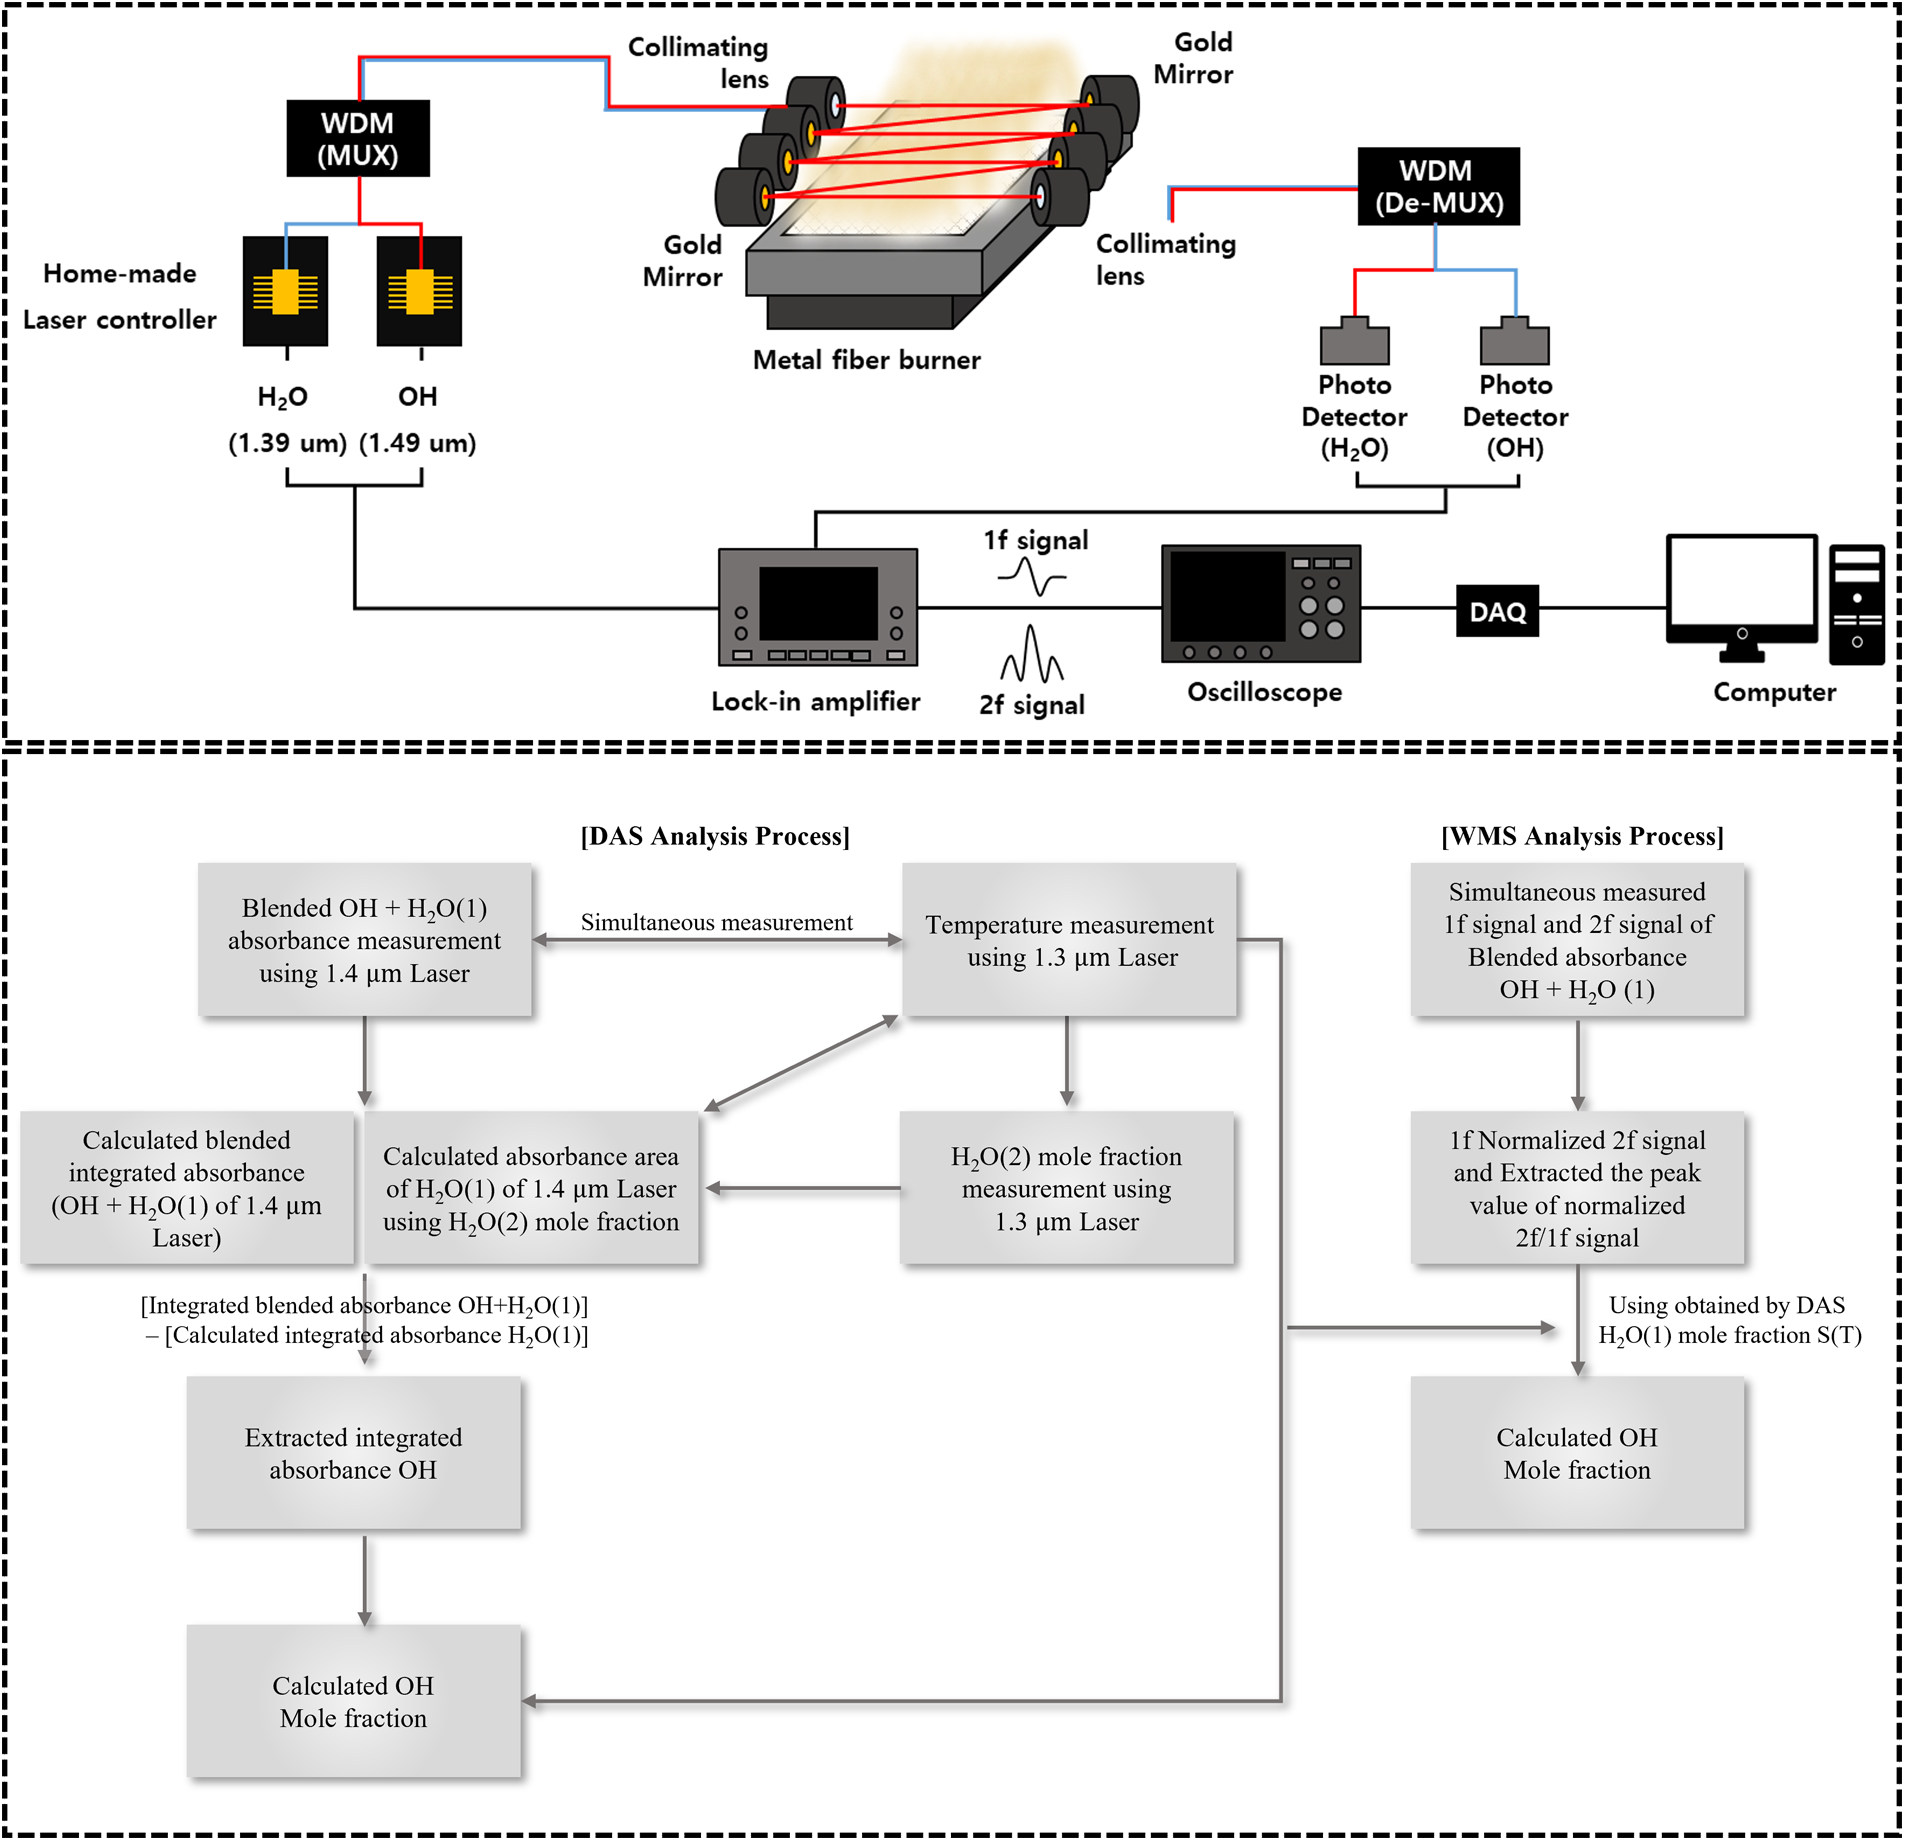
Keywords
Introduction
In response to increasingly stringent environmental regulations, combustion technologies are required to reduce pollutant emissions while maintaining or improving performance. Hydroxyl (OH) radicals play a crucial role in combustion chemistry, and their concentrations serve as sensitive indicators of flame structure and combustion dynamics. Therefore, accurate quantification of OH radical concentrations is essential for optimizing combustion processes and mitigating NOX emissions. However, real-time measurement of OH radicals in high-temperature flames is particularly challenging due to their high reactivity and short lifetimes, which make conventional sampling-based techniques impractical. As a result, laser-based diagnostic methods have emerged as effective tools for OH detection in combustion environments.1–5
Among these techniques, laser-induced fluorescence (LIF) has been widely used. This technique detects OH by exciting the molecule with a laser and collecting the resulting fluorescence emission, enabling visualization of flame structures. However, the complexity and bulkiness of LIF systems have limited their practical use in industrial combustion settings.6–8 Chemiluminescence imaging, another method, uses optical filters to observe specific emission wavelengths, but it lacks both spatial resolution and quantitative accuracy.9–11
In contrast, tunable diode laser absorption spectroscopy (TDLAS) provides a quantitative and species-selective approach based on the absorption of laser light at specific wavelengths. The simple and robust design of TDLAS makes it suitable for harsh environments. TDLAS has been successfully applied in numerous studies to measure OH radical concentrations. The OH radical absorption spectrum spans both the ultraviolet (UV) and near-infrared (NIR) spectral regions. Although UV absorption lines are strong and free from interference, UV laser systems are typically bulky and less suitable for practical diagnostics.12–16 The NIR region allows for compact laser systems; however, OH absorption lines are significantly weaker and often overlap with water (H2O) absorption, which is inherent in combustion products.17–22
To address this challenge, various methods have been developed to correct for H2O interference in OH measurements.17–19 For example, Hayden et al. used dual-comb spectroscopy with three lasers at 1.49, 1.46, and 1.39 μm. 17 Gao et al. applied wavelength modulation spectroscopy (WMS) using a single laser to alternate between OH and H2O transitions. 18 So et al. proposed a dual-laser direct absorption spectroscopy (DAS) method to isolate OH from overlapping H2O signals. 19
In this study, a dual-laser diagnostic method was employed, using a near-infrared laser at 1.49 μm to detect OH radicals and a second laser at 1.39 μm to measure flame temperature and H2O concentration. A wavelength division multiplexer (WDM) was used to allow both beams to simultaneously probe the same flame region. Wavelength modulation spectroscopy (WMS) was applied to enhance sensitivity and to enable quantitative detection of OH radicals in the presence of spectral interference. The results obtained from DAS and WMS were compared with CHEMKIN simulations to examine the relative behavior of the measured species under identical conditions. The primary objective of this study is to demonstrate that wavelength modulation spectroscopy can be effectively applied to quantify OH radical concentrations under conditions with significant H2O interference, while yielding results that are physically consistent with those obtained using direct absorption spectroscopy.
Theoretical Principles
Direct Absorption Spectroscopy (DAS)
Calculation of Gas Concentration
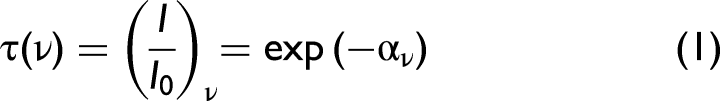
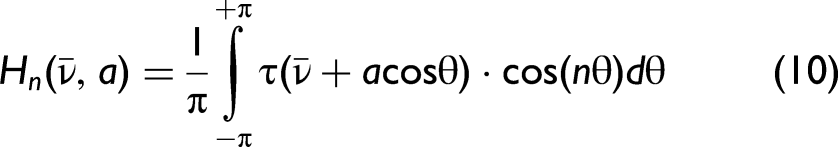
Direct absorption spectroscopy (DAS) provides the advantage of relatively straightforward gas concentration retrieval without the need for external calibration. However, under certain measurement conditions, a reduction in the effective absorption area can hinder accurate concentration determination. In DAS, the laser wavelength is scanned with a ramp waveform of specified frequency and amplitude and passed through the target gas, where selective absorption occurs. The resulting absorption profile is then analyzed to retrieve the gas concentration and, in some cases, the temperature. The transmission coefficient

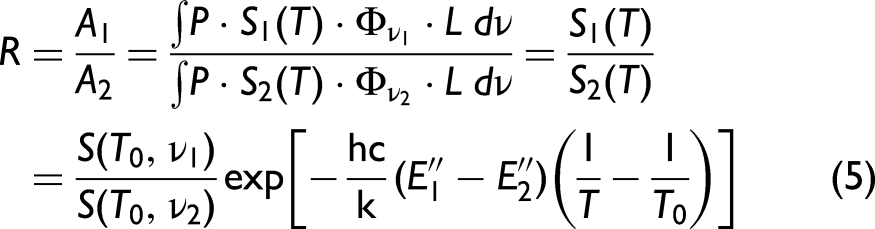
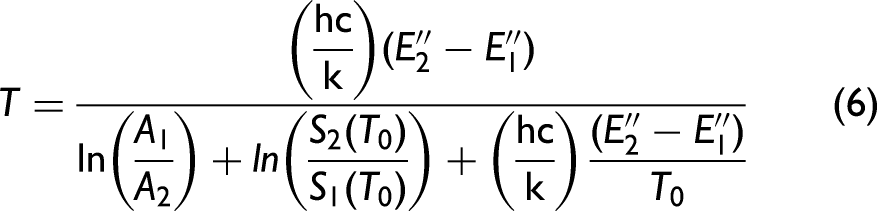
Calculation of Gas Temperature
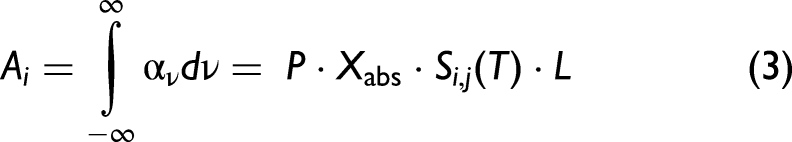
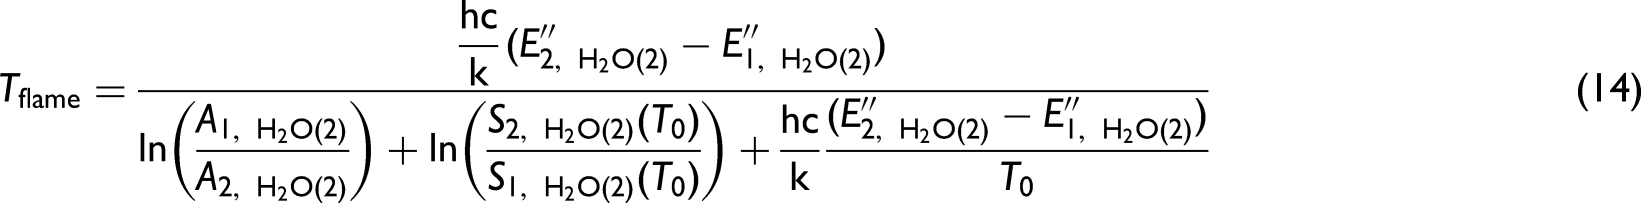
Accurate gas temperature measurement using TDLAS requires two spectrally distinct absorption transitions. The temperature is inferred from the ratio of two spectrally resolved absorption signals, selected according to the prevailing measurement conditions. As in the concentration analysis, the integrated absorbance areas of the two selected transitions are computed using Eq. 3. The gas temperature is subsequently determined from the ratio of the two integrated absorbance areas, as expressed in Eq. 5.
Wavelength Modulation Spectroscopy (WMS)
Calculation of Gas Concentration
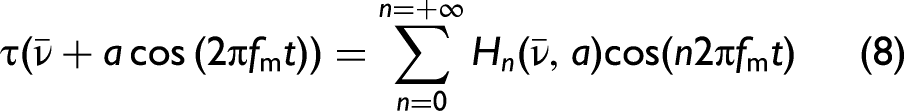
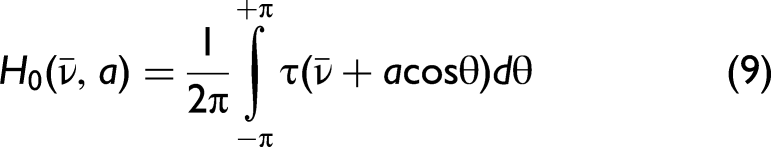
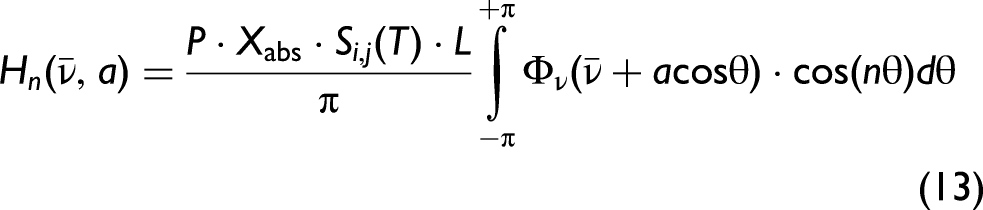
Wavelength modulation spectroscopy (WMS) applies a high-frequency sinusoidal modulation superimposed onto a low-frequency ramp waveform. Harmonic signals, specifically the first (1f) and second (2f) components, are extracted using a lock-in amplifier to obtain gas concentration information. Compared to direct absorption spectroscopy (DAS), WMS provides higher sensitivity, enabling the detection of trace gas concentrations; however, it requires additional calibration. The wavelength modulation applied in WMS is mathematically described by Eq. 7.

The coefficients
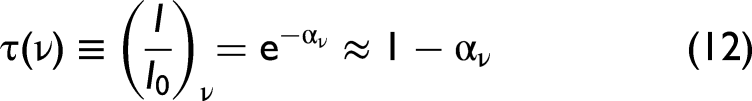
Under the weak absorption limit, the transmission coefficient can be approximated using Eq. 12 when the condition in Eq. 11 is satisfied, i.e., when the peak absorbance

Analysis Procedure for OH Radicals, H2O Concentration, and Flame Temperature
Figure 1 presents a schematic illustration of the analysis procedure used to isolate OH radical signals and correct for H2O interference using both DAS and WMS techniques. The procedure includes signal acquisition, temperature determination, and concentration retrieval.
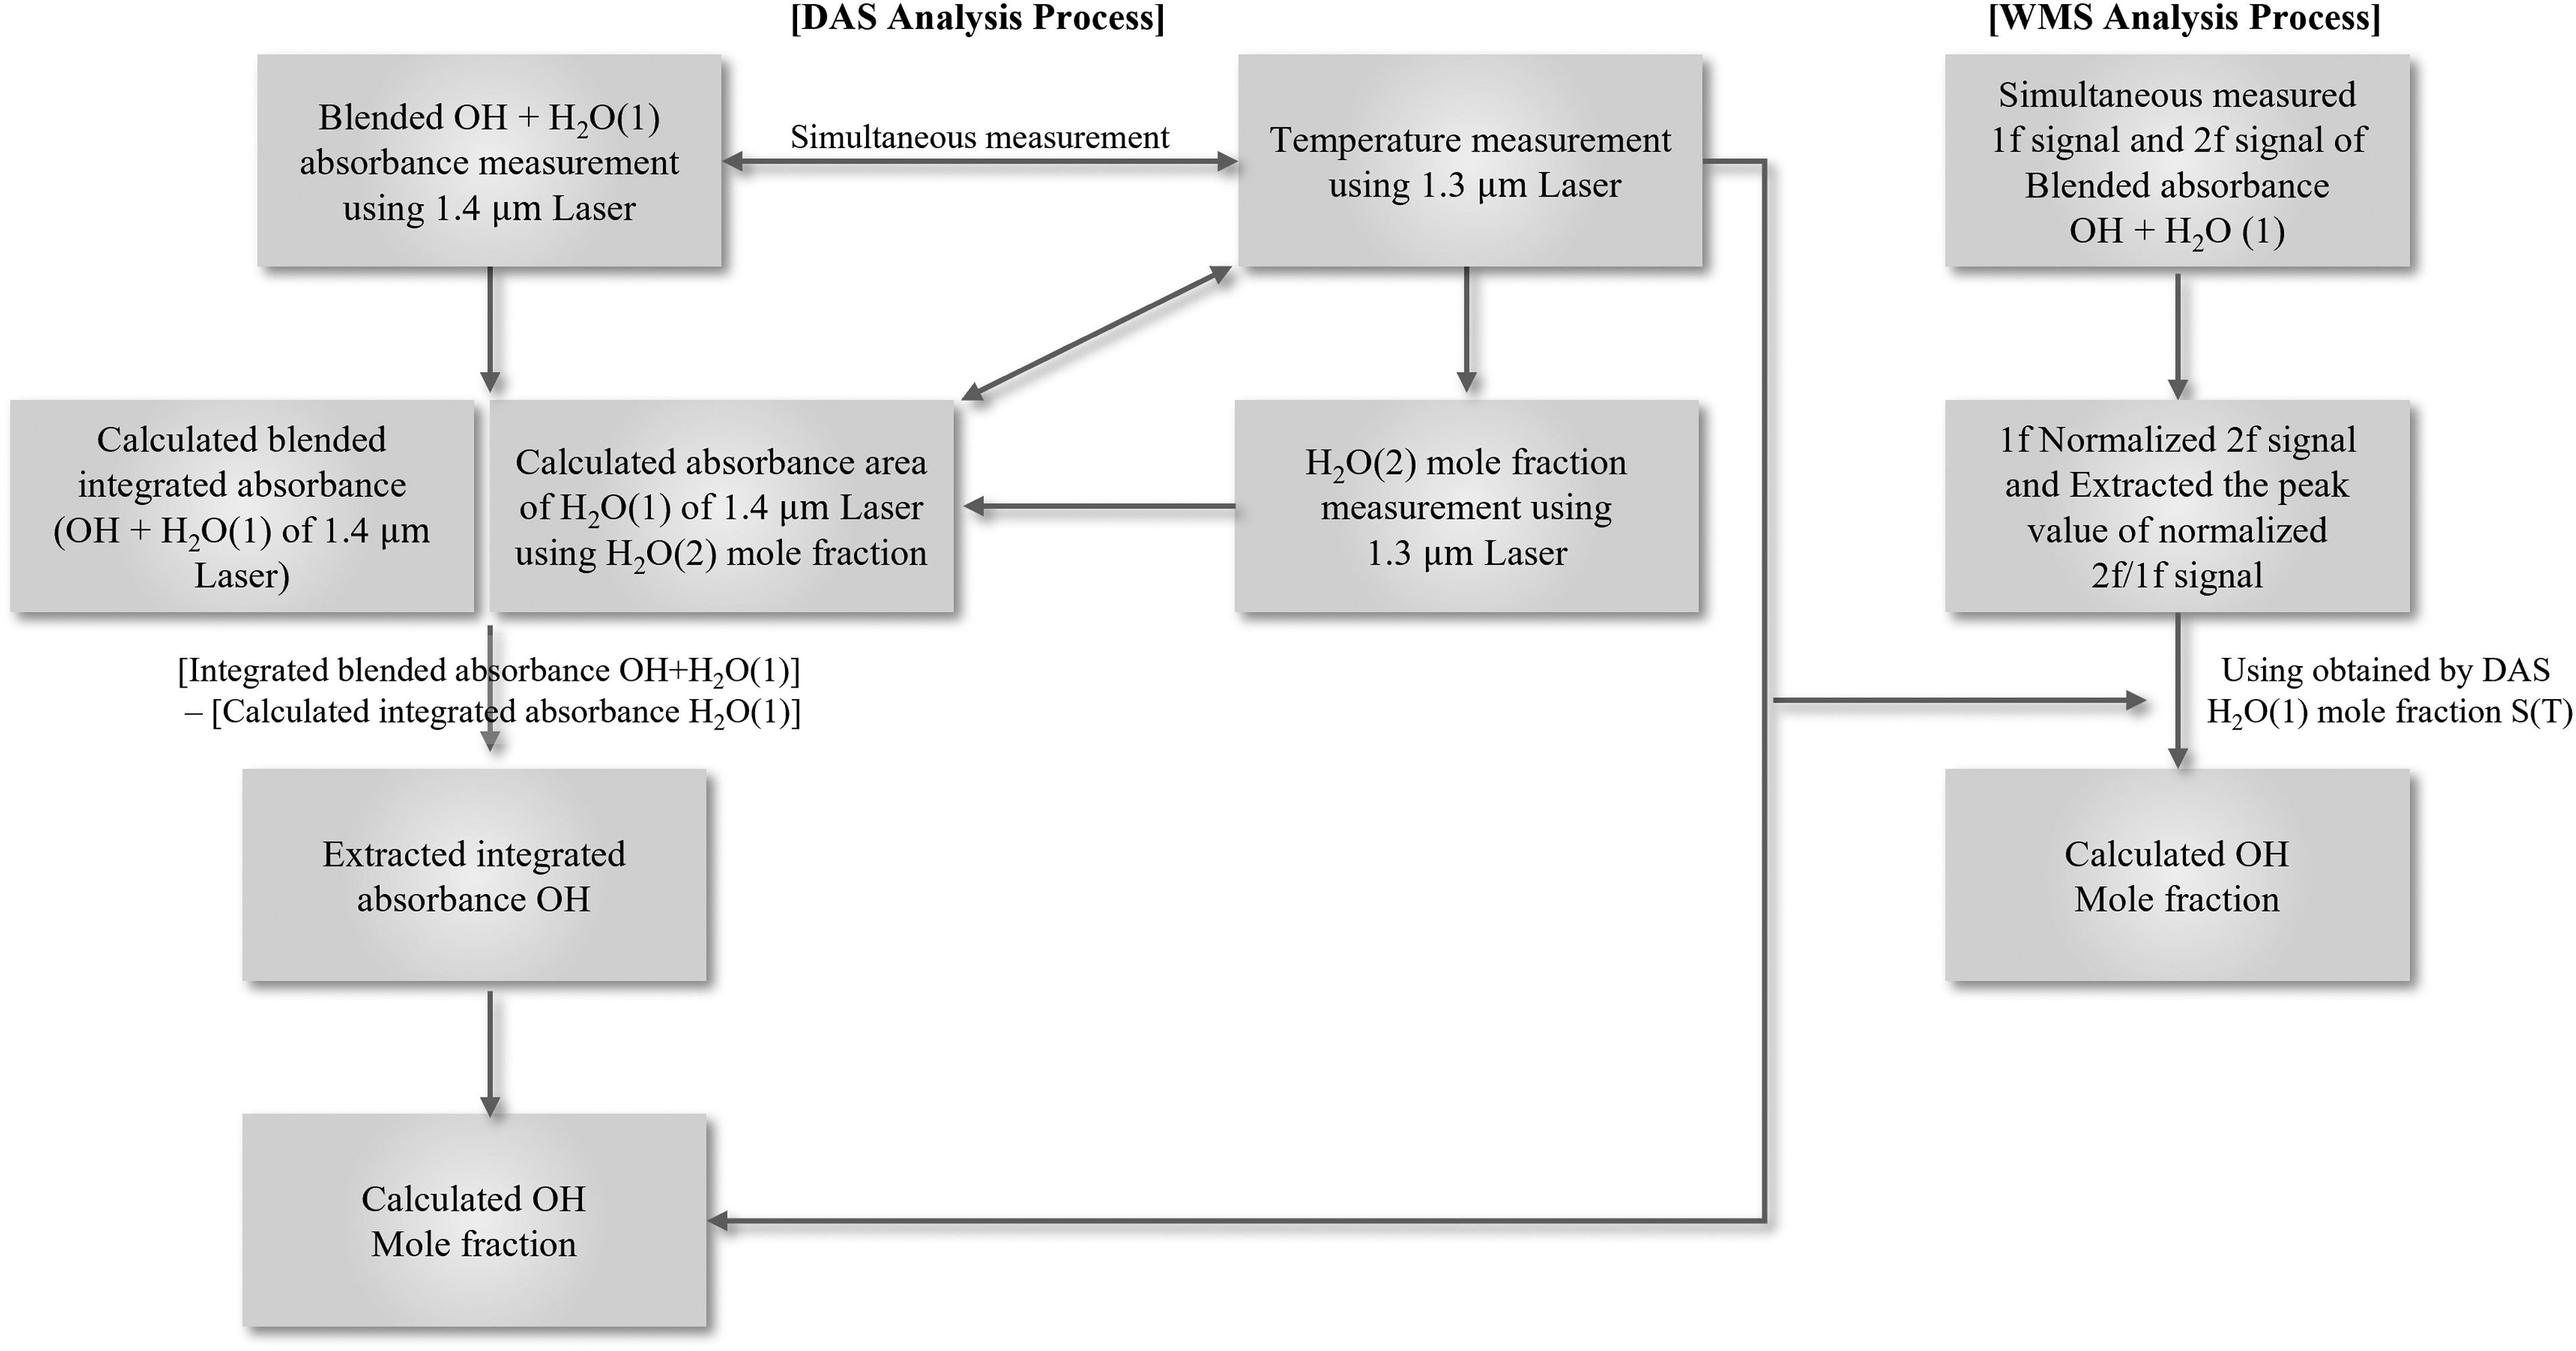
Analysis process for measuring OH radicals while eliminating H2O interference using DAS and WMS.
DAS Analysis Procedure
To eliminate H2O interference in OH measurements using DAS, two lasers, designated as A (1.49 μm) and B (1.39 μm), are simultaneously directed through the same spatiotemporal region via a wavelength division multiplexer (WDM), which combines both beams into a single optical path, enabling the simultaneous acquisition of both absorption signals. The combined beam is collimated and directed through both a reference cell and the flame zone. The transmitted light is subsequently focused onto a photodetector, and the resulting signal is demodulated using a lock-in amplifier for harmonic extraction.
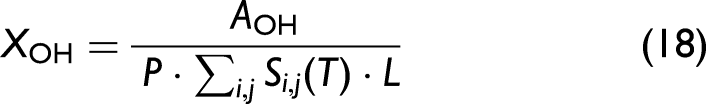
The procedure for isolating the OH radical signal from overlapping H2O(1) interference is as follows (here, H2O(1) denotes the H2O transition overlapping with the OH absorption line). First, the integrated absorbance areas
WMS Analysis Procedure
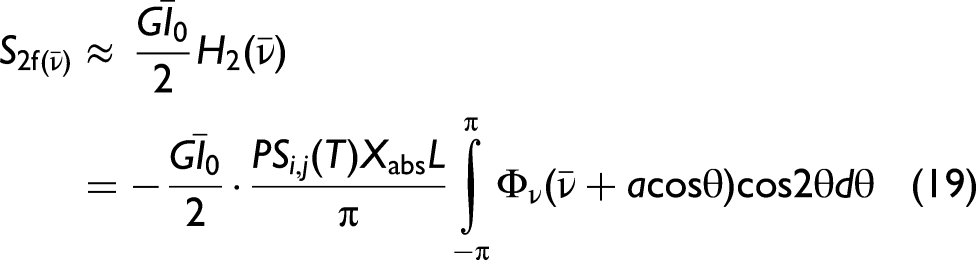
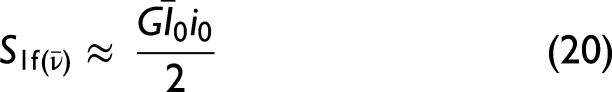
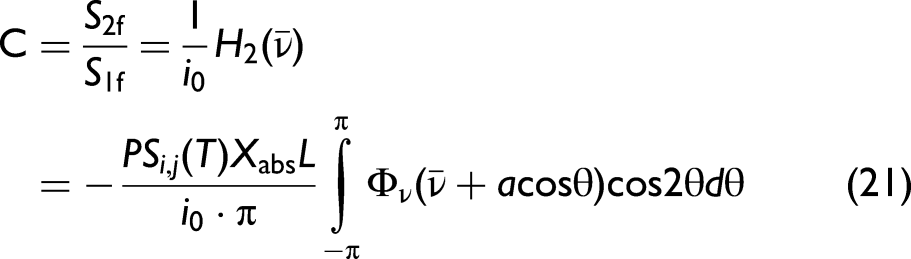
In WMS, the first (1f) and second (2f) harmonic signals are extracted using a lock-in amplifier and are mathematically represented by Eq. 19 and Eq. 20.
The modulation depth is defined as
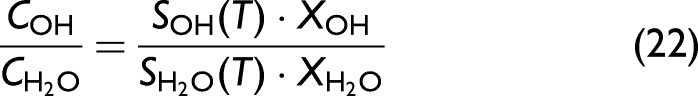
Under weak-absorption conditions, the peak amplitudes of the OH and H2O harmonic signals are proportional to the product of their respective line strengths and species concentrations. Based on this proportionality, the ratio of the normalized harmonic amplitudes for OH and H2O can be expressed as shown in Eq. 22. The OH mole fraction is subsequently determined using Eq. 23.
Experimental
Line Selection
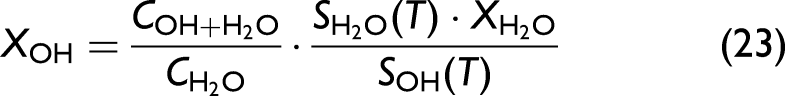
Precise selection of laser wavelengths is essential in TDLAS-based diagnostics because gas temperature and species concentrations are derived from spectrally resolved absorption signals. Figure 2a presents simulated absorption spectra of major reactants and products at 1473 K and 1 atm, generated using the HITRAN molecular spectroscopic database. 23 Within the 1.3–1.7 µm range, strong H2O interference appears near the OH absorption features, and additional absorption from CH4, CO, and N2O is also observed. When the flame temperature is assumed to be approximately 1473 K, the HITRAN simulation indicates that H2O absorption dominates the spectral region from 1400 to 1600 nm around the OH lines. Therefore, selecting wavelengths with sufficiently strong OH line strength while minimizing interference from other species is essential for quantitative OH concentration measurements.
Simulated absorption spectra of OH radicals, H2O, and other combustion-related species at 1473 K and 1 atm, calculated using the HITRAN database: (a) spectra in the 1.3–1.7 μm wavelength range; (b) enlarged view of the 1.39 μm H2O transitions used for flame temperature and H2O concentration measurements; and (c) enlarged view of the 1.49 μm OH transitions used for OH radical quantification.
In this study, two near-infrared (NIR) wavelengths were employed to measure the OH radical concentration. The 1.39 µm region, shown in Figure 2b, is dominated by strong H2O absorption and was used to simultaneously determine the flame temperature and H2O concentration, enabling quantitative correction of H2O interference in the OH spectrum. Meanwhile, the 1.49 µm region, shown in Figure 2c, exhibits relatively stronger OH line strength and reduced spectral overlap with H2O, making it more suitable for OH detection; however, the H2O interference is still not negligible.
Experimental Setup and Conditions
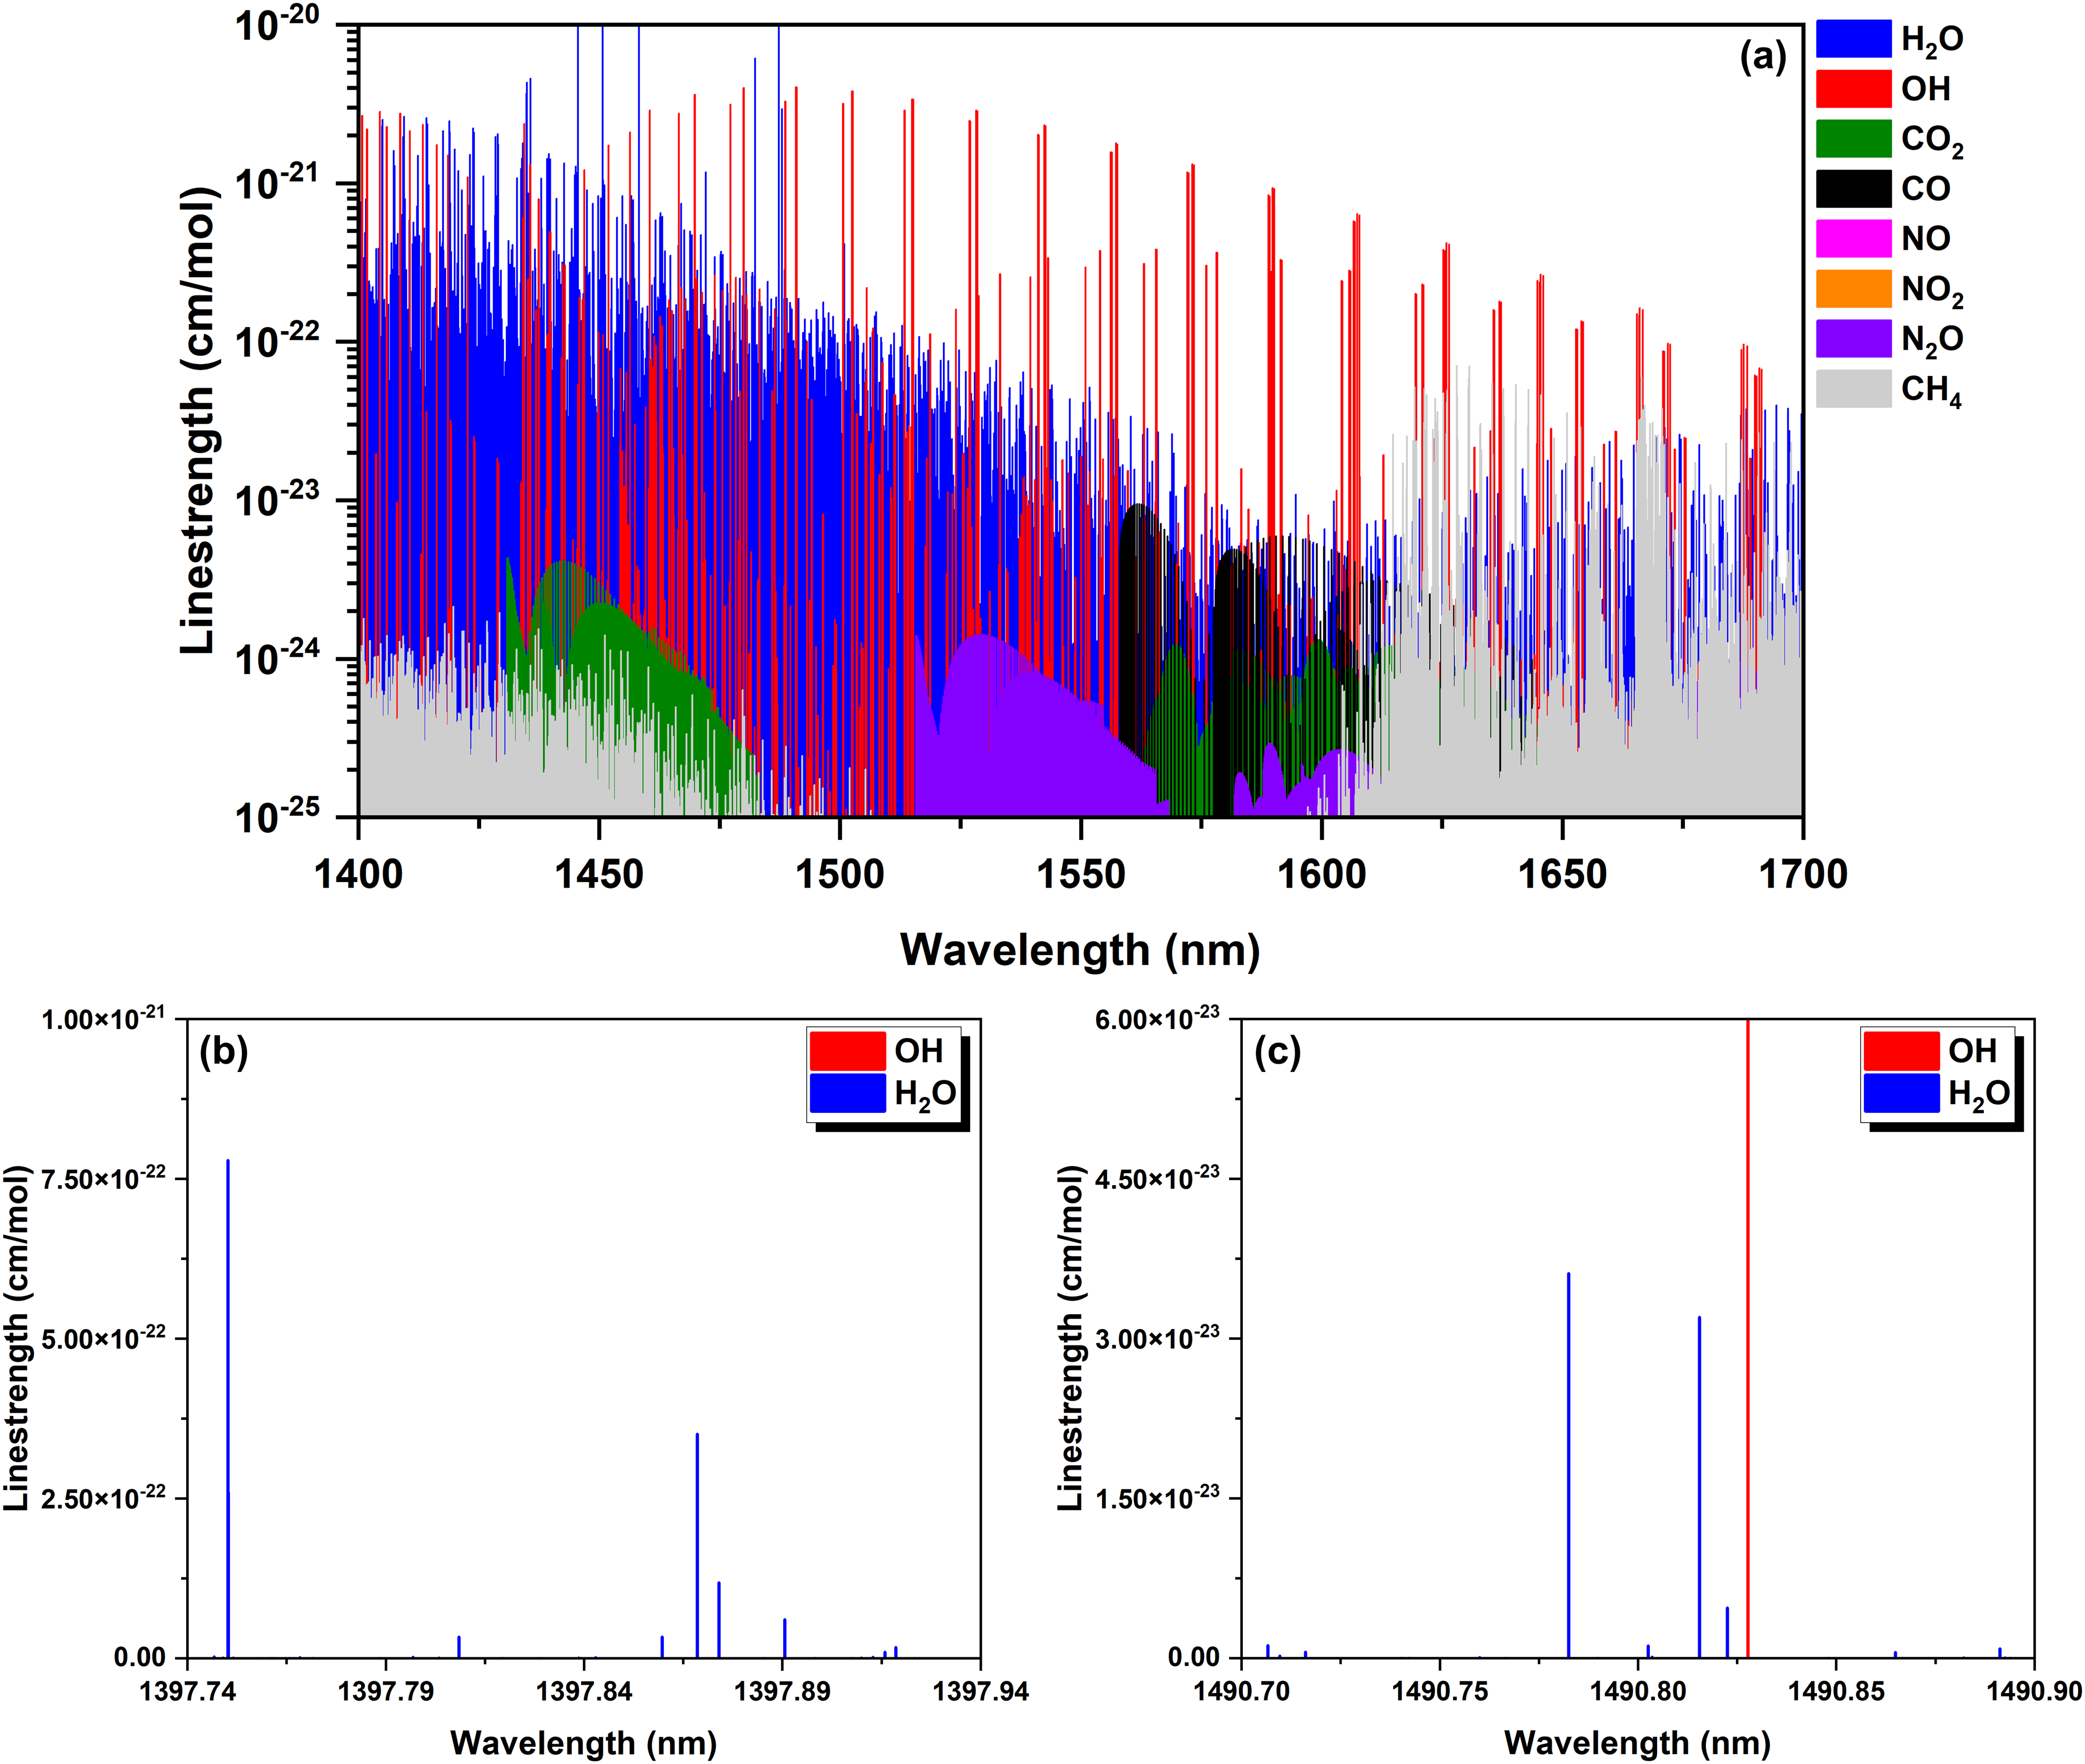
The two lasers were combined into a single collimated beam on the transmission side using a wavelength-division multiplexer (MUX) and were routed together through the measurement region; a schematic of the optical setup is shown in Figure 3. At the receiver, the combined beam was separated by a demultiplexer (DEMUX) that exploits wavelength-dependent refractive-index differences, allowing independent detection of each channel. Because both wavelengths traverse essentially the same collimated path, turbulence-induced beam steering affects them equally and does not produce differential loss between the OH and H2O signals.
Experimental setup for OH radical measurement using TDLAS.
In the transmission unit, a 1.39 µm DFB laser (NTT Electronics, model NLK1E5GAAA, linewidth ≈ 2 MHz) was employed for flame-temperature and H2O measurements, while a 1.49 µm diode laser (AeroDiODE, model 1491LD-2-0-0-1; optical output power 20 mW at an operating current of 90 mA) was used for OH quantification. Both lasers were driven by a custom function generator integrated with a laser controller that regulated injection current and device temperature while providing the modulation signals. To suppress low-frequency intensity fluctuations associated with turbulent flow and beam wander, high-frequency modulation schemes were applied: amplitude modulation at 4 kHz for DAS, and a 1 kHz wavelength ramp with a superimposed 60 kHz sinusoidal modulation for WMS harmonic detection.
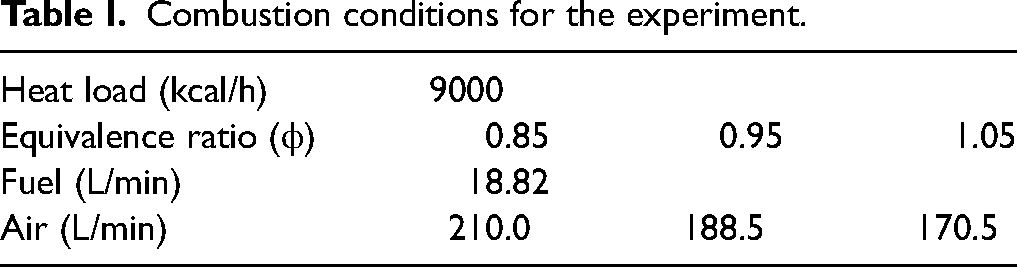
The modulated beam was collimated and aligned to pass approximately 5 mm above the flame surface. To increase sensitivity for trace OH detection, the effective optical path length was extended by six mirrors to produce multiple reflections above the flame; after transmission the beam was re-collected by a collimation lens, spectrally separated by the DEMUX, and converted to electrical signals by photodetectors (Thorlabs PDA20CS2; 800–1700 nm). The detector outputs were demodulated using a lock-in amplifier (AMETEK Signal Recovery 7270 DSP Lock-in Amplifier), synchronized to the 60 kHz modulation frequency for harmonic extraction in the WMS measurements. Because a WDM-based common optical path was used, the geometric optical path length was identical (135 cm) for both wavelengths. However, OH radicals are confined to the thin flame-front region, so only the flame-intersecting portion of the beam (94 cm) contributes to OH absorption. Accordingly, an effective path length of 94 cm was used for OH quantification, whereas the full 135 cm path was used for H2O. The DAS–WMS comparison for OH was therefore performed using the same effective OH path length (94 cm). Data acquisition and subsequent analysis were performed using a custom-developed analysis system. For all experiments, a laboratory-scale metal-fiber premixed burner was operated at a fixed heat load of 9000 kcal/h. The equivalence-ratio window (
Combustion conditions for the experiment.
Results and Discussion
Results of Flame Temperature Measurements
First, the results of flame temperature measurements obtained using H2O absorption spectroscopy are presented. The flame temperature was calculated using DAS by analyzing the integrated-area ratio of two selected H2O absorption lines. Experiments were conducted at equivalence ratios of 0.85, 0.95, and 1.05 to evaluate the influence of combustion conditions on flame temperature. For comparison, flame temperatures were also measured at the same height above the burner using an R-type thermocouple, and the results are summarized in Table II. The thermocouple junction was mounted on an unshielded probe and positioned 5 mm above the burner surface along the laser beam axis. As illustrated in Figure 4a, temperature measurements were conducted at three positions, i.e., center, left, and right on the burner. The thermocouple temperature reported in Table II represents the average of these three measurement locations. Radiative heat loss at the thermocouple junction was recognized as a potential source of measurement uncertainty; however, no quantitative radiation correction was applied in this study. As a result, the measured thermocouple temperature may deviate from the actual gas temperature depending on local heat-transfer conditions, including radiative and convective effects. Figure 4b compares the temperatures measured by the two techniques.
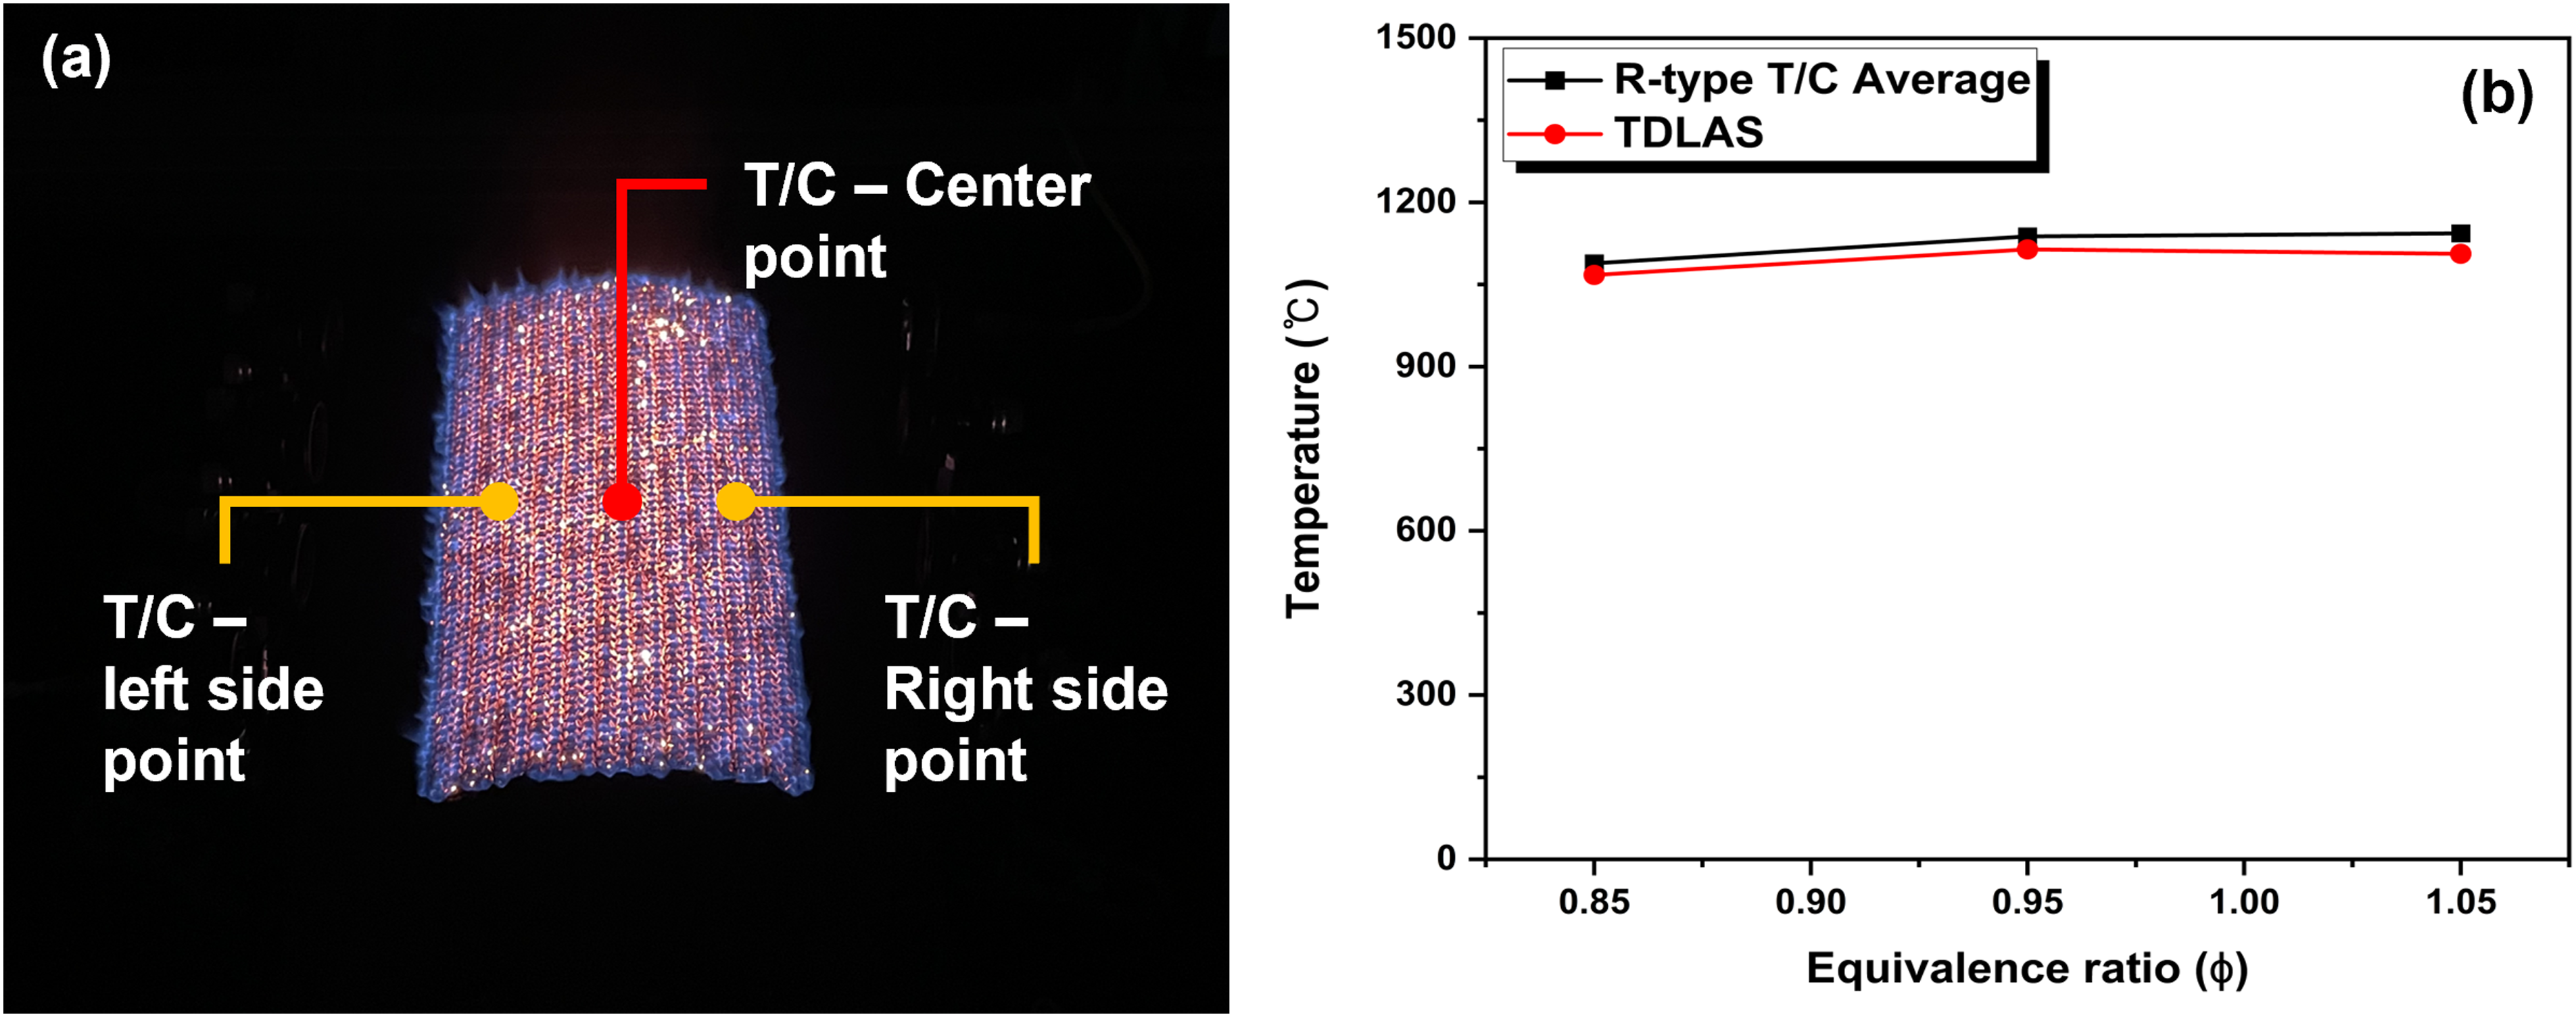
(a) Thermocouple temperature measurement locations, (b) Comparison of temperature measurement results between thermocouple and TDLAS.
Results of flame temperature measurements.
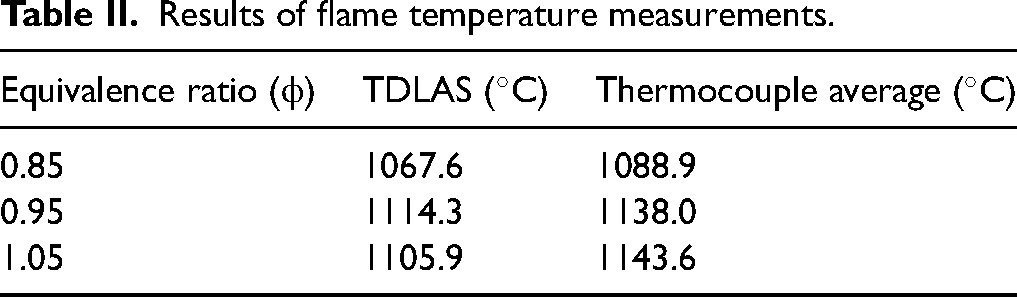
A comparison between thermocouple and TDLAS measurements showed that the maximum flame temperature occurred at an equivalence ratio of 0.95 for both techniques. Although similar trends were observed, a systematic discrepancy in absolute temperature values was present. This difference primarily arises from the line-of-sight, path-integrated nature of TDLAS, which yields a temperature averaged over both reactive and post-flame regions along the optical path. In contrast, thermocouple measurements reflect local temperatures within the flame region at the measurement height. To account for the distinct spatial distributions of absorbing species, different temperature descriptors were employed for OH and H2O quantification. Because OH radicals are confined to the thin reaction zone near the flame front, the local flame temperature obtained from thermocouple measurements at 5 mm above the burner was used for OH concentration calculations. In contrast, H2O contributes to absorption over an extended post-flame region along the optical path; therefore, the path-averaged temperature derived from DAS-based TDLAS measurements was used for H2O quantification. Despite differences in absolute values, the overall temperature trends obtained from both techniques were consistent, supporting the reliability of the combined diagnostic approach.
Results of DAS
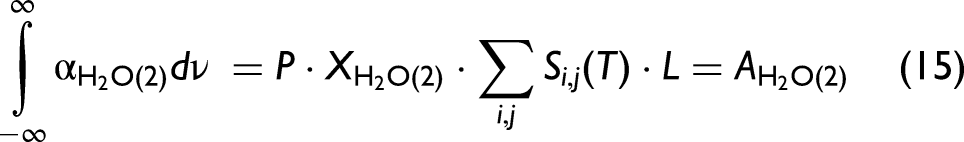
The OH radical concentration was determined using the DAS method after correcting for H2O interference, based on the measured flame temperature. The raw absorption signals simultaneously acquired from the two lasers are presented in Figure 5. Figure 5a displays the OH absorption spectrum, which contains overlapping contributions from H2O absorption. Figure 5b shows the H2O absorption signal, which was used both for flame temperature determination and for isolating the overlapping H2O(1) component from the OH absorption signal. To achieve this, a spectrally isolated H2O(2) absorption line was employed.
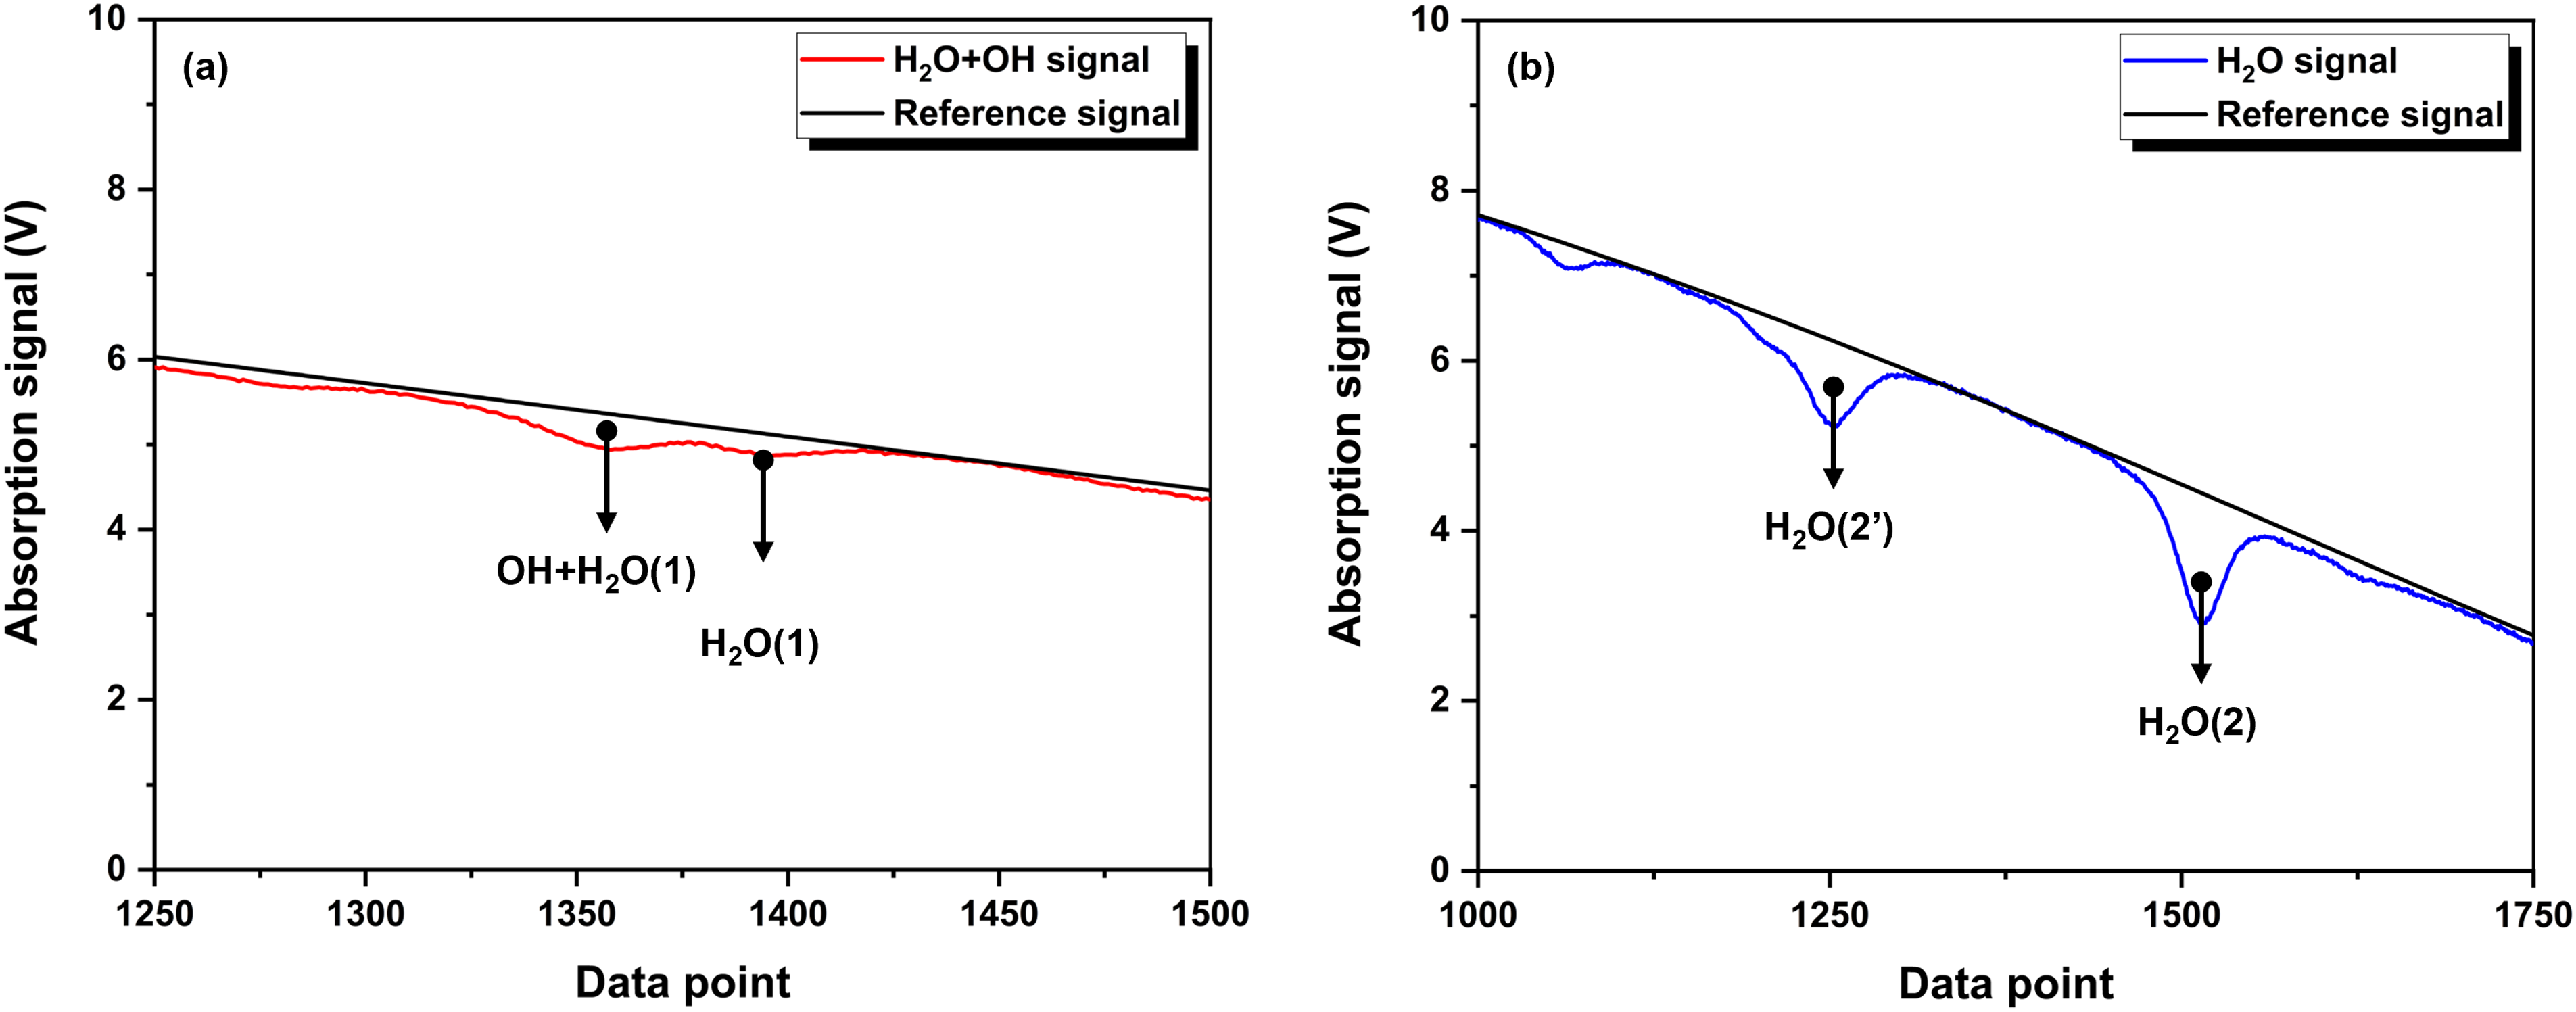
(a) OH absorption signal affected by H2O interference; (b) Isolated H2O absorption signal used for temperature measurement and correction.
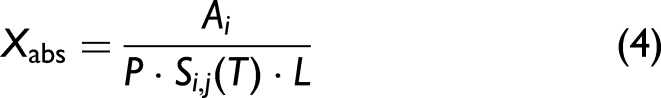
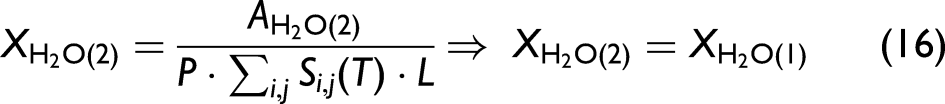
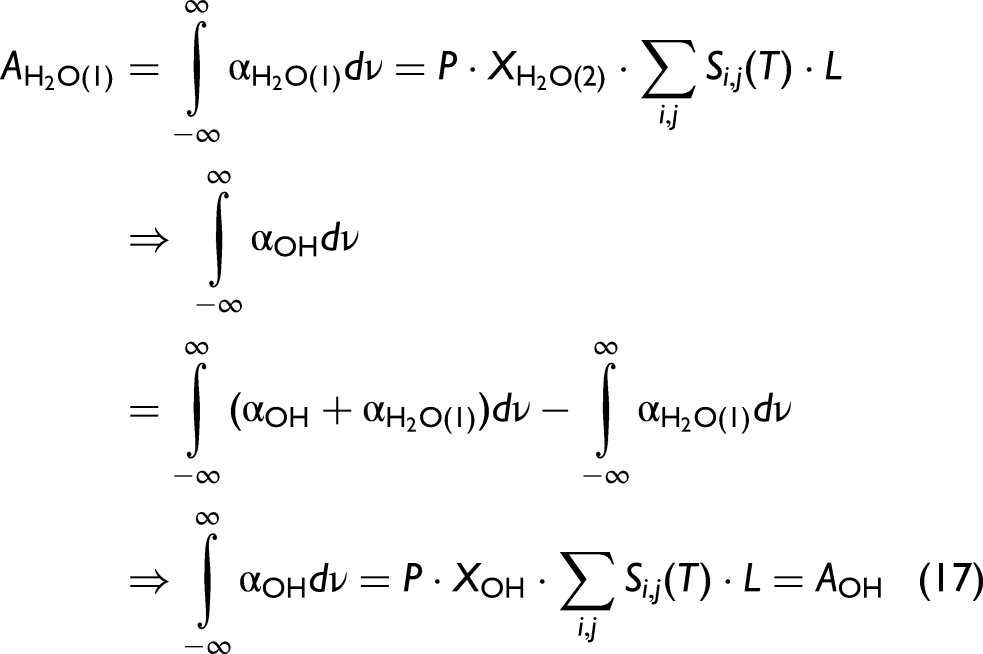
As illustrated in the experimental setup schematic (Figure 3), both lasers propagate through the same spatial and temporal region. Consequently, although the signal intensities of H2O(1) and H2O(2) differ due to variations in line strength, the measured H2O concentration is identical for both transitions. Taking advantage of this property, the H2O concentration was first derived from the absorption area of the H2O(2) line using Eqs. 15–16. The OH absorption signal, free from H2O interference, was subsequently obtained by subtracting the estimated H2O(1) contribution from the total OH + H2O absorption signal. Table III summarizes the DAS-derived H2O concentrations, the H2O(1) absorption area, the combined OH + H2O absorption area, and the isolated OH absorption area for each equivalence ratio condition.
Derivation of single OH radical absorbance by removing interference from H2O absorbance.
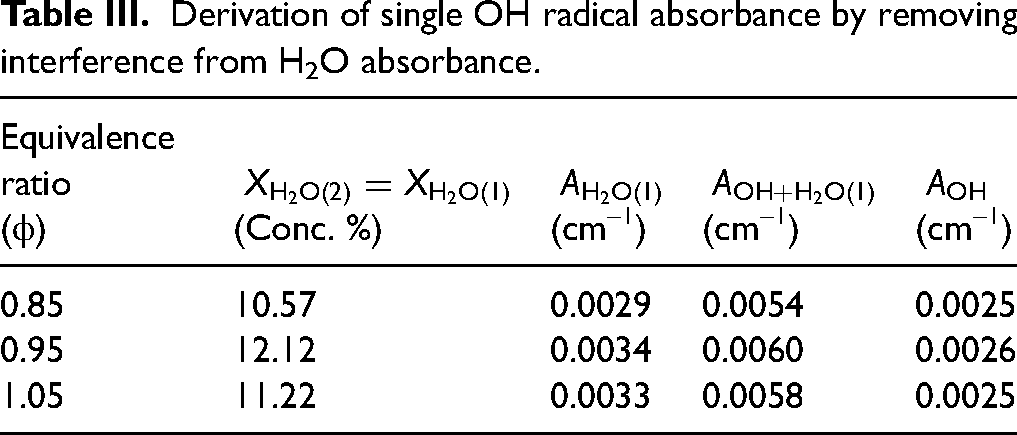
After subtracting the H2O absorption contribution, the net OH absorption area was extracted, from which the OH radical concentration was calculated. Numerical simulations were performed using CHEMKIN-PRO PREMIX, a one-dimensional laminar burner-stabilized flame model, with the GRI-3.0 reaction mechanism, which is suitable for CH4/air flame analysis.26,27 The OH radical concentrations predicted by the GRI 3.0 mechanism were obtained as a function of the equivalence ratio. In the combustion experiments, the light source transmitted through the surface of a metal fiber-type burner at a distance of 5 mm above the flame; therefore, the numerical predictions were compared with the OH radical concentrations measured at the corresponding 5 mm location in the flame. The H2O and OH concentrations measured by DAS were then compared with the CHEMKIN simulation results, as illustrated in Figure 6.
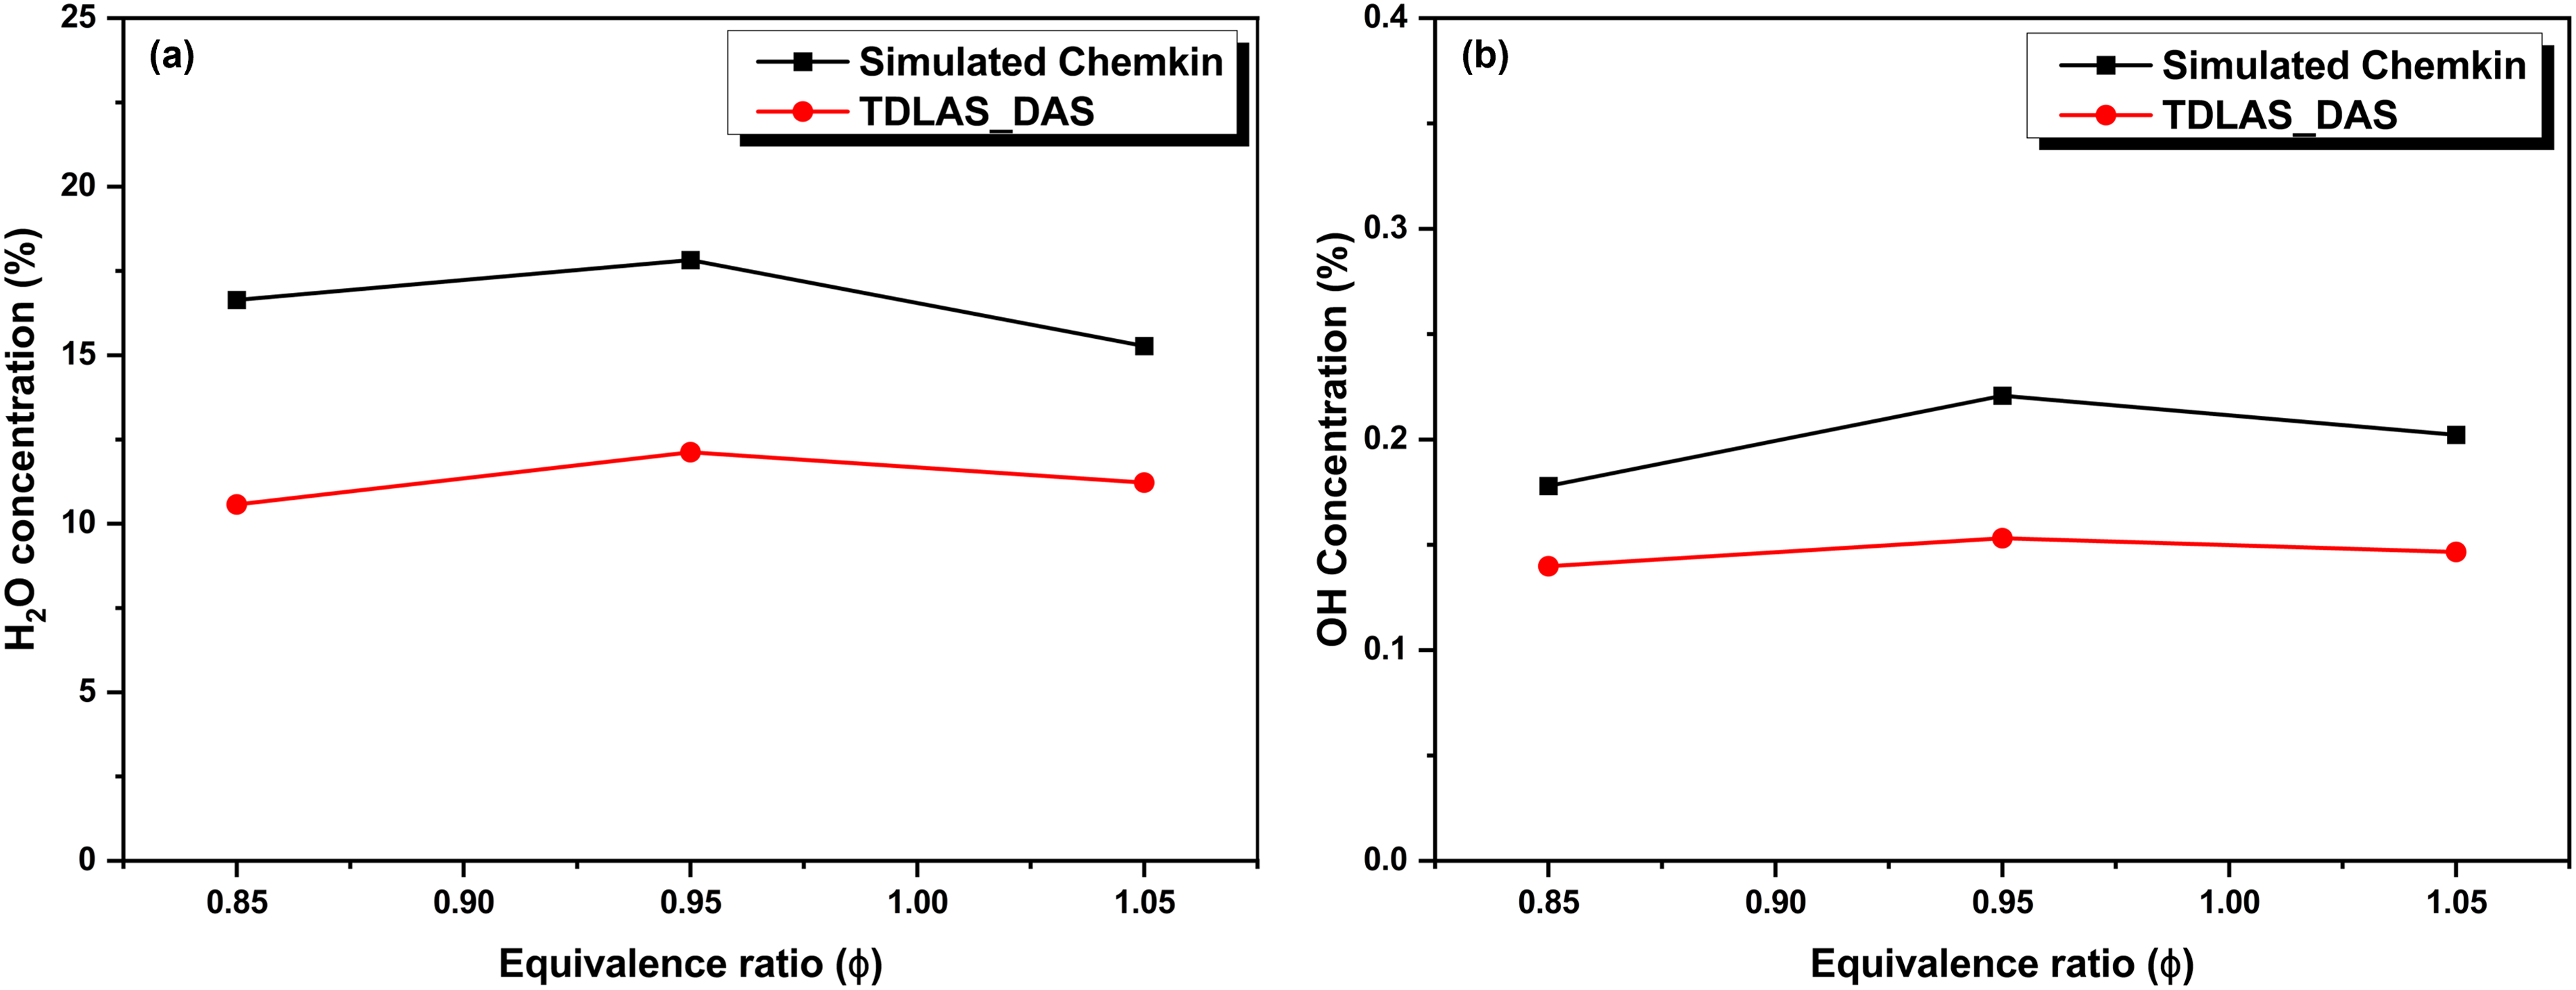
Concentration measurements by DAS compared with CHEMKIN simulations. (a) H2O and (b) OH radicals.
Figure 6a displays the measured H2O concentrations as a function of equivalence ratio, while Figure 6b presents the corresponding OH radical concentrations compared with CHEMKIN simulations. The H2O concentrations measured by TDLAS averaged approximately 11% and were generally lower than the corresponding CHEMKIN simulations, while showing qualitative agreement across the examined equivalence-ratio range. The discrepancy in H2O concentration can be attributed to the line-of-sight nature of TDLAS measurements, which average over both reactive and non-reactive regions. Simulations of the absorption path indicate that inclusion of non-reactive zones may lead to an underestimation of the H2O concentration by up to 2.78%. The peak H2O concentration was observed at an equivalence ratio of 0.95, in good agreement with the CHEMKIN simulations. Because no independent quantitative diagnostic for OH was available, absolute validation of the retrieved OH concentrations was not possible; therefore, the OH results were evaluated through comparison with CHEMKIN simulations. The lowest OH radical concentration was recorded under fuel-lean conditions (
Results of WMS
This section presents the quantitative analysis of OH radical concentrations using the WMS method under conditions of significant H2O interference. As illustrated in Figure 7, superimposing a high-frequency sinusoidal wave onto a low-frequency sawtooth waveform produces a composite second harmonic (2f) signal, which represents the combined contributions of the two absorption features. To eliminate background noise and signal drift, the second harmonic (2f) signal was normalized using the simultaneously acquired first harmonic (1f) signal prior to analysis.
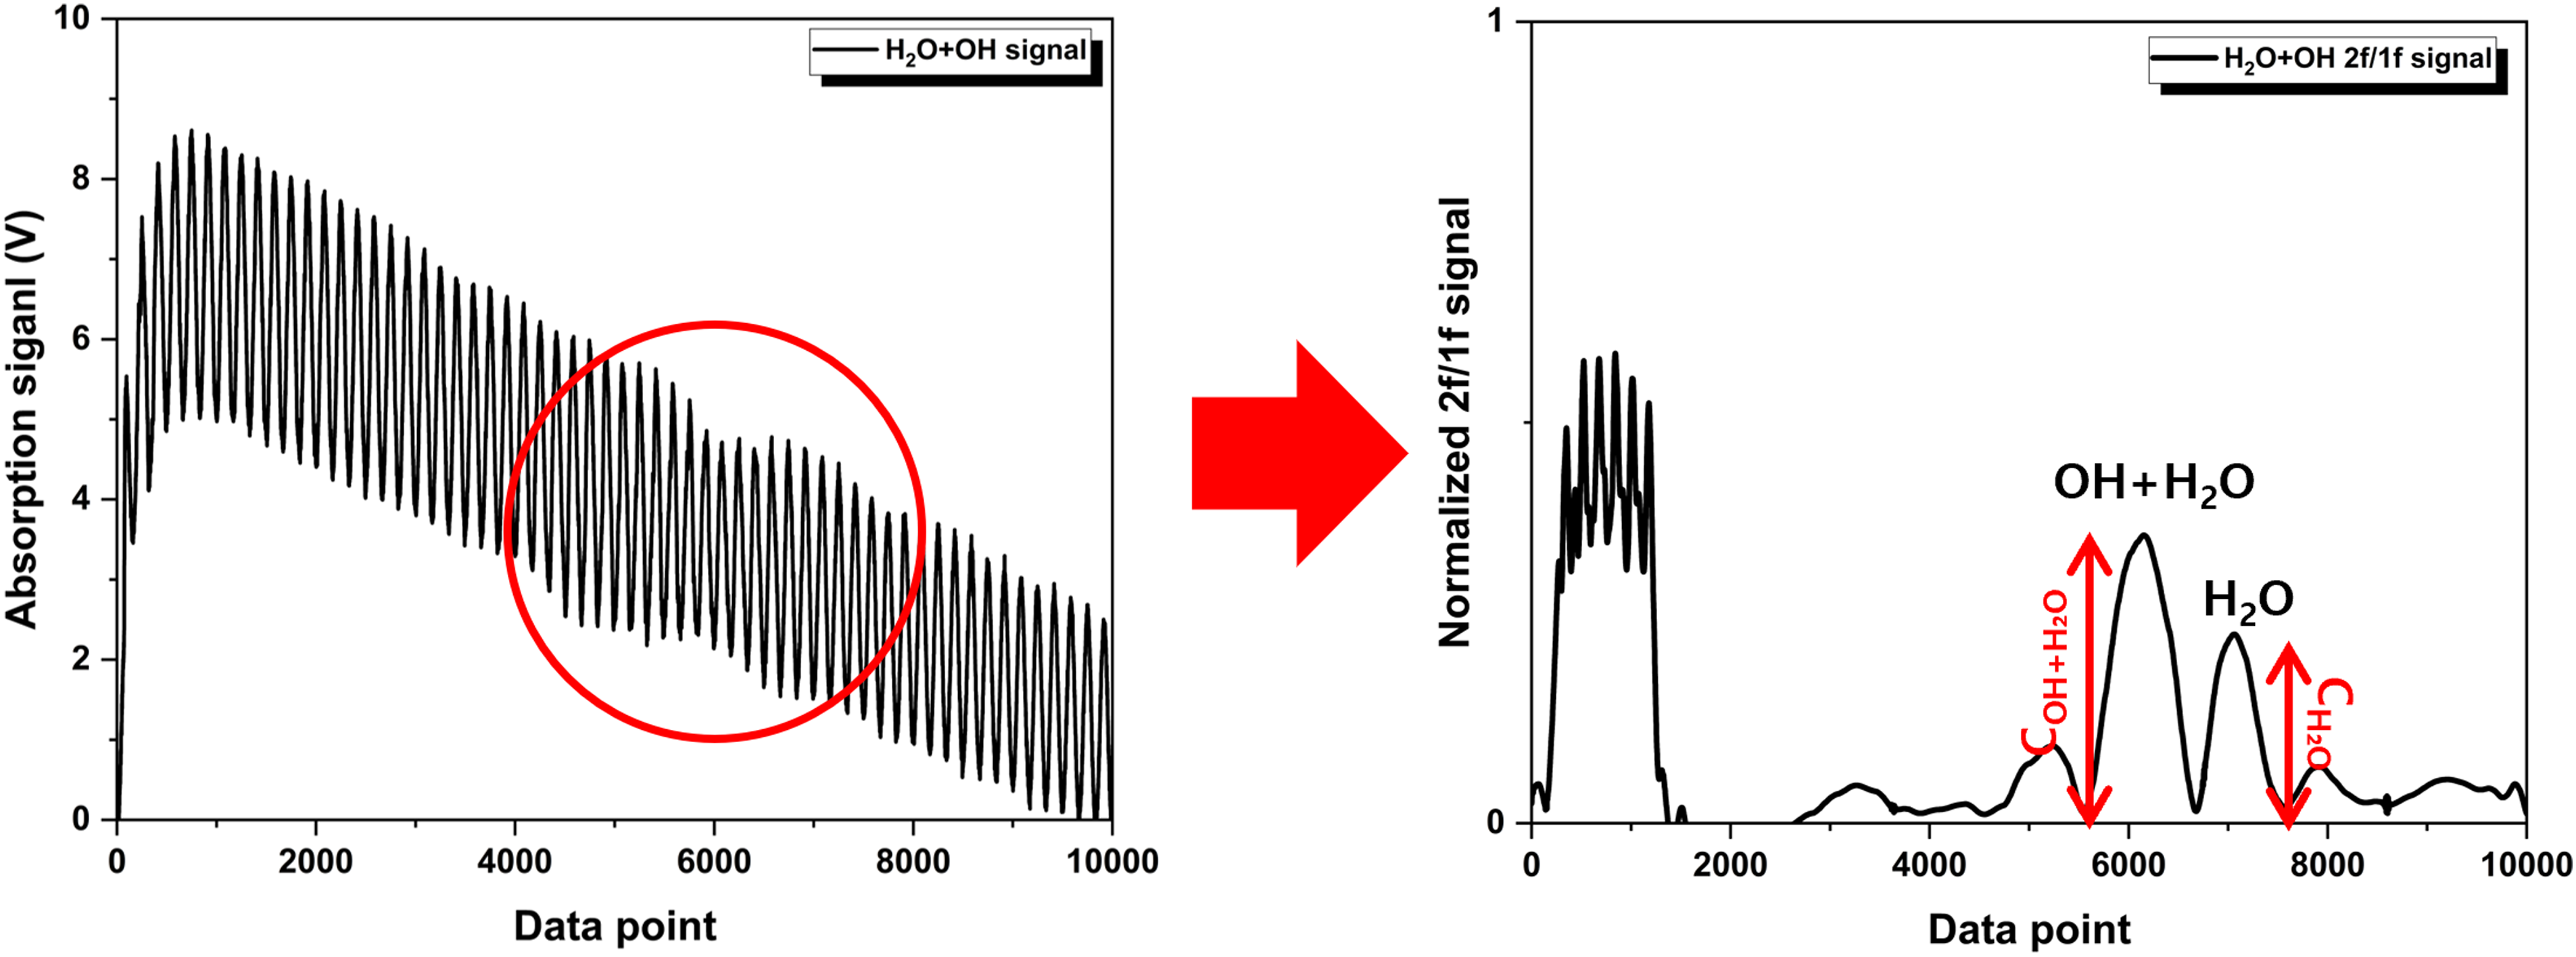
WMS signal of OH radicals with interference from H2O.
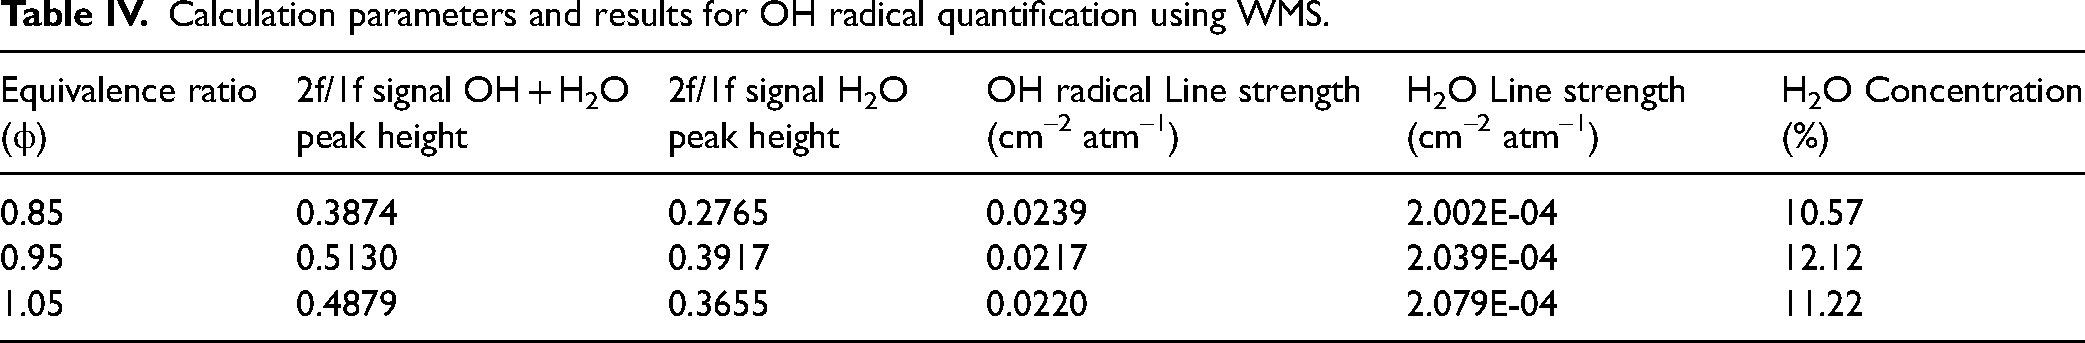
The peak values of the normalized 2f/1f signals for OH + H2O (
Calculation parameters and results for OH radical quantification using WMS.
Under conditions with H2O interference, OH concentrations were quantitatively determined using wavelength modulation spectroscopy (WMS). The results were compared with CHEMKIN simulation predictions and further evaluated against OH concentrations obtained using direct absorption spectroscopy (DAS). A summary of these results is provided in Figure 8 and Table V.
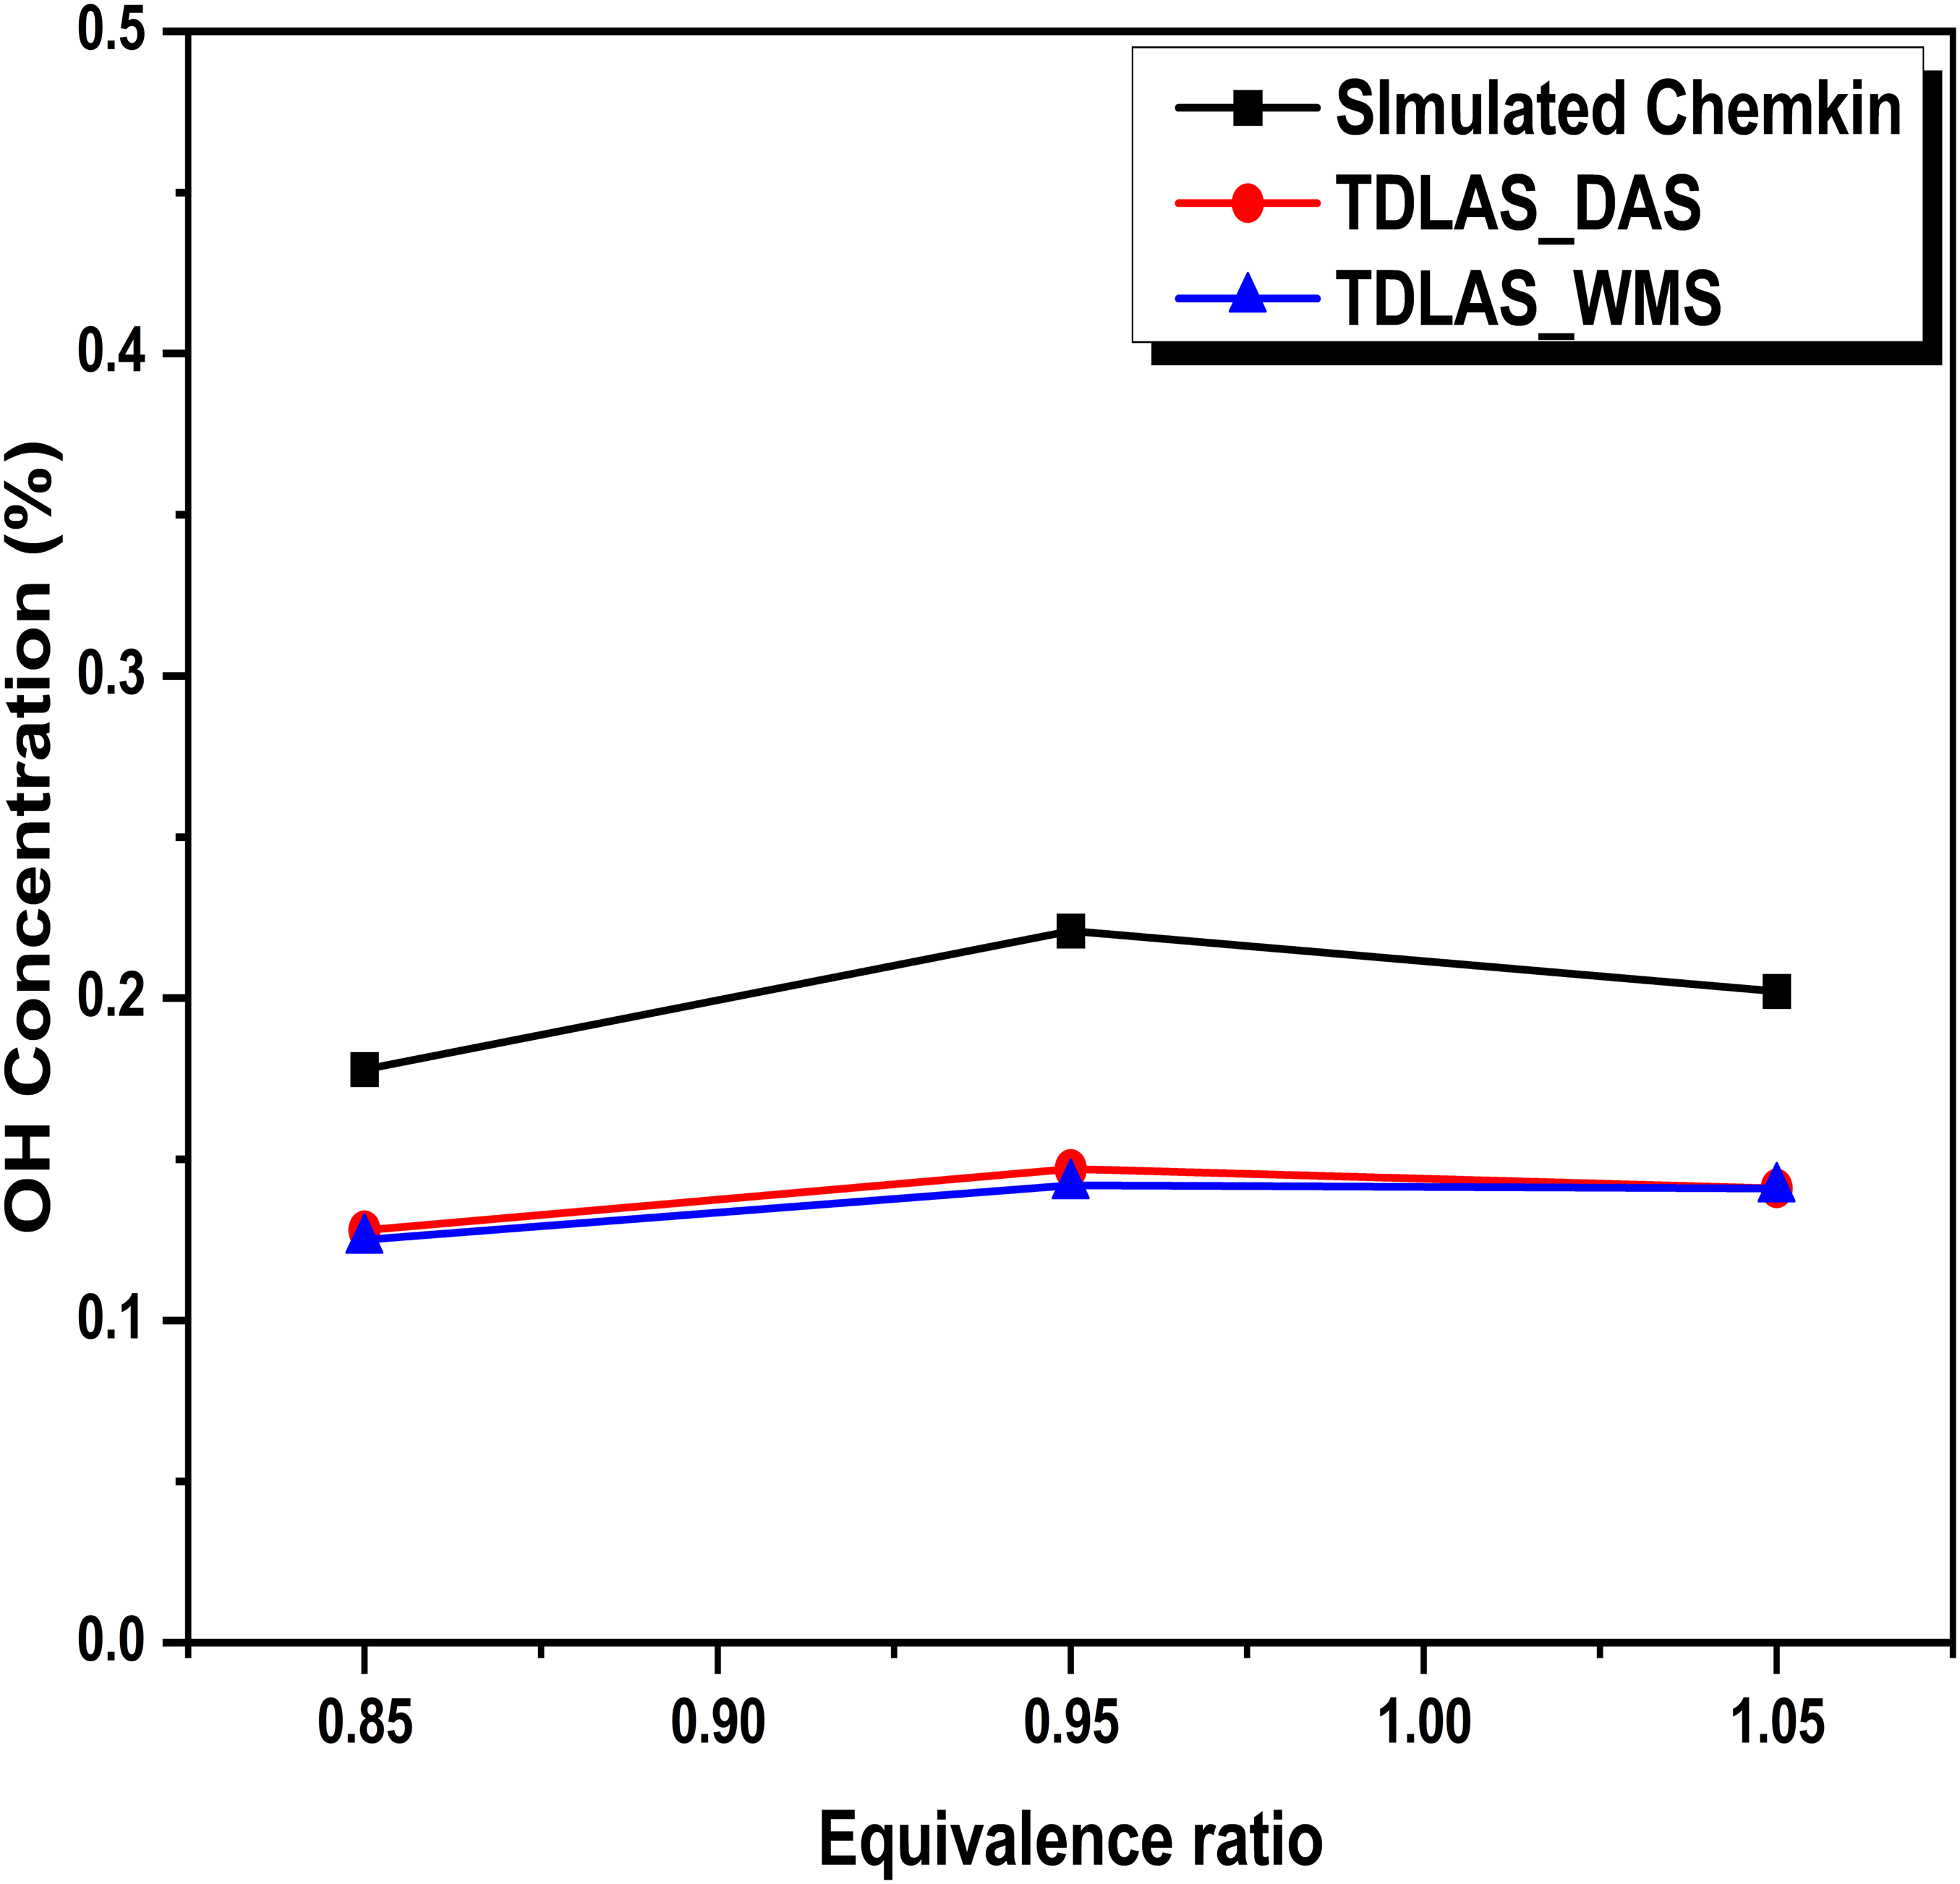
Comparison of OH concentration measurements obtained by DAS and WMS.
Comparison of OH concentrations obtained by DAS and WMS.
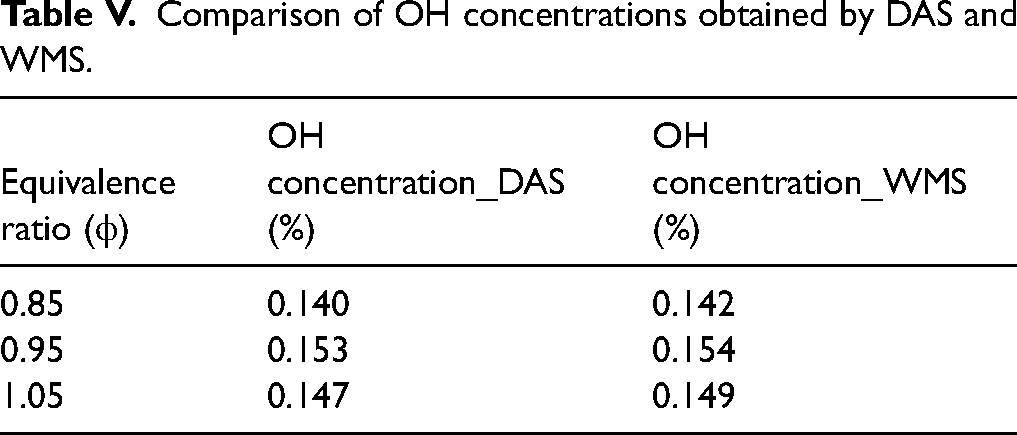
As stated in the objective of this study, the agreement between DAS and WMS results under the present conditions is not intended to demonstrate the superiority of WMS over DAS, but rather to validate the applicability of WMS for quantifying OH concentrations under conditions with H2O interference. Comparison of OH concentrations obtained using WMS and DAS showed overall similar behavior, with the lowest OH concentration observed under fuel-lean conditions (
Conclusion
This study introduced a dual-laser diagnostic methodology integrating direct absorption spectroscopy (DAS) and wavelength modulation spectroscopy (WMS) for quantifying OH concentrations in methane–air premixed flames. The approach demonstrated accuracy even in the presence of significant H2O interference. By implementing wavelength division multiplexing (WDM) in the near-infrared region, simultaneous measurements were conducted under identical spatial and temporal conditions. The DAS measurement at 1.39 μm provided both flame temperature and H2O concentration, which were necessary for correcting H2O interference, thereby enabling reliable estimation of OH concentrations (mole fraction) in the range of 0.12–0.15%. The WMS analysis, using 1f-normalized 2f signals, corroborated the OH concentrations measured by DAS.
Comparisons with CHEMKIN simulation results showed strong agreement in both spatial trends and equivalence ratio dependence, thereby confirming the accuracy and reliability of the proposed diagnostic method. Although absolute validation of OH concentrations was limited due to the lack of a calibration reference, the observed trends were consistent with the CHEMKIN simulations. While radiative heat loss is inherently present at the thermocouple junction, manufacturer-specific correction tables were not applied because their direct applicability to the present open flame environment cannot be assured. Comparison with DAS-derived path-averaged temperatures showed consistent equivalence-ratio trends with only a modest systematic offset. Owing to the line-of-sight weighted nature of absorption spectroscopy and the strong localization of OH in the high-temperature reaction zone, the resulting temperature bias has only a limited impact on the derived OH and H2O concentrations. Therefore, the main conclusions of this work are robust in terms of relative trends and DAS–WMS consistency.
Moreover, the DAS and WMS measurements exhibited strong mutual agreement. These findings confirm the robustness of the proposed method and its applicability for real-time monitoring of reactive species in practical combustion systems, such as industrial burners and engines operating under variable fuel and flow conditions. Future work will focus on developing in-situ calibration methodologies to enable accurate absolute quantification of OH radicals under realistic combustion conditions.
Footnotes
Consent for Publication
All authors have read and approved the final version of the manuscript and consent to its publication.
CRediT Author Statement
Jiyeon Park: Conceptualization, Methodology, Investigation, Data curation, Formal analysis, Writing – original draft. Aran Song: Investigation, Formal analysis, Validation. Changkook Ryu: Supervision, Writing – review and editing. Daehae Kim: Methodology, Resources, Validation Miyeon Yoo: Methodology, Resources, Validation Changyeop Lee: Conceptualization, Methodology, Supervision, Project administration, Writing – review and editing.
Funding
This work was supported by the Technology Innovation Program (Development and demonstration of 2 ton/hr industrial hydrogen boiler, 20023380) funded By the Ministry of Trade, Industry & Energy (MOTIE, Korea).
Declaration of Conflicting Interests
The author(s) declared no potential conflicts of interest with respect to the research, authorship, and/or publication of this article.