
Abstract
The Canterbury Earthquakes struck the Canterbury region of the South Island of New Zealand between September 2010 and February 2011. The Earthquakes resulted in widespread structural damage to Christchurch, the main city of the region, and greatly impacted other aspects of society including crime. In this study, we adopt an exploratory approach to investigate the impact that these earthquakes have had on the temporal and spatial patterning of four types of crime in Christchurch: assault, domestic violence, burglary and arson. Overall crime has decreased in post-quake Christchurch with the notable exception of domestic violence. We found remarkably similar temporal signatures of crime for all crime types occurring across both the pre- and post-earthquake periods. Spatially, crime has increased in the majority of neighbourhoods in Christchurch post-quake despite overall crime levels being down. Explanations for this paradoxical and other finding are outlined in the context of a rebuilding and recovering city.
Introduction
A large and growing number of studies have investigated the relationship between the occurrence of natural disasters and crime. The results across this broad swathe of literature covering numerous disasters are mixed with some studies finding an increase in crime post-disaster (see Gray & Wilson, 1984; LeBeau, 2002; Leitner & Helbich, 2011; Siman, 1977; Walker, Sim, & Keys-Mathews, 2014; Zhou, 1997), whilst others indicate an associated decrease (see Barsky, Trainor, & Torres, 2006; Cromwell, Dunham, Akers, & Lanza-Kaduce, 1995; Leitner, Barnett, Kent, & Barnett, 2011; Watanabe & Tamura, 1995; Zahran, Shelley, Peek, & Brody, 2009). In terms of property crime, Zhou (1997) found the annual property crime rate in Tangshan, China to increase in the year following the Tangshan Earthquake of 1976. In Charlotte, North Carolina, LeBeau (2002) noted an increase in the number of police callouts relating to suspected burglaries after Hurricane Hugo in 1989 whilst flooding in Wilkes-Barre, Pennsylvania, resulting from Hurricane Agnes in 1972 was also found to be associated with a rise in reported property crime (see Gray & Wilson, 1984; Siman, 1977). Other studies, incorporating a spatial component, have also found increases in property crime post-disaster. For example, Leitner and Helbich (2011) noted a tripling of burglary offences in Houston, Texas following the week of Hurricane Rita’s landfall as well as an increase in hotspots of burglary. These hotspots were also found to be in locations away from their ‘usual’ locations. An increase in clusters of property crime in non-typical locations were also found following Hurricane Wilma, in Miami (for burglary and larceny-theft) (Walker et al., 2014), and Hurricane Ivan in Mobile, Alabama (for burglary, larceny-theft and auto theft) (Walker, Sim, & Keys-Mathews, 2012). Some studies have however found decreasing property crime rates following a disaster. Barsky et al. (2006) noted a decrease in burglary and theft offences in New Orleans following Hurricane Katrina whilst Leitner et al. (2011) also observed falling property crime rates across 11 counties of Louisiana after the same event. Other studies noting a decrease in property crime post-disaster include Cromwell et al. (1995), Watanabe and Tamura (1995) and Zahran et al. (2009). Reasons for the mixed results on the impact of natural disasters on property crime are myriad and are seen to be related to the underlying socio-economic conditions of each geographic locale (Harper & Frailing, 2012), inter- and intra-migration patterns (Varano, Schafer, Cancino, Decker, & Greene, 2010), as well as the severity of the disaster itself (Prelog, 2016).
Interestingly, studies examining the impact of natural disasters on violent crime have been less forthcoming. Research that has been undertaken has generally shown a decrease or relative stability in violence post-disaster (see Cromwell et al., 1995; Lee, 2010; Leitner & Helbich, 2011; Watanabe & Tamura, 1995). One notable type of violent crime that has received some attention is domestic violence. Zahran et al. (2009) found a positive relationship between domestic violence and the frequency of hurricanes in Florida between 1992 and 2005; a finding supported by a number of single incidence studies (see Enarson, 1999; Fothergill, 1996; Morrow, 1997). In the aftermath of the Mount Saint Helens ash fall event, Adams and Adams (1984) identified a 46% increase in domestic violence offences in Othello, Washington whilst LeBeau (2002) highlighted a rise in police callouts for domestic disputes after Hurricane Hugo in Charlotte, North Carolina in 1989. Explanations for the reported increase in domestic violence post-disaster are thought to be related to individual level stressors experienced by residents in a post-disaster setting boiling over into violent domestic confrontations (Adams & Adams, 1984), as well as increased cohabitation between domestic partners post-disaster (LeBeau, 2002; Zahran et al., 2009).
This research adds to this literature by investigating the effect the Canterbury Earthquake sequence had on the temporal and spatial patterning of crime in Christchurch, New Zealand. We are particularly interested in examining the effects of the earthquake on the timing of crime at various temporal resolutions as well as in identifying the spatial concentration of crime post-quake and how they vary based on underlying socio-demographics. The rest of our paper proceeds accordingly. We first provide a brief review of the Canterbury Earthquake sequence and examine its social and physical effects; we then provide a theoretical framework which guides our research and hypotheses before our methods are outlined and our results are provided and discussed.
The Canterbury Earthquakes
The Canterbury Earthquakes comprised a series of large seismic events that struck the Canterbury Region of the South Island of New Zealand between September 2010 and February 2011. The two most significant events were the first earthquake of the sequence, a moment magnitude (Mw) 7.1 earthquake that struck on the 4 September 2010 (Darfield Earthquake), and a Mw 6.2 earthquake that struck on the 22 February 2011 (Christchurch Earthquake). Whilst the Christchurch Earthquake was notably smaller in magnitude than the Darfield event, it was responsible for a greater amount of damage as a result of the higher peak ground acceleration observed during the latter event (Bannister & Gledhill, 2012). 1
The effects of the Canterbury Earthquakes on the Canterbury Region were significant. From a physical perspective, the lateral and vertical movement of the Canterbury Earthquake resulted in significant building damage throughout the Canterbury Region. Damage varied considerably from the superficial cracking of paint, to extreme structural damage, and in rare cases, the collapse of buildings. Just over 150,000 homes were damaged, with about one-fifth of those exceeding NZ$100,000 in damage (Parker & Steenkamp, 2012). Since February 2011, Christchurch has been in a constant and ever-changing state of rebuild and recovery. Over 1200 buildings have been demolished, mostly in the central business district (CBD) and in a region of Christchurch known as the Residential Red Zone (Canterbury Earthquake Recovery Authority (CERA), 2015). This is a non-continuous zone of land defined throughout residential areas in Christchurch where earthquake damage was most severe, and where a substantial numbers of properties were deemed unsafe for future habitation. The New Zealand Treasury estimates the total repair and rebuild costs of the Canterbury Earthquake sequence to be roughly NZ$40 billion, or approximately 20% of New Zealand’s Gross Domestic Product (GDP) (New Zealand Treasury, 2014).
From a social perspective, the earthquakes resulted in 185 fatalities and between 1500 and 2000 injuries, mostly caused by falling debris and actions during shaking (such as tripping whilst running). It was the country’s second deadliest ever natural disaster. In the immediate aftermath of the Canterbury Earthquake sequence, an estimated 55,000 residents fled the city (Nissen & Potter, 2011). Intra-city movement also took place as residents whose homes had been severely damaged were forced to stay with friends and family, or move to other temporary accommodation in the city. In the longer term, the population exodus from Christchurch has continued, driven largely by dissatisfaction over post-earthquake living conditions, fear of further earthquake events, and demolition work on residences. The population of Christchurch has decreased by 2% compared to pre-earthquake levels which contrasts starkly with the national population levels which have increased by over 5% over the same time period (Newell, Beaven, & Johnston, 2012).
The Canterbury Earthquakes also had a substantial impact on the mental and physical health and wellbeing of residents. Increased stress, anxiety and depression have all been observed in residents (see Gawith, 2013; Osman, Hornblow, Macleod, & Coope, 2012; Renouf, 2012; Sullivan & Wong, 2011) with females, the elderly and families married with children the most susceptible (see Osman et al., 2012). Other social effects related to education (Newell et al., 2012); community cohesiveness (Osborne & Sibley, 2013; Thornley, Ball, Signal, Lawson-Te Aho, & Rawson, 2013) and Maori and other populations (Osman et al., 2012) have also been noted by researchers but are not discussed in greater detail here.
Crime was largely reported to have increased in the period immediately after the Canterbury Earthquake (see Anderson, 2013; Gates, 2012). Driven mainly by the media, incidences of burglary and arson in particular were reported to have ‘spiked’ in the city post-earthquake with Christchurch even labelled ‘Arson City’ by one media outlet amid an apparent targeting of damaged and abandoned homes in the Residential Red Zone (Dally, 2013; Heather & Lynch, 2012; Young, 2014). These anecdotal reports are in contrast with official crime statistics released by New Zealand Police which indicated a decrease in most offence categories post-earthquake with the notable exception of domestic violence (New Zealand Police, 2015).
Theoretical framework
Two theories housed within the school of environmental criminology have been commonly employed to understand crime in the aftermath of a natural disaster. They are the social disorganisation theory of Shaw and McKay (1942); and the routine activity theory of Cohen and Felson (1979). The former theory was formed on the notion that social control or lack thereof, influences the development of crime and delinquency. Observing a persistence of delinquency in certain neighbourhoods over long periods of time, Shaw and McKay argued that specific structural elements within a community led to social disorganisation, and influenced crime propensity. The original focus of the theory was on three macro-level barriers thought to limit community cohesion and inhibit the ability of neighbours to share and realise common values: low socioeconomic status, high residential mobility and high ethnic heterogeneity. Adding to the theory, Sampson and Groves (1989) later suggested that the various community-level structural factors identified by Shaw and McKay as increasing social disorganisation in neighbourhoods (i.e. economic deprivation, racial heterogeneity, residential mobility and family disruption) are mediated by informal social control; loosely defined as the willingness of neighbourhood residents to intervene in local problems (Sampson & Raudenbusch, 1999).
Whilst a number of researchers have used the social disorganisation theory to explain variations in crime post-disaster, they generally differ in their interpretations of how communities may react in the face of adversity and how this may impact crime rates. On the one hand, researchers maintain that the general decrease in crime in the immediate aftermath of a natural disaster can be attributable to the devastation of an event acting as a catalyst to enhance the level of cohesion in a community thereby increasing their ability to effect and maintain social control (Leitner et al., 2011; Miller, 2007; Munasinghe, 2007; Quarantelli, 1994; Zahran et al., 2009). Other researchers however note that if increased community cohesion does occur post-disaster it is short-lived (see Leitner et al., 2011) and will weaken considerably over time due to medium-to-long term psycho-social stressors (Quarantelli, 1994; Siegel, Bourque, & Shoaf, 1999; Varano et al., 2010). The overall consensus of criminologists using social disorganisation theory in a disaster research is that natural disasters such an earthquake will increase the likelihood and occurrence of criminal behaviour.
The routine activity theory was developed by Lawrence Cohen and Marcus Felson in the 1970s and relates the occurrence of crime to how a population’s routine activities control the convergence in space and time of three essential components: a motivated offender, a suitable target and the absence of a capable guardian. Whilst exhaustively tested and applied in the criminological literature, the use of this theory in explaining the natural disaster-crime linkage is in its infancy. Research that has been forthcoming examines how a natural disaster is likely to impact on each of the three central tenets of the theory (see Cromwell et al., 1995; LeBeau, 2002; Lee, 2010; Leitner et al., 2011). Featuring most prominently among these discussions is the impact of a natural disaster on guardianship. On the one hand, disasters are seen as a mechanism which reduces, or completely removes the presence of formal guardianship (see Cromwell et al., 1995; LeBeau, 2002). For example, the presence and ability of law enforcement officers to affect control may diminish after a disaster as these agencies are often required to provide emergency relief and aid to those most adversely affected by the event. The loss of, or damage to, telecommunications and/or physical impediments (such as roads, bridges) post-disaster also reduces the ability of more formal guardians to provide oversight and maintain effective control. According to routine activities theory, this removal of formal guardianship presents would-be offenders with increased opportunities for crime and may result in greater crime occurring. Researchers also note that a disaster could impact the level of informal guardianship present in post-disaster communities leading to either an increase or decrease in offending depending on the crime and context (Cromwell et al., 1995; Zahran et al., 2009). For example, out-migration in certain neighbourhoods post-disaster could result in some houses and businesses being unattended leading to an increase in property crimes due to a lack of homeowners present. Violent interpersonal crimes such as domestic violence might, however, rise post-disaster as increased cohabitation could lead to an increase in the number of witnesses (informal guardians) to domestic violence offending, leading to a higher number of reports (LeBeau, 2002; Zahran et al., 2009).
Further debate revolves around the impact of a natural disaster on the availability of motivated offenders. Barsky et al. (2006) for example suggests that persons may be driven to commit property offences such as the theft out of need in the event of a shortage of essential supplies following a disaster whilst others suspect that an increase in opportunities for crime post-disaster may result in an increase in more motivated offenders committing more selfish offences (Cromwell et al., 1995; Davila, Marquart, & Mullings, 2005). Likewise, the attractiveness, opportunity and accessibility of suitable targets are all likely to be significantly affected following a natural disaster. In terms of property crime, some properties may be uninhabited increasing its attractiveness for offenders, although this could be offset by potential damage experienced by the property. The interplay between these three aspects of target suitability (as outlined by Bernasco & Luykx, 2003), will be greatly affected and result in an increase or decrease in property crime in cities most likely stratified spatially by other endogenous neighbourhood-level factors such as deprivation, income and ethnicity.
The current study
The current study examines the impact that the Canterbury Earthquakes have had on the temporal and spatial patterning of crime in Christchurch. We extend the extant literature on this topic in a number of ways. First, we examine how crime temporally changes and spatially concentrates in a city post-disaster and identify what socio-demographic factors are associated with neighbourhoods that experience increased spatial concentrations of crime. Second, we explore the effect of a natural disaster on crime in a new context and geographic locale. Previous examination of this relationship has been almost exclusively done in the United States and Asia and/or in high crime locales. Third, we examine the impact of the Canterbury Earthquakes on four distinct types of crimes both individually and collectively: assault, domestic violence, burglary and arson. To our knowledge, this is the first empirical attempt to examine the effect of a natural disaster on arson rates specifically. Fourth, we investigate the effect of an earthquake on spatio-temporal crime patterns. Most prior research has concentrated on the effects of hurricanes and tsunamis on crime rates.
Based on the criminological literature, two hypotheses are tested regarding the temporal and spatial patterning of crime in Christchurch post-quake. The first hypothesis states that crime will increase in Christchurch post-quake and will be spatially concentrated in more socially disorganised neighbourhoods. The disorganising effect of a natural disaster is more likely to be felt in areas that are already susceptible to crime according to social disorganisation theory. Those who experience natural disasters encounter financial, residential, emotional and community-wide stressors that threaten the efficacy of a community already strained by current neighbourhood level conditions. The second hypothesis asserts that the temporal patterning of crime will change post-quake as individuals’ routine activities are greatly affected following a natural disaster. Central nodes of activity such as the school, home and work can close temporarily or permanently in the aftermath of a natural disaster which can severely impact an individual’s routine behaviour and increase opportunities for crime and victimisation, particularly among the youth (see Cromwell et al., 1995; LeBeau, 2002). Both hypotheses are tested using four types of crime in order to determine whether there is any variability in results by crime category.
Data
Crime data for this study was obtained from New Zealand Police’s record of reported crime. Reported offences within Christchurch from 1 July 2008 to 30 June 2013 (five years) were obtained. Each offence contained a location (easting, northing), an estimated time of the offence as well as a description and classification. Four offence types were extracted from the data: assault, domestic violence, burglary and arson. These categories were defined based on the Australian and New Zealand Standard Offence Classification (ANZSOC) (2011) description. The five year study period was broken down into a pre-earthquake period consisting of two years (1 July 2008–30 June 2010) and a post-earthquake period also consisting of two years (1 July 2011–20 June 2013). The one year interim period was excluded in the analysis since this period covered the two major earthquake events in the sequence, separated by five months (i.e. September 2010 and February 2011). A total of 37,087 offences were reported to the Police across these two periods (pre-earthquake = 20,423; post-earthquake = 16,664). For each period, the crime data was aggregated to the census areal unit (CAU) level and a mean annual crime rate per 10,000 population calculated. A CAU is the second smallest unit of dissemination of census data in New Zealand, with each CAU representing approximately 2300 people. There were 116 CAUs covering the spatial extent of Christchurch.
A total of 10 neighbourhood level variables were used to examine the underlying factors associated with crime variability in post-earthquake Christchurch. All variables were informed by the social disorganisation theory and calculated at the CAU level of aggregation. We used three measures to operationalise socio-economic deprivation. First was NZDep which is a score calculated as a means of describing the deprivation within an administrative area. The score combines nine variables from the New Zealand census which reflect eight dimensions of deprivation including access to transport and communication services, home characteristics and education (see Atkinson, Salmond, & Crampton, 2014) – the higher the score the higher the deprivation. The NZDep has been a frequent inclusion in past research of crime distribution in New Zealand (Breetzke, Pearson, & Conradson, 2013; Day, Breetzke, Kingham, & Campbell, 2012). We also included the percentage of working age persons that are unemployed, and the median household income.
Ethnic heterogeneity is thought to inhibit community connections and reduce the ability of communities to realise shared values (Sampson & Groves, 1989; Shaw & McKay, 1942). Hipp (2007) suggests that high ethnic heterogeneity promotes crime because of unequal opportunities afforded to different ethnic groups particularly those living in the same neighbourhood. Three measures of ethnic heterogeneity were used: first, a diversity index (DI) (see Meyer & McIntosh, 1992) was calculated to provide a measure of racial and ethnic diversity within a CAU. The DI measures the probability that any two people chosen at random from a given CAU are of different races or ethnicities; and is measured on a scale of 0 to 100, with 0 indicating that a CAU is totally homogeneous and 100 stating a CAU is totally heterogeneous. The greater the DI score, the greater the probability of randomly selecting two people with different characteristics. The DI is frequently been employed in population studies (see Johnson & Lichter, 2010; Tam & Bassett Jr, 2004) and is calculated as:

Second, a more simplistic measure of heterogeneity was calculated as the percentage of foreign born residents living in a CAU. A third, and final measure was an index of concentration at the extremes (ICE) (Massey, 2001) which measures income inequality within neighbourhoods. The ICE is calculated using the following formula:

Increased residential mobility is thought to lessen attachment within communities, thus preventing social and community bonds from forming (Sampson & Groves, 1989). Previous research both locally and internationally has generally supported the association between higher residential mobility and greater criminal offending (Breetzke & Pearson, 2013; Breetzke et al., 2013; Walker et al., 2012). In our work, residential mobility was as the first, percentage of residents who had lived at that neighbourhood for less than one year and second, percentage of residents who had lived at that neighbourhood for less than five years. Both measures were included to gauge the possible effects of short-to-medium term mobility on crime post-disaster.
As previously discussed a natural disaster may lead to the destabilisation of communities (see Leitner & Helbich, 2011; Varano et al., 2010) or lead to an increase in the development of social and community bonds promoting collective efficacy (see Davila et al., 2005; Siegel et al., 1999). In this work, collective efficacy was operationalised using two measures: the percentage of persons caring for children, the unwell and/or disabled persons outside of their own household unpaid, as well as the percentage of persons engaged in volunteering activities.
It is important to note that the calculation of these variables as well as the crime rates was done using sub-national population estimates calculated by Statistics New Zealand as the denominator rather than population data derived from the census alone. There was considerable out- and intra-migration of residents in Christchurch following the earthquake which was difficult to monitor and resulted in much uncertainty regarding population numbers. To address this Statistics New Zealand combined official census data with other available data (such as international travel documents and building consents) to produce three monthly population estimates at various levels of aggregation (Statistics New Zealand, 2011). These estimates were used where applicable to calculate certain variables. In general, population estimates remain consistently higher than the New Zealand census figures, taking into account the three month difference in observation, and census non-respondents.
Method
Both temporal and spatial analyses were undertaken in this study. In terms of the former, we first identify how the temporal patterning of crime changed before and after the Canterbury Earthquakes. We did this by initially generating a longitudinal plot of monthly crime rates for all crime types across the entire study period (1 July 2008 to 30 June 2013 (five years)) in order to observe fluctuations in crime at a broader temporal resolution. Next, we plot daily crime rates for the 28 days either side of the two major earthquake events in order to identify the immediate effects of these events on short-term temporal crime patterns. Finally, daily and hourly radar plots were created for each offence type for both study periods (pre- and post-quake) in order to compare the temporal characteristics of crime. As previously mentioned, the pre-earthquake period was from 1 July 2008 to 30 June 2010 (two years) and a post-earthquake period was from 1 July 2011 to 20 June 2013 (two years). The idea here is to examine the impacts of the Canterbury Earthquakes on crime at increasingly finer level of temporal resolution.
From a spatial perspective, we examined the spatial concentrations of crime in the city post-earthquake. We did this by categorising each neighbourhood in Christchurch as either experiencing an increase in crime post-earthquake (1) or not (0) per crime type. This was done as follows:
For each CAU every month in year 1 and 2 (pre-earthquake) was paired and the pre-earthquake month-on-month differences calculated for the number of crimes for each pair. The 75th percentile for these pre-quake month-on-month difference measures was then calculated for each CAU. Similarly, for each CAU every month in year 4 and 5 (post-earthquake) was paired and the post-earthquake month-on-month differences calculated for the number of crimes for each pair. The mean of the post-earthquake month-on-month difference was then calculated for each CAU. This mean post-earthquake value was then compared to the 75th percentile of the month-on-month difference pre-earthquake (point 3) and if the mean value was higher than the 75th percentile value pre-earthquake, the CAU was assigned a value of 1 (i.e. a post-earthquake increase in crime). If the mean value was lower than the 75th percentile value, the CAU was assigned a value of 0 (i.e. no post-earthquake increase in crime).
Importantly, this method takes into account historical crime trends occurring in CAUs in Christchurch as well as any monthly and seasonal changes pre- and post-earthquake. Alternative methods were considered in order to categorise neighbourhoods as experiencing an increase in crime post-earthquake (1) or not (0) but the crime data available to us was too sparse to conduct any form of time-series and/or trajectory analysis with any degree of statistical certainty, despite numerous attempts. Finally, mean differences in the neighbourhood-level variables across CAUs stratified by multiple crime increases were calculated and a MANOVA was performed on the data to test whether the differences in these variables between the groups were statistically significant.
Results
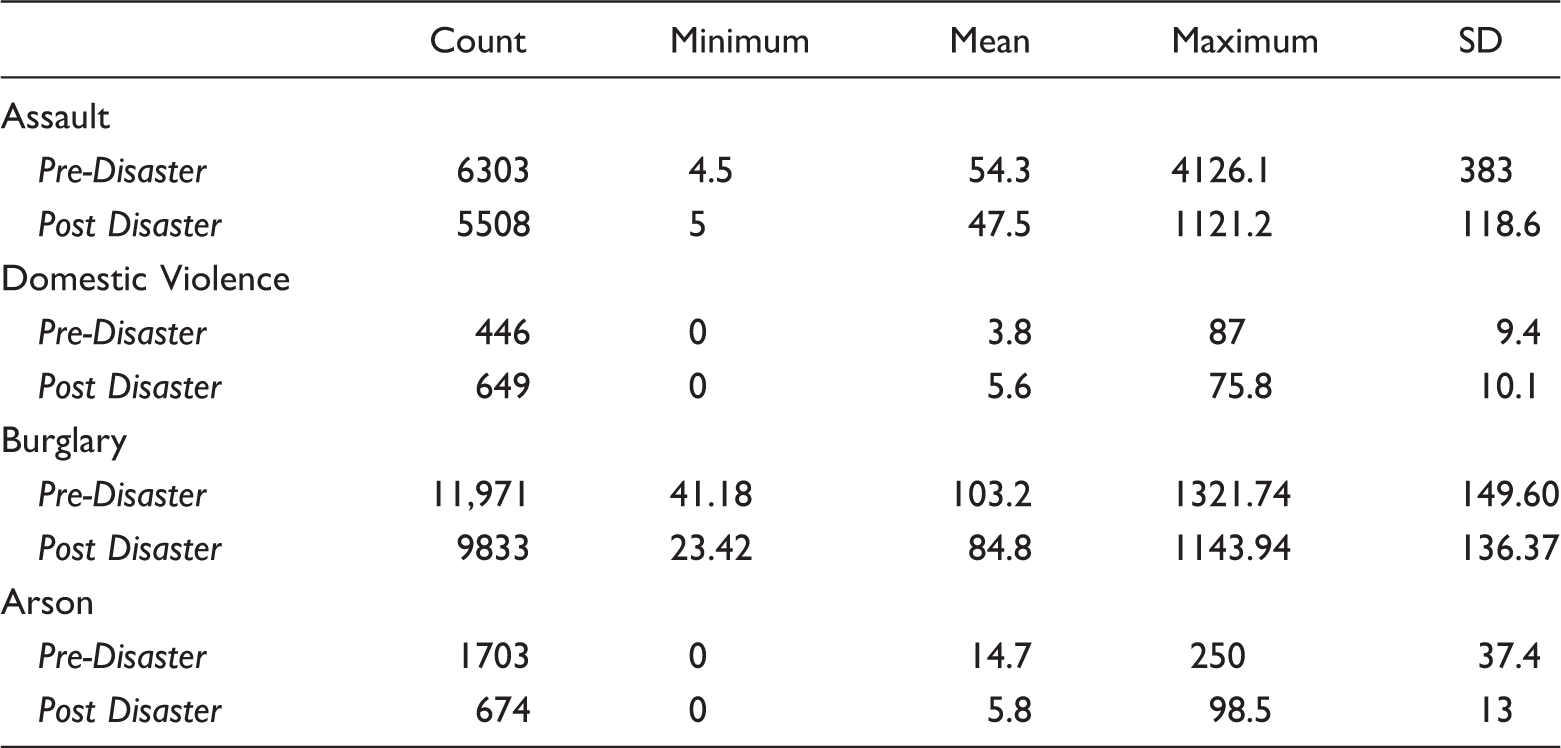
Overall
Descriptive statistics for crime rates (per 10,000 population) across the study period.
Temporal
A temporal plot used to track monthly offending patterns across the city is shown in Figure 1. A number of macro-level trends and fluctuations are notable. Prior to the onset of the Canterbury Earthquakes monthly crime rates appear to fluctuate fairly consistently, except for arson, which appeared to be decreasing on average from the high of November 2008. Immediately following the Darfield earthquake, all offence rates rose and then dropped with the exception of burglary which increased again two months after the event (November 2010). A notable drop was observed across all offence types in the months immediately following the Christchurch Earthquake (February 2011). The duration of this decrease lasted around four months for burglary, two months for assault, whilst arson dropped and has never reached the mean rate of the pre-disaster period. The assault rates also increased marginally following the post-Christchurch Earthquake decrease, but has remained (on average) lower than the pre-disaster period. Despite coming from a low base, domestic violence gradually increased after the Christchurch event with peaks in February and April 2013. Notably, monthly domestic violence rates consistently exceeded arson rates from July 2012 onwards.
Monthly crime rates in Christchurch across the Canterbury Earthquakes (per 10,000 population).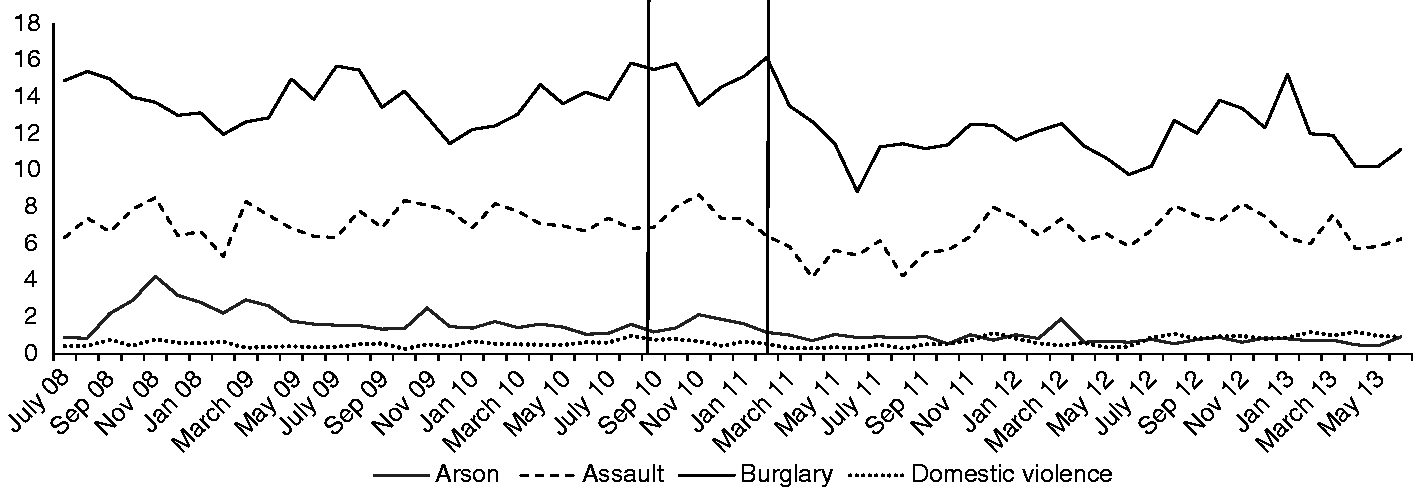
Daily crime rates for the 28 days either side of the two major earthquake events are shown in Figure 2(a) and (b). Variations in crime across all four crime types after the Darfield Earthquake are strikingly similar to daily fluctuations before the event. Arson peaked on the day of the Darfield Earthquake relative to the days prior, and then tapered off considerably. Daily crime rates around the Christchurch Earthquake are shown in Figure 2(b). Most notably there is a remarkable and rapid increase in burglary immediately prior to the Christchurch Earthquake, thereafter a gradual decline – this could be a reporting effect. Assault rates experienced a brief dip beginning on the 21st of February and continued for three days, with the 22nd and 23rd of February being the joint lowest (along with 14th of March) for assault rates in the observation window. The 22nd of February was the beginning of a five day period with no domestic violence offences being recorded.
(a) Daily crime rates in Christchurch 28 days prior and after the Darfield Earthquake (per 10,000 population). (b) Daily crime rates in Christchurch 28 days prior and after the Christchurch Earthquake (per 10,000 population).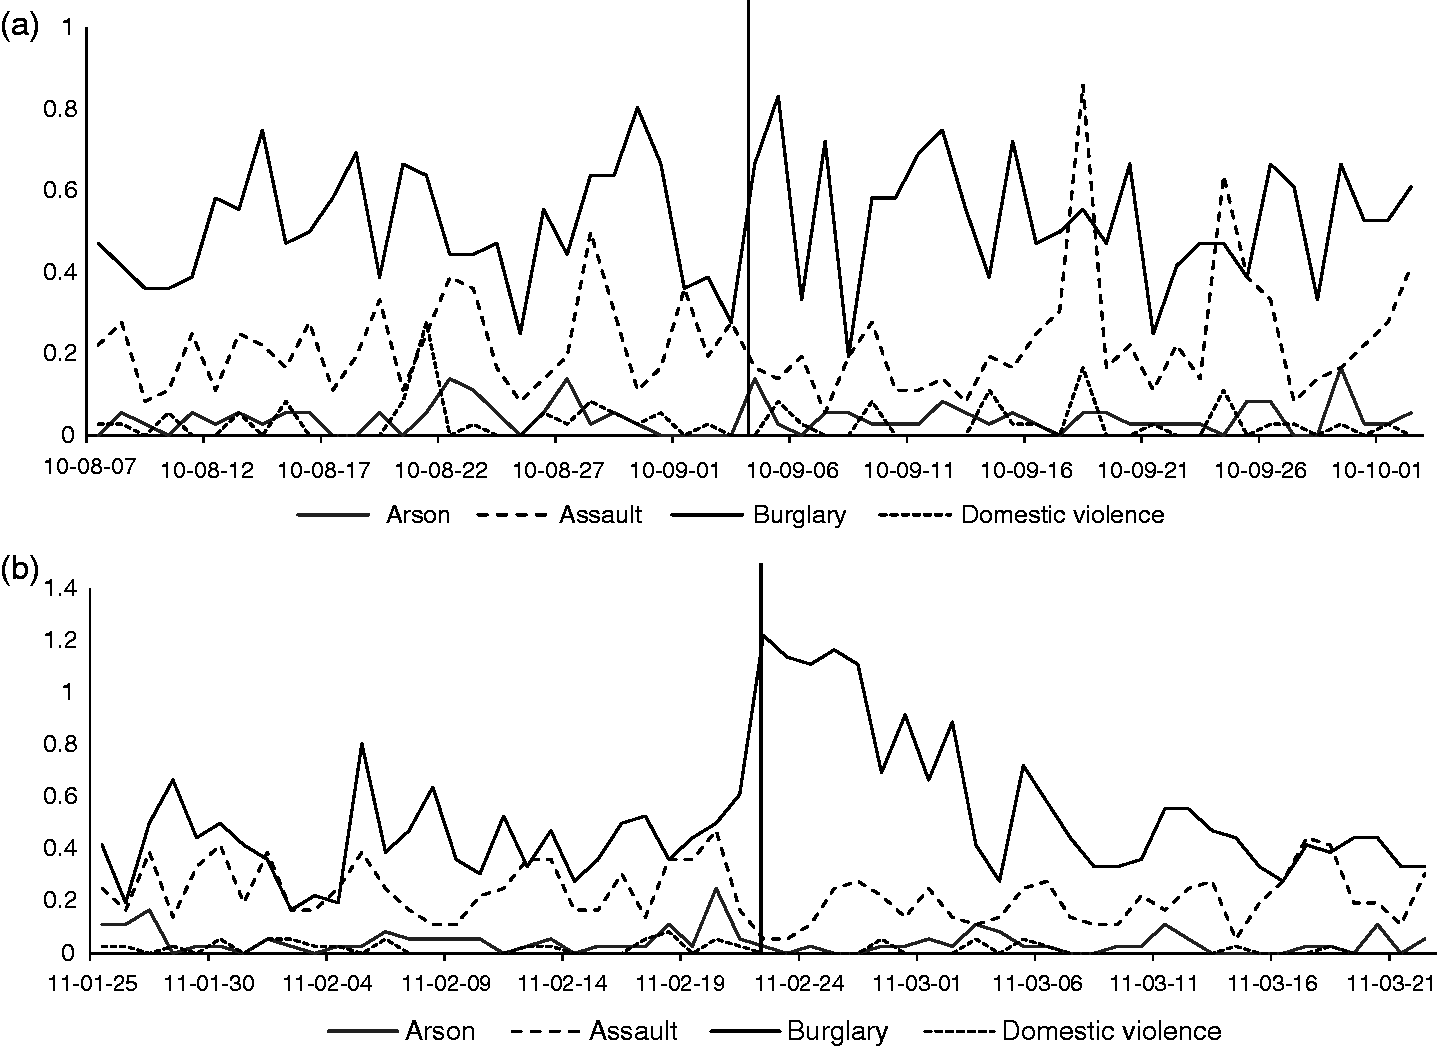
Finally, the temporal ‘rose’ profiles for each offence type across the two year pre-earthquake period and the two year post-earthquake period are shown in Figure 3(a) to (d). Across both periods assault is concentrated in times of usual social activity with most incidents taking place on the weekend, and between the late afternoon, evening and the early hours of the morning (see Figure 3a). Overall the temporal profile of assault remains consistent across both periods. Domestic violence offences were most prevalent between Friday and Sunday for both periods (see Figure 3b). The timing of reported domestic violence offences was similar for both periods, and was highest in the early evening between 5:00 p.m. and 11:00 p.m. Again, no major differences were found in the profiles determined across the two earthquake periods. Burglary peaks in the daytime hours of 11:00 a.m.–13:00 p.m. for both time periods (see Figure 3c) whilst arson offences were most prolific on Saturdays and Sundays, with Sunday being the day of highest offending in the post-disaster period, and Saturday for the pre-disaster period (see Figure 3d). Again, similar to the previous offence types, arson in the pre-disaster and post-disaster periods displays very similar temporal profiles.
(a) Radar plots of daily and hourly assault in the pre- and post-earthquake period. (b) Radar plots of daily and hourly domestic violence in the pre- and post-earthquake period. (c) Radar plots of daily and hourly burglary in the pre- and post-earthquake period. (d) Radar plots of daily and hourly arson in the pre- and post-earthquake period.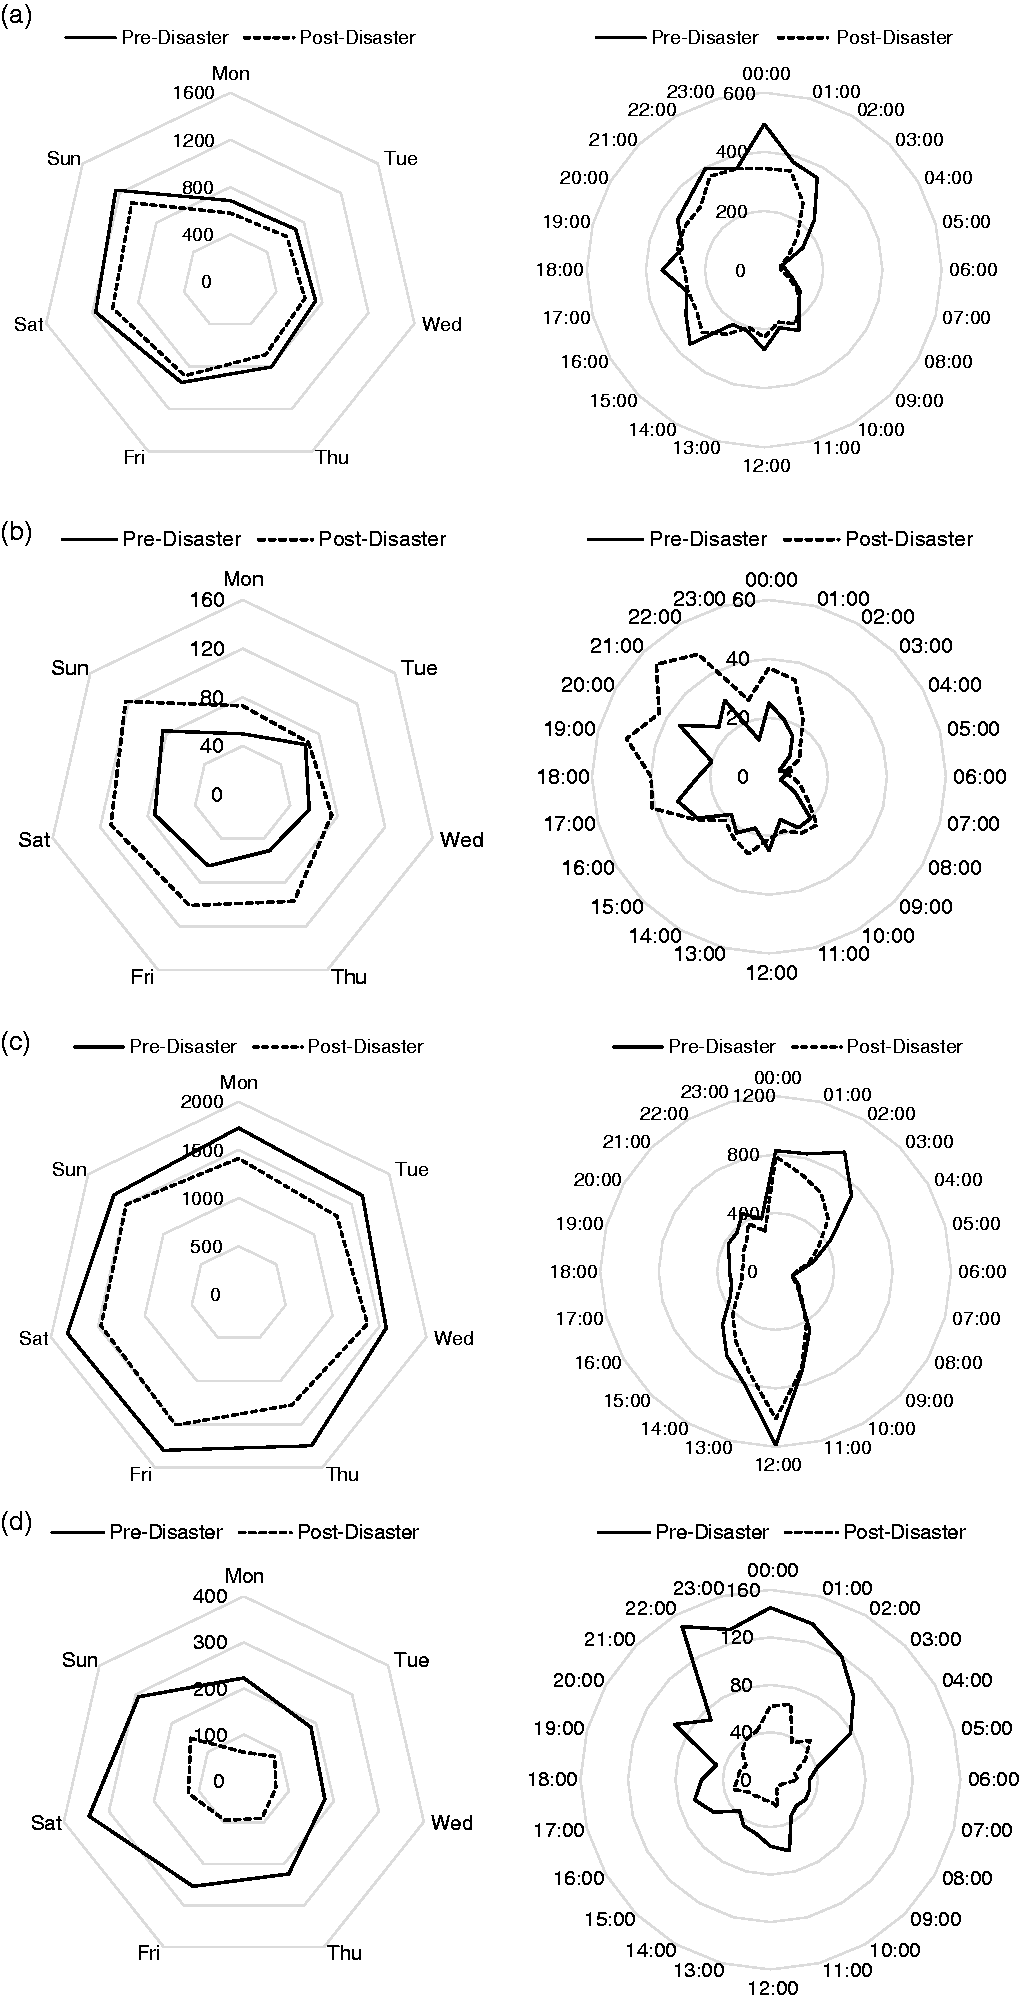
Spatial
Figure 4 shows the number of neighbourhoods that experienced an increase (or not) in a particular type of crime following the Canterbury Earthquakes. Only 19 neighbourhoods in Christchurch experienced no increase in any type of crime post-earthquake. Of particular concern, 75 neighbourhoods (65%) experienced an increase in domestic violence rates in the reported time period post-earthquake. That was followed by arson (n = 45, 39%), assault (n = 25, 22%) and burglary (n = 21, 18%).
The number of neighbourhoods that have experienced an increase in a particular type of crime following the Canterbury Earthquakes.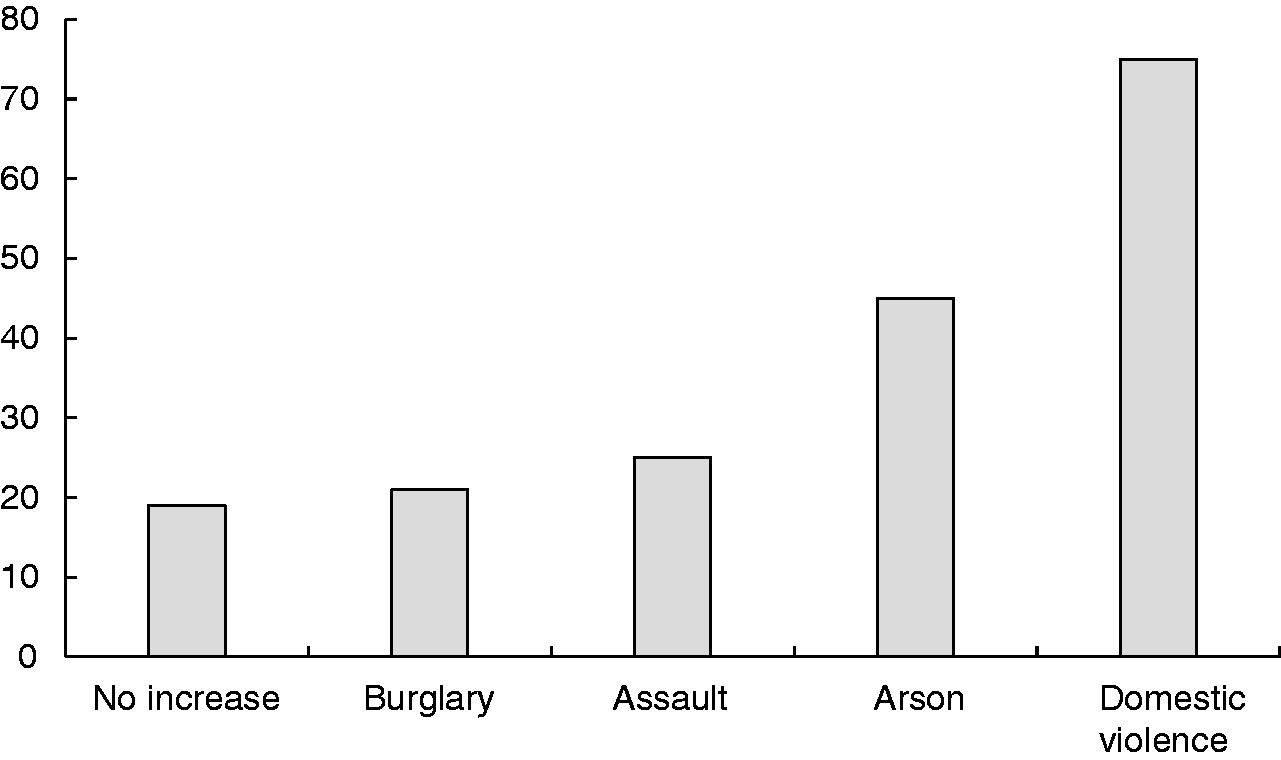
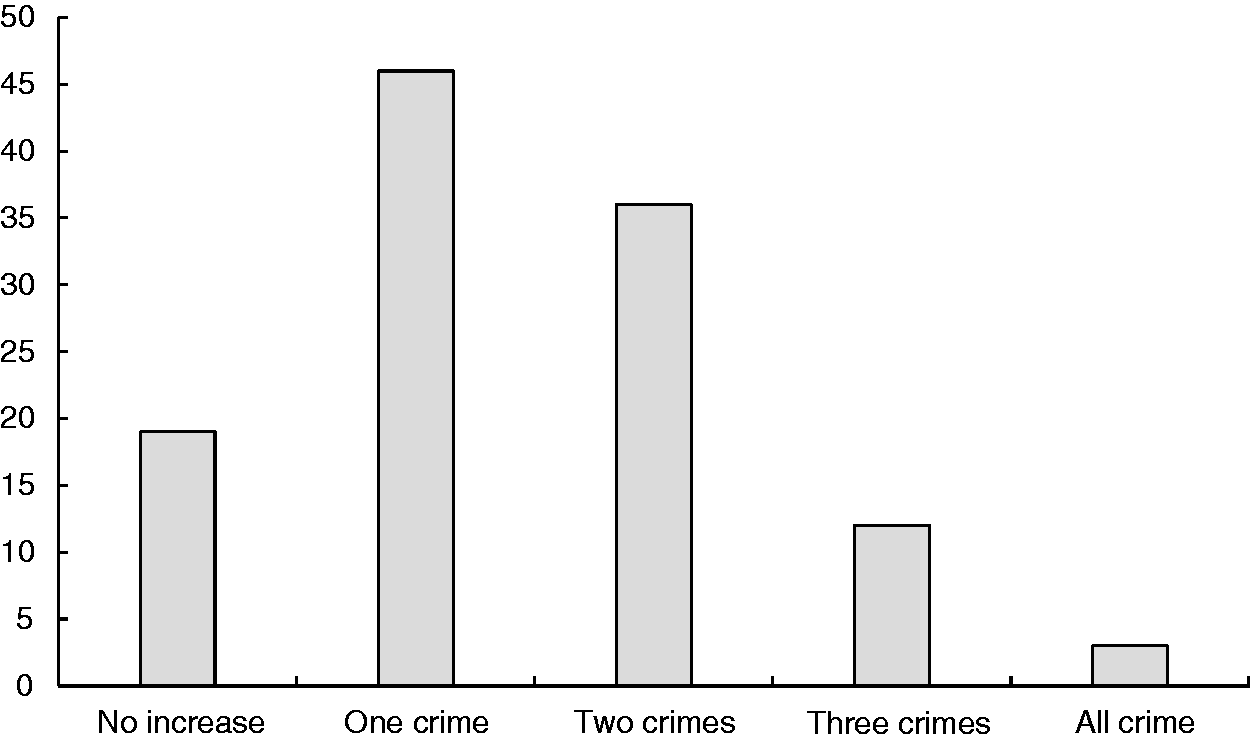
Figure 5 shows the spatial distribution of neighbourhoods that experienced an increase in zero-to-all types of crime following the Canterbury Earthquakes. Interestingly, no clear spatial pattern emerges with crime increasing sporadically across most regions of the city. Figure 6 shows the number of neighbourhoods that have experienced an increase in zero-to-all types of crime following the Canterbury Earthquakes. Just under 40% of neighbourhoods (n = 46) in Christchurch experienced an increase in at least one type of crime post-quake whilst just under a third of neighbourhoods (n = 36) experienced an increase in two types of crime post-earthquake. Further analysis, not shown here, revealed that the highest number of co-occurring crime types per neighbourhood were assault combined with domestic violence. This combination is most likely driving the number shown above. Roughly 10% of neighbourhoods in Christchurch experienced an increase in three types of crime whilst three neighbourhoods experienced an increase in all four types of crime post-quake.
The spatial distribution of neighbourhoods that have experienced an increase in zero-to-all types of crime following the Canterbury Earthquakes. The number of neighbourhoods that have experienced an increase in zero-to-all types of crime following the Canterbury Earthquakes.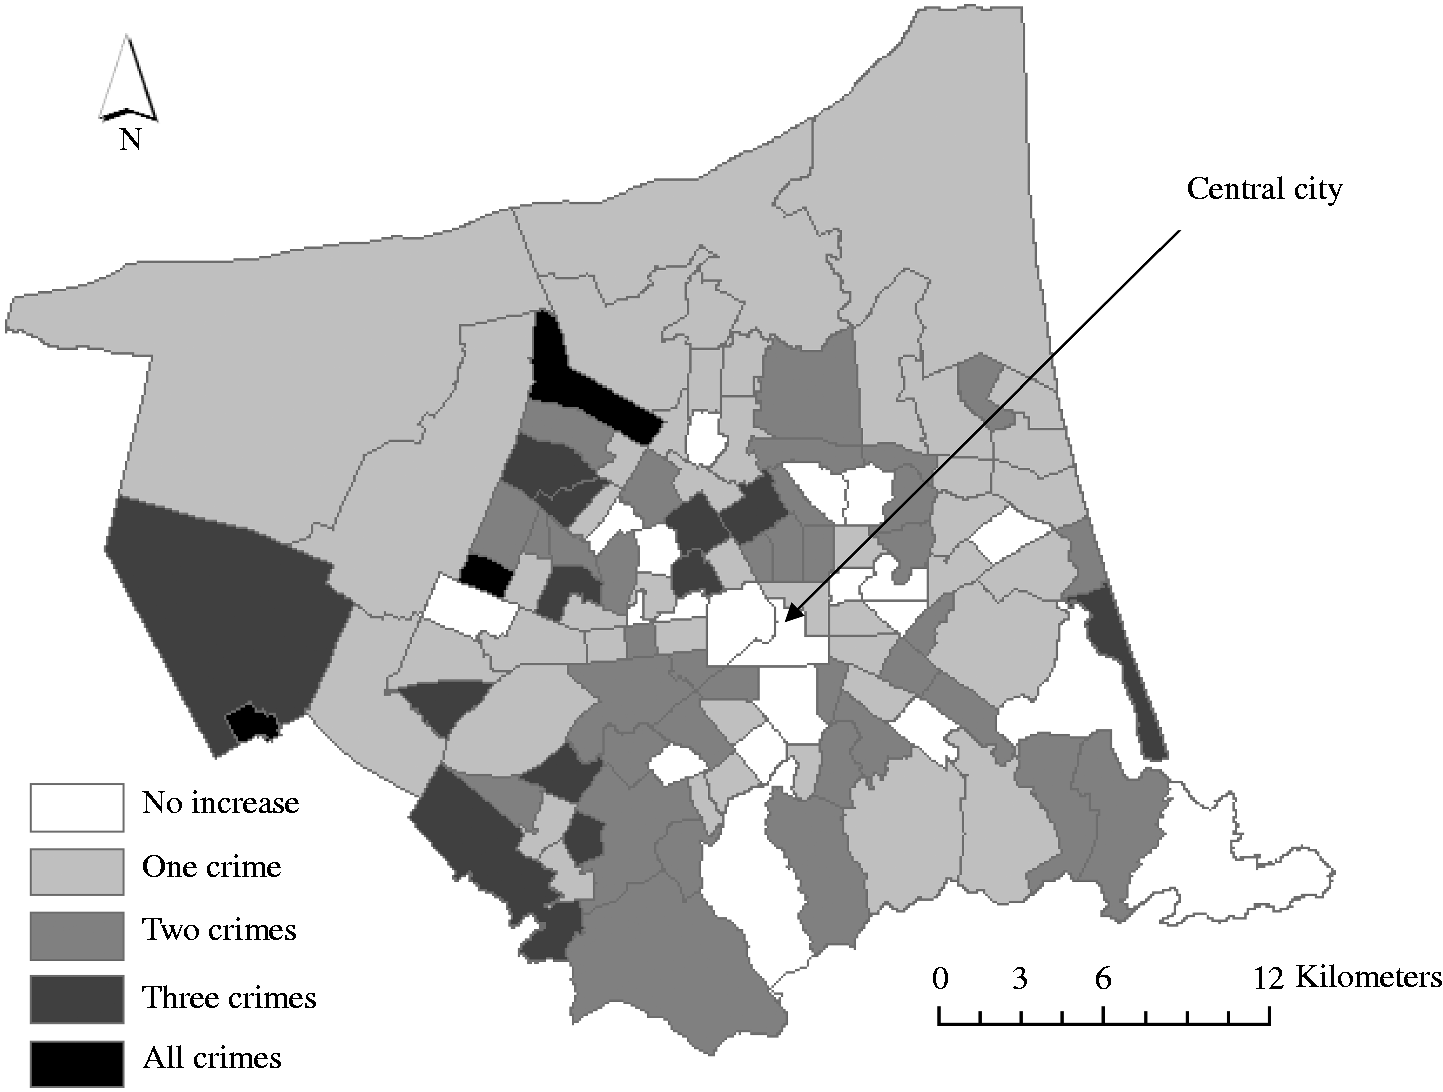
Results of MANOVA.
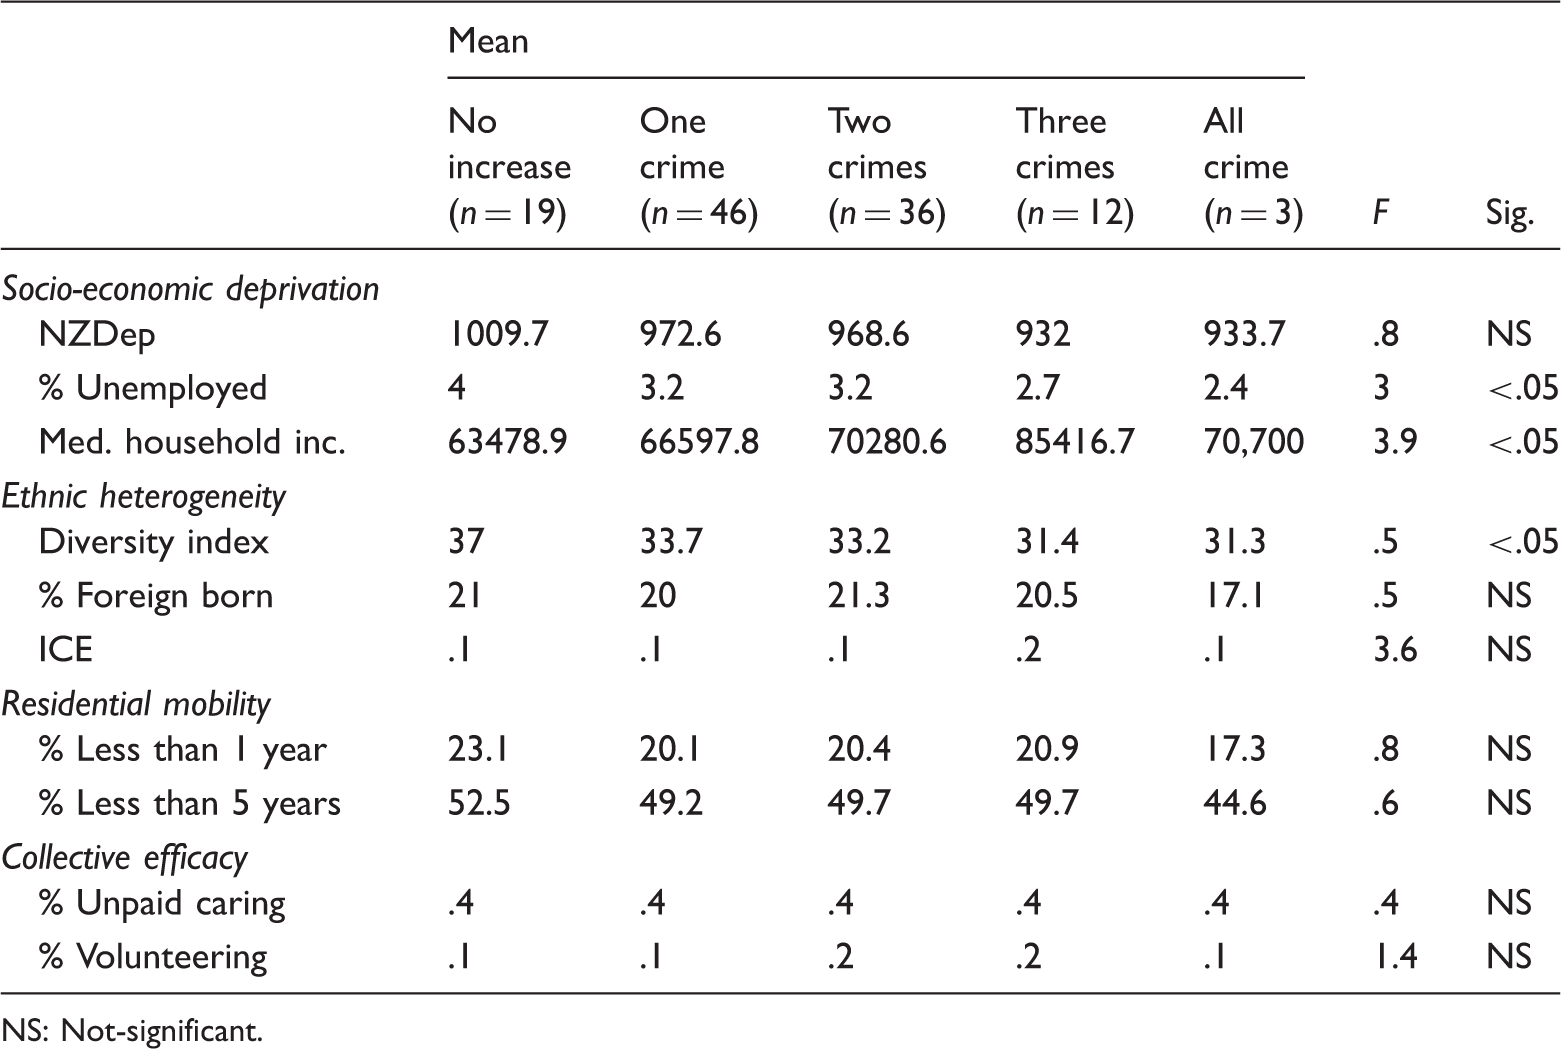
NS: Not-significant.
The results of MANOVA found statistically significant differences in the values of three neighbourhood-level variables between the groups: percentage unemployed, median household income and the DI.
Discussion
It is evident that the Canterbury Earthquakes had an effect on crime in Christchurch. Overall crime in the city has declined post-quake with crime across the four types examined in this study collectively decreasing by over 18% in the post-quake period. Only domestic violence increased post-quake whilst the other three crime types decreased; in the case of arson, dramatically. Closer scrutiny of the data however revealed some interesting trends and anomalies. First, whilst crime overall in the city has declined, 84% of neighbourhoods in Christchurch reported an increase in at least one type of crime (see Figure 6). Only 19 neighbourhoods in the city did not experience an increase in any of the four types of crimes examined. In fact, just under a quarter of the neighbourhoods of Christchurch experienced an increase in either assault or domestic violence whilst almost 40% of neighbourhoods experienced an increase in two or more types of crime. This somewhat paradoxical finding can be explained by examining the crime data more closely. Further analysis of the data revealed that one neighbourhood which experienced no increase in crime post-quake was Cathedral Square. Cathedral Square lies at the heart of the former CBD of Christchurch and was the location of numerous entertainment establishments (i.e. bars, restaurants, shopping centres) in the city before the earthquakes. Prior to the earthquake almost 12% of all crime in Christchurch occurred in this single CAU in the city. In the immediate aftermath of the earthquakes, a cordon was placed around the CBD and extensive structural assessments undertaken within the cordoned off area to ascertain the level of damage sustained. Approximately 47% of buildings within the CBD were assessed to be unsafe or required restricted access (Kam, Pampanin, & Elwood, 2011) and over 60% of the roughly 6000 businesses located in the Christchurch CBD – employing almost 30% of the Christchurch workforce – were forced to close at least temporarily (Stevenson, Vargo, Seville, et al., 2011). Whilst the final section of the cordon was lifted in 2013 the rebuild and revitalisation of the CBD is still in its infancy. The result of these developments has been the spatial displacement of crime away from this former hot-spot and into other neighbourhoods of the city. Crime has decreased by almost 70% in Cathedral Square post-quake with the total crime in this CAU accounting now for less than 5% of crime throughout the city.
Interestingly, the results of this research (see Figure 5) have shown how crime has been displaced somewhat uniformly throughout Christchurch post-quake. Away from the central city but to no dominant region of the city. In fact, no significant spatial concentrations were found for an increase in any particular type of crime in neighbourhoods post-quake nor for any increase in multiple types of crime. This finding suggests that the effects of an increase in crime post-quake have been uniformly felt throughout the city. Significant differences were however found between neighbourhoods by percentage unemployed, median household income and by diversity with neighbourhoods that experienced no increase in crime or an increase in only one type of crime having higher unemployment rates, lower median household incomes and greater diversity. Whilst the overall difference in values of these variables between groups is small – and the bases are low – the results are in sharp contrast with expectations from social disorganisation theory which assumes an increase in the opportunities for crime in neighbourhoods with greater deprivation and higher diversity. As a result, little support is found for our first hypothesis that crime will increase in Christchurch post-quake and will be spatially concentrated in more socially disorganised neighbourhoods. Explanations for these findings are speculative but could be related to the spatial distribution of earthquake damage in Christchurch with many neighbourhoods declared red-zoned and ‘uninhabitable’ post-quake being located in less affluent areas. Another explanation could relate to how communities within the city develop and promote pro-social and altruistic behaviours in the aftermath of a disaster, although future research in this area is warranted.
The finding that domestic violence rates have increased post-quake is of concern. Just under 65% of neighbourhoods experienced an increase in domestic violence rates post-quake. This finding is not uncommon with past research, particularly in the US, indicating an increase in domestic violence and disputes post-disaster (see Adams & Adams, 1984; LeBeau, 2002; Zahran et al., 2009). Researchers attribute this increase to the psychosocial stressors experienced by residents in the immediate aftermath of such an event. Post-disaster stressors such as relocation and the loss of social and capital resources may magnify the immediate distress induced by a disaster. The increased consumption of alcohol which typically occurs post-disaster (see Cepeda, Valdez, Kaplan, et al., 2010; Schroeder & Polusny, 2004) combined with internal and external stressors could be used to explain this association. It should be noted however that the domestic violence figures both pre- and post-earthquake are very low and are therefore likely to be hampered by statistical ‘floor’ effects. In fact, domestic violence comprised less than 2% of the total percentage of crimes investigated in this study pre-earthquake; rising to just under 4% post-earthquake. Whilst this increase is admittedly small it is worth noting that this was the only crime type in our study that recorded an increase post-quake as well as the fact that domestic violence is one of the most under-reported crimes in New Zealand (New Zealand Crime and Safety Survey, 2014). Nevertheless, these findings need to be viewed with caution.
From a temporal perspective, we found almost no differences between the temporal occurrence of crime pre- and post-earthquake. In fact the temporal signatures (both hourly and daily) of crime across all four types are remarkably similar across both periods. These findings do not support our second hypothesis that the temporal patterning of crime will change post-quake as individuals’ routine activities are affected following a natural disaster. From a routine activities perspective it could be that comparing broader temporal trends of crime pre-earthquake with crime occurring 3–4 years after the event is too big a time lapse and rather comparing crime at finer daily and/or hourly resolutions immediately before the event with crime in the immediate aftermath of the event would reveal greater temporal differences. It could also be that the effects of the earthquake on residents’ routine activities were not as profound as initially suspected in the city. Whilst there is still a large amount of remediation and rebuild work ongoing in Christchurch, the vast majority of activity nodes such as schools, churches and businesses were relatively unaffected (with the exception of those in the CBD) by the earthquake leading to the ‘new’ normal resumption of day-to-day activities shortly after the earthquake. Last, it could also be that opportunities for offending that arose before the earthquake have not necessarily changed but have rather increased post-quake leading to an upsurge in some crimes but occurring at similar times. For example, domestic violence in New Zealand, which has increased post-quake, generally involves persons known to each other and/or the use and abuse of alcohol (New Zealand Ministry of Justice, 2003). Research in Christchurch has shown a dramatic increase in the clustering of alcohol outlets in the city post-quake as well as an increase in mental health issues (see Gawith, 2013; Osman et al., 2012; Renouf, 2012; Sullivan & Wong, 2011). Increased stress and opportunities to engage in risky behaviours could be a reason why domestic violence has risen but has occurred at times comparable to pre-earthquake times.
A notable limitation of our study was the exclusion of a number of other factors that could explain post-earthquake crime levels in Christchurch, such as proximity to public transportation routes, building restrictions, land-use and zoning restrictions, traffic patterns and the location of entertainment establishments. However obtaining current data pertaining to the built environment in Christchurch at a CAU level of aggregation is problematic. This is mainly due to the vast number of demolitions and remediation work currently being done on commercial and residential properties; as well as on other infrastructures and utilities such as road, sewerage and power networks. Relying mainly on updated and accurate census information allowed us to focus on identifying the socio-demographic drivers of spatial and temporal crime change in post-earthquake Christchurch; which was our main aim. We believe that this research achieved this aim and in doing so has added significantly to the existing literature of this nature.
Last, understanding how crime is affected by a natural disaster should be an important topic of research in criminology. The dramatic increase in natural disasters worldwide since 2000 (see Leaning & Guha-Sapir, 2013) means that countries and cities will increasingly have to deal with the short-to-long term effects of these events from a variety of human-environment perspectives. To understand how crime is affected both in terms of its nature and magnitude following a natural disaster can allow law enforcement agencies to better plan strategically, tactically and operationally for such an event and lessen the detrimental effect that a natural disaster can have on a community. It is anticipated that the knowledge gained from this research makes a small but important contribution in this regard.
Footnotes
Acknowledgements
We would also like to acknowledge the support and guidance of New Zealand Police who provided crime data for this work.
Declaration of conflicting interests
The author(s) declared no potential conflicts of interest with respect to the research, authorship, and/or publication of this article.
Funding
The author(s) received no financial support for the research, authorship, and/or publication of this article.