
Abstract
The period between 2002 and 2016 saw substantial reductions in a number of major categories of crime in Australia, including murder, robbery, break and enter, motor vehicle theft and ‘other’ theft. One might expect the Australian imprisonment rate to have fallen too, but it did not. Over the same period, the Australian imprisonment rate grew by 36%. Most commentators assume the growth in imprisonment rates is due to the growth in punitive penal policies. Little attention has been paid to the influence of crime and policing policy. In this article I present evidence that much of the growth in imprisonment rates stems from rising rates of drug use/drug trafficking and changes in policing policy vis-à-vis family violence and child sexual assault.
Keywords
Introduction
Between 2002 and 2016 Australia experienced an unprecedented fall in crime. The recorded murder rate in Australia fell by 33%, the recorded rate of kidnapping/abduction fell by 29%, the recorded robbery rate fell by 58%, the recorded rate of burglary/break and enter fell by 55%, the recorded rate of motor vehicle theft fell by 54% and the recorded rate of other theft fell by 26%. One might expect the Australian imprisonment rate to have fallen too, but it did not. Over the same period, the Australian imprisonment rate grew by 36%, from 150 per 100,000 of population to 204 per 100,000 of population. All States and Territories experienced an increase in their imprisonment rates but the growth was particularly marked in South Australia (up 81%), the Northern Territory (up 78%) and Western Australia (up 74%). Even Victoria, a state with a traditionally low imprisonment rate, saw its imprisonment rate grow by 44% (Australian Bureau of Statistics, 2016).
The rapid growth in prisoner numbers has produced serious problems of prison overcrowding. In April 2015, the NSW Inspector of Custodial Services released a report stating that ‘Corrective Services [NSW] is operating under a combination of conditions which have the potential to create a dysfunctional, if not dangerous, custodial environment’ (Paget, 2015). In November 2015, the NSW Audit Office (2016) released a report according to which overcrowding in NSW prisons was costing the State $200,000 a day. In 2016 the Age newspaper reported that, in the first seven weeks of 2016, the Victorian Corrections Department was so stretched for resources it failed to bring 455 prisoners to their scheduled court appearances, prompting magistrates to start releasing offenders on bail simply to ensure their appearance in court (Hall, 2016). The Adelaide Advertiser claimed in 2011 that South Australian prisons would run out of beds in two years, despite expansion; prompting warnings from prison officers of increased violence among inmates (Stokes, 2011). In June 2015, ABC news in Queensland reported that ‘jails’ are ‘overcrowded and becoming dangerous for staff and prisoners’ (Worthington, 2015). In December 2016, the West Australian Office of the Inspector of Custodial Services described the state’s prison system as ‘unsustainably stretched’, with prisoners being held in cells that, in the opinion of the Inspector of Custodial Services in that State, ‘fall short of national and international standards’ (Wildie, 2016).
Many commentators blame harsher penal policies rather than rising crime or policing policies for this state of affairs. The Australian Senate cited ‘tough on crime’ sentencing and parole reforms as the cause of rising imprisonment rates (Legal and Constitutional Affairs Committee, 2013, p. 19). In their analysis of Australian imprisonment rates, Cunneen et al. (2013), Hall (2010) and Tubex, Brown, Freiberg, Gelb and Sarre (2015) discuss sentencing policy at length but do not give much attention to the possibility that rising crime or arrest rates might account for a large part of the growth in imprisonment rates. Cunneen (2011, p. 10) attributed the growth in Indigenous imprisonment to more frequent and longer periods of imprisonment between 2000 and 2011 on the grounds that ‘increases in imprisonment rates have continued, while crime rates have levelled or fallen, in many categories of crime from 2000’. In its 2013 report, the Victorian Sentencing Advisory Council (2013, p. 8) acknowledged that rising crime could have been a factor behind Victoria’s rising prison population but was initially inclined to dismiss the possibility on the grounds that the available evidence on the relationship between crime and imprisonment rates was, as they put it, ‘conflicting’. 1
The tendency to assume that the growth in Australia’s imprisonment rate is the result of more punitive penal policies is entirely understandable. Sentencing policy in Australia since the mid-1980s has been characterised by what Roberts, Stalans, Indermaur, and Hough (2003) rightly describe as ‘penal populism’. Examples of the growth in punitive sentencing laws abound (Anderson, 2012; Freiberg, 2005; Freiberg & Ross, 1999; Simpson & Griffith, 1999; Warner, 2002). As I show later, there is evidence that tougher sentencing policies have contributed to the rise in prisoner numbers. And yet, simply enumerating instances of tougher penal policies is not enough on its own to establish the claim that rising imprisonment rates are primarily due to harsher penal policies. For one thing, courts have repeatedly shown themselves capable of ameliorating the effects of legislative changes designed to impose harsher penalties (see, e.g. Freiberg, 2017; MacKinnell, Spears, & Takach, 1993; Poletti, 2010). For another (and more importantly), the size of any prison population is not solely a function of the proportion of offenders imprisoned and the length of stay. It is also affected by crime levels, arrest rates, conviction rates, bail refusal rates and responses to fine default. If the claim is that penal policy is responsible for imprisonment rate growth, it is necessary to show that changes in penal policy, rather than changes in other factors that influence arrest rates and time in custody, are responsible for the growth in prisoner numbers.
Although analyses of prison population growth have occasionally been undertaken in particular jurisdictions (e.g. Ferrante, 2007; Freiberg & Ross, 1999; Weatherburn, Corben, Ramsey, & Fitzgerald, 2016; Weatherburn, Wan, & Corben, 2014), no one to date has made any systematic attempt to determine how much of Australia’s imprisonment rate growth over the last 16 years is due to changes in the number of arrests or people appearing in court, as opposed to changes in the proportion imprisoned or the length of stay in prison. My purpose in this article is to remedy this state of affairs. The focus of this article is on the relative contribution made by crime, policing policy and penal policy to the growth in Australian imprisonment rates between 2001 and 2016. To foreshadow my conclusion, I find evidence that much of the growth in rates of imprisonment stems from policing policy rather than penal policy. Changes in penal policy have contributed to the growth; however, the impact of penal policy on imprisonment rates has been far less significant than has been widely assumed.
Three important points must be made before I begin. The first is that, although bail law is an important aspect of penal policy and is discussed in this article, our ability to capture its effects at a national level is constrained by the absence of national data on the proportion of defendants refused bail and the length of time spent on remand. Second, again because of a lack of suitable data, I am unable to examine the effect of fine default on prison populations. The only consolation on this issue is that fine defaulters generally constitute a small percentage of the prison population at any one time. Finally, an undertaking of this sort ideally calls for separate analyses for each of Australia’s States and Territories. A task of that magnitude is far too large for a journal article. I therefore analyse general trends across Australia, acknowledging from the outset that the relative importance of the factors I identify may vary from jurisdiction to jurisdiction.
The dynamics of imprisonment
We begin with a brief description of the ways in which crime, policing policy and penal policy can influence the rate of imprisonment in a jurisdiction. The natural starting point for a discussion of any queuing system is Little’s law (1961), which states that, under steady-state conditions, the average number of items in a queuing system equals the average rate at which items arrive multiplied by the average time that an item spends in the system. Letting L = average number of items in the queuing system, W = average waiting time in the system for an item and A =average number of items arriving per unit time, the law is

In the context of prisons, the law implies that, in a stable state, the size of a prison population (L) is given by the product of the average rate of arrival in prison (A) and the average length of stay (W). Factors A and L are both functions of crime, policing policy and penal policy. Levels of crime influence A because, if the probability of arrest, the probability of conviction given arrest, and the probability of imprisonment given conviction all remain constant, a rise in crime will automatically generate an increase in A. Changes in policing policy influence A because, like crime, they can influence rates of arrest; as when police focus their resources on repeat offenders (who, if convicted, are more likely to go to prison). Penal policy can influence A by changing the proportion of convicted offenders who receive a prison sentence. It can also influence A in more subtle ways; as for example, when tougher parole breach policies increase the rate of return to prison.
Similar considerations apply to the time spent in custody (W). Penal policy can obviously influence W through its effect on the length of prison sentences. An increase in crime, however, will have the same effect if it takes the form of a growth in serious forms of offending because more serious offences attract longer prison terms as well as a higher risk of imprisonment. It may not appear that crime and policing policy can influence W; however, recent experience in New South Wales (NSW) has shown that rapid growth in arrest rates for serious offences can lead to court congestion. The resulting delays in the processing of cases where the accused is held in custody on remand lead to growth in the size of the remand population (Weatherburn et al., 2016).
Given all this, it might be asked, how can one identify the separate contributions of crime, policing policy and penal policy to imprisonment rate growth? The approach taken here is to begin by determining how much of the imprisonment rate growth is due, respectively, to changes in the number of sentenced prisoners and the expected time in custody. Analysis of changes within different offence categories and comparison with recorded crime data then provides useful clues as to which factors are playing the dominant role in driving imprisonment rate growth. I find, for example, that one of the major reasons for the growth in rates of imprisonment is a rise in the number people proceeded against by police for ‘Acts Intended to Cause Injury’ and in the proportion of such persons given a prison sentence. Since national crime victim survey data show no increase in assault or in public willingness to report it, I surmise that the growth in court appearances for this offence is a consequence of changes in both penal and policing policy.
Trends in court appearances 2
Arrest is the point of entry into the criminal justice system but court appearance is a useful proxy for arrest because most arrests result in a conviction (see below). Table 1 shows the trend in the rate of court appearances in Australia between 2003/4 (the first year in which national court statistics were published) and 2015/16, broken down by offence type. Also shown are the percentage change between the first and last years, the Kendall’s tau statistic (test for trend) and the p-value of the statistic. The tau statistic was chosen because it makes no assumptions about the functional form of the relationship between two variables.
Australia: Finalised court appearance rates.
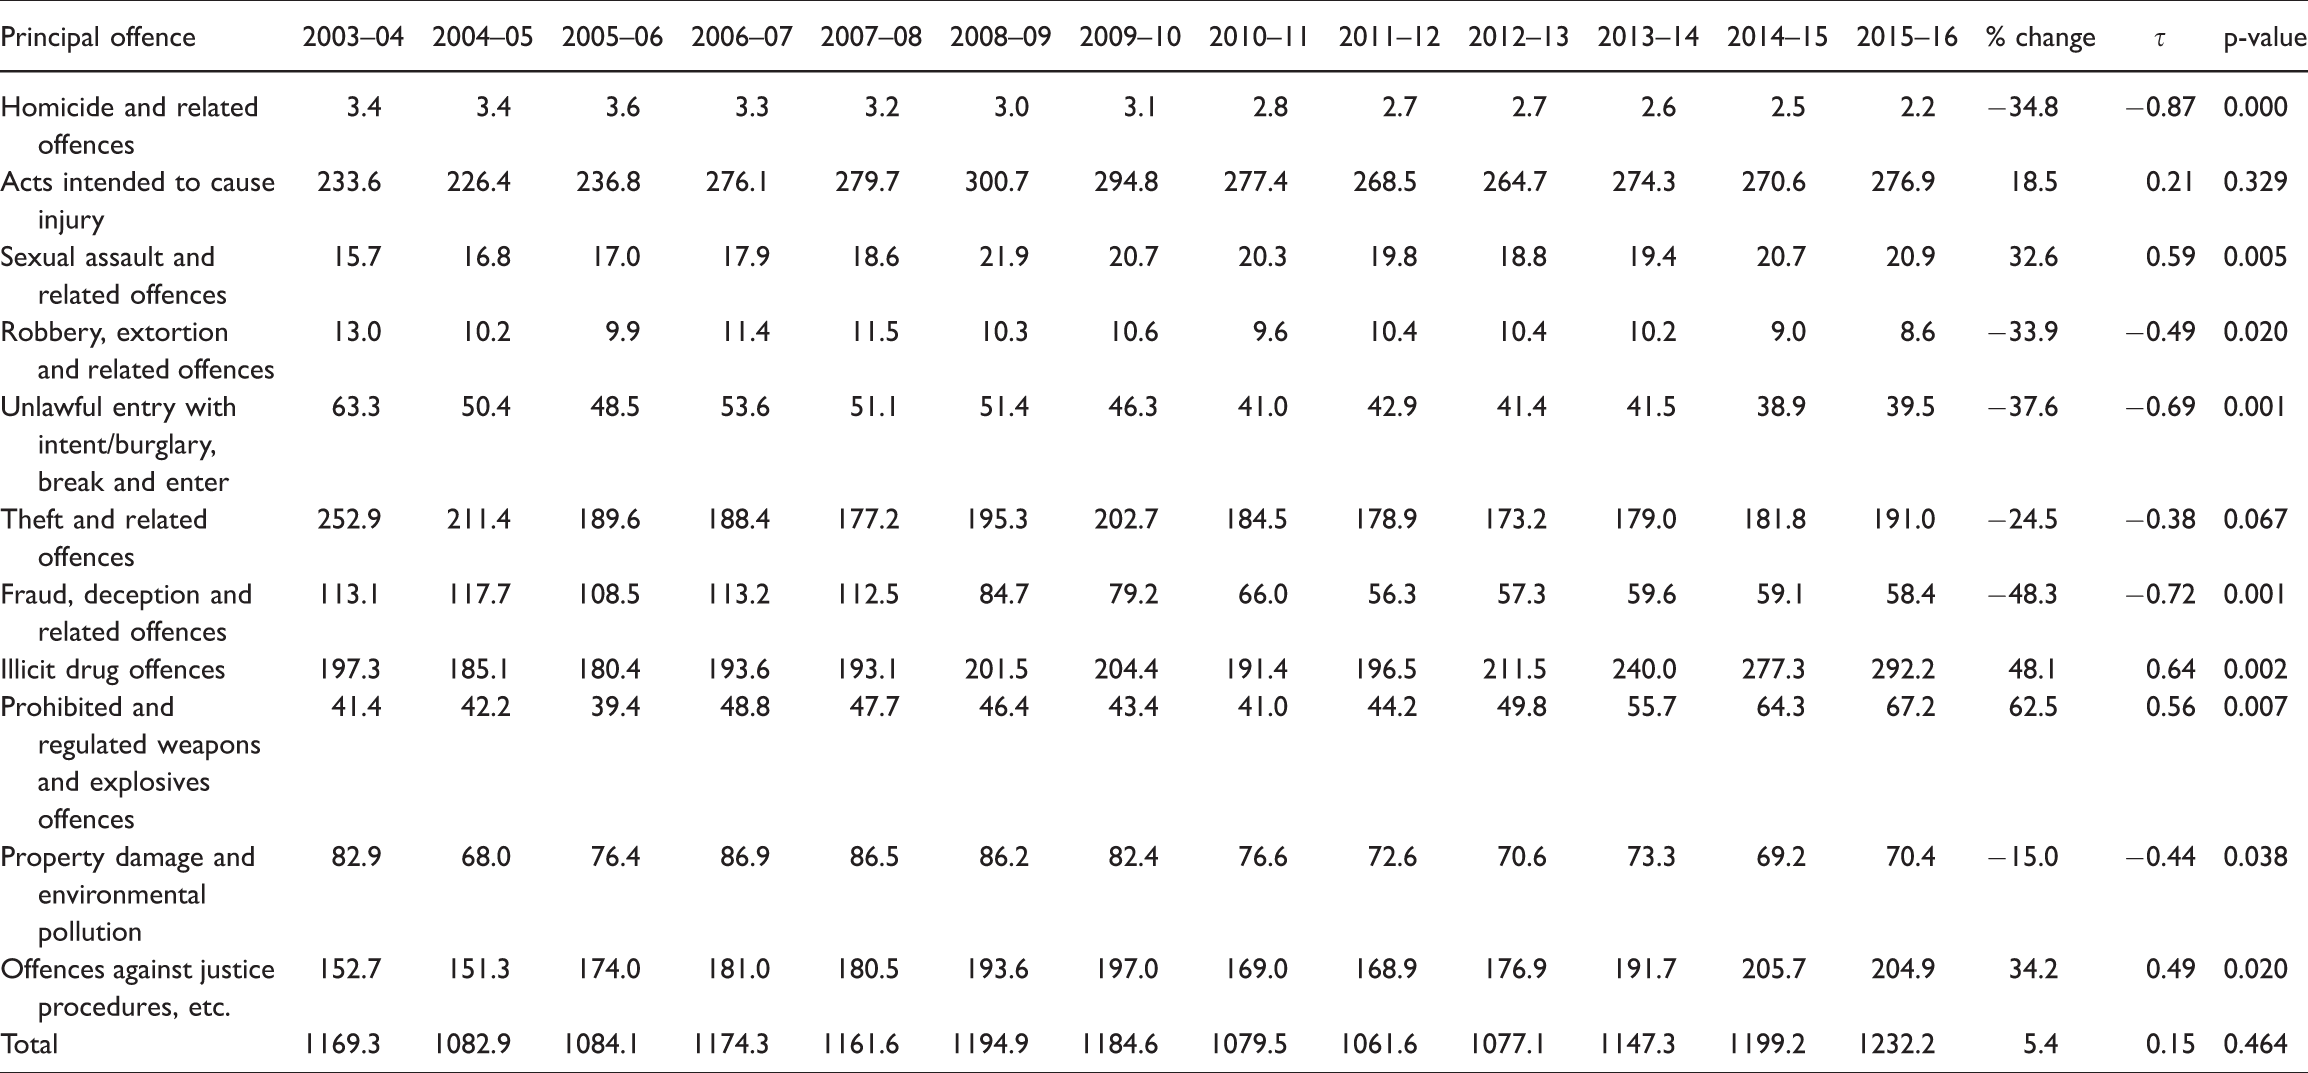
Changes to the Australian Standard Offence Classification (Australian Bureau of Statistics, 2008b) disrupted the time series for Dangerous or Negligent Acts Endangering Persons; Abduction, Harassment and Other Offences against the Person; Public Order Offences; Traffic and Vehicle Regulatory Offences; and Miscellaneous Offences. These offences are therefore not included in the table. It should be noted, however, that the offences that are included account for approximately 85% of all imprisonments over the period 2003/4 to 2015/16.
There are significant increases in the rate of appearance for Sexual Assault and Related Offences (up 32.6%), Illicit Drug Offences (up 48.1%), Prohibited and Regulated Weapons and Explosive Offences (up 62.5%) and Offences Against Justice Procedures (up 34.2%). The overall increase of 5.4% is not significant because the increases in rates of appearance were offset by substantial decreases in some categories (e.g. Robbery, Extortion and Related Offences; Unlawful Entry with Intent/Burglary, Break and Enter).
Rates of imprisonment can be affected by changes in rates of conviction. Table 2 therefore shows rates of appearance resulting in a finding of guilt, broken down by offence type. The last three columns in this and succeeding tables have the same interpretation as was given in connection with Table 1.
Australia: Convicted offender rates.
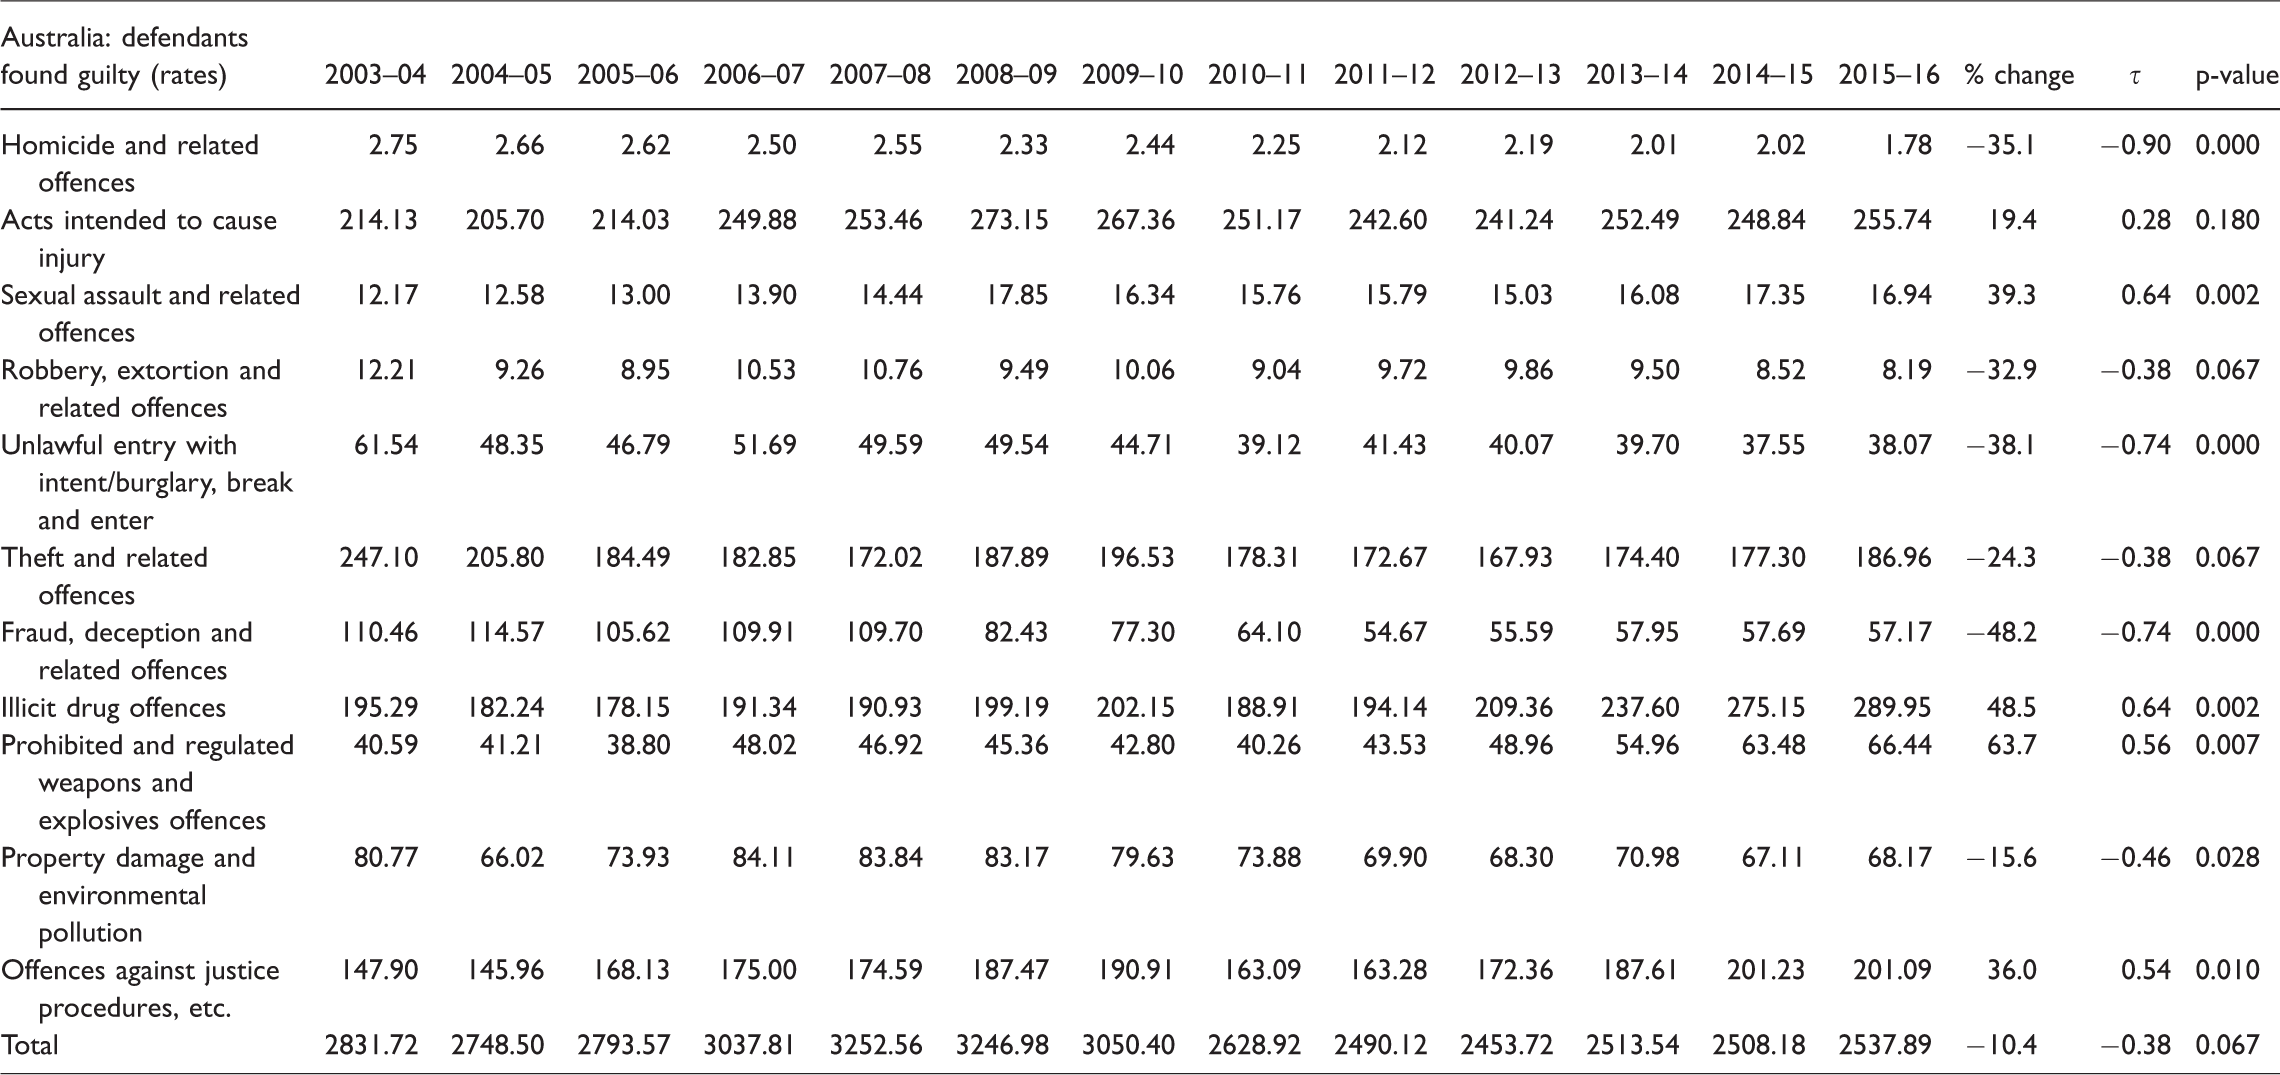
As might be expected, rates of proven court appearance (i.e. appearances resulting in a finding of guilty on at least one charge) are once again higher for the offence categories for Sexual Assault and Related Offences (up 39.6%), Illicit Drug Offences (up 48.5%), Prohibited and Regulated Weapons and Explosive Offences (up 63.7%) and Offences Against Justice Procedures (up 36%). Although not shown here, the correlation across offence types between finalised court appearance rates (Table 1) and convicted offender rates (Table 2) ranges between 0.97 and 0.99.
Trends in the use of imprisonment
Table 3 shows the trend in the rate at which convicted offenders are being sentenced to prison.
Australia: Rates of imprisonment for convicted offenders.
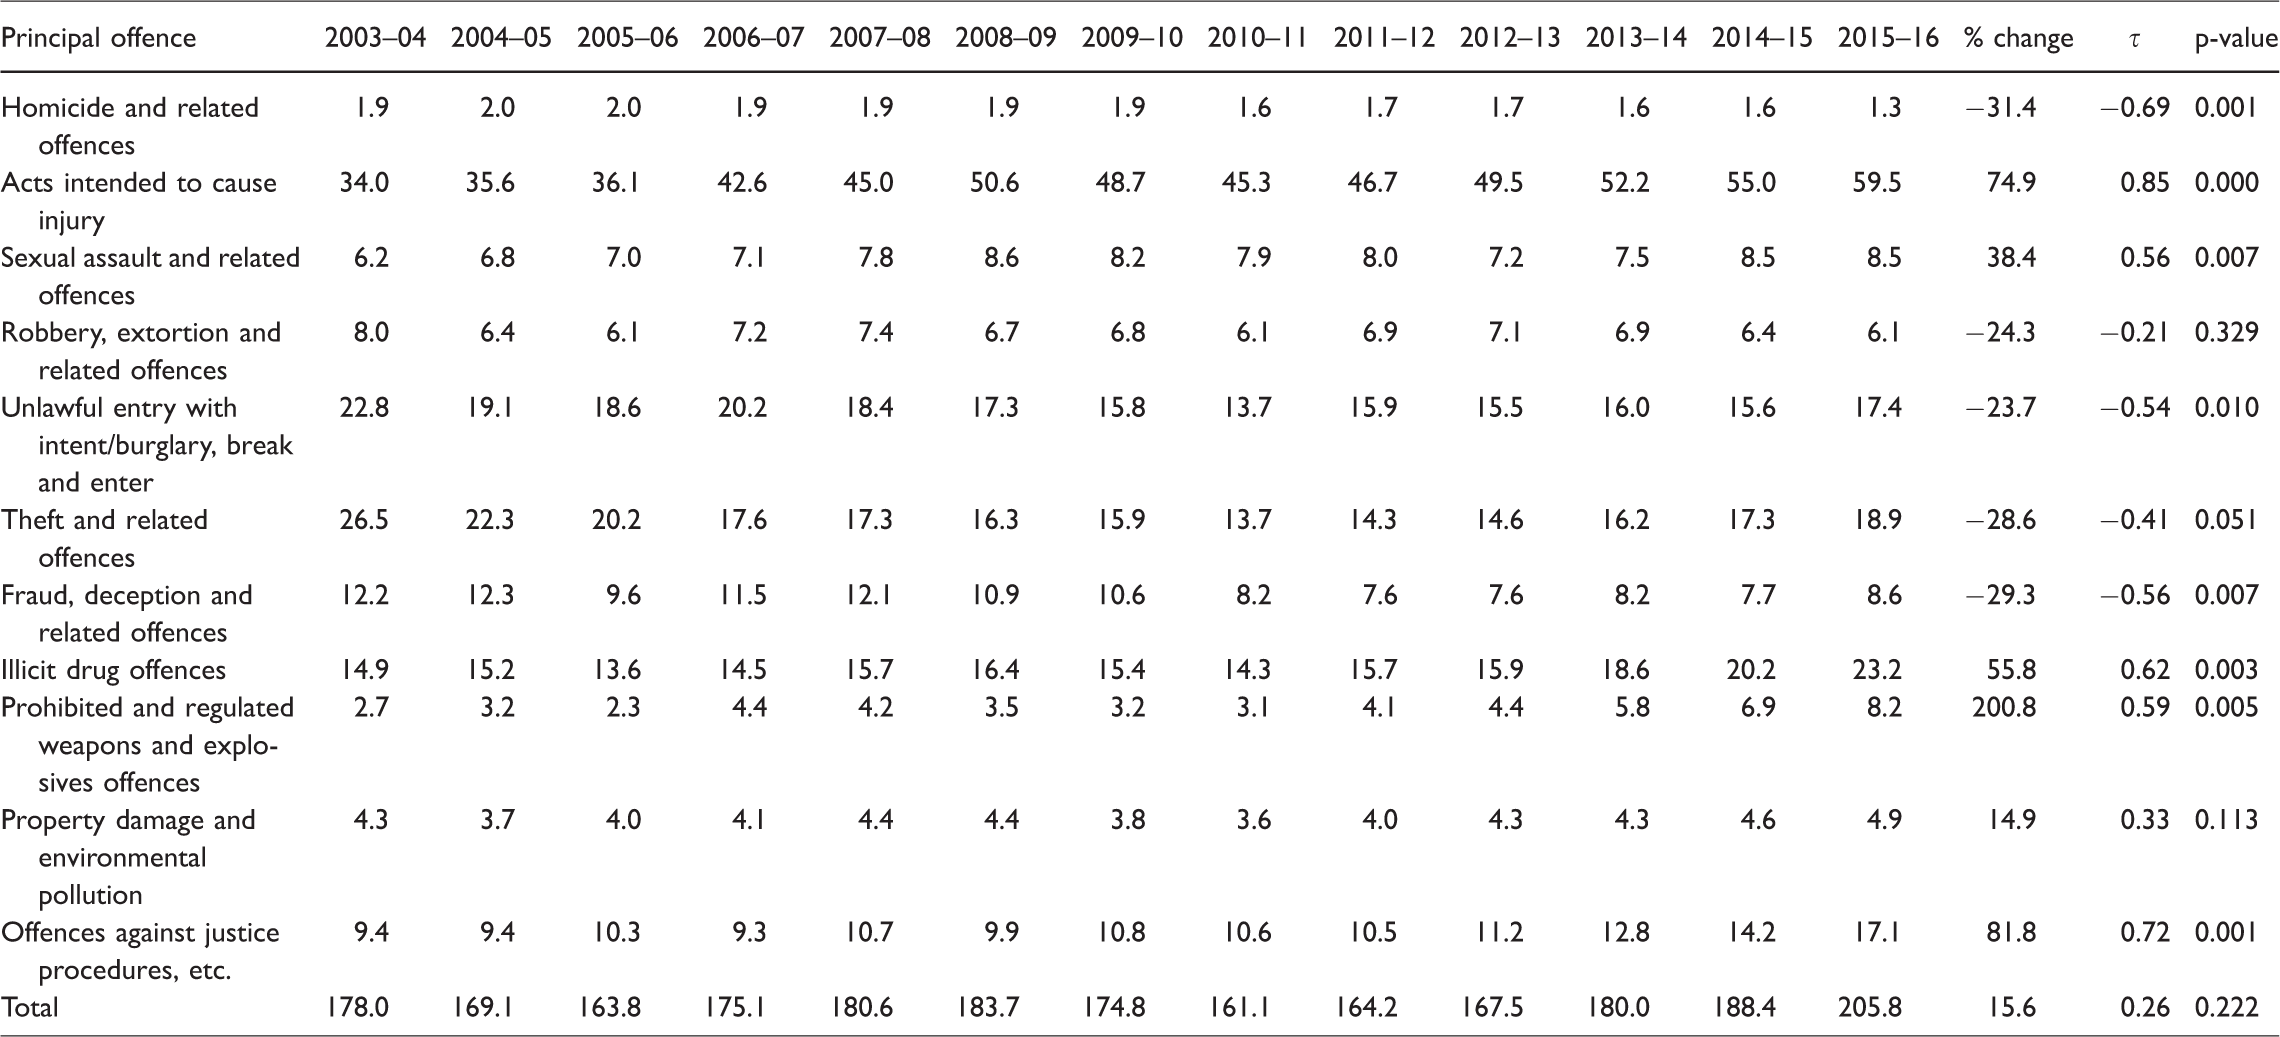
There are substantial and significant increases in the rate at which convicted offenders are being sentenced to prison for Acts Intended to Cause Injury (up 74.9%), Sexual Assault and Related Offences (up 38.4%), Illicit Drug Offences (up 55.8%), Prohibited and Regulated Weapons and Explosives Offences (up 200.8%) and Offences Against Justice Procedures (up 81.8%). The overall increase of 15.6% is not significant but this is mainly because the change in rates has not been monotonic (see Figure 1). The rate at which offenders were being sentenced to prison rose by 16% between 2010/11 and 2015/16 and the increase was statistically significant (τ = 1.0, p = 0.005).
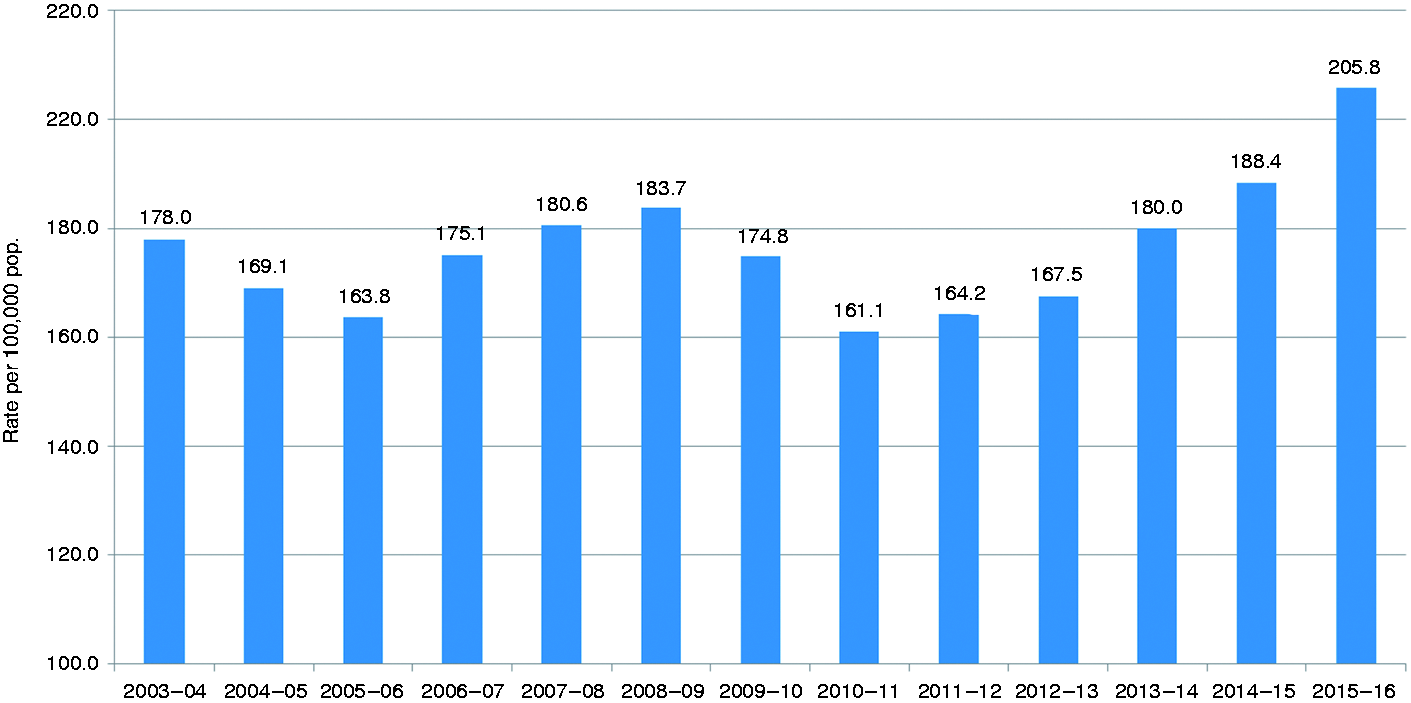
Sentenced prisoner rates per 100,000 pop (Australia 2003/4 to 2015/16).
The rate at which convicted offenders are sentenced to prison is a joint function of the number of proven court appearances and the probability of imprisonment. Table 4 shows the fraction of convicted offenders given a prison sentence, broken down by offence type.
Australia: Fraction of offenders imprisoned.
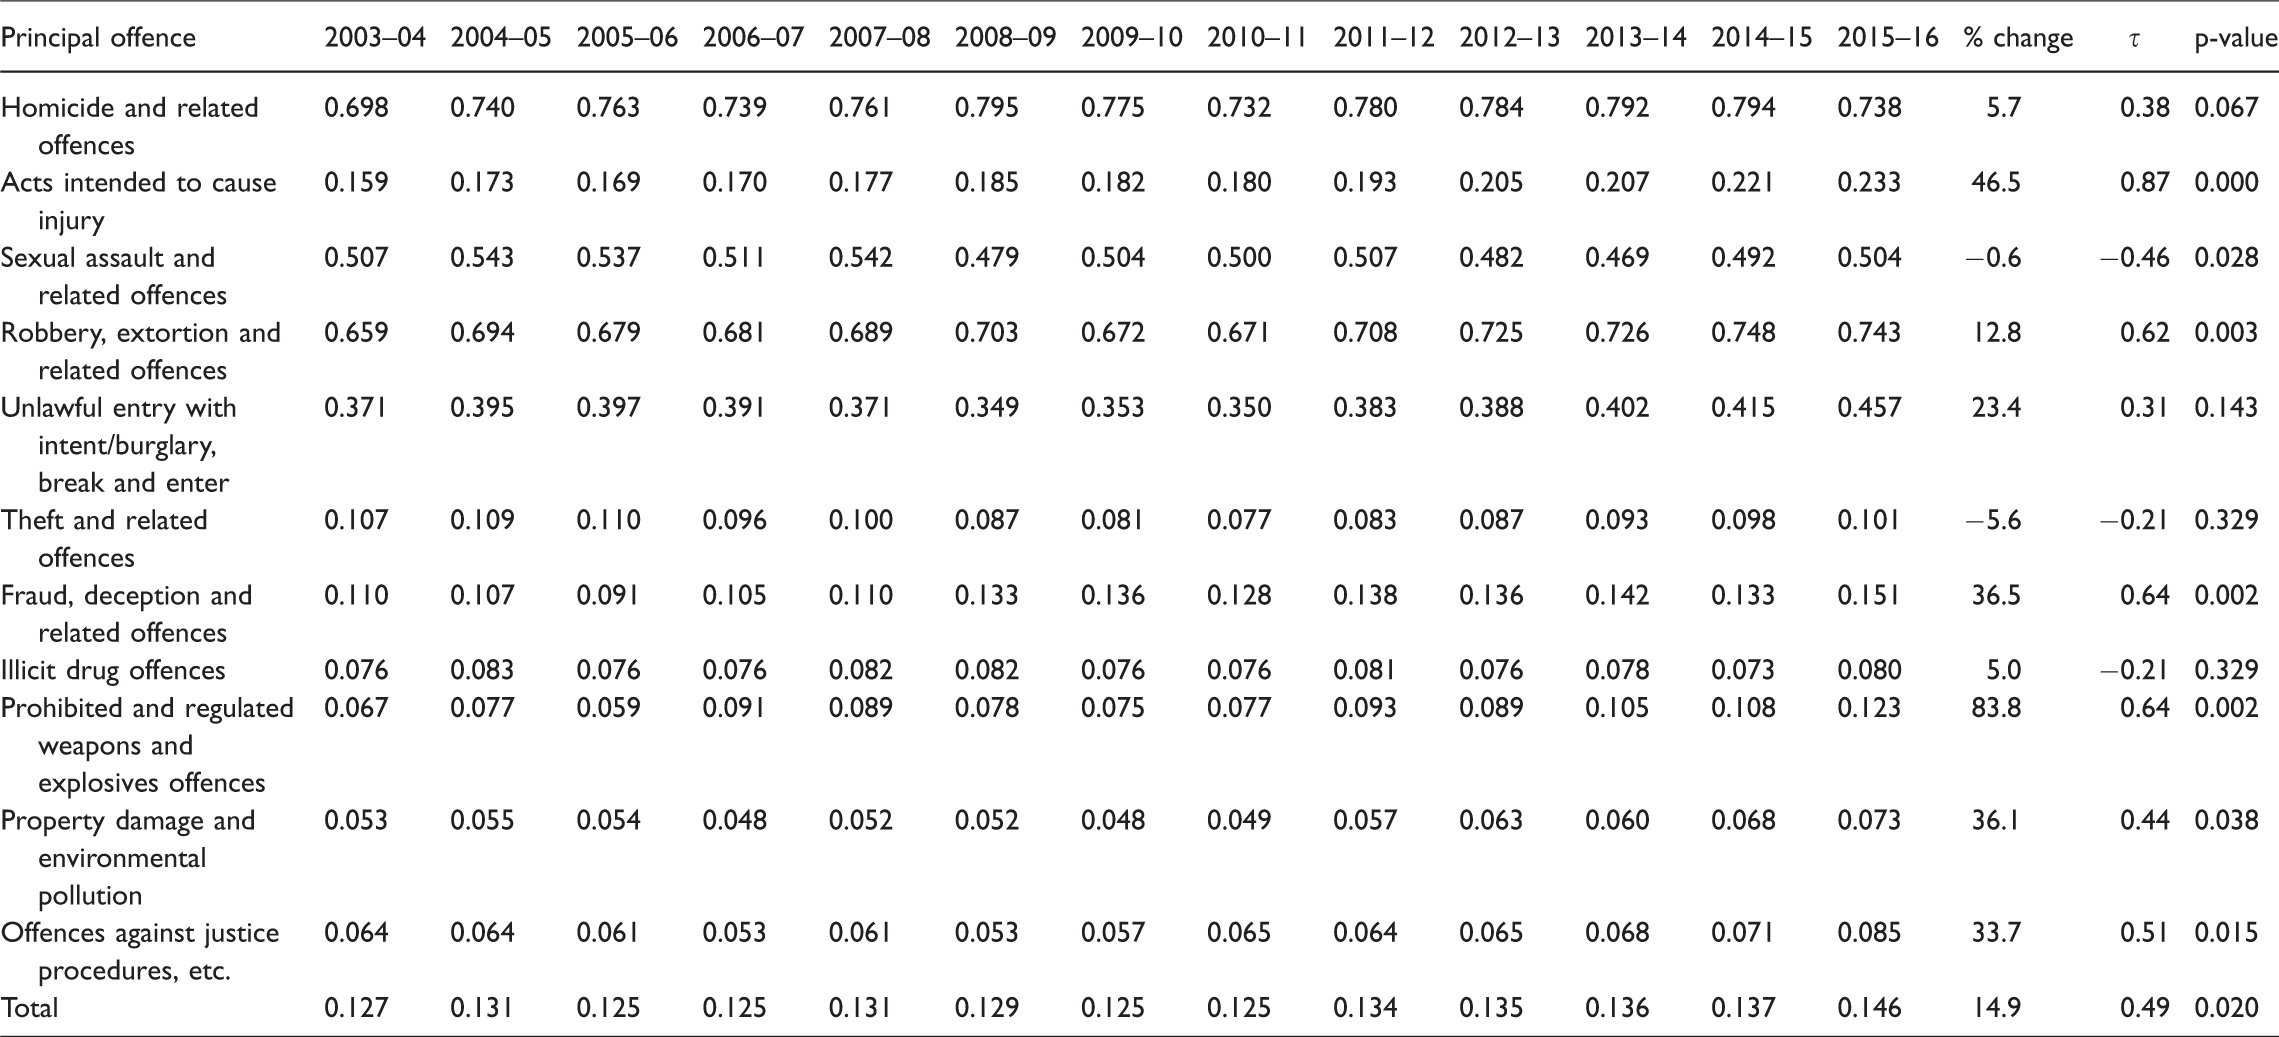
There are significant increases in the fraction imprisoned for Acts Intended to Cause Injury (up 46.5%); Robbery, Extortion and Related Offences (up 12.8%); Fraud, Deception and Related Offences; Prohibited and Regulated Weapons and Explosives Offences (up 83.8%); Property Damage and Environmental Pollution (up 36.1%) and Offences Against Justice Procedures (up 33.7%). The overall increase (14.9%) is statistically significant.
The relative importance of arrest rates and imprisonment risk
Small changes to the percentage imprisoned can have a big effect on the number entering prison. So can small changes in the percentage of proven offenders for offences which are likely to result in imprisonment. The easiest way to see the relative importance of changes in the number of cases flowing into the criminal justice system and changes in the risk of imprisonment is to contrast the effect on the expected number of sentenced prisons of:
(a) Holding the number of proven offenders constant and allowing the fraction imprisoned to vary: (b) Holding the fraction imprisoned constant and allowing the number of proven offenders to vary.
The scenario that best approximates the actual growth in persons sentenced to prison provides an answer to the question of what best explains the growth in persons sentenced to prison. Figure 2 does this.
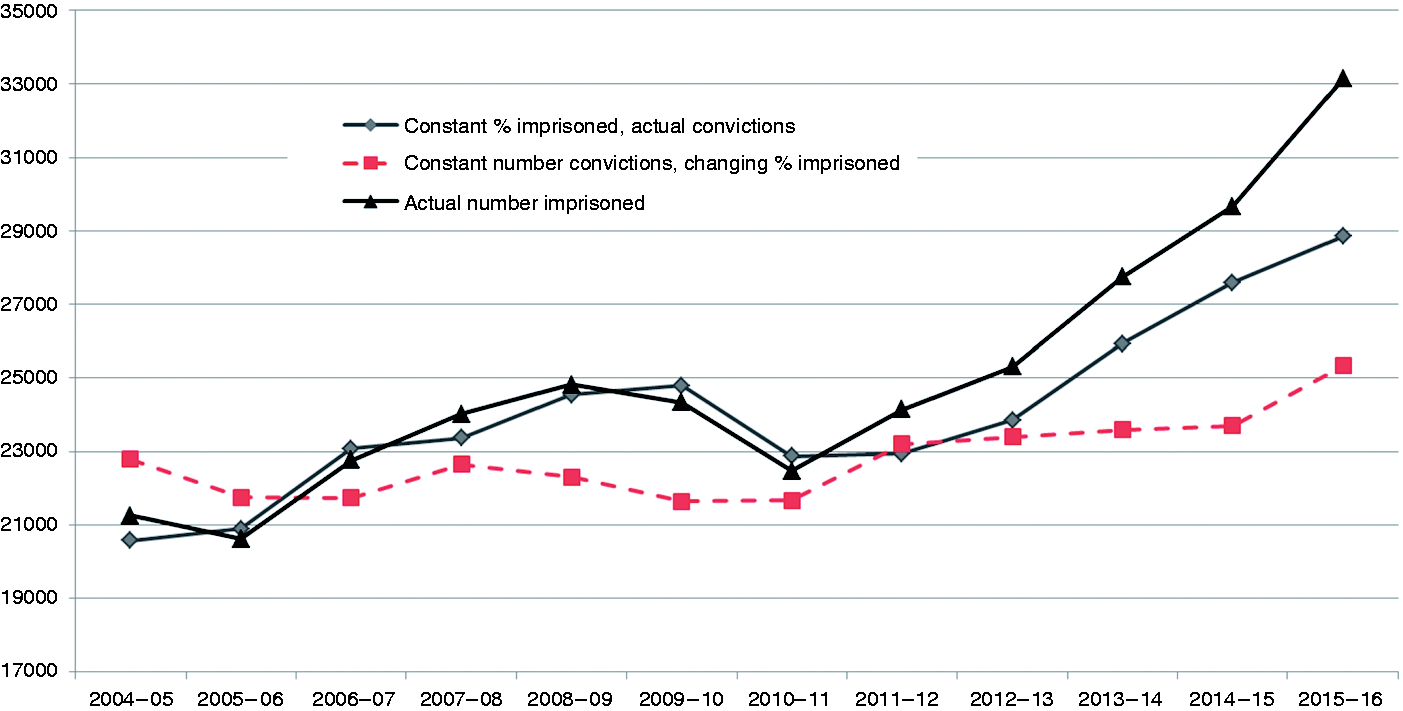
Predicted and actual number receiving a prison sentence (Australia 2004/5 to 2015/16). Source: Australian Bureau of Statistics (2017b).
The black line with triangle markers shows the actual number imprisoned in each year from 2004/5 to 2015/16. The dashed grey line with square markers shows the number that would have been imprisoned if the number of proven offenders had remained constant at its 2003/4 value and the percentage imprisoned assumed its actual values over the period 2004/5 to 2015/16. The grey line with diamond markers shows the number that would have been imprisoned if the percentage imprisoned had remained at its 2003/4 value and the number of proven offenders assumed its actual values over the period 2004/5 to 2015/16.
While neither scenario on its own provides a complete explanation for the upward trend in sentenced prisoners (especially after 2010–11), it is obvious that the scenario of rising numbers of proven offenders and constant fraction imprisoned provides a closer approximation to the trend in numbers of persons imprisoned than the scenario of constant numbers of offenders and rising imprisonment risk. Put more simply, most of the growth in persons sent to prison between 2003/4 and 2015/16 has come from changes in the number of persons convicted, rather than changes in the percentage of convicted offenders imprisoned.
Trends in sentence length
It is not possible to obtain national data on the lengths of stay of persons exiting custody. It is possible, however, to obtain data on both the aggregate sentence 3 imposed on those currently serving a prison sentence and on the expected length of stay 4 of those same offenders. Any increase in sentence length should show up in one or both of these measures. Table 5 shows the trend in the average aggregate sentence imposed on offenders held in prison between 2002 and 2016.
Australia. Mean aggregate sentence (months).
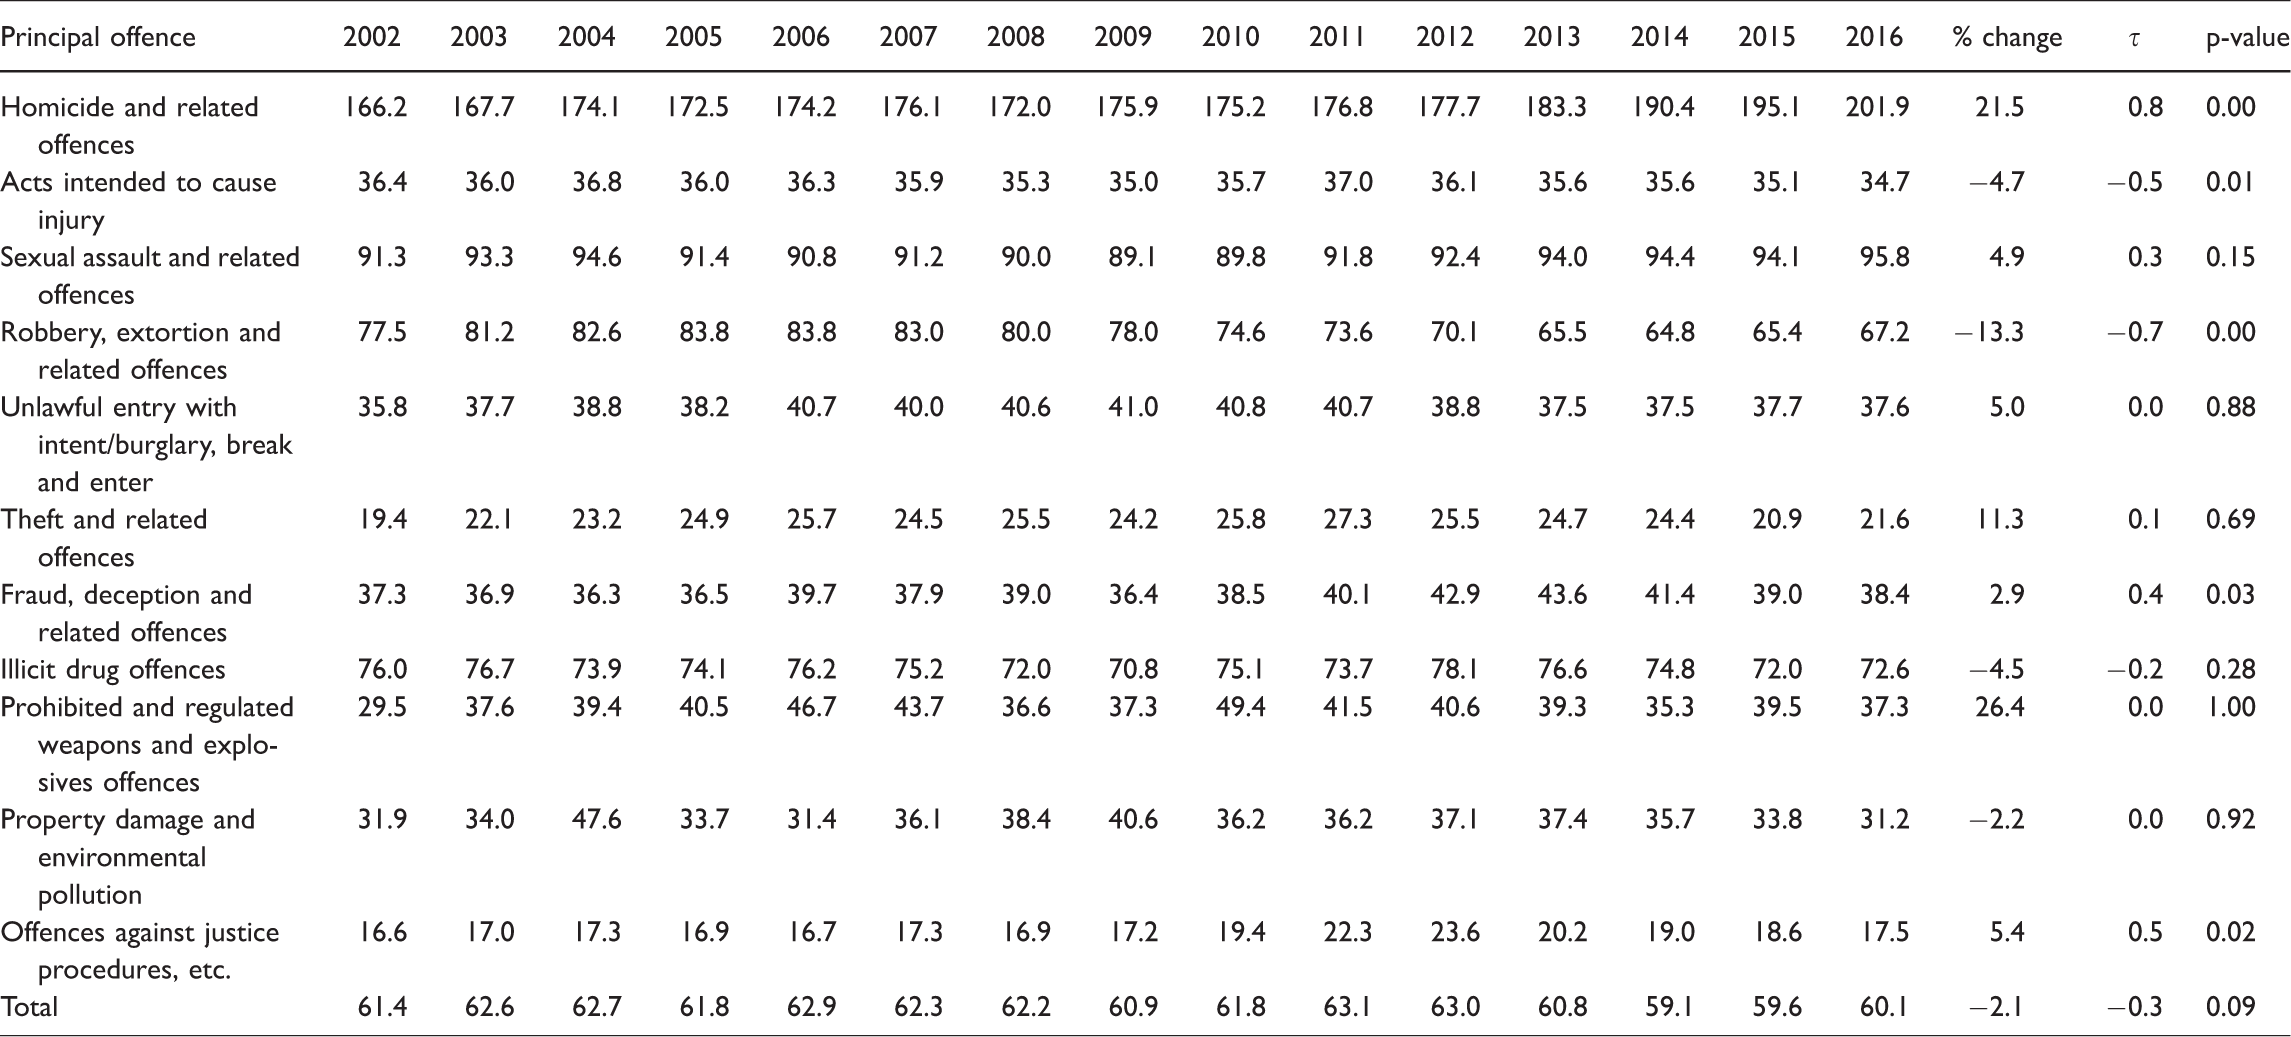
There are significant increases in aggregate sentence length for Homicide and Related Offences (up 21.5%); Fraud, Deception and Related Offences (up 2.9%) and Justice Procedure Offences (up 5.4%). Because there are substantial decreases in average aggregate sentence length for some offences (e.g. Robbery, Extortion and Related Offences), the overall change is down (−2.1%) although the change is of borderline significance (p = 0.09).
Table 6 shows the trend in the average expected time to serve among offenders held in prison between 2002 and 2016.
Mean expected time to serve (months).
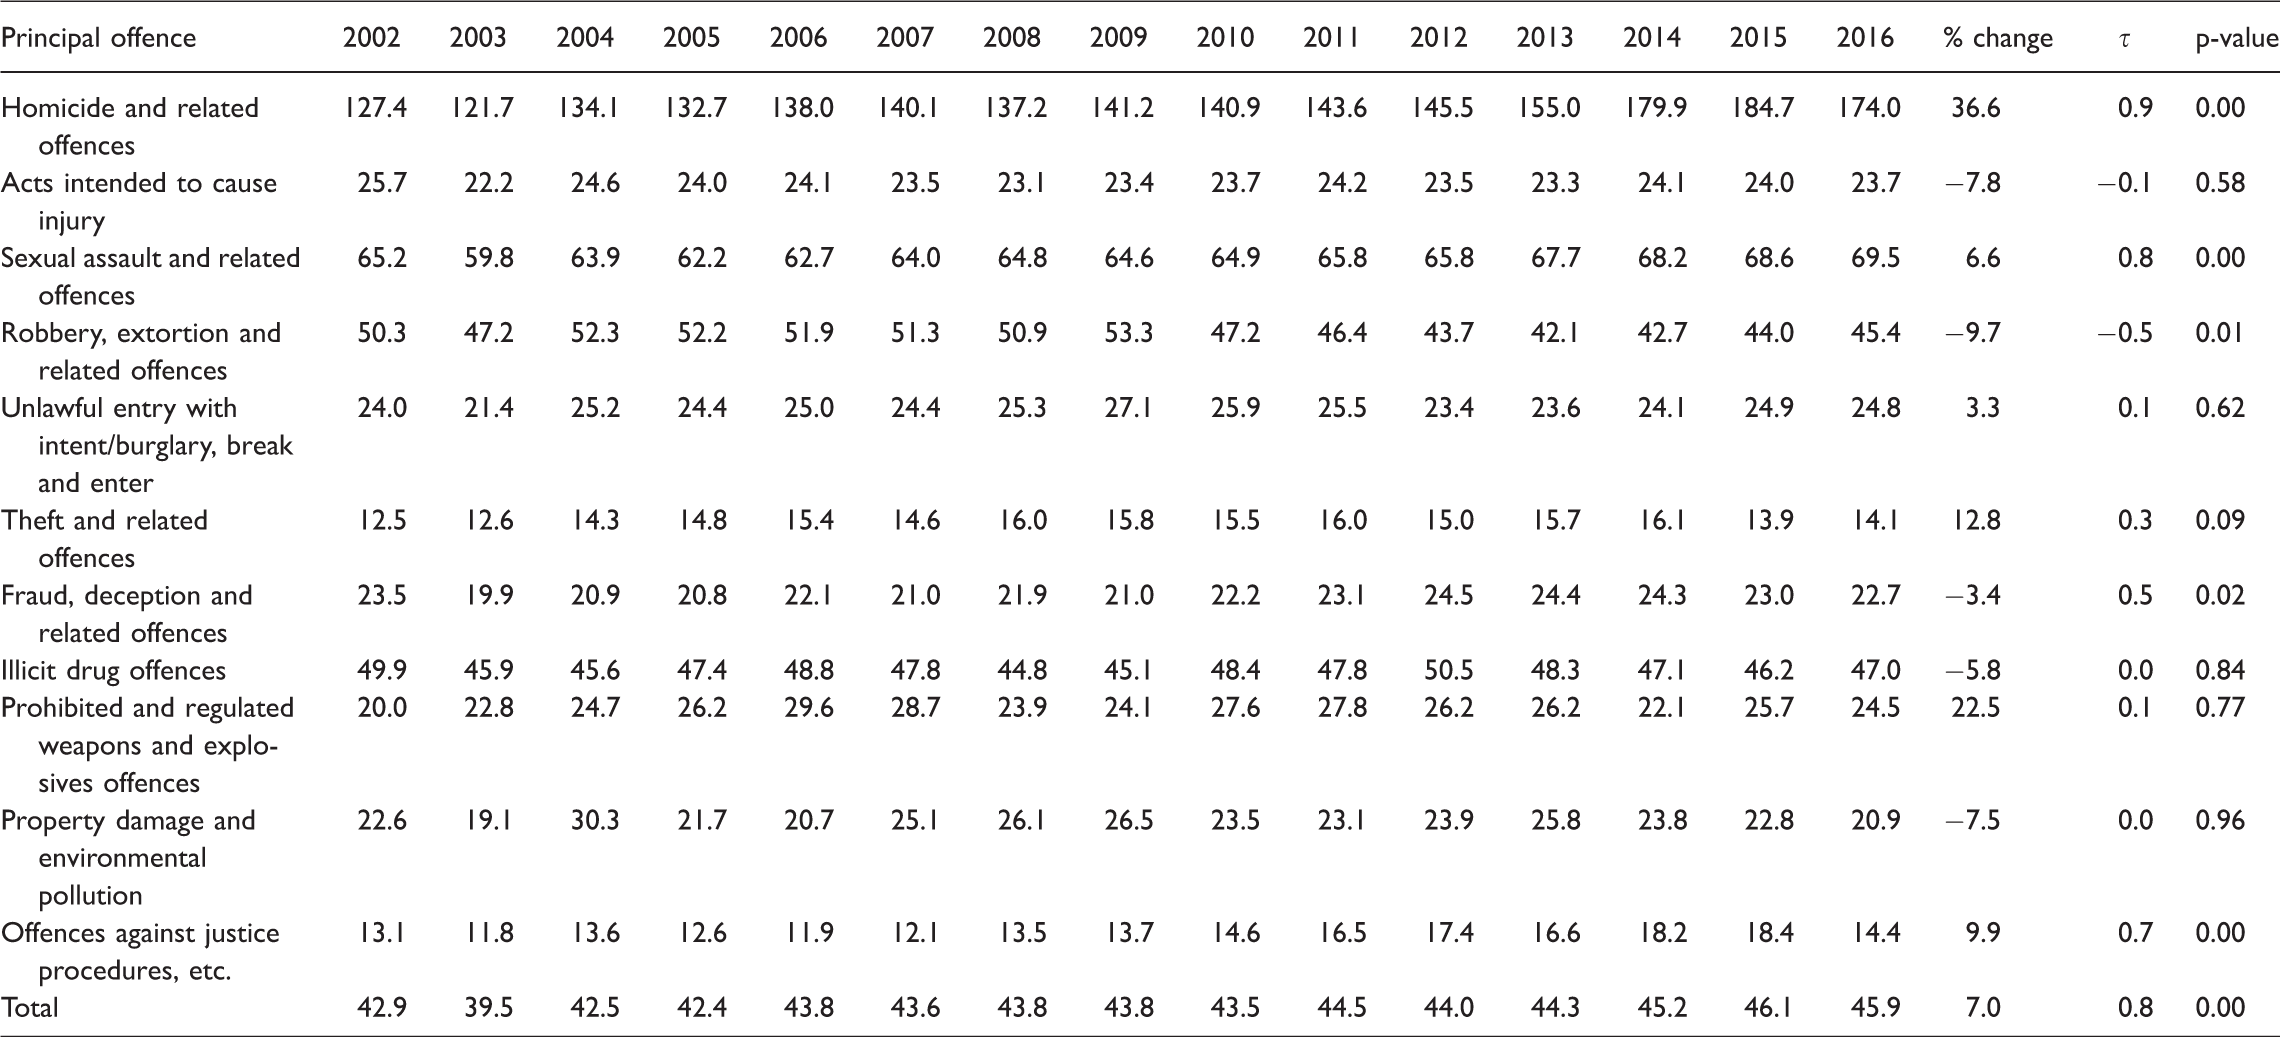
There are significant increases in the expected time to serve for Homicide and Related Offences (up 36.6%), Sexual Assault and Related Offences (up 6.6%) and Justice Procedure Offences (up 9.9%). The overall change (up 7.0%) is significantly up but the growth is only half that of the growth in the rate at which convicted offenders are entering prison. In some cases (e.g. Acts Intended to Cause Injury; Robbery, Extortion and Related Offences) moreover, the average expected time in custody has gone down. There is not much evidence, then, that imprisonment rates have been pushed up by a general increase in the length of time offenders are spending in custody.
Why the increase in court appearances?
The evidence presented so far suggests that the growth in Australian imprisonment rates between 2002 and 2016 is partly due to changes in the proportion of offenders imprisoned and the length of time they spend in custody but mainly due to changes in the rate of appearance in court for offences that are likely to result in imprisonment if the offender is convicted. The most noteworthy of these (in terms of volume of offenders entering prison) are Acts Intended to Cause Injury, Sexual Assault and Related Offences; Illicit Drug Offences and Justice Procedure Offences. Why, one might ask, did the number of people coming before the criminal courts for these offences increase? It is impossible to give a definitive answer to this question but a closer look at the individual offences within these general categories provides some clues.
Appendix 1 provides a detailed breakdown of offence type within the national criminal court statistics collection for the financial years between 2008/9 (the first year for which such a breakdown is available) and 2014/15. Here I just summarise the pertinent changes.
The subcategory in Acts Intended to Cause Injury showing the largest growth was Stalking. Between 2008/9 and 2015/16 the number convicted of Stalking rose by 94% (from 2801 to 5426). Stalking is an offence most commonly linked to family violence. In NSW, for example, 74% of the offences in the Stalking category (most of which actually involve intimidation) are classified as family violence offences (NSW Bureau of Crime Statistics and Research, 2017).
The growth in recorded stalking offences could be taken as indicative of a real growth in crime but the speed of the increase in NSW suggests that, in that State at least, it is far more likely to reflect a change in policing policy. In that state, the number of convictions for stalking/intimidation rose from two in 2009 to 4166 in 2016. In the two-year period between 2009 and 2010, the number convicted of this offence rose from two to 210 (NSW Bureau of Crime Statistics and Research, 2017). The rapid increase in this offence may be a result of the fact that, in NSW at least, it carries a higher maximum penalty and less onerous evidentiary requirements than the offence of failing to comply with an apprehended violence order.
The largest changes in the sexual assault category were Non-Assaultive Sexual Offences Against a Child (up 36.8%, from 375 to 513) and Child Pornography Offences (up 17.9% from 778 to 917). There are no good measures of the prevalence or incidence of either of these offences. Both, however, have been the subject of extensive publicity, in large part due to revelations in the course of the Royal Commission into Institutional Responses to Child Sexual Abuse (Commonwealth of Australia, 2017a). Both have also been the subject of intensified law enforcement. NSW, for example, established a Sex Crimes Squad and the Joint Investigation Response Squad ‘to ensure provision of a specialist adult sexual assault and child protection service to support Local Area Commands across NSW’ (NSW Police, 2016a). It also established a Child Exploitation Internet Unit to deal with child pornography (NSW Police, 2016b). It seems likely, therefore, that much of the growth in court appearances for this offence, as with intimidation/stalking, is due to a combination of heightened public awareness and increased law enforcement (viz. changes in policing policy).
The largest changes in the Illicit Drug Offence category involved people convicted of Other Illicit Drug Offences (e.g. permit premises to be used to take, sell or distribute drugs) (up 138%, from 3902 to 9292), Possess/Use Illicit Drugs (up 70%, from 22,296 to 37,201), Deal or Traffic Illicit Drugs (up 44%, from 7790 to 11,250) and Import or Export Illicit Drugs (up 22%, from 324 to 396). While the Australian Bureau of Statistics national court statistics data do not provide any indication of the type of drug involved, it is likely much of the growth in recorded drug offences relates to amphetamine-type substances (ATS) such as methamphetamine. The number of ATS seizures at the border and their combined weight has grown dramatically since 2006/7, as has the number and weight of domestic ATS seizures (Commonwealth of Australia, 2017b). Past research has shown a fairly close relationship between arrests for use and possession of ATS and emergency department admissions for ATS overdose (Moffatt, Wan, & Weatherburn, 2011). This suggests the growth in arrests is a reflection of the growth in the illegal ATS market.
Most of the growth in Justice Procedure Offences has come from Breach of Violence and Non-violence Restraining Orders, which increased by 71.4% (from 11,855 to 20,325). There is no particular reason to believe those who are the subject of these orders have become more willing to breach them, although I cannot rule this possibility out. A more likely explanation though, especially considering the speed with which the breach rate has risen (Weatherburn & Holmes, 2017), is that more orders are being issued and police are taking a more proactive stance in relation to their enforcement. In NSW, for example, the number of apprehended domestic violence orders (ADVOs) issued by the courts rose by 20% between 2008 and 2016 (NSW Bureau of Crime Statistics and Research, 2017). Over the same period, the number of people appearing in the NSW Local Court for breaching the conditions of an ADVO rose by more than 140% (NSW Bureau of Crime Statistics and Research, 2017). Once again, then, it appears that the toughening of police responses to family violence is a key reason for the rise in rates of imprisonment.
The contribution of bail policy
We turn now to the question of whether and to what extent changes in bail policy contributed to the growth in Australia’s imprisonment rate. As noted earlier, our ability to answer this question is constrained by lack of data.
On the surface it certainly looks as if bail policy has in fact had a significant impact on prison population growth in Australia. Between 2002 and 2016, the number of Australian unsentenced prisoners more than doubled, from 29.4/100,000 of population to 63.5/100,000 of population. Many defendants, however, move from remand to sentenced custody with their sentences of imprisonment backdated to the point of entry on remand. Some proportion (perhaps all) of the time spent in custody on remand is absorbed by any subsequent custodial sentence. A growth in the size of the remand population is not therefore unequivocal evidence that bail policy is contributing to the growth in the prison population. Indeed it is not unknown to see an initial growth in remand is followed by a growth in the sentenced prisoner population and a contemporaneous decline in the remand population This ‘moving bubble’ pattern has been observed in NSW over the last few years (Corrective Services NSW, 2017).
Of course, by definition, defendants on remand who are acquitted of all charges cannot be thought of as in transition from remand to sentenced prisoner status. The limited available evidence available, however, suggests that this percentage is not especially high. In NSW, for example, the proportion of remandees subsequently acquitted of all charges is less than 2% and has shown no signs of increasing (NSW Bureau of Crime Statistics and Research, 2017). 5 What about defendants held on remand who are convicted but given a non-custodial sentence? Could it not be said that these people make an independent contribution to the size of the prison population? The answer is undoubtedly ‘yes’ but to contribute to the growth in Australia’s prison population the percentage of defendants held on remand who are given a non-custodial penalty would have to increase. Once again, there are no national trend data on this percentage but in NSW the percentage of persons on remand who receive non-custodial penalties has fallen since 2001 (NSW Bureau of Crime Statistics and Research, 2017).
The clearest evidence we have that tougher bail policy has contributed to the growth in the Australian prison population comes from changes in the ratio of remand to sentenced prisoners. Figure 3 shows this ratio for Australia between 2002 and 2016. The ratio remains fairly stable between 2002 and 2010 and then begins to climb, slowly at first and then rapidly between 2014 and 2016.
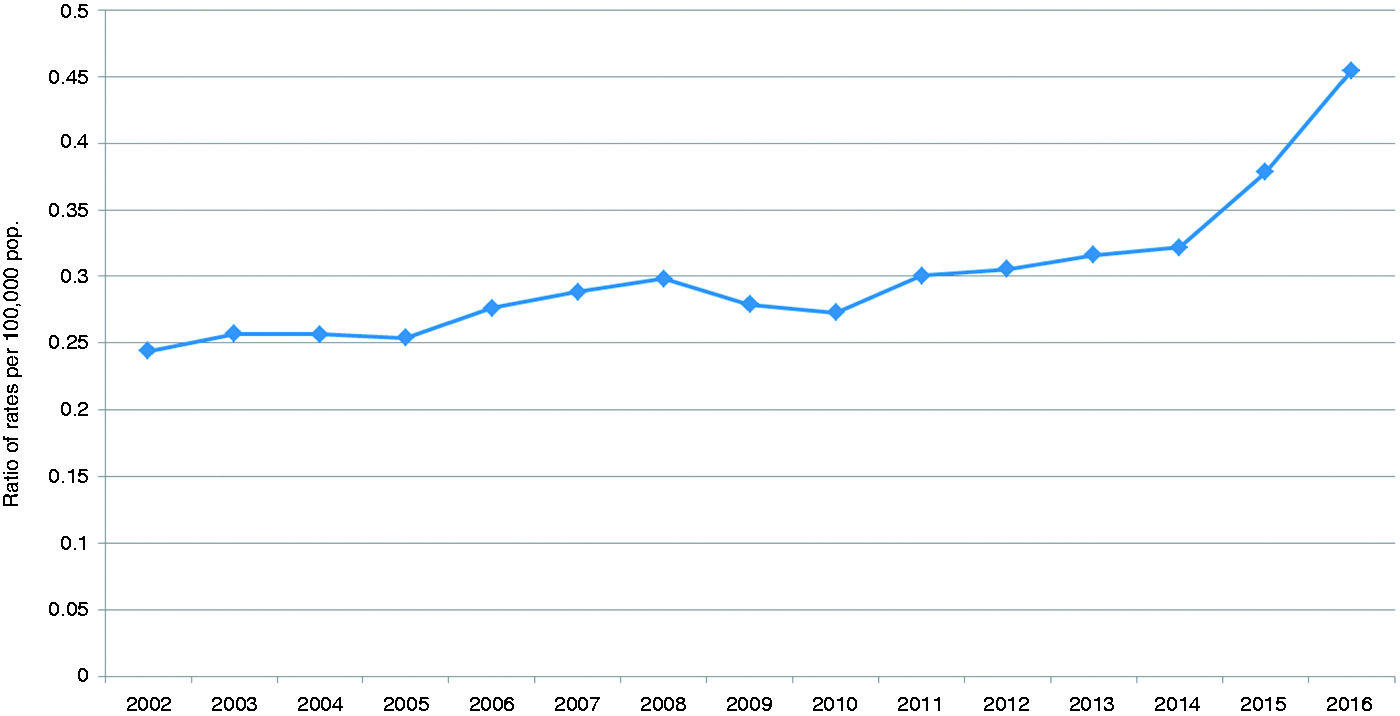
Ratio of remand to sentenced prisoner rates (Australia 2002–2016).
The fact that the ratio is rising provides the clearest evidence we have that a diminishing proportion of remand prisoners are ending up with a custodial sentence, in other words that bail policy has contributed to the growth in the Australian prison population. Even this fact, however, is open to other interpretations. It is possible those who spend long periods on remand are given non-custodial penalties precisely because of the long periods they have spent on remand. Moreover, as with the sentenced prisoner population, the size of the remand population is a joint function of the rate of arrival on remand and the length of stay. The length of stay is primarily driven by court delay, that is the average time from arrest to case finalisation. It is possible the ratio of remand to sentenced prisoners is rising because prisoners are spending longer on remand waiting for their day in court (see, e.g. Weatherburn et al., 2016). In summary, while there is no doubt about the potential influence of bail policy on prisoner numbers, at present we cannot make an informed judgement about whether and to what extent changes in bail policy contributed to the growth in the Australian imprisonment rate since 2001.
Discussion
The aim of this article was to gauge the relative contributions of crime, policing policy and penal policy to the growth in rates of imprisonment in Australia between 2002 and 2016. The data assembled here suggest that all three factors have played a role. The growth in drug (particularly ATS) use has resulted in a substantial rise in the number of people convicted of and imprisoned for drug use and possession, drug trafficking and drug importation. The influence of penal policy is shown by the fact that the percentage of offenders imprisoned has increased, not just overall, but for particular categories of offence, such as Acts Intended to Cause Injury; Robbery, Extortion and Related Offences; Fraud Deception and Related Offences and Offences Against Justice Procedures.
Figure 2, however, suggests that the growth in rates at which offenders are entering prison owes more to policing than it does to penal policy. There have been substantial increases in the rate at which people appearing before the courts on charges which, if proven, are likely to result in a prison sentence. Many of these offences involve or are likely to involve family violence. Much of the growth in rates of appearance in the categories of Acts Intended to Cause Injury and Justice Procedure Offences has come from offences such as Stalking and Breach of Violence Order, both of which often arise in the context of family violence. The rate of appearance in court for Sexual Assault and Related Offences has also grown rapidly, in large part because of increases in the court appearance rate for child sex offences and child pornography. These offences have also become the subject of intensive enforcement activity.
The conclusion that penal policy is not the main reason for the growth in imprisonment rates since 2002 will come as a surprise to some. It is important to remember, however, that courts are not mechanical transmitters of legislative intent. They can and often do exercise their discretion in ways that preserve the status quo (see Freiberg, 2017). Many of the most draconian and newsworthy sentencing reforms, moreover, (e.g. ‘three strikes’ sentencing laws, ‘life means life’) only affect a small number of offenders. There are undoubtedly cases where changes in sentencing law have had an impact on sentencing practice. In many cases, however, the effect of increases in the proportion imprisoned or time in custody for particular offences has been offset by (mostly coincidental) reductions in the proportion imprisoned or the time served for other offences. It is also worth remembering that changes in policing policy (e.g. targeting repeat offenders) may be responsible for some of the growth in the proportion of offenders receiving a custodial sentence.
All empirical analyses are subject to caveats and there are two that should be mentioned here. The first caveat is that sentencing reforms that result in longer sentences do not begin to affect the prison population until the cohort affected by those reforms reaches the point in their sentence where earlier cohorts would have been released. The full effects of some sentencing reforms (e.g. those requiring imprisonment for life) therefore, may not be felt for some time to come. The second caveat concerns bail. As already noted, the lack of national data on the percentage of defendants refused bail who are acquitted of all charges or given a non-custodial penalty makes it impossible to determine whether changes in bail policy contributed to the growth in the national imprisonment rate. Absence of evidence, however, is not evidence of absence. It remains possible that changes to bail law did contribute to the increase in prisoner numbers. It is to be hoped, therefore, that the Australian Bureau of Statistics finds it possible in the near future to begin publishing information on the penalties imposed on convicted offenders broken down by bail status and time spent on remand.
This said, the current findings should serve as a cautionary note on viewing trends in imprisonment solely through the lens of penal policy. Changes in sentencing policy may capture much more media attention than changes in crime or policing policy but both tend to change far more rapidly than sentencing. Viewed in hindsight, it is surprising how little attention has been paid to the influence of crime and policing policy on imprisonment rates. Most major categories of crime may be down but arrests for methamphetamine use and trafficking have risen rapidly over the last 10 years. Police, moreover, have been urged to take a tougher line on a host of other crimes, including trafficking in ‘party’ drugs, family violence, gun crime and alcohol-related violence. Demands for greater public sector accountability have seen some State Police Forces required to set public targets for crime reduction (NSW Government, 2017). New policing strategies, such as the NSW Suspect Target Management Plan (Crawford, 2016) have also have been developed, which focus police attention on recidivist offenders. These offenders are both more likely to be refused bail and more likely to be imprisoned if convicted. We should hardly be surprised to find that all this has put significant upward pressure on the Australian prison population.
Footnotes
Acknowledgements
The author would like to thank Ms Anna Ferrante for valuable feedback on an earlier draft of this article.
Declaration of conflicting interests
The author(s) declared no potential conflicts of interest with respect to the research, authorship, and/or publication of this article.
Funding
The author(s) received no financial support for the research, authorship, and/or publication of this article.