
Abstract
Background.
The Nordic Mobility Related Outcome Evaluation of Assistive Device Intervention (NOMO 1.0) instrument evaluates the effectiveness of mobility devices in assessing mobility-related participation, captured by three scales (Need for Assistance, Frequency, and Ease/Difficulty) and one index (Participation Repertoire).
Purpose.
This study aimed to investigate a range of psychometric properties of the NOMO 1.0 in a sample of adult powered mobility device (PMD) users.
Method.
Data collected from PMD users (N = 248) in Denmark, Finland, and Norway as part of a larger study were analyzed using state-of-the-art statistical methods.
Findings.
The acceptability and applicability of the NOMO 1.0 items were generally within recommended values. Some floor/ceiling effects were found and the reliability was acceptable for only the Frequency scale. The factor analysis identified one component for the Need for Assistance scale and six components of the Frequency scale.
Implications.
The NOMO 1.0 should be used for research purposes and not for clinical practice. Better reliability should be established for the Need for Assistance and Ease/Difficulty scales prior to further psychometric testing to establish the validity of the NOMO 1.0.
Assessments of effectiveness of assistive device use in terms of participation—defined as taking part in a life situation (World Health Organization [WHO], 2001)—are central to clinical practice and research. These assessments are critical for making improvements in the quality of interventions (Kottner et al., 2011; Lenker et al., 2010). For that purpose, instruments with known psychometric properties are required (Lenker, Scherer, Fuhrer, Jutai, & DeRuyter, 2005) to support researchers and clinicians in using reliable and valid instruments (de Vet, Terwee, Mokkink, & Knol, 2011). In this study we investigated a set of psychometric properties of the Nordic Mobility Related Outcome Evaluation of Assistive Device Intervention (NOMO 1.0) instrument. As reliability and validity are context specific (Mokkink et al., 2012; Streiner & Norman, 2008), there is a need to test the NOMO 1.0 in samples of specific user groups. The user group of concern in the present study was users of powered wheelchairs and scooters (hereafter denoted powered mobility devices [PMDs]).
The NOMO 1.0 Instrument
The NOMO 1.0 was constructed 10 years ago, with cooperation from all five Nordic countries, to evaluate mobility device use in terms of mobility-related participation, that is, participation involving mobility (Brandt, 2005). At that time, a literature review did not identify any instruments that evaluated effectiveness in terms of mobility-related participation. Since then, instruments such as the Functional Mobility Assessment (Kumar et al., 2013) and the Assistive Technology Outcome Measure (Harris & Sprigle, 2008) are used in some regions, but they are not available in Nordic languages. Therefore, there is a need for the NOMO 1.0, and consequently, psychometric testing of the instrument is required. The NOMO 1.0 is a 24-item instrument that aims to evaluate the total mobility assistive device solution of an individual (Brandt et al., 2009). Theoretically, the instrument was based on the International Classification for Functioning, Disability, and Health (ICF), which holds that assistive devices are environmental factors that together with other environmental factors, personal factors, and body functions influence participation (WHO, 2001).
The NOMO 1.0 items were selected from the activities and participation chapters of the ICF document (WHO, 2001) and were subsequently discussed with users of mobility devices, mobility device experts, and researchers in each country (Brandt et al., 2008; Brandt, Kreiner, & Iwarsson, 2010). The NOMO 1.0 evaluation is made by a structured face-to-face interview format and consists of a descriptive Part A and outcomes Part B (see Figure 1). Part A consists of personal and environmental factors that are used to describe the sample(s), for example, information about demographics, types of mobility devices used, means of transportation, functional limitations/self-reported health, living arrangements, and housing. The outcomes Part B consists of three scales and an index: Need for Assistance with Mobility (four items), Frequency of Participation, and Ease/Difficulty with Mobility (the same 20 items each) and the mobility-related Participation Repertoire index. All of them were tested in the present study. The items of the Need for Assistance scale are rated on a 4-point scale ranging from no help (1) to much help (4), while those of the Frequency scale are rated on an 8-point scale ranging from daily (1) to never (8). When respondents give a response other than never to the items of the Frequency scale, they continue with the assessment and respond to the Ease/Difficulty scale. The items of the Ease/Difficulty scale are rated on a 5-point scale ranging from very easy (1) to very difficult (5). A does not know response option is also available. For all scales, does not wish to answer and reason unknown response options are also available (Brandt et al., 2008). The mobility-related Participation Repertoire index is the number of items rated between 1 and 7 on the Frequency scale (B5–B24; see Figure 1).
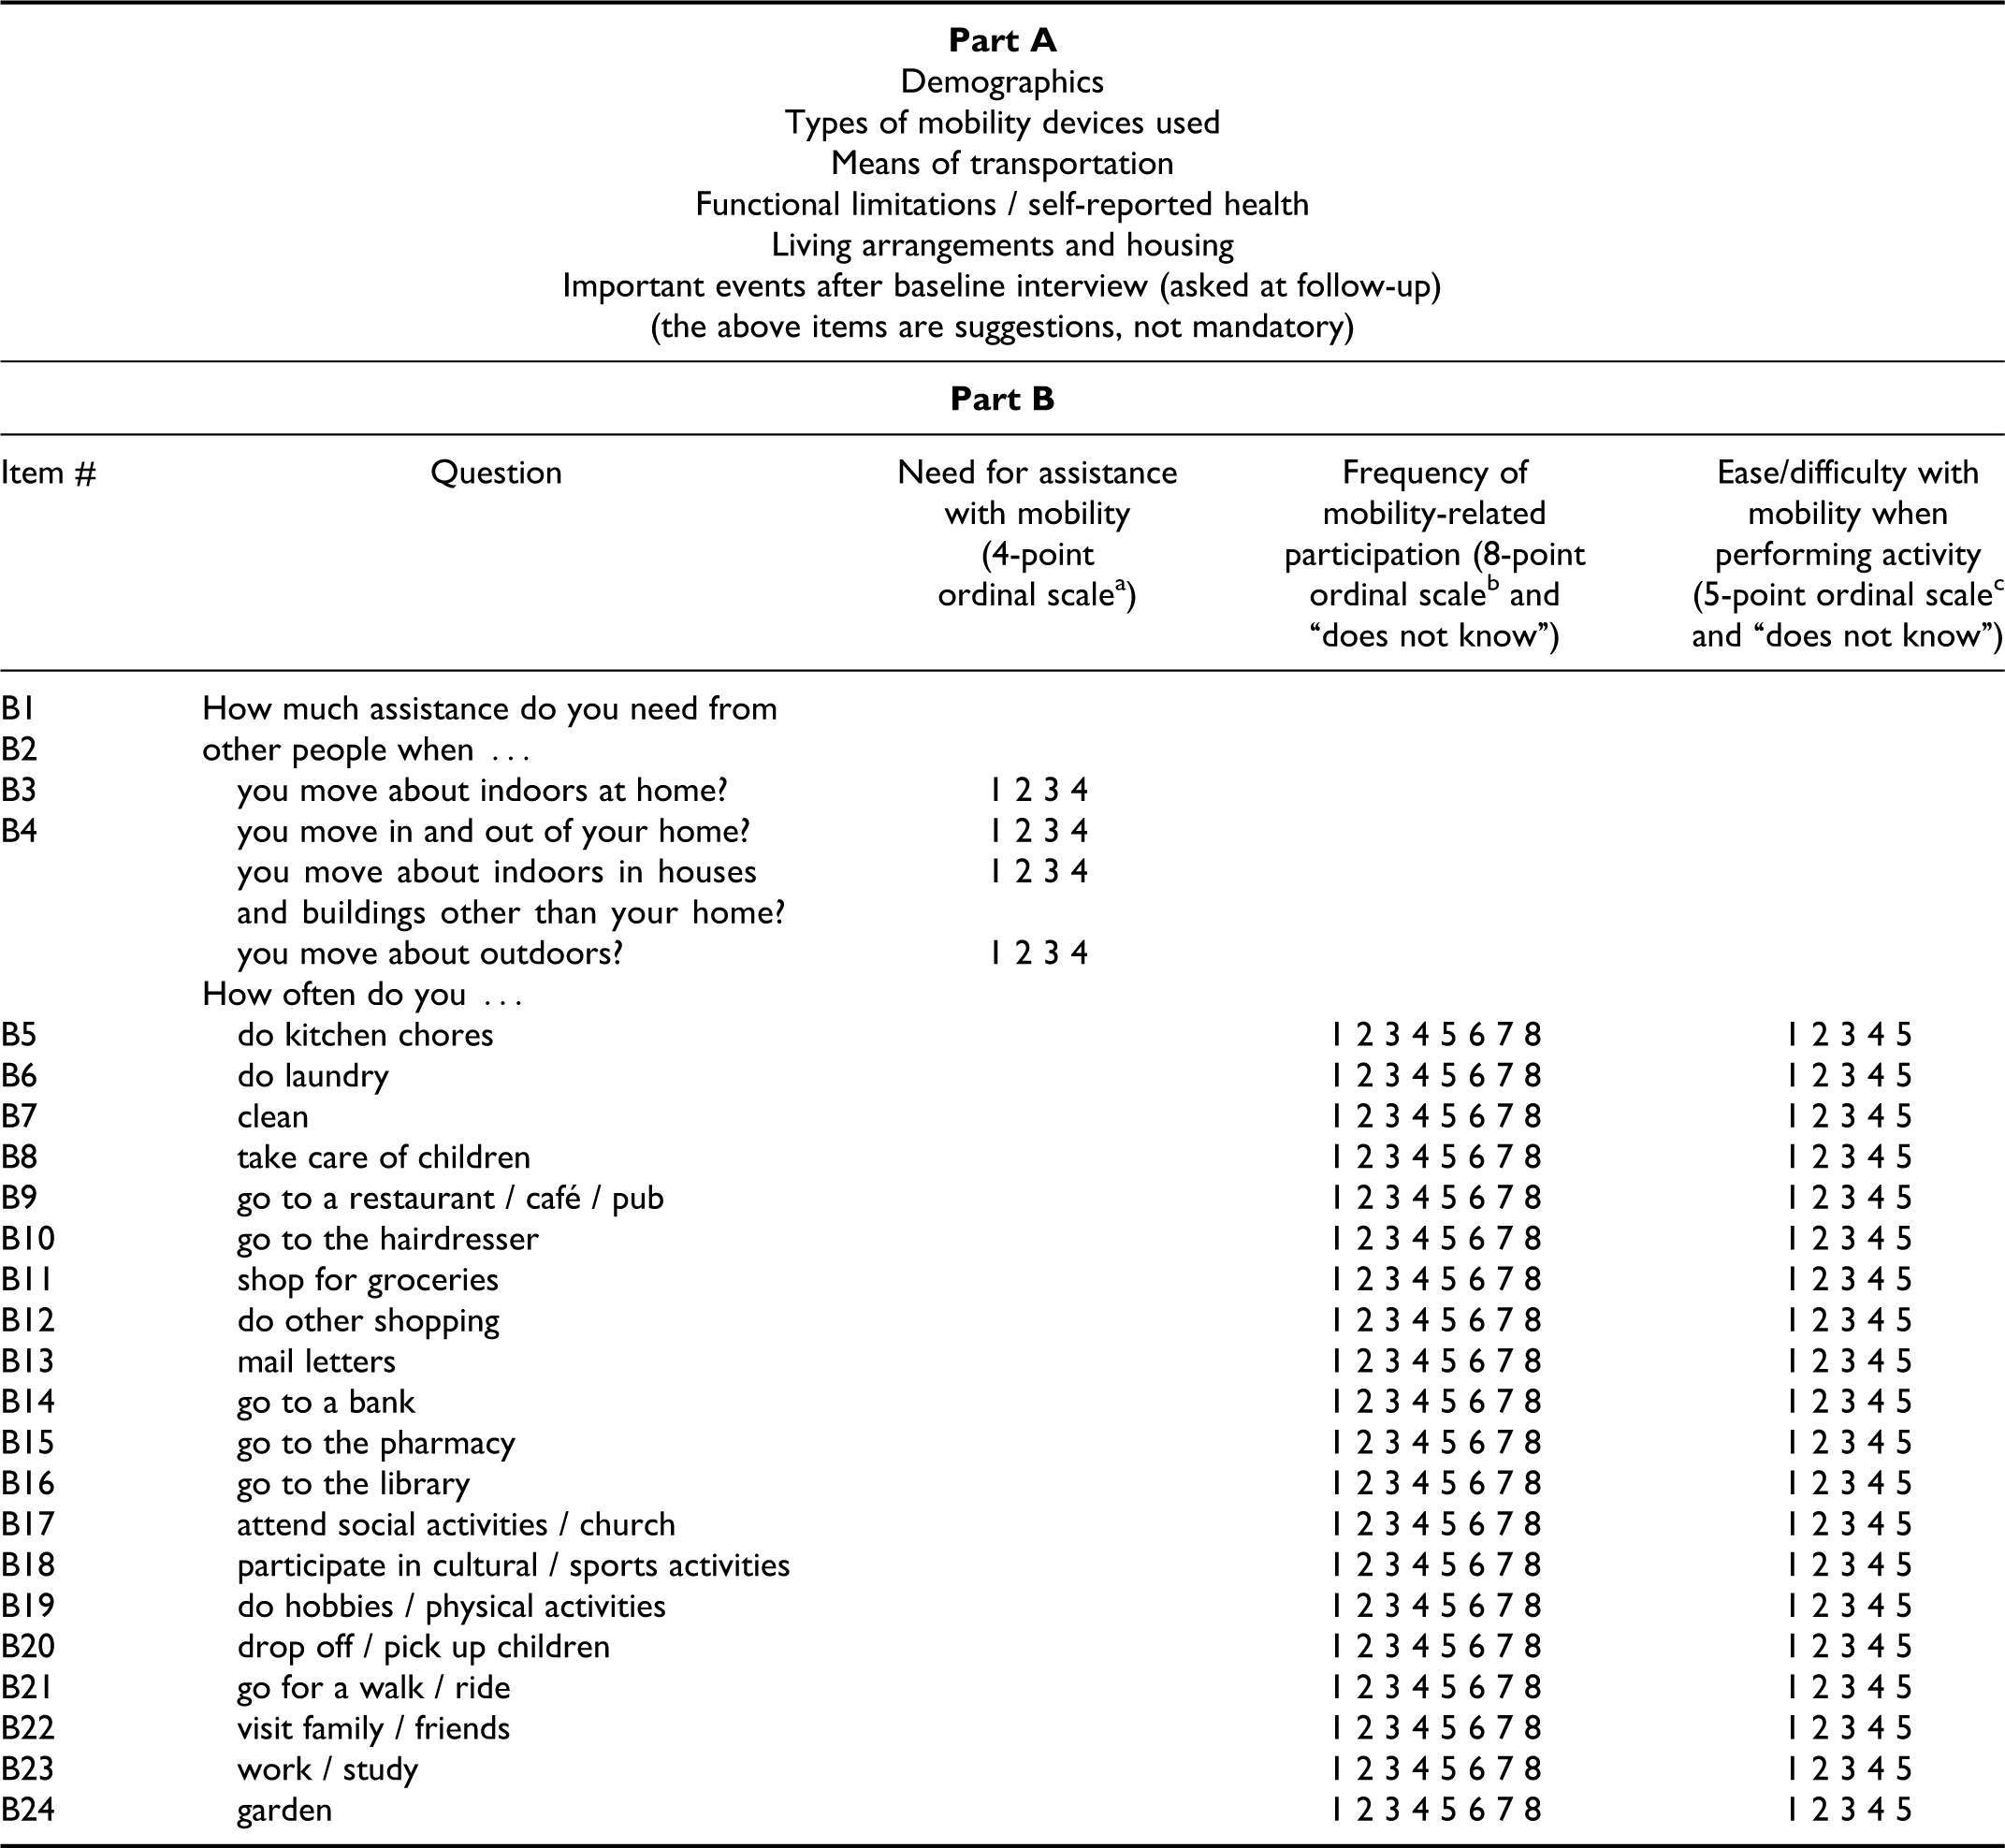
Part A and Part B of the Nordic Mobility Related Outcome Evaluation of Assistive Device Intervention (NOMO 1.0) instrument.
The NOMO 1.0 consists of a baseline version to be administered shortly before the respondents receive a new mobility device and a follow-up version to be used after the respondents have used their device for at least 3 to 4 months (Brandt et al., 2009). The Part A follow-up version also has questions about possible changes in health conditions and social events as the baseline interview, while the Part B follow-up version is identical to the baseline version. The significant difference in the scores of each item of the three scales and the index between baseline and follow-up express the effectiveness of the mobility devices. The NOMO 1.0 assessment and manual are available only in four Nordic languages (Brandt et al., 2009).
A test-retest reliability and internal consistency study of a first version of the instrument showed substantial or almost perfect reliability (k = 0.71; kw = 0.76; intraclass correlation [ICC] = 0.93) for the Dependence With Mobility and Frequency scales and Repertoire index, respectively. The first version of the instrument consisted of two additional scales—Dependence With Mobility scale (4 items, kw = 0.71; i.e., substantial) and Extent of Assistance With Mobility scale (4 items, kw = 0.41; i.e., moderate). They were combined into one scale in the final version, the Dependence and Extent of Assistance With Mobility scale, now known as the Need for Assistance with Mobility scale. After reduction of the response options from five to four, the Dependence and Extent of Assistance With Mobility scale reliability was substantial (kw = 0.66). The reliability of the Ease/Difficulty scale was moderate (kw = 0.55). The internal consistency of the three scales varied between 0.63 and 0.76 (Brandt et al., 2008). Even though the results were good, the study demonstrated that a revision was required and led to the NOMO 1.0 version tested in the present study.
It is important to know to what degree the different items of the new version—NOMO 1.0—are acceptable to the users, that is, if they are able to rate the items and whether the items are of relevance to them; hence the acceptability and applicability of the items need to be tested (de Vet et al., 2011). Also, as the variance of the responses of the items is important for the reliability and responsiveness (Streiner & Norman, 2008), there is a need to investigate if there are any floor and ceiling effects, that is, if large proportions of responses are clustered at the upper and/or lower ends of the scales (de Vet et al., 2011). It is also important to know the interrelatedness among the items, and therefore knowledge about the internal consistency is needed (Mokkink et al., 2010). Moreover, information about the amount of error inherent in the NOMO 1.0 and its ability to differentiate between cases should be established (Kottner et al., 2011; Streiner & Norman, 2008), and therefore a testing of the reliability and agreement of the current version is required. Exact agreement, the degree to which repeated scores are identical (de Vet, Terwee, Knol, & Bouter, 2006; Kottner et al., 2011), representing the consistency of a set of responses (Graham, Milanowski, & Miller, 2012), needs to be evaluated with the NOMO 1.0.
To establish content validity and feasibility, several pilot studies were completed in all five countries with satisfactory results (Brandt et al., 2009). Hence, the content validity of the NOMO 1.0 has been established (Brandt et al., 2008), but there is a need to evaluate the construct validity, that is, to what degree the NOMO 1.0 evaluates mobility-related participation as expected and whether the scales are unidimensional or not (Mokkink et al., 2010).
Study Purpose and Research Questions
Accordingly, the aim of this study was to generate knowledge about the psychometric properties of Part B of the NOMO 1.0 among adult PMD users in Nordic countries. The specific research questions were (a) What is the general acceptability and applicability of the items of the Need for Assistance, Frequency, and Ease/Difficulty scales? (b) Are there any floor and/or ceiling effects in the items of the Need for Assistance, Frequency, and Ease/Difficulty scales? (c) What is the internal consistency (including inter-item and item-total correlations) of the items of the Need for Assistance, Frequency, and Ease/Difficulty scales? (d) What is the test-retest reliability and percentage of exact agreement of the items of the Need for Assistance, Frequency, and Ease/Difficulty scales and the Participation Repertoire index? (d) What is the construct validity of the NOMO 1.0 studied in terms of the dimensionality of the Need for Assistance and Frequency scales?
Method
Study Design
We had the opportunity to test the NOMO 1.0 among adult first-time users of PMDs using data collected for a larger Nordic pretest/posttest design study on PMD outcomes to evaluate the effects of the PMDs and the psychometric properties of the NOMO 1.0. The project involved respondents from Denmark, Finland, and Norway, who were interviewed four times each. For the present study, data collected in the first (baseline) and third interview (a test interview about 1 year later) were used together with data from the fourth interview (retest), which took place about 2 weeks after the third interview (Sund, Iwarsson, Anttila, & Brandt, 2015). No data from the second interview were used in this study.
Respondents
The sample size was based on experiences from previous studies because no sample size estimates were available. According to de Vet et al. (2011), a sample size of 60 respondents is appropriate for the analysis of reliability. Due to the possibility of some dropouts, the aim was to recruit 55 respondents at baseline from each country participating in the Nordic project, representing a variation in age, sex, civil status, and urban/rural environments (Brandt et al., 2008). Respondents were recruited consecutively as their applications for a PMD were accepted by the responsible municipalities in Denmark and Finland and the assistive technology centres in Norway. Persons who agreed to participate in the study received written information as well as a letter of consent, which they signed and returned before the Nordic project started. The inclusion criteria were (a) being a PMD user for the first time, (b) being 18 years of age or older, (c) having sufficient cognitive capacity for participation in interviews (as assessed by case managers), and (d) living in ordinary housing, including adapted dwellings. Individuals who had experienced recent injuries or accidents and had no opportunity to participate in different activities were excluded, as were those with progressive diseases (see Figure 2 and Sund et al. [2015] and Sund, Iwarsson, Anttila, Helle, and Brandt [2014] for further details on recruitment). In all, 248 respondents participated in the baseline and 159 in the test-retest interviews used for the reliability and percentage-of-exact-agreement analyses.
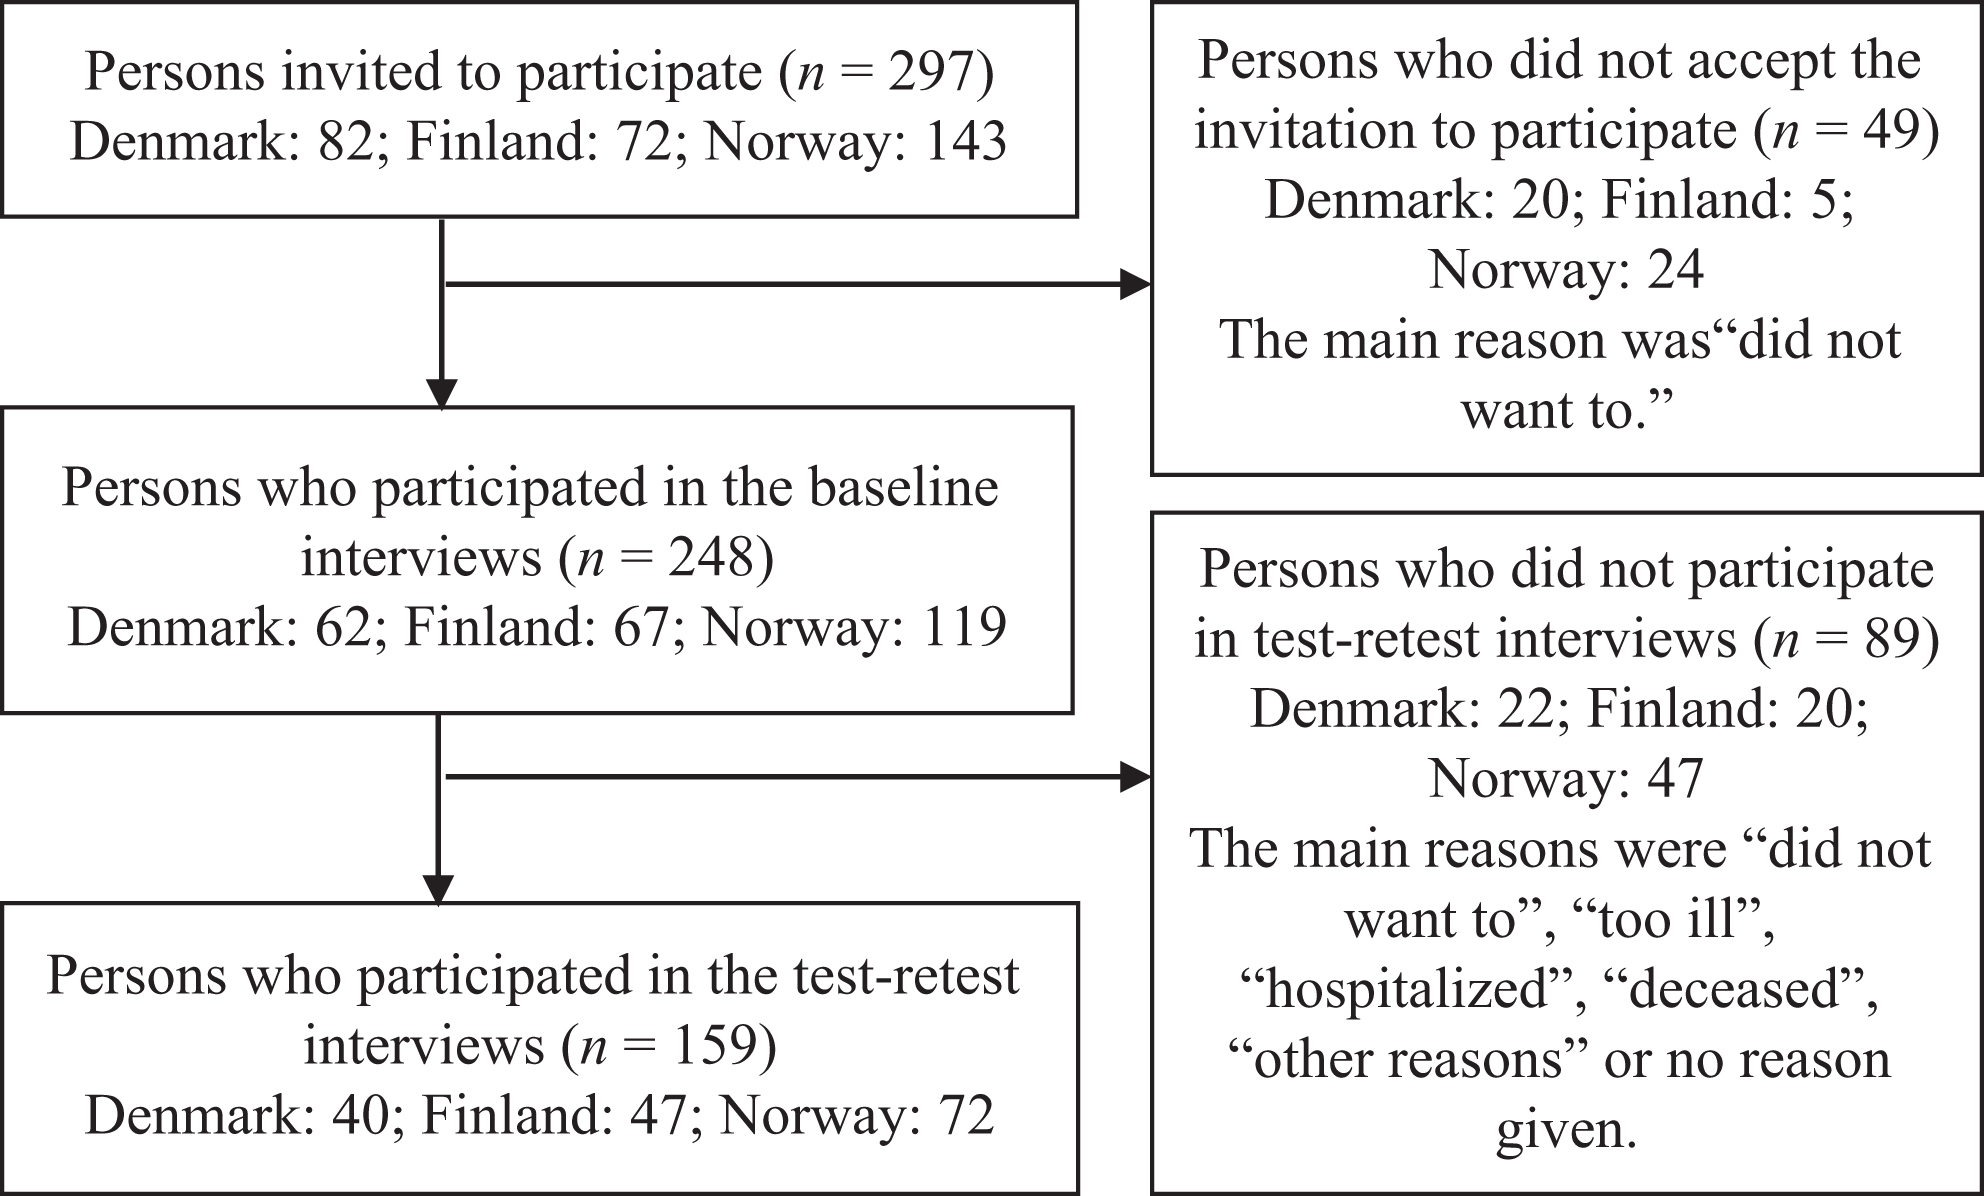
Study respondents from Denmark, Finland, and Norway.
At baseline, the mean age of the sample was 67.9 years (SD = 15.3), with 116 (47%) of the respondents being men, 128 (52%) living alone, and the majority living in a city (n = 104, 42%) or a suburb (n = 102, 42%). A powered wheelchair had been provided for outdoor use in 51 (21%) and scooters in 189 (76%) of the cases; 216 (87%) of the respondents had also been provided other assistive devices previously, and 41% of the respondents reported poor health (see Table 1).
Powered Wheelchair and Scooter User Characteristics
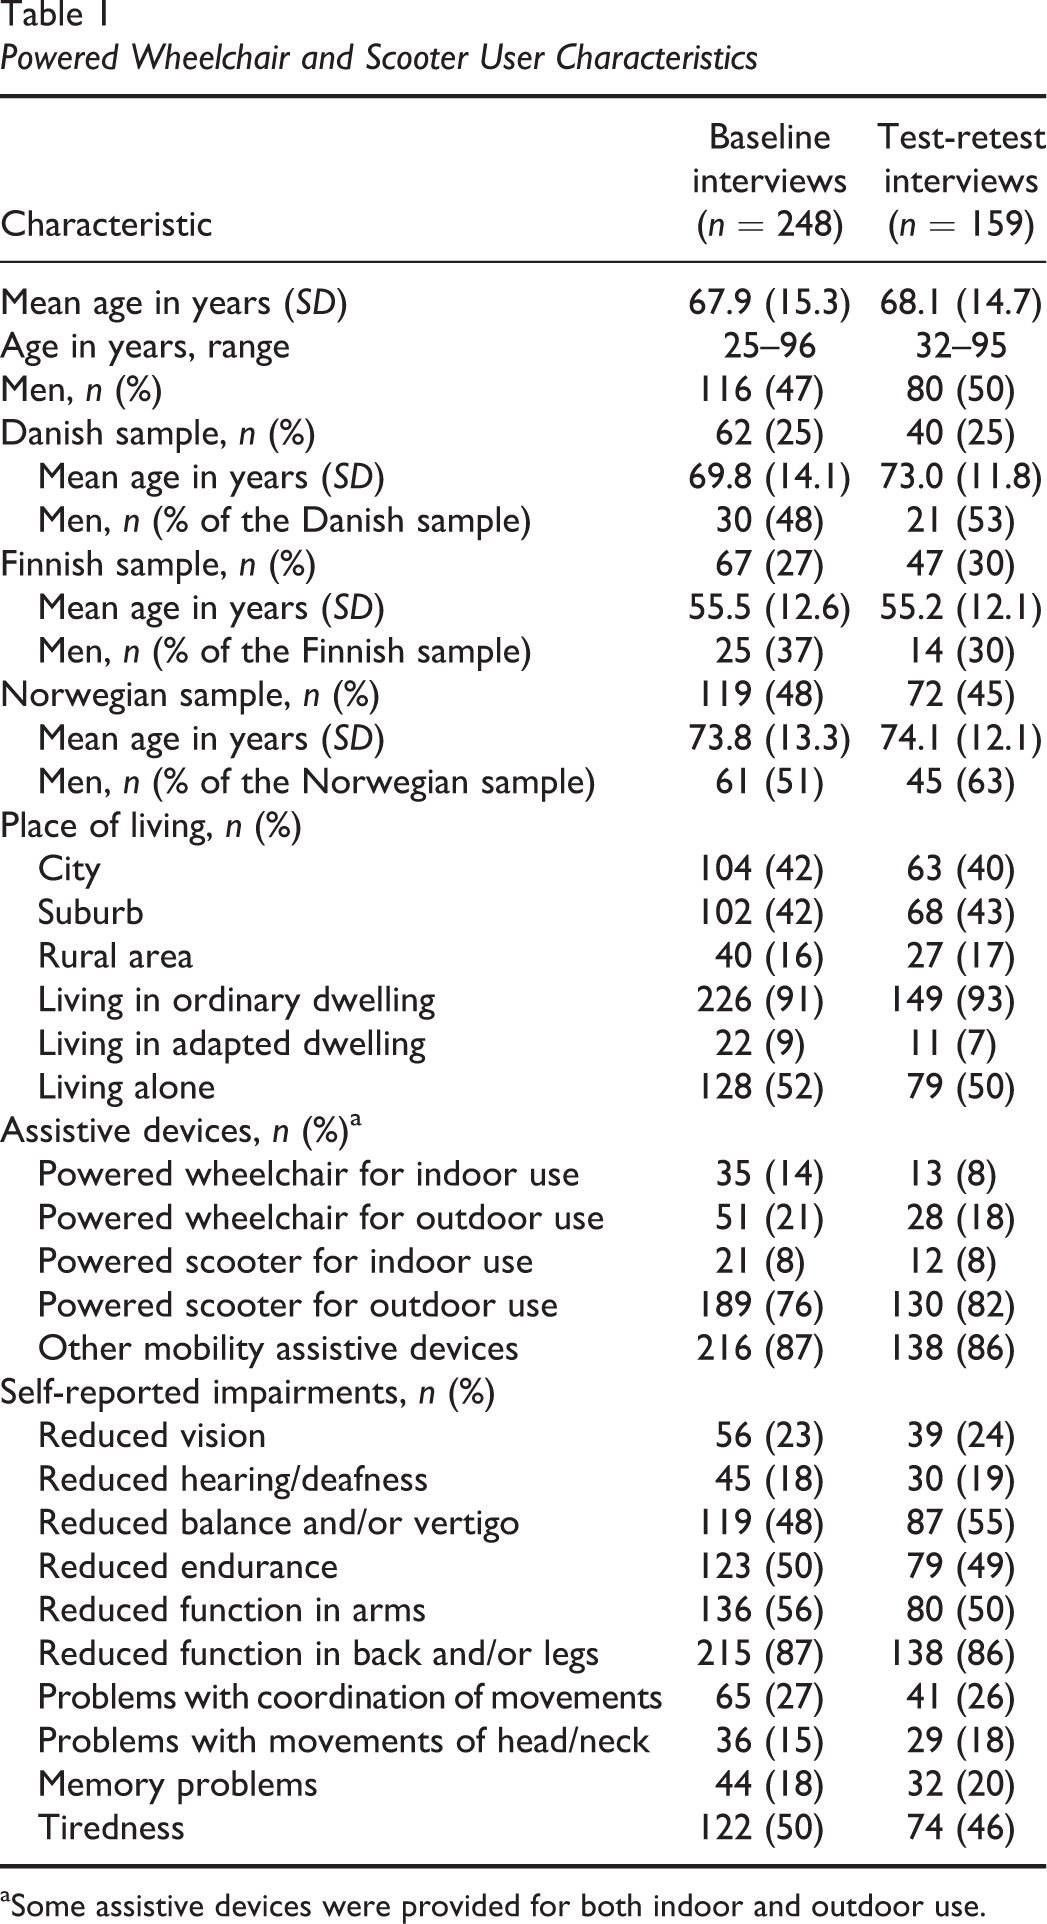
aSome assistive devices were provided for both indoor and outdoor use.
Ethical Considerations
All principles of ethical guidelines for human research were followed. All the respondents gave informed written consent and were guaranteed anonymity and confidentiality. According to current national legislation, a formal ethical approval was not necessary in Denmark, but permission to store personal data was granted by the Danish Data Protection Agency. In Finland, the larger project was approved by the Ethical Council of the Hospital District of Helsinki and Uusimaa (Record No. 417/13/03/00/09). As the study was part of the routine follow-up activities of the Norwegian Labour and Welfare Service, a formal ethical approval was not necessary, but the Norwegian Data Inspectorate was informed (Registration No. 40030).
Data Collection
Experienced occupational therapists or physical therapists in Denmark (n = 6), Finland (n = 15), and Norway (n = 12) were provided with the guidelines and a 1-day briefing course and completed the interviews (see Sund et al., 2014, for further details). Regarding the test-retest and percentage of exact agreement part of the study, a 2-week interval between the two data collection sessions (i.e., Interviews 3 and 4) was chosen, representing a good balance between the stability of the construct under study (mobility-related participation) and the independence of repeated tests (de Vet et al., 2011). The same interviewer performed all the interviews with the same respondent. The test-retest interviews took place about 1 year after the baseline interviews with the retest interviews a maximum of 18 days (M = 13.2 days; SD = 2.5) after the test interviews. In addition to the NOMO 1.0, a question was asked about changes in health conditions and social events between the test and retest interviews. Each interview lasted between 45 and 60 min.
Data Analysis
The national coordinators (HA for Denmark, ÅB for Finland, TS for Norway) controlled the quality of the data entry in their respective countries. For the present study, the three national samples were merged for the analyses (de Vet et al., 2011). In Part A at baseline, descriptive statistics were used to describe the demographic data, type of PMD, and health data. Only items from Part B of the NOMO 1.0 were included in the psychometric analyses. Data from Interviews 3 and 4 were used for the test-retest reliability test, and the baseline data were used for all the other analyses.
Acceptability
To assess the general acceptability of the items to the respondents, percentages of the does not wish to answer, reason unknown, and the does not know responses were calculated for all items of the three scales. To establish the acceptability, a cutoff below 3% for missing scores (of the ordinal scales) for an item was used (de Vet et al., 2011).
The does not wish to answer, reason unknown, and does not know responses were used to record reasons for missing data and thus not part of the ordinal scales used to capture Need for Assistance, Frequency, and Ease/Difficulty scales. Accordingly, as the percentages of missing scores for these response alternatives were below 15%, they were excluded from further statistical analyses as per de Vet et al. (2011).
Applicability
Applicability can be established by counting the number of responses to the different items of the scales (Free Dictonary, 2014). In this study, applicability concerns the relevance of the items of the three scales. For the 20 items of the Frequency scale, the proportions of never responses were computed, first for each respondent and then for the total sample. These proportions indicated the applicability for the Ease/Difficulty scale. The number of missing responses should not exceed 15% per item, which constituted 37 cases (248 × 0.15; de Vet et al., 2011).
Floor and ceiling effects
Based on baseline data, floor/ceiling effects were established by means of percentages of responses >20% at the highest or lowest end of the items of the three scales (Andresen, 2000; McHorney & Tarlov, 1995).
Internal consistency
Cronbach’s alpha was used to estimate the internal consistency for the items of the Need for Assistance and Frequency scales, with recommended values between 0.70 and 0.90 (Streiner & Norman, 2008). Successively, each item was removed to study if the alpha increased or decreased. The inter-item correlations were calculated for the items of the three scales, with correlations r ≥ .20 as acceptable. The item-total correlations for the items of the Need for Assistance and Frequency scales with r ≥ .30 were considered to be acceptable to reflect some covariance with the common components among the items (de Vet et al., 2011).
Test-retest reliability
Test-retest reliability is defined as the ratio of variability between users to the total variability (including error) of all measurements in a sample (Streiner & Norman, 2008). It was assessed for each item of the three scales and the index by means of the ICC coefficient using a two-way mixed-effects model, single measures (ICC 2.1; Weir, 2005). A coefficient of 0 indicates a totally unreliable measure, and the ICC approaches 1 when error variance is negligible compared to the user variance (de Vet et al., 2011). ICC levels >.7 are recommended (de Vet et al., 2011; Streiner & Norman, 2008). On the basis of experiences from previous research (see Brandt et al., 2008; Demers, Weiss-Lambrou, & Ska, 2001), “good” items were expected to demonstrate ICCs of .50 or higher.
Percentage of exact agreement
As the NOMO 1.0 items had fewer than nine response alternatives (Graham et al., 2012), the percentage of exact agreement was established for each item by calculating the number of identical responses in proportion to the total number of responses. For the Participation Repertoire index, the percentages of identical participation and nonparticipation responses were calculated for each item for the Frequency scale. Levels >75% are considered acceptable (Stemler, 2004).
Construct validity
As there was no clear idea about whether the scales consisted of one or several components, an explorative factor analysis was conducted to evaluate their structure (de Vet et al., 2011). As the Ease/Difficulty scale had many intentional missing responses (see Table 2; a factor analysis requires at least five times as many respondents as items [5 × 20 = 100]; Dancey & Reidy, 2011]), the items of the Ease/Difficulty scale were not subject to a factor analysis. A correlation matrix was produced to check the strength of the correlations, followed by extraction of a set of components. Components with eigenvalues ≥1.00 were retained, and how much variance they accounted for was calculated. To make the interpretation easier, the axes were rotated (using oblimin with Kaiser normalization) to maximize high and minimize low correlations. Factor loadings were examined using a cutoff level of 0.2 (i.e., the same cutoff level as for the inter-item correlations). If the cumulative explained variance was low, more components might be retained to provide a better count of the variance (de Vet et al., 2011). The level of statistical significance was set to p ≤ .05. The SPSS Version 21.0 was used for all analyses (SPSS, 2009).
Psychometric Properties of the Nordic Mobility Related Outcome Evaluation of Assistive Device Intervention (NOMO 1.0) Items
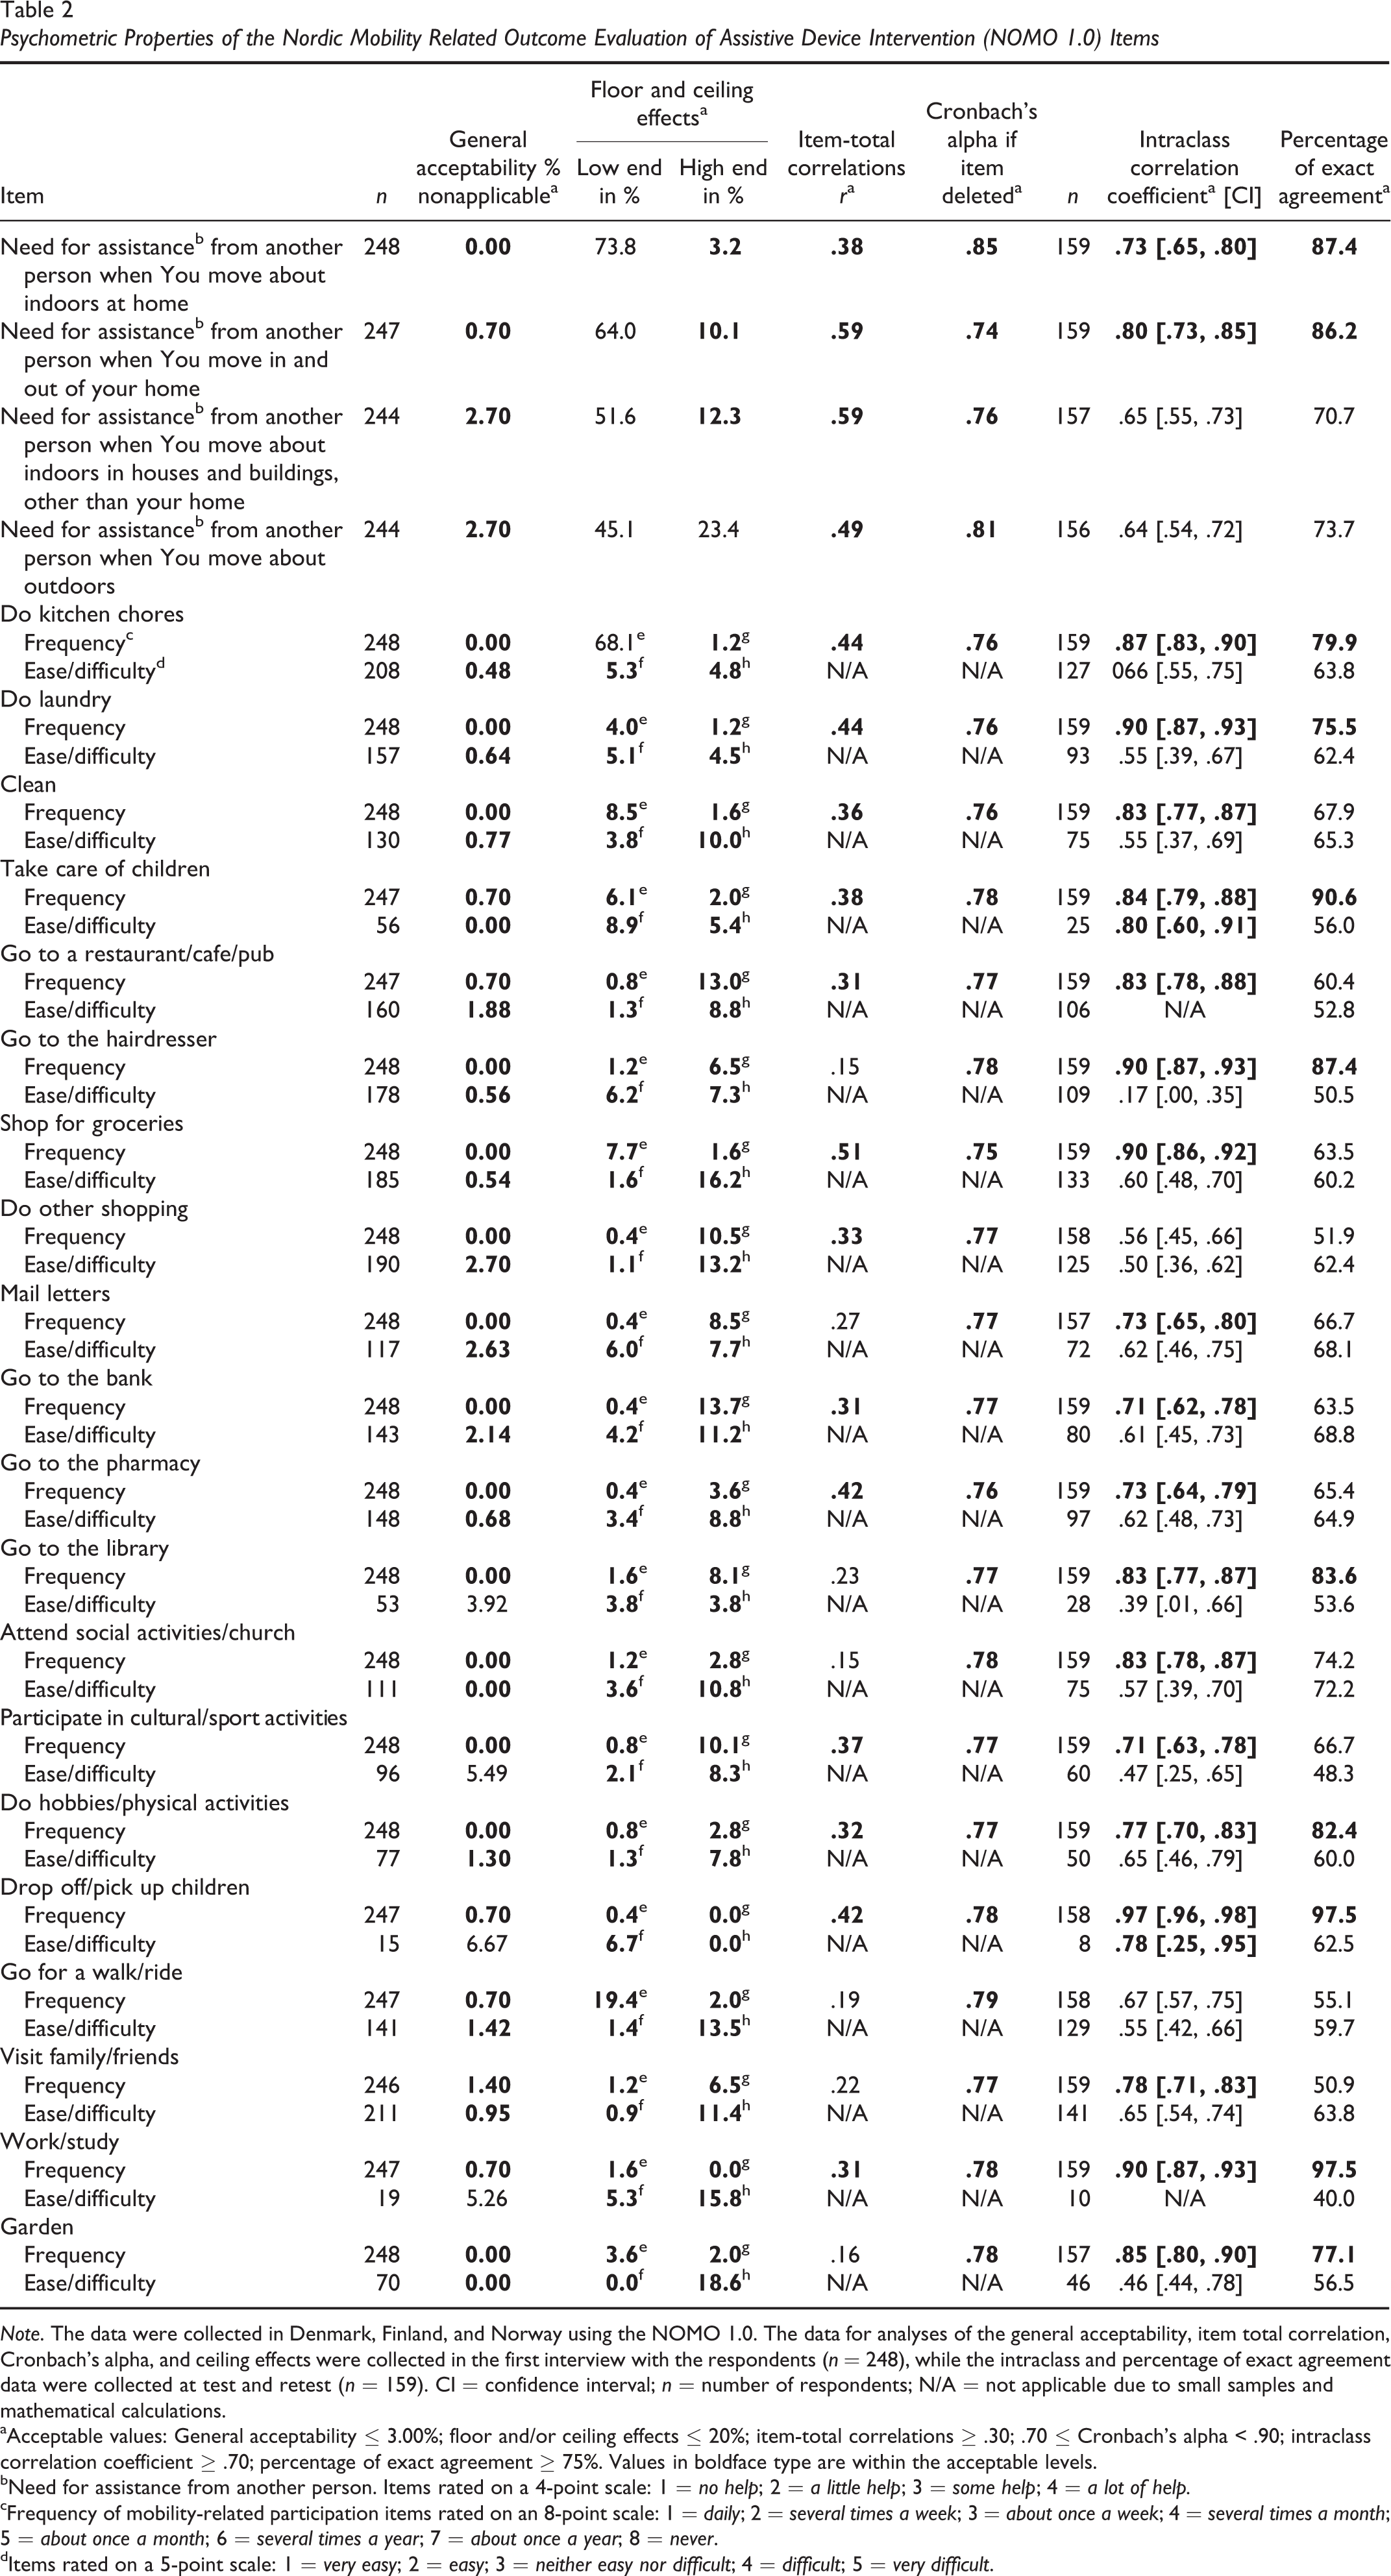
Note. The data were collected in Denmark, Finland, and Norway using the NOMO 1.0. The data for analyses of the general acceptability, item total correlation, Cronbach’s alpha, and ceiling effects were collected in the first interview with the respondents (n = 248), while the intraclass and percentage of exact agreement data were collected at test and retest (n = 159). CI = confidence interval; n = number of respondents; N/A = not applicable due to small samples and mathematical calculations.
aAcceptable values: General acceptability ≤ 3.00%; floor and/or ceiling effects ≤ 20%; item-total correlations ≥ .30; .70 ≤ Cronbach’s alpha < .90; intraclass correlation coefficient ≥ .70; percentage of exact agreement ≥ 75%. Values in boldface type are within the acceptable levels.
bNeed for assistance from another person. Items rated on a 4-point scale: 1 = no help; 2 = a little help; 3 = some help; 4 = a lot of help.
cFrequency of mobility-related participation items rated on an 8-point scale: 1 = daily; 2 = several times a week; 3 = about once a week; 4 = several times a month; 5 = about once a month; 6 = several times a year; 7 = about once a year; 8 = never.
dItems rated on a 5-point scale: 1 = very easy; 2 = easy; 3 = neither easy nor difficult; 4 = difficult; 5 = very difficult.
Findings
Acceptability
The percentages of does not wish to answer, reason unknown, and does not know responses were below the 3% cutoff criterion for all the items of the Need for Assistance and Frequency scales. For the majority of the items of the Ease/Difficulty scale, the percentages were below 3% except for “go to the library” (3.92%), “work/study” (5.26%), “participate in cultural/sport activities” (5.49%) and “drop off/pick up children” (6.67%) (see Table 2).
Applicability
The number of missing responses to the different items of the Need for Assistance scale varied between 0 (0.0%) and 4 (1.6%) and between 0 (0.0%) and 2 (0.8%) for the items of the Frequency scale. Concerning the items of the Ease/Difficulty scale, the number of never responses to the different items of the Frequency scale varied between 40 (16.1%) for the “do kitchen chores” and 232 (93.5%) for the “drop off/pick up children” items (see Table 2).
Floor and Ceiling Effects
For the items of the Need for Assistance scale, no help was the most frequent response, and as the percentages varied between 45.1% and 73.8%, a ceiling effect was identified for all four items (Andresen, 2000). A floor effect was identified for the “move about outdoors” item as a much help response was given by 23.4% of the respondents.
Concerning the items of the Frequency scale, due to large numbers of intentional missing never responses, the daily and about once a year response alternatives were considered to represent the ends of the response alternatives. A ceiling effect was detected for the daily response alternative for the “do kitchen chores” (68.1%) item. For the other items, the percentages varied between 0.4% and 19.4%. All the percentages of the once a year responses were below 20%. No floor/ceiling effects were identified for the items of the Ease/Difficulty scale as the percentages of the very easy responses varied between 0.0% and 8.9% and the very difficult responses between 0.0% and 18.6% (see Table 2).
Internal Consistency
The Cronbach’s alpha for the four-item Need for Assistance scale was .84 and .78 for the items of the Frequency scale. Concerning the Need for Assistance scale, the successive removal of items produced Cronbach’s alpha values between .76 and .85. The inter-item correlations varied between .42 and .69, and the item-total correlations varied between .38 and .59. Concerning the Frequency scale, the inter-item correlation values varied between –.16 and .56 with 133 of 190 pairs of correlations <.20 and the item-total correlations between .15 and .51. The item-total correlations were <.30 for the following items: “mail letters” (0.27), “go to the library” (0.23), “attend social activities/church” (0.15), “go for a walk/ride” (0.19), “visit family/friends” (0.22), and “garden” (0.16). The successive removal of the items produced alpha values between .75 and .79. The inter-item correlations for the items of the Ease/Difficulty scale varied between –.36 and .90, with 29 items <.20 (see Table 2).
Test-Retest Reliability
No changes in respondents’ health conditions or social events between the test and retest interviews were reported. Consequently, the number of respondents in both interviews was the same. The item s varied between .64 (95% confidence interval [CI] = [.54, .72]) and .80 (95% CI = [.73, .85]) for the four items of the Need for Assistance scale; two of the values were >.7. For the items of the Frequency scale, the ICCs varied between .56 (95% CI = [.45, .66]) and .97 (95% CI = [.96, .98]), with 18 of the 20 items >.70. For the items of the Ease/Difficulty scale, the ICCs varied between .39 (95% CI = [.01, .66]) and .80 (95% CI = [.60, .91]); the values for two of the 20 items were >.70. The ICC for the Participation Repertoire index was .94 (95% CI = [.92, .96]).
Percentage of Exact Agreement
The percentage of exact agreement for the items of the Need for Assistance scale varied between 70.7% and 87.4%; for two of the items, the percentages were >75%. The corresponding percentages for the items of the Frequency scale were 50.9% and 97.5%, and the percentages for nine of them were >75% (Stemler, 2004). For the items of the Ease/Difficulty scale, the percentages varied between 40.0% and 72.2%. The percentage of exact agreement for the repertoire index varied between 84.3% (“go to the bank”) and 99.4% (“drop off/pick up children”) for the different items (see Table 2).
Construct Validity
The factor analysis of the Need for Assistance scale identified one component that accounted for 68.7% of the variance. Concerning the Frequency scale, the factor analysis identified six components that accounted for 57.3% of the variance (see Table 3). The first component accounted for 21.4%, the second 10.0%, and the third component 8.7% of the variance, while Components 4 to 6 accounted for the remaining 17.2%. The six components consisted of items that were related to the ICF: (a) domestic life, acquisition of goods and services often (seven items); (b) community, social, and work life (five items); (c) domestic life, care for/assisting others (child care) (two items); (d) mobility, outdoor life (two items); (e) domestic life, household tasks (three items); and (f) domestic life, acquisition of goods and services more seldom (one item).
Explorative Factor Analysis of the Frequency Scale of the Nordic Mobility Related Outcome Evaluation of Assistive Device Intervention (NOMO 1.0) Instrument
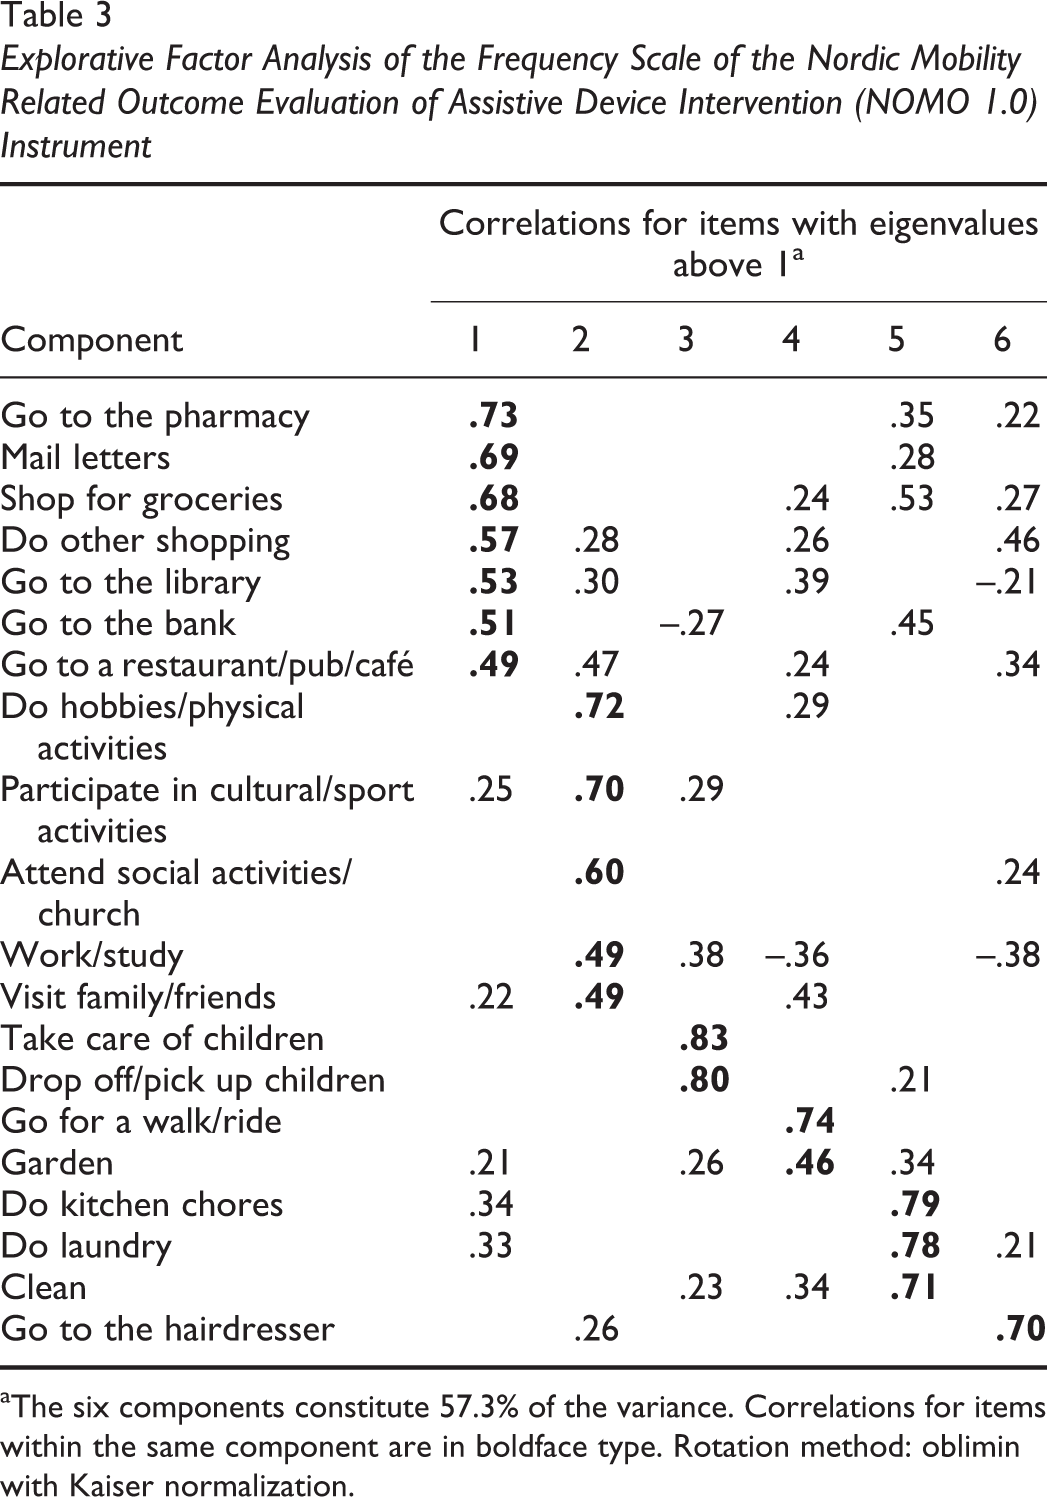
aThe six components constitute 57.3% of the variance. Correlations for items within the same component are in boldface type. Rotation method: oblimin with Kaiser normalization.
Discussion
The results of the present study contribute knowledge about the psychometric properties of the NOMO 1.0 in terms of acceptability, applicability, floor and ceiling effects, internal consistency, test-retest reliability, percentage of exact agreement, and construct validity. With some exceptions, the items were acceptable to the respondents, and they were able to answer the different questions included in the instrument, which means they were able to understand and interpret the questions. However, many of the items of the Ease/Difficulty scale were nonapplicable for large proportions of the respondents. The reliability of the Frequency scale and the index in addition to two items of the Need for Assistance and Ease/Difficulty scales was above the recommended values. The percentage of exact agreement of the three scales and the floor/ceiling effect of the Need for Assistance scale are concerning. Unlike the Need for Assistance scale, the items of the Frequency scale do not seem to be unidimensional, which is why using the scale to generate sum scores is not applicable. The numbers of reliability and agreement properties (maximum seven properties) per item with values within the recommended levels for Need for Assistance, Frequency, and Ease/Difficulty scales are presented in Figure 3. The interpretation of these results will be different for the various items. For example, the item “drop off/pick up children” meets seven criteria on the Frequency scale but only one on the Ease/Difficulty scale, while “mail letters” meets five and three criteria, respectively, both a total of eight properties. In forthcoming studies, and when interpreting the results generated by the different scales, it is important for researchers to be aware of these kinds of differences. That is, the interpretation of the results should be different for the different items of the Frequency and Ease/Difficulty scales.
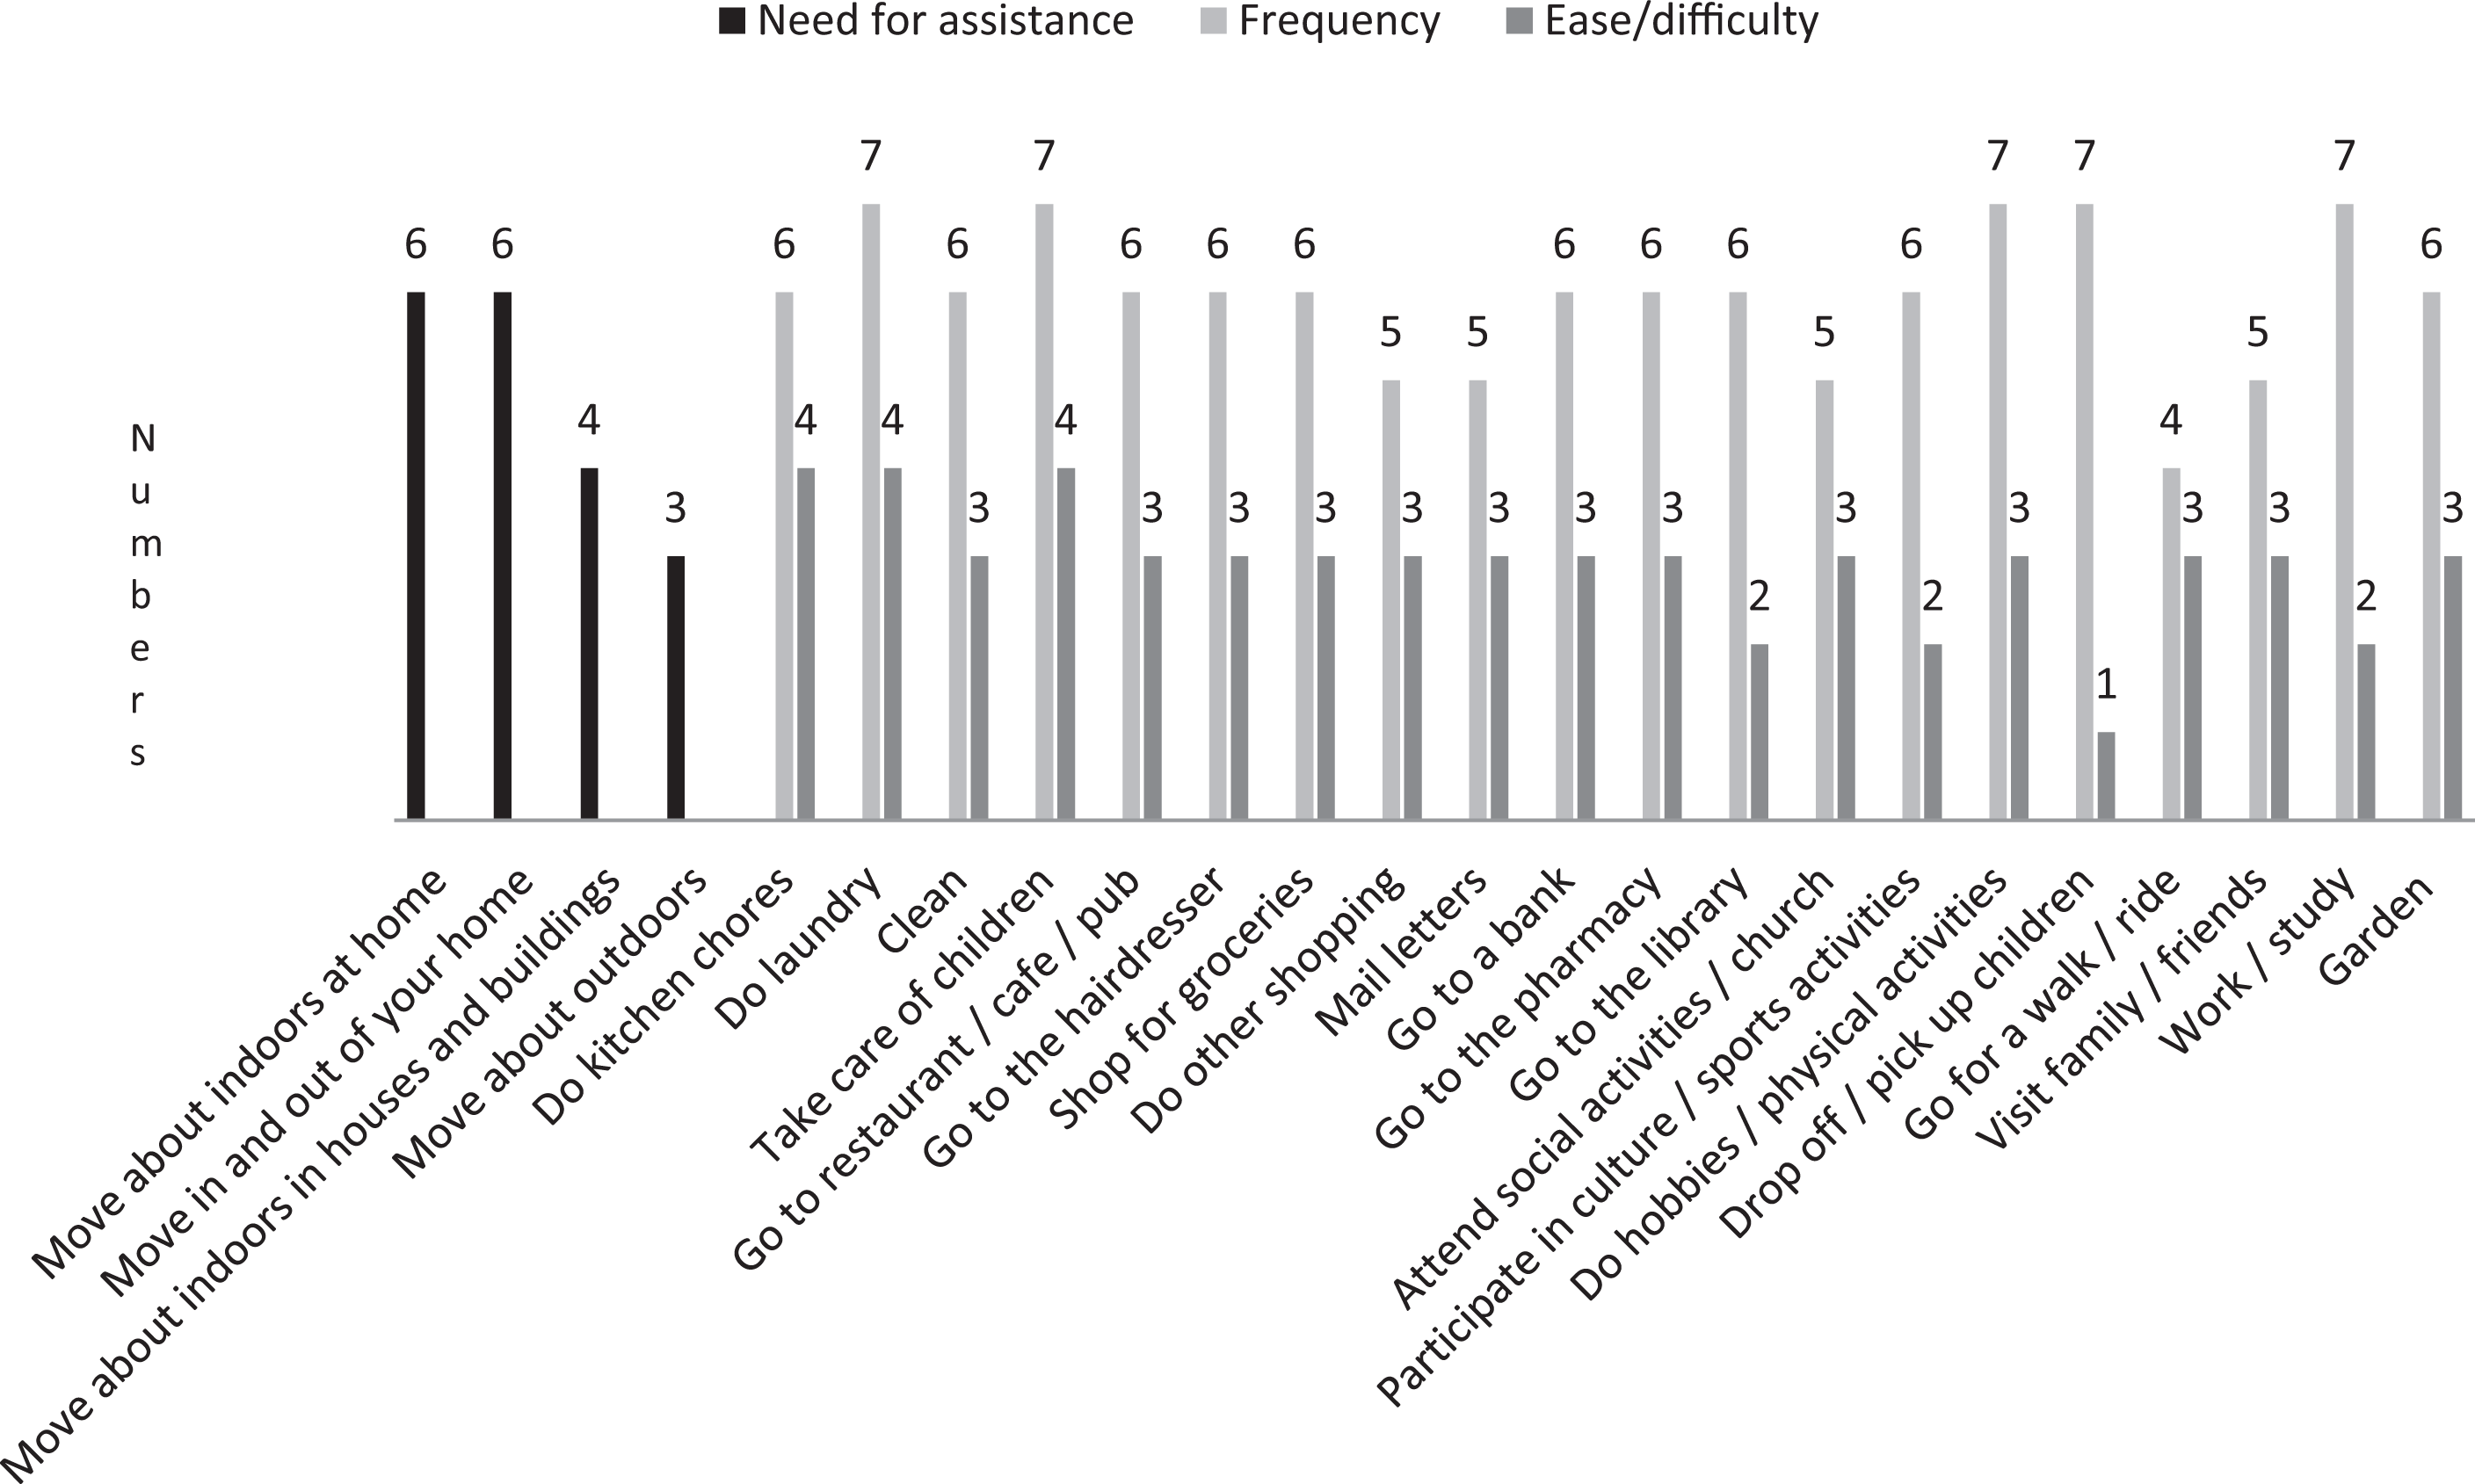
The number of the following reliability and agreement properties with values above the recommended levels for the items of the frequency and ease/difficulty constructs: general acceptability, floor effects, ceiling effects, item-total correlations, Cronbach’s alpha, intraclass correlation coefficient, percentage of exact agreement (N = 248).
The NOMO 1.0 items of the Frequency scale can be reliably administered for interviews with adult PMD users because their ICCs were above the recommended level. Moreover, the ICCs in the present study are comparable to the results of psychometric testing of other instruments (see Brandt et al., 2008; Demers et al., 2001; Mills, Holm, & Schmeler, 2007). Consequently, the magnitude of the ICCs in this study can be accepted. However, as some of the ICCs were more modest, we recommend using the NOMO 1.0 to evaluate effectiveness for groups of users and not for individual users in clinical practice as the latter require higher ICCs. Moreover, in studies with PMD users, fairly large samples are needed (see de Vet et al. [2011] and Streiner & Norman [2008] for further details on ICCs in relation to sample size).
The finding that the ICCs were <.70 for two of the four items of the Need for Assistance scale may be explained by high percentages of scores at the end of the rating scale (floor/ceiling effect). In spite of the floor/ceiling effects for all of these items, the percentages of scores at the end of the scale were higher for the two items with the lowest ICCs than with the other two items. Floor/ceiling effects decrease the variability among the respondents and decrease the instrument’s sensitivity to change and the ICCs. A way to solve the problem of floor/ceiling effects is typically to revise a scale by adding more response alternatives. This may result in median scores closer to the middle of the scale and effectively increase the variability among the respondents and increase the ICCs (Streiner & Norman, 2008). However, as a large proportion of the respondents in our study gave a no help response, we do not have a sufficiently strong decision base as to whether more response alternatives can reduce the floor/ceiling effects of the items of the Need for Assistance scale.
The ICC scores of >.70 for two of the items of the Ease/Difficulty scale (see Figure 3) may be due to the complexity of the insufficiently investigated relationship between outdoor participation and accessibility problems. PMD users do visit different grocery stores, shops, restaurants/cafes/pubs, and other community spaces. Despite the short 2-week interval between the test and retest, our respondents may have thought of and discussed different places with different environmental challenges in their retest interviews when being asked to rate the degree of ease/difficulty. The moderate ICC of .47 for the “participate in cultural/sport activities” item supports this, as does previous research (e.g., Brandt et al., 2008; Pettersson, 2014). For example, for the Usability in My Home instrument with weighted kappa ranging from 0.57 to 0.83 for six specific items, the lowest value concerned accessibility outdoors (Fänge & Iwarsson, 1999). In the present study, the ICC of .39 for the “go to the library” item supports low ICCs for outdoor activities. However, as each community usually has only one or very few libraries, the respondents probably think of one place when rating ease/difficulty when going to the library. This situation makes the interpretation of the ease/difficulty ICCs challenging. Another explanation may be that more moderate ICCs may also be caused by respondents’ difficulties to recall affective experiences (de Vet et al., 2011; Kreuger & Schkade, 2008). As ease/difficulty refers to affective experiences and cognitive judgments, the scale may be susceptible to mood differences at the two interview occasions. Research within the field of subjective well-being has documented that such subtle events influenced the results and that 4% to 34% of the total variance was accounted for by situation-specific factors (Kreuger & Schkade 2008). One reason for the higher ICCs produced by the items of the Frequency scale compared to those of the Ease/Difficulty scale may be because they focus on reconstructing specific events. There is at least the possibility that these items will be less vulnerable to current mood or environmental challenges at the time of the interview compared to those of the Ease/Difficulty scale. One reason the frequency responses were reliable is that they may not change substantially (even with a new PMD), but the ease/difficulty of participation is more likely to change (Sund et al., 2015).
Despite more modest ICCs, the ease/difficulty results are sufficiently high to support the use of this scale in research among users of PMDs. Also, the results in the present study are similar to those produced in the testing of the predecessor of the NOMO 1.0 (Brandt et al., 2008). According to a previous study, the items of the Difficulty scale were the most sensitive to detect disability, indicating that the items of the Ease/Difficulty scale are an important part of the instrument (Laditka & Jenkins, 2001). However, the more moderate ICCs must be kept in mind when using the NOMO 1.0 for outcome evaluations. Most important, lower ICCs require larger samples (Streiner & Norman, 2008).
The results that the Cronbach’s alpha value was above the recommended level of .70 may indicate that the items of the Need for Assistance scale capture the same phenomenon, namely, need for assistance from others when moving about indoors and outdoors. This is confirmed by acceptable inter-item correlations (varied between .42 and .69), which should be between .2 and .5 for items within one component (de Vet et al., 2011). The item-total correlations (varied between .38 and .59) show that the items can discriminate users on the need for assistance when moving about indoors and outdoors (de Vet et al., 2011). The Cronbach’s alpha for the Frequency scale was high (.78), but 133 of 190 inter-item correlations <.20 indicate that the items are not part of the same component. Also, item-total correlations <.30 for six items indicate that these items assess something other than the other items of the Frequency scale (de Vet et al., 2011). One reason for the low inter-item correlation of the Frequency scale may be that it captures indoor activities, such as doing kitchen chores, as well as many different outdoor activities, representing a considerable diversity of challenges when it comes to mobility-related participation. Actually, lower inter-item correlations are expected for broad concepts compared to more narrow ones (de Vet et al., 2011). The inter-item correlations of the items of the Frequency scale mirror the result of the factor analysis. That is, the items of the Frequency scale constitute more than one component. In fact, the result that the factor analysis identified six components for the Frequency scale indicates a multidimensional construct. The results were the same when 0.3 and 0.4 were chosen as cutoff points. A cutoff point of 0.5 still identified six components explaining the same percentage of variance as above but with four items excluded from the components: “go to restaurant/pub/café,” “work/study,” “visit family/friends,” and “garden.”
In contrast, regarding the Need for Assistance scale, the factor analysis identified one component, indicating that the scale is unidimensional. Thus, a sum score for these four items may be recommended. Actually, the results of the factor analysis were also the same when 0.3, 0.4, and 0.5 were chosen as cutoff points. As an exploratory factor analysis is used in the early stages of research to generate hypotheses about the relationship between the components, all relevant components have to be included (Tabachnick & Fidell, 2013). Also, as the selection of components and items poses a logical challenge, we recommend retaining all six components of the Frequency scale with all their items. Even if some items are applicable for only a small proportion of the users, such as “take care of children” and “drop off/pick up children” (see Table 3), and despite that some of the components contained only one and two items instead of three—which is recommended—they should be included (de Vet et al., 2011). However, one can see the present results as empirical results of the component structure of the Frequency scale. A hypothesis can be made, which in future studies can be tested by means of confirmatory factor analysis (de Vet et al., 2011).
Given the results of this study, when using the NOMO 1.0 in future studies, the evaluation of change of the Need for Assistance scale can be achieved by means of testing for differences of sum scores between assessment occasions. The same applies for components (unidimensional) of the Frequency scale with three or more items. The items of the Ease/Difficulty scale must be considered individually. The Participation Repertoire index can be used to measure the change in number of participating aspects between pre- and post-provision of PMDs.
Study Limitations
The NOMO 1.0 was tested among users representing a relevant variety of characteristics, indicating ecological validity. A study limitation is that for practical reasons, no standardized assessment was used to evaluate the respondents’ cognitive functioning. However, the case managers had a good prior knowledge about the potential respondents, and on the basis of their long-standing professional experience, we believe that they were capable of making valid selections of respondents for the project (Sund, Iwarsson, Andersen, & Brandt, 2013). As characteristics of the interviewers may influence the results, additional information about their interviewer qualifications, clinical background, and level of expertise should have been collected and analyzed (Kottner et al., 2011). Another limitation is that the study did not include users with different durations of PMD use. Research on the impact of PMDs typically does not control for duration of use (Auger et al., 2008), and adding this aspect to the NOMO 1.0 would be useful.
Further Research
Even though the results of the present study are acceptable, further psychometric testing of the NOMO 1.0 is advised. Future testing should also include testing of the sensitivity and responsiveness of the instrument, that is, its ability to detect differences between groups of mobility device users and changes over time in the construct to be evaluated (Mokkink et al., 2010). It would be of interest to study whether there are relationships between the NOMO 1.0 and other relevant outcome measures. Consequently, the NOMO 1.0 should be tested for criterion validity. As the NOMO 1.0 was constructed 10 years ago, some of the items may not be as relevant today. For example, in today’s highly computerized society, people probably do not go to the bank or mail letters as often as before. Consequently, further content validity studies of the instrument should be accomplished. As part of the validity testing needed, one should consider modifying the instrument to make it amenable to the calculation of subscale scores. This kind of approach would make it easier to introduce the NOMO 1.0 into clinical practice.
Conclusion
The acceptability and applicability of the items were generally within recommended values. The reliability of the Frequency scale and the Participation Repertoire index in addition to two items of the Need for Assistance and Ease/Difficulty scales was within the recommended values. The percentage of agreement of the three scales and the floor/ceiling effect of the Need for Assistance scale demonstrate some concern. The items of the Need for Assistance scale seem to be unidimensional while those of the Frequency scale make up six components, which is why this scale should not be used for generating sum scores. Based on the results, the NOMO 1.0 should be used for research and quality development purposes and not for clinical practice; that is, it should be used for investigating groups of users and not individual users. Better reliability should be established for the Need for Assistance and the Ease/Difficulty scales prior to further psychometric testing to establish the validity of the NOMO 1.0. In addition to confirmatory factor analysis and criterion validity, future psychometric testing of the instrument should address sensitivity and responsiveness.
Key Messages
The Nordic Mobility Related Outcome Evaluation of Assistive Device Intervention is recommended for research and quality development purposes rather than for use in clinical practice.
The Need for Assistance scale is unidimensional, while the Frequency scale is multidimensional.
Better reliability should be established for Need for Assistance and Ease/Difficulty scales before the instrument is tested for sensitivity and responsiveness, in addition to further validity testing.
Footnotes
Funding
This study was financed by the Norwegian Labour and Welfare Service, Oslo, Norway, the National Board of Social Services, Odense, Denmark; the Municipality of Odense, Denmark; Academy of Finland; National Institute for Health and Welfare, Helsinki, Finland; and the Ribbingska Foundation in Lund, Sweden. It was conducted in the context of the Centre for Ageing and Supportive Environment (CASE) at Lund University, financed by the Swedish Research Council for Health, Working Life and Welfare (Forte).
Acknowledgements
The authors wish to thank all respondents and data collectors. Also, we wish to thank LicSc V. Horstmann, Statistician, for constructive advice regarding the statistical analysis.