
Abstract
This article investigates the linkages of the movements in Renminbi (RMB) to volatility of exchange rate returns of other currencies before and after the yuan devaluation on 11 August 2015. A comparison between the onshore Chinese yuan (CNY) and the offshore Chinese yuan (CNH) is made. Standard regression methods underestimate the tail dependence between yuan and other exchange rate volatility, as financial data are non-normally distributed, especially when extreme event occurs. We apply Gumbel copulas to capture the presence of tail dependence between RMB returns and the volatility of exchange rate returns for 13 selected currencies, and found dependencies not revealed by the standard ARCH models. The tail dependence has increased after the RMB devaluation, suggesting that RMB depreciation is associated with higher downside risks in these currencies. This is most obvious in the currencies of Asian and ASEAN-5 countries that have strong trade and financial linkages with China. The dependence structure has shifted away from the dominance of onshore CNY rates before the devaluation to the growing importance of more volatile offshore CNH rates after the devaluation. Hence, any large depreciation in CNH will lead to a higher volatility in the other exchange rate returns, and the corresponding downside currency risks are higher than those of the CNY.
Introduction
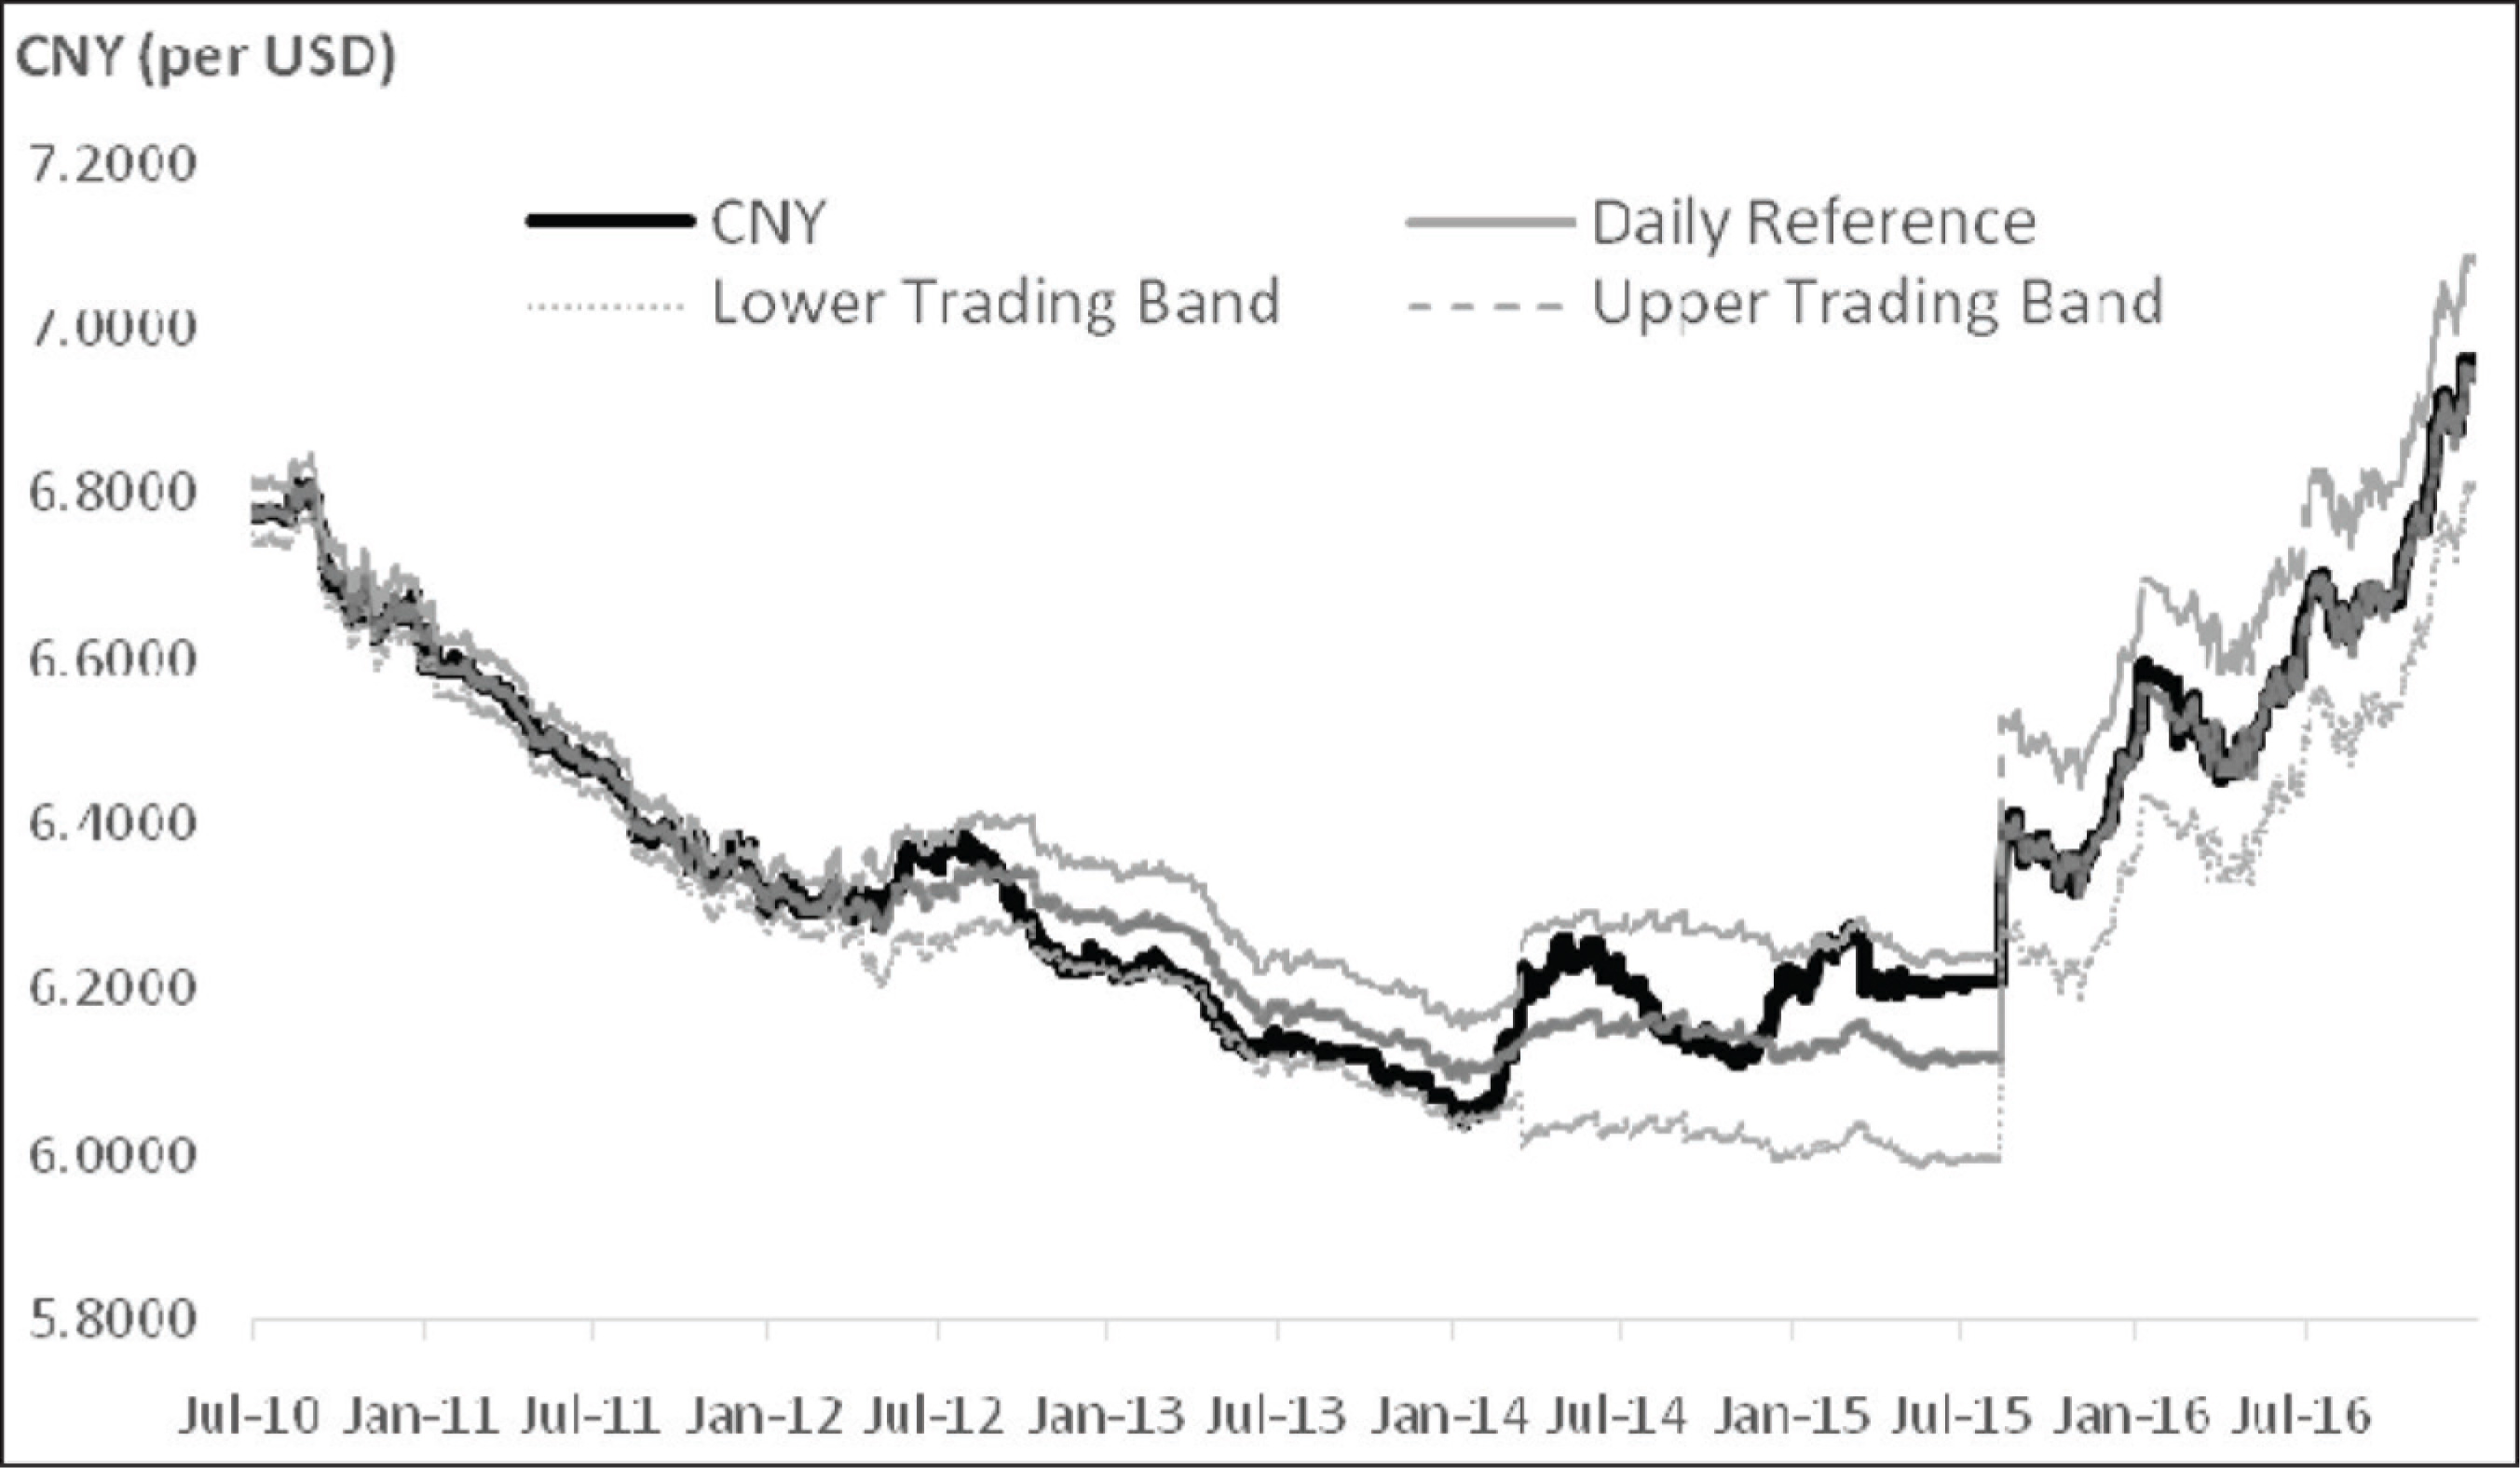
On 21 June 2010, Renminbi (RMB), the currency of China, was de-pegged against US Dollar (USD). At the same time, the People’s Bank of China (PBoC) allowed a wider band in daily trading of the currency, as part of its currency internationalisation efforts. These episodes resulted in greater volatility of the currency (see Figure 1). On 11 August 2015, PBoC set the daily reference rate for the currency at 6.2298 per USD, which is about 2% weaker. This unanticipated policy of devaluation that took place after a long period of RMB appreciation since 2010 created a shock to the currency markets (see Appendix A), especially to the currencies in the Asian markets due to the spill over effects. Following these changes, a more volatile RMB as a result of the internationalisation process is expected to generate higher currency risks to the financial markets.
RMB is quoted in two different exchange rates. They are the rate for onshore RMB known as CNY exchange rate, which is controlled by PBoC, and the offshore RMB rate (CNH) that is determined by market forces. The differences in CNY and CNH exchange rates are due to different supply and demand conditions. As one of its internationalisation efforts, CNH was introduced by the Chinese government on 19 July 2010 to allow RMB to be freely traded outside China. The purpose is to develop an offshore RMB bond market 1 (Labuszewski and Ro 2014), and to facilitate the RMB cross-border trade settlements 2 (Liu 2011).
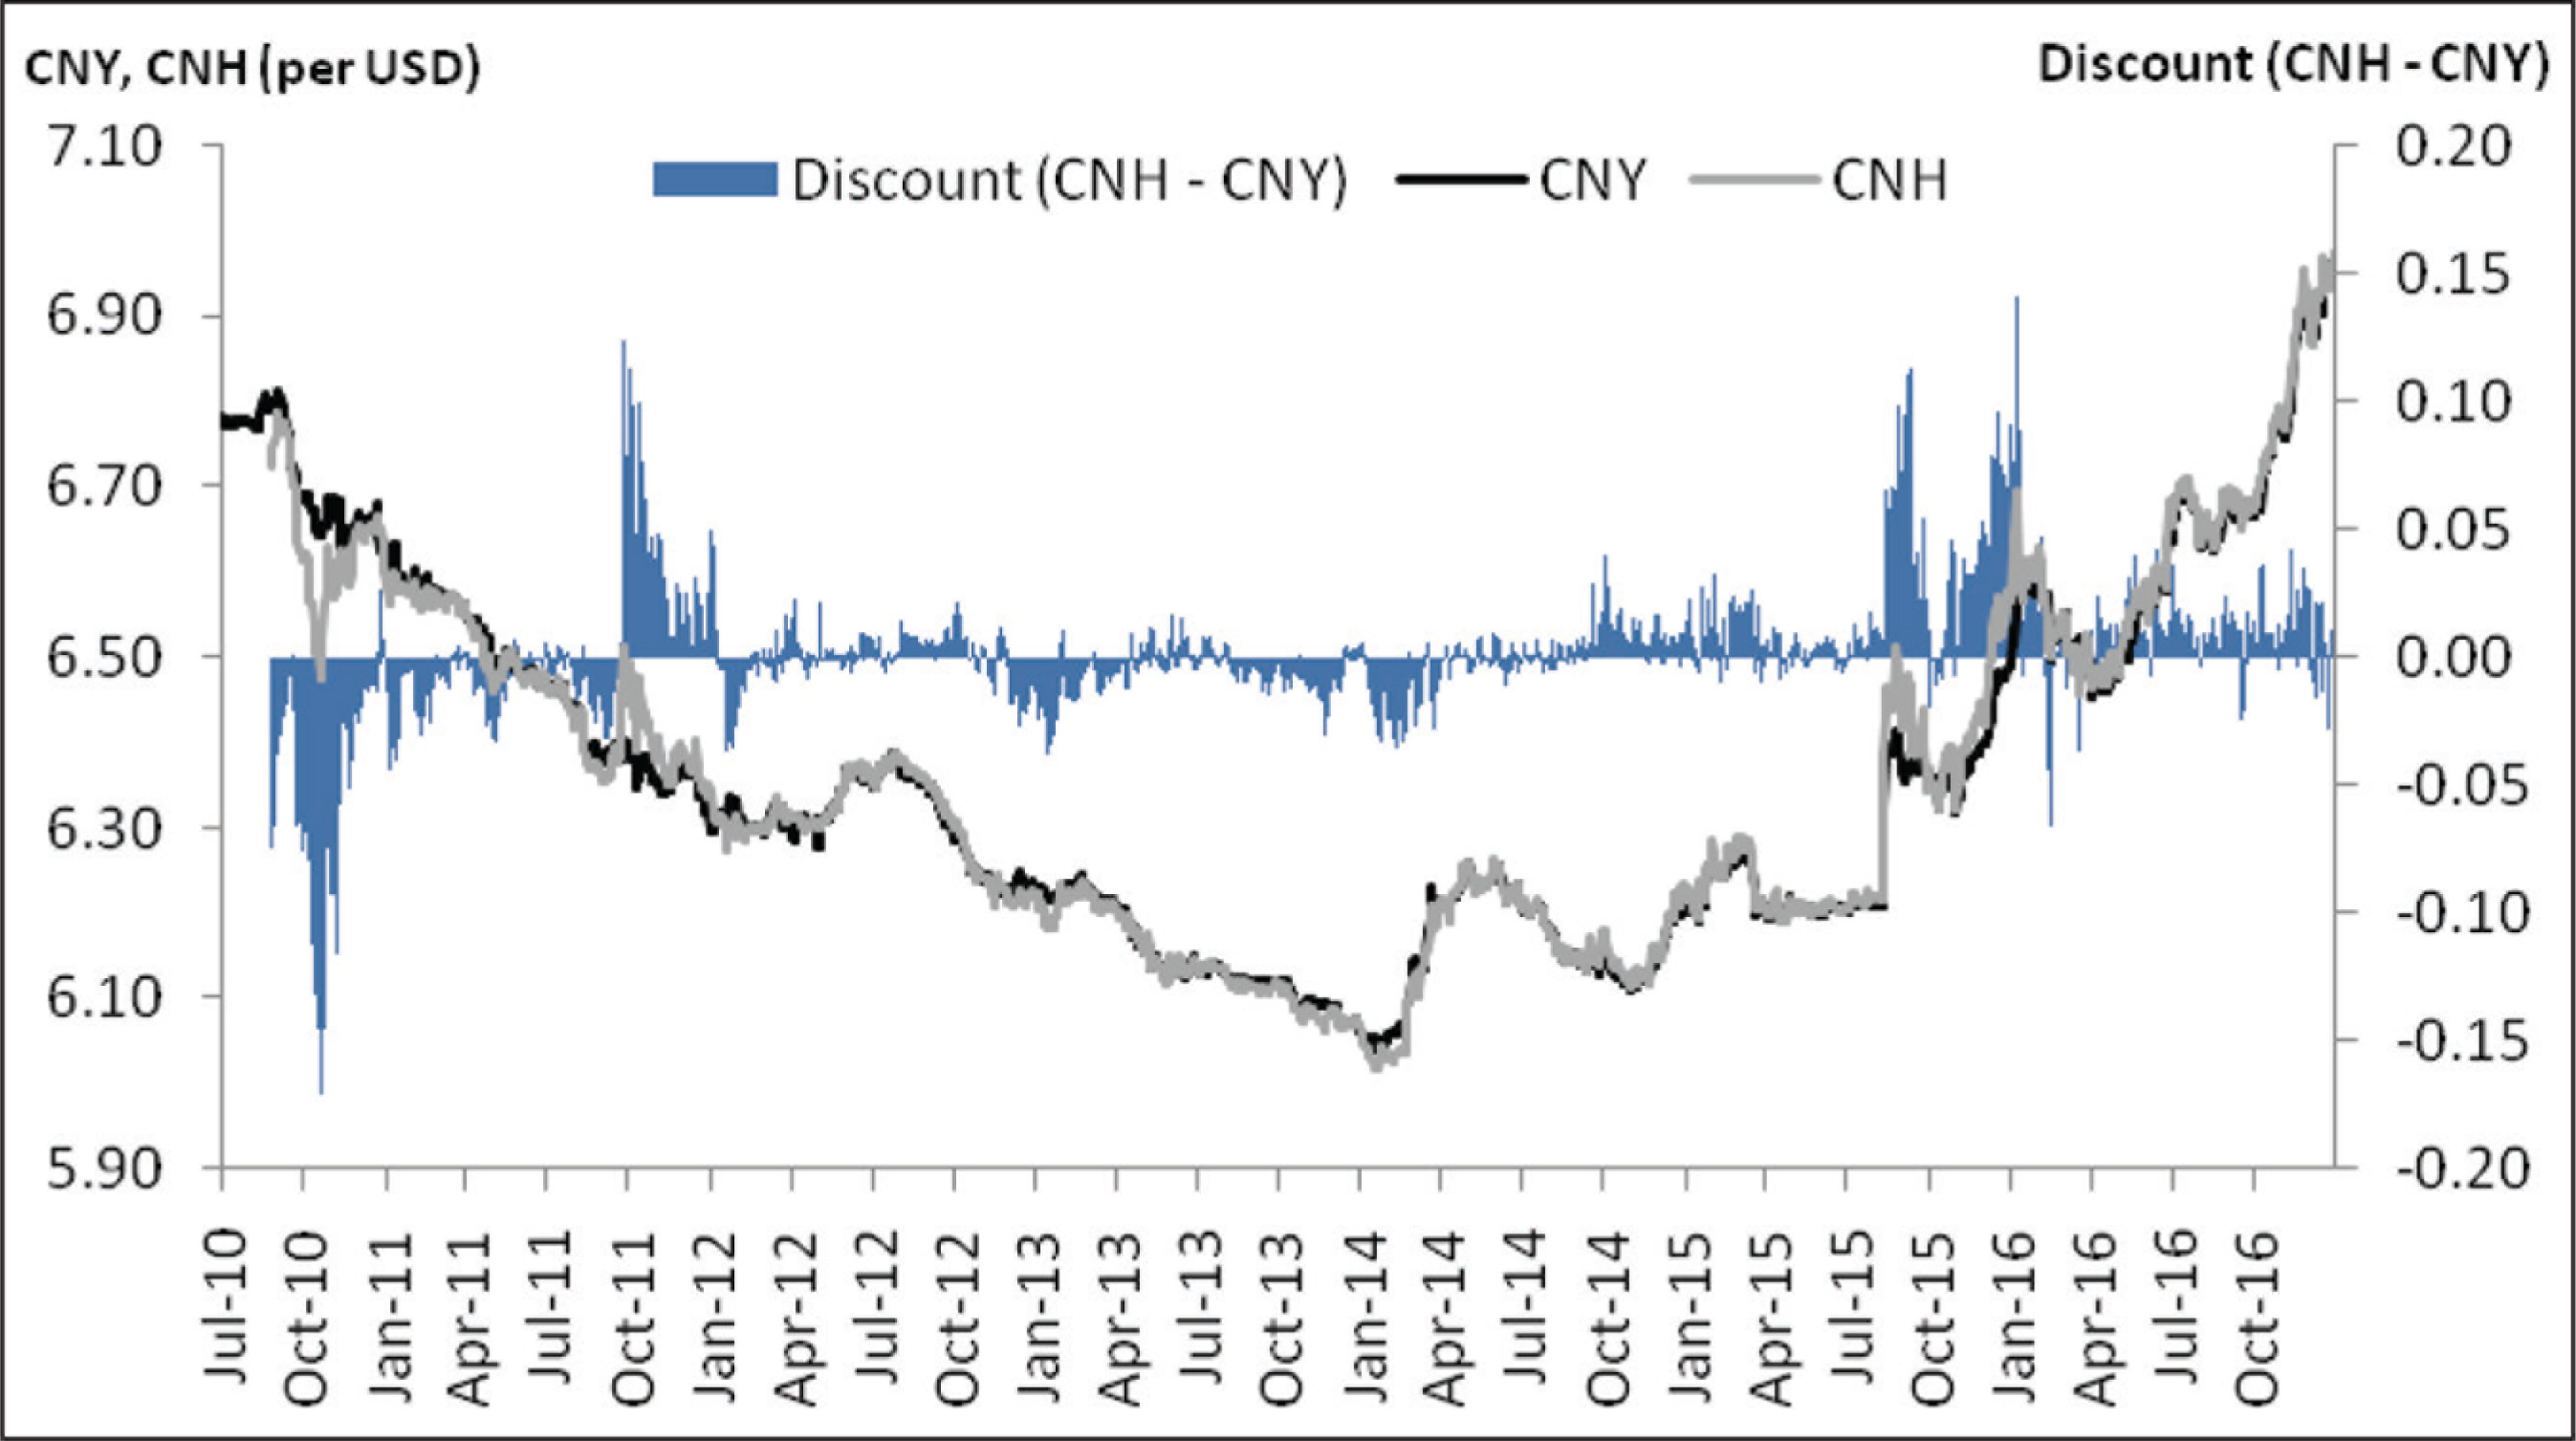
Whether CNY or CNH is the indicative rate has been an issue of attention. Maziad and Kang (2012) observed that ‘market participants offshore would extract policy signals from onshore market prices, while onshore market participants might believe that price development offshore better reflect global market conditions due to its better integration in global financial markets’ (p. 19). From their findings, the researchers believed that market participants tend to follow the offshore rate, which reflects the market conditions better, when turmoil occurs. They also provided evidence that given a market disturbance, both the offshore CNH price movements and volatility could affect the onshore CNY rates as well as its volatility significantly. This further suggests that unpredictable movements in the offshore CNH could also spill over to the volatility of the onshore CNY. Funke et al. (2015) furthered this study to discover the differential between CNY and CNH. Generally, CNH rates differ from CNY rates due to liquidity divergence in the local and international markets that is driven by capital controls, different investor bases, as well as their sensitivities to market shocks. The relatively young CNH market is basically less liquid (with higher bid–ask spreads), and its supply and demand are affected by policy restrictions on cross-border RMB flows. Thus, the CNH daily movements are more volatile compared to CNY (see Figure 2), as CNH is mainly market-driven and fully convertible, while CNY is only allowed to fluctuate within a trading band of ±2%. Further liberalisation of capital control is a key step to narrow the gap between CNY and CNH, so that China can achieve a fully convertible RMB by 2020. Given these changes, China’s exchange rate policy uncertainties are more likely to become a new source of volatility in Asian foreign exchange markets (Bhaskaran 2015).
Volatility in the exchange rate returns of other currencies will be affected by larger CNY and CNH fluctuation due to trade links and financial linkages (IMF 2016). The above discussion brings out the core issue of increased volatility in RMB, and how movements in other currencies are affected, while taking cognisance of the divergence between CNY and CNH rates. ARCH-type models are commonly used to examine exchange rate volatility and copula methods are popular for investigating dependence between different exchange rates. In recent years, a number of researchers have started to extend the GARCH method to the copula-GARCH framework, which has a better ability to capture the dependence structure between two financial assets, by taking into account their volatility. Kamal and Haque (2016) applied the copula-GARCH approach to study the asymmetric dependence structure between daily returns of benchmark stock index and exchange rate in India, Bangladesh and Sri Lanka. Their results showed that both stock and foreign exchange markets suffer higher volatility when market news are positive. Copula models confirmed the existence of upper tail dependence, which added to the evidence that dependence between stock and exchange rate markets has increased during bull market conditions. Kresta (2013) adopted the same methodology to study the currency risk of portfolios that are sensitive to two exchange rate pairs (two risk drivers), as well as those that are sensitive to only one exchange rate pair (the composite risk driver). The copula-GARCH model was found to perform well for capturing the fat tails, volatility clustering, as well as dependence structure of currency risks; and Student-t copulas fitted the data better, compared with Gaussian, Frank and Clayton and Gumbel copulas.
Wang, Cao and Wang (2014) estimated the currency risks of Chinese commercial banks to determine portfolios that are optimal by using the copula-GARCH approach in their study of the joint distribution of USD and Japanese yen vis-à-vis RMB exchange rate yields. They found that under the minimum value-at-risk condition, the optimal holding ratio for the Chinese commercial bank is 35% assets denominated in yen and 65% assets denominated in dollars, as the volatility of dollar is relatively lower. However, the volatility of dollar may be underestimated, as the CNY was re-pegged to the USD during the period of August 2008 to June 2010 due to global financial crisis. Thus, the optimal holding ratio may be affected. Sutiene and Bugiene (2011) removed the time dependence from selected exchange rates by using ARMA-GARCH models, before applying the copula method on the residuals to uncover their dependence. This study suggested when a group of foreign currencies share a similar trend against a given base currency, then the dependence rate between them will be higher. However, the results differ when exchange rate returns are analysed, compared with spot series.
The review above suggests that any analysis of dependence structure of an exchange rate to another should not be conducted without taking volatility into consideration. Since RMB devaluation has led to higher volatility in the currency market, currency tail risks must be considered in examining the dependence structure between two currencies. Past studies on the internationalisation of CNY are mainly focused on its impact on trade (e.g., Kwack et al. 2007; Li et al. 2013; Wei et al. 2000; Yu 2009; Zhang and Sato 2008), or its link with the other macroeconomic variables (e.g., Aloui and Aissa 2016; Han and Zhou 2017; Lin and Lee 2017). The impact of RMB devaluation on its dependence structure with other exchange rate volatility has not received much attention. Comparisons on the dependence structure between CNY and CNH movements with volatility of other exchange rate returns, or currency risks, are even more limited. While most studies (for instance, Kresta 2013; Lai and Goh 2019; Sutiene and Bugiene, 2011; Wang et al. 2014) examine the dependence structure between exchange rate returns, this article investigates the impact of movements in RMB on the exchange rate volatility of other currencies as a measure of their currency risks. Special reference is made to the onshore CNY and offshore CNH, and within the context of CNY devaluation. Further, asymmetric dependence between markets can occur when the dependence structure in an upmarket is different from that in a downmarket (see, for example, Du and Lai 2017). This study employs the copula-TARCH method for considering such asymmetric dependence. As shown in past studies (e.g., Kamal and Haque, 2016; Kresta 2013), this class of methods has good statistical performance when the process follows a distribution with fat tails and displays volatility clustering, which is the case for currency returns. As the purpose of this article is to examine currency risks due to unexpected and excessive RMB movements, tail dependence remains the focus of analysis. The copula approach is suitable for capturing the relationship in the tails when extreme event occurs. Currency risks and returns are of different statistical moments and their distributions may not be the same. Copulas, derived from a joint distribution that links the marginal distributions of these two series together, do not make any assumptions about the marginal distributions, or that they are to be the same. The other advantage is that it also allows for non-linear interactions. Many studies on RMB movements include only a small number of currencies (e.g., Du and Lai 2017; Keddad, 2016; Lien et al. 2014; Ma and McCauley 2011). This study expands the coverage to include a total of 15 exchange rates of major currencies, as well as the currencies in the ASEAN-5 and other Asian exchanges.
Methodology
The Data and Variables
The sample covers daily exchange rate data from 1 July 2010 to 31 December 2016, with a total of 1,697 observations. The sample period starts after the de-pegging of CNY that took effect from 21 June 2010. The exchange rates of 15 currencies against USD were collected from Bloomberg and the official websites of a few central banks, including the People’s Bank of China (PBoC). The currencies selected are categorised into three main groups, which are:
Major currencies: Euro (EUR), British pound (GBP), Australian dollar (AUD) and Japanese yen (JPY) Asian currencies: Onshore Chinese yuan (CNY), offshore Chinese yuan (CNH), Indian rupee (INR), Korean won (KRW), Taiwan dollar (TWD) and Hong Kong dollar (HKD) ASEAN-5 currencies: Malaysian ringgit (MYR), Singapore dollar (SGD), Thai baht (THB), Indonesian rupiah (IDR) and Philippine peso (PHP)
All of the 15 currencies are quoted in local currency base. Thus, an increase (decrease) in a currency will indicate an appreciation (depreciation) against USD. Throughout this article, we use the notation CurrencyUSD to represent the rate of USD vis-à-vis the selected currency. For example, CNYUSD is the exchange rate of USD per unit of CNY.
There are two key variables of interests. First is the exchange rate returns, Rit, where I = EURUSD, GBPUSD, …, PHPUSD, t = 1, …, T, and T is the sample size. The returns are computed from the daily spot rates (Pit) for currency-i in our analysis as below.

Throughout this article, the notation prefixed with ‘R_’ represents the return of an exchange rate. For example, R_CNYUSD represents the return series for CNYUSD.
The second variable of interest is the volatility of exchange rate returns. The conditional volatility is generated using the following TARCH model after accounting for some shocks in the financial market that affect the daily exchange rate series.

where

is the conditional volatility of the exchange rate returns, where dit = 1 when bad news affects the market (i.e., when innovation uit < 0) and zero otherwise.
Tests for Stationarity
The stationarity properties of the exchange rate return series are checked to avoid spurious results. All the series are subject to the augmented Dickey Fuller and Phillips–Perron t-tests for unit roots. The augmented Dickey Fuller test is computed from a regression with drift and time trend as follows.

The lag length m is selected using the Akaike information criterion (AIC), subject to a maximum of 20. The Phillips–Perron test is computed from the regression with drift and trend:

and the lag length is selected based on the Bartlett kernel method with Newey–West bandwidth. The null hypothesis of unit root H0: δ = 0 is tested against the alternative of H1: δ < 0. A rejection of the null hypothesis implies that the series is stationary. The unit root tests are also performed on the exchange rate returns after controlling for the shocks that affect the exchange rate markets in the TARCH model of equations (2) and (3).
Threshold Generalised Autoregressive Conditional Heteroscedasticity(TARCH) Model
The relationship between the volatility of the three groups of exchange rates mentioned in the first part of the second section with CNY returns is firstly investigated using a regression approach. The baseline model is an autoregressive mean process with a TARCH conditional variance as follows:
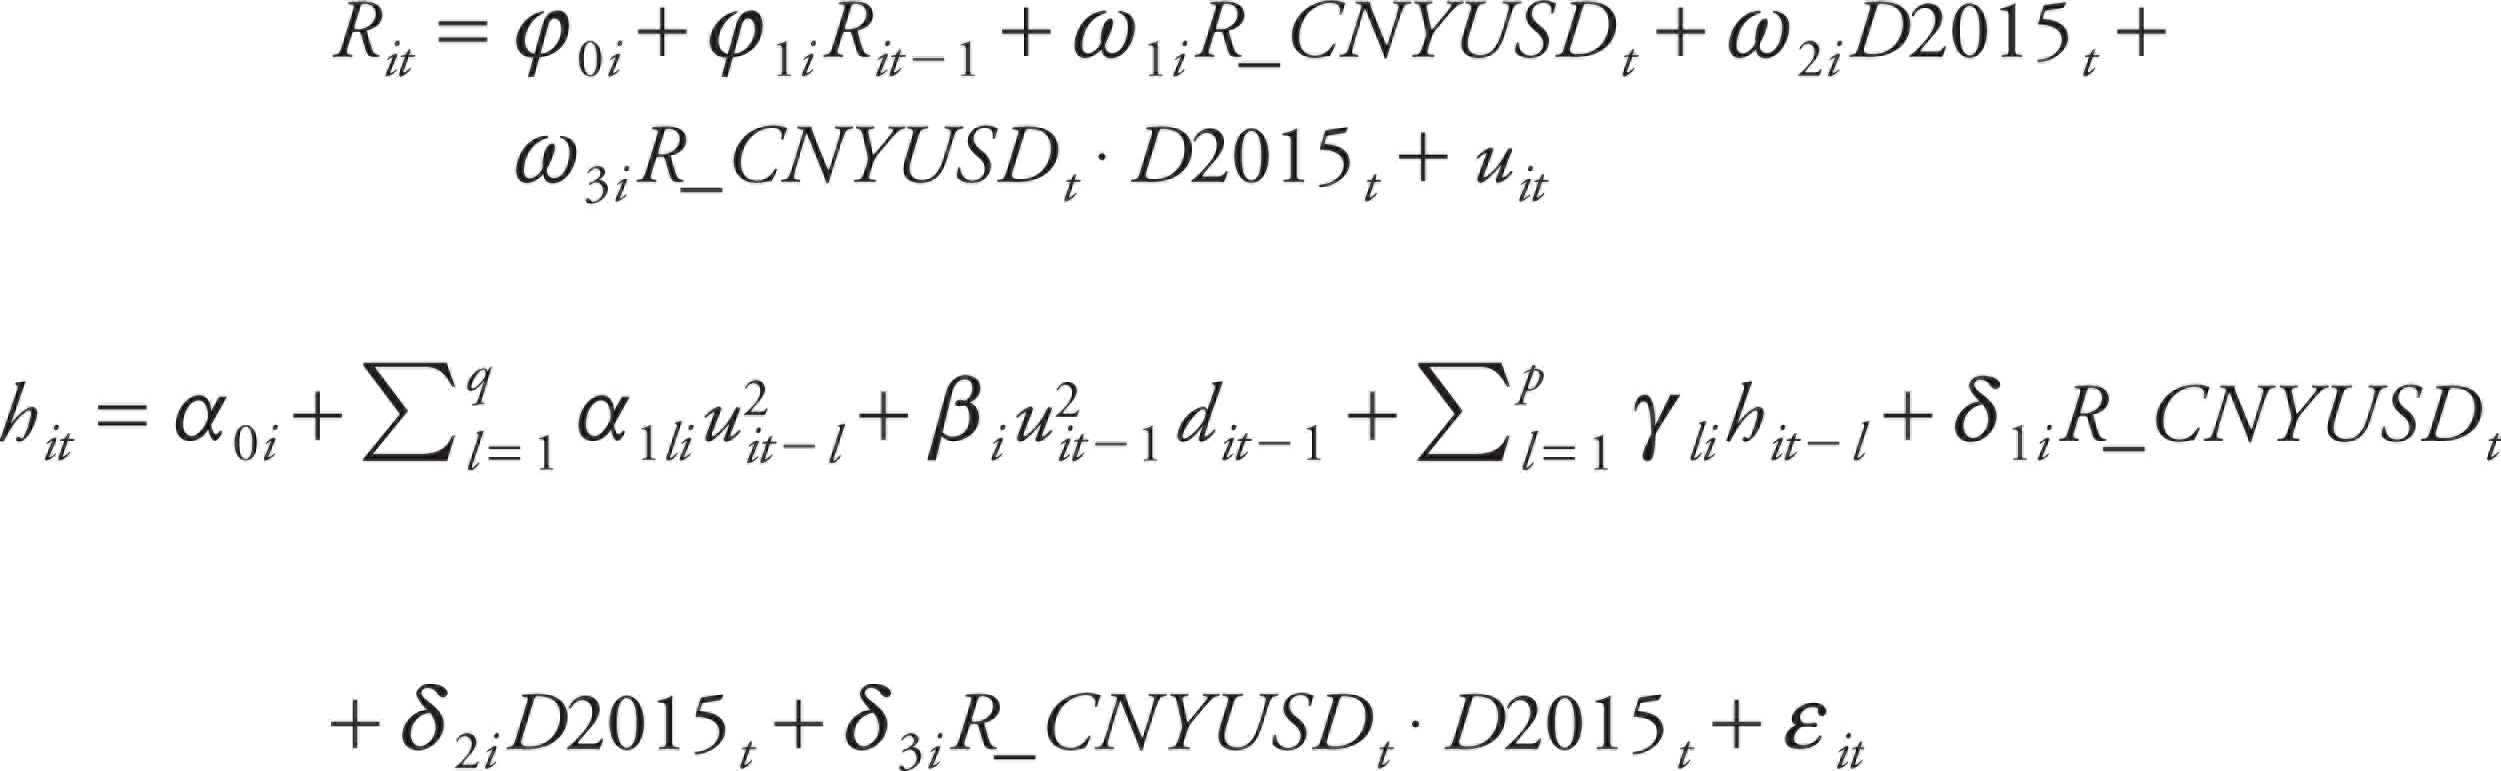
where p and q are the number of lags in the GARCH component within the conditional variance process. The number of lags p and q are decided based on the autocorrelation function and partial autocorrelation function of
The null hypothesis H0: ω1i = 0 is tested. A rejection of the null hypothesis and a positive coefficient will suggest that a depreciation in CNY or CNH will lead to a drop in the exchange rate returns of other currencies. The hypotheses H0: ω2i = 0 and H0: ω3i = 0 are tested to examine the impact of CNY devaluation. For conditional variance, the hypothesis H0: δ1i = 0 is tested. A significantly negative δ1i coefficient indicates that a depreciation in CNY or CNH will increase the return volatility of exchange rate under consideration. The hypotheses H0: δ2i = 0 and H0: δ3i = 0 are also tested to check if the sensitivity of this volatility to CNY and CNH movements has changed after the devaluation of CNY.
Copula-Tarch Model
The dependence structure between the volatility of exchange rate returns with CNY and CNH returns is examined through copulas. The combination of copula method with TARCH, known as copula-TARCH (Lai, Chen and Gerlach 2009), is used. The TARCH model specified in equations (2) and (3) is first estimated to obtain the conditional standard deviation for exchange rate return i, or
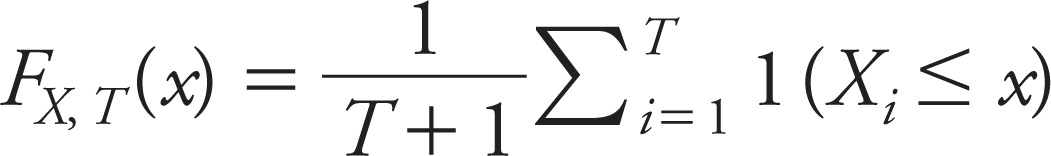
The factor T+1 allows us to avoid boundary problems when carrying density evaluation, where ‘the quantities FX,T(Xi) are the ranks of the Xi’s divided by T+1, and thus take values

The standardised CNY and CNH returns are fitted into a standardised Student’s t-distribution,
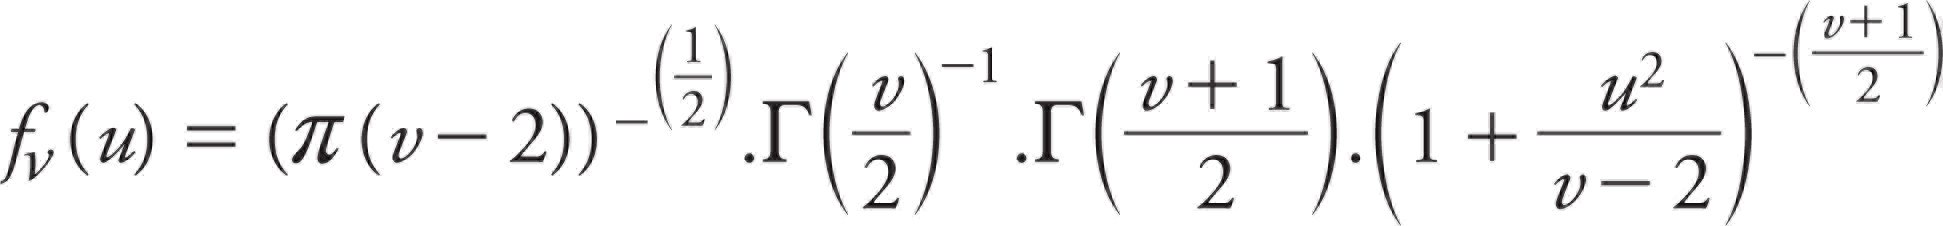
where v is the degree of freedom and Γ is the gamma function, to transform the domain of their distribution to [0,1]. Subsequently, the tail dependence analysis is performed on the transformed returns and conditional standard deviations. Since we expect a sharp decline in CNY or CNH (or large negative returns) to lead to a higher exchange rate return volatility of other currencies, we multiply the standardised CNY returns and CNH returns by –1. This means that the upper tail of their distributions will represent large negative exchange rate returns. Our analysis will then focus on the upper tail dependence between CNY and CNH exchange rate returns with the return volatility of other exchange rates.
The discussion of the copula approach follows Alexander (2008, 253–99). We write the copula density function as c(u1,u2), where u1 and u2 represent the conditional standard deviations and the standardised CNY/CNH returns after transformation into a uniform distribution, respectively. A non-linear copula model can be applied to non-linear and non-normally distributed variables to capture their tail dependence structure. Generally, the copula families are divided into two groups, namely, the elliptical copulas that are symmetric in tails, and the Archimedean copulas that exhibit specific tail behaviour. This study focuses on the Archimedean copula family. The Gumbel copula that captures the upper tail dependence is considered.
The bivariate Gumbel copula function can be written as:

where δ is the parameter to generate the Gumbel copula function. The density function is:

where

All the parameters of marginal distributions (v) and copulas (δ) are estimated using the maximum likelihood estimation. The tail dependence coefficient is estimated for the full sample period, as well as the sub-sample period before devaluation. Further analysis is performed by comparing another two non-overlapping sub-samples, one representing the period before and the other one after the CNY devaluation. The first sub-period is from 1 January 2014 to 10 August 2015 which has a total of 433 observations. The second sub-sample includes 364 observations from 11 August 2015 to 31 December 2016.
In sum, the design of the analysis begins with tests of unit root. TARCH models are then applied to obtain estimates for the sensitivity of exchange rate return volatility to movements in CNY and CNH before and after the CNY devaluation. The Gumbel copula method is subsequently used to estimate the upper tail dependence between the CNY and CNH returns with return volatility of other exchange rates, represented by their conditional standard deviations. We compare the results from two sub-periods, which are before and after the CNY devaluation.
Empirical Analysis
The unit root test results for the exchange rate returns as well as the returns after controlling for market shocks are reported in Table 1. The null hypothesis of a unit root is rejected for all the 15 exchange rate return series. The ADF and PP test statistics are less than the critical value at 1%. The results provide evidence that the exchange rate return series are stationary. Similar findings are obtained for all the exchange rate returns when the market shocks have been considered. This suggests that the market shocks did not change the stationarity property of the data.
Results of Unit Root Tests for the Exchange Rate Returns

The critical values for both the tests are –3.9635 and –3.4125 at 1% and 5%, respectively. R_CurrencyUSD represents the return of US dollar (USD) vis-à-vis the selected currency. The currencies are euro (EUR), British pound (GBP), Australian dollar (AUD),Japanese yen (JPY), onshore Chinese yuan (CNY), offshore Chinese yuan (CNH), Indian rupee (INR), Korean won (KRW), Taiwan dollar (TWD), Hong Kong dollar (HKD), Singapore dollar (SGD), Malaysian ringgit (MYR), Thai baht (THB), Indonesian rupiah (IDR) and Philippine peso (PHP).
Tarch Model
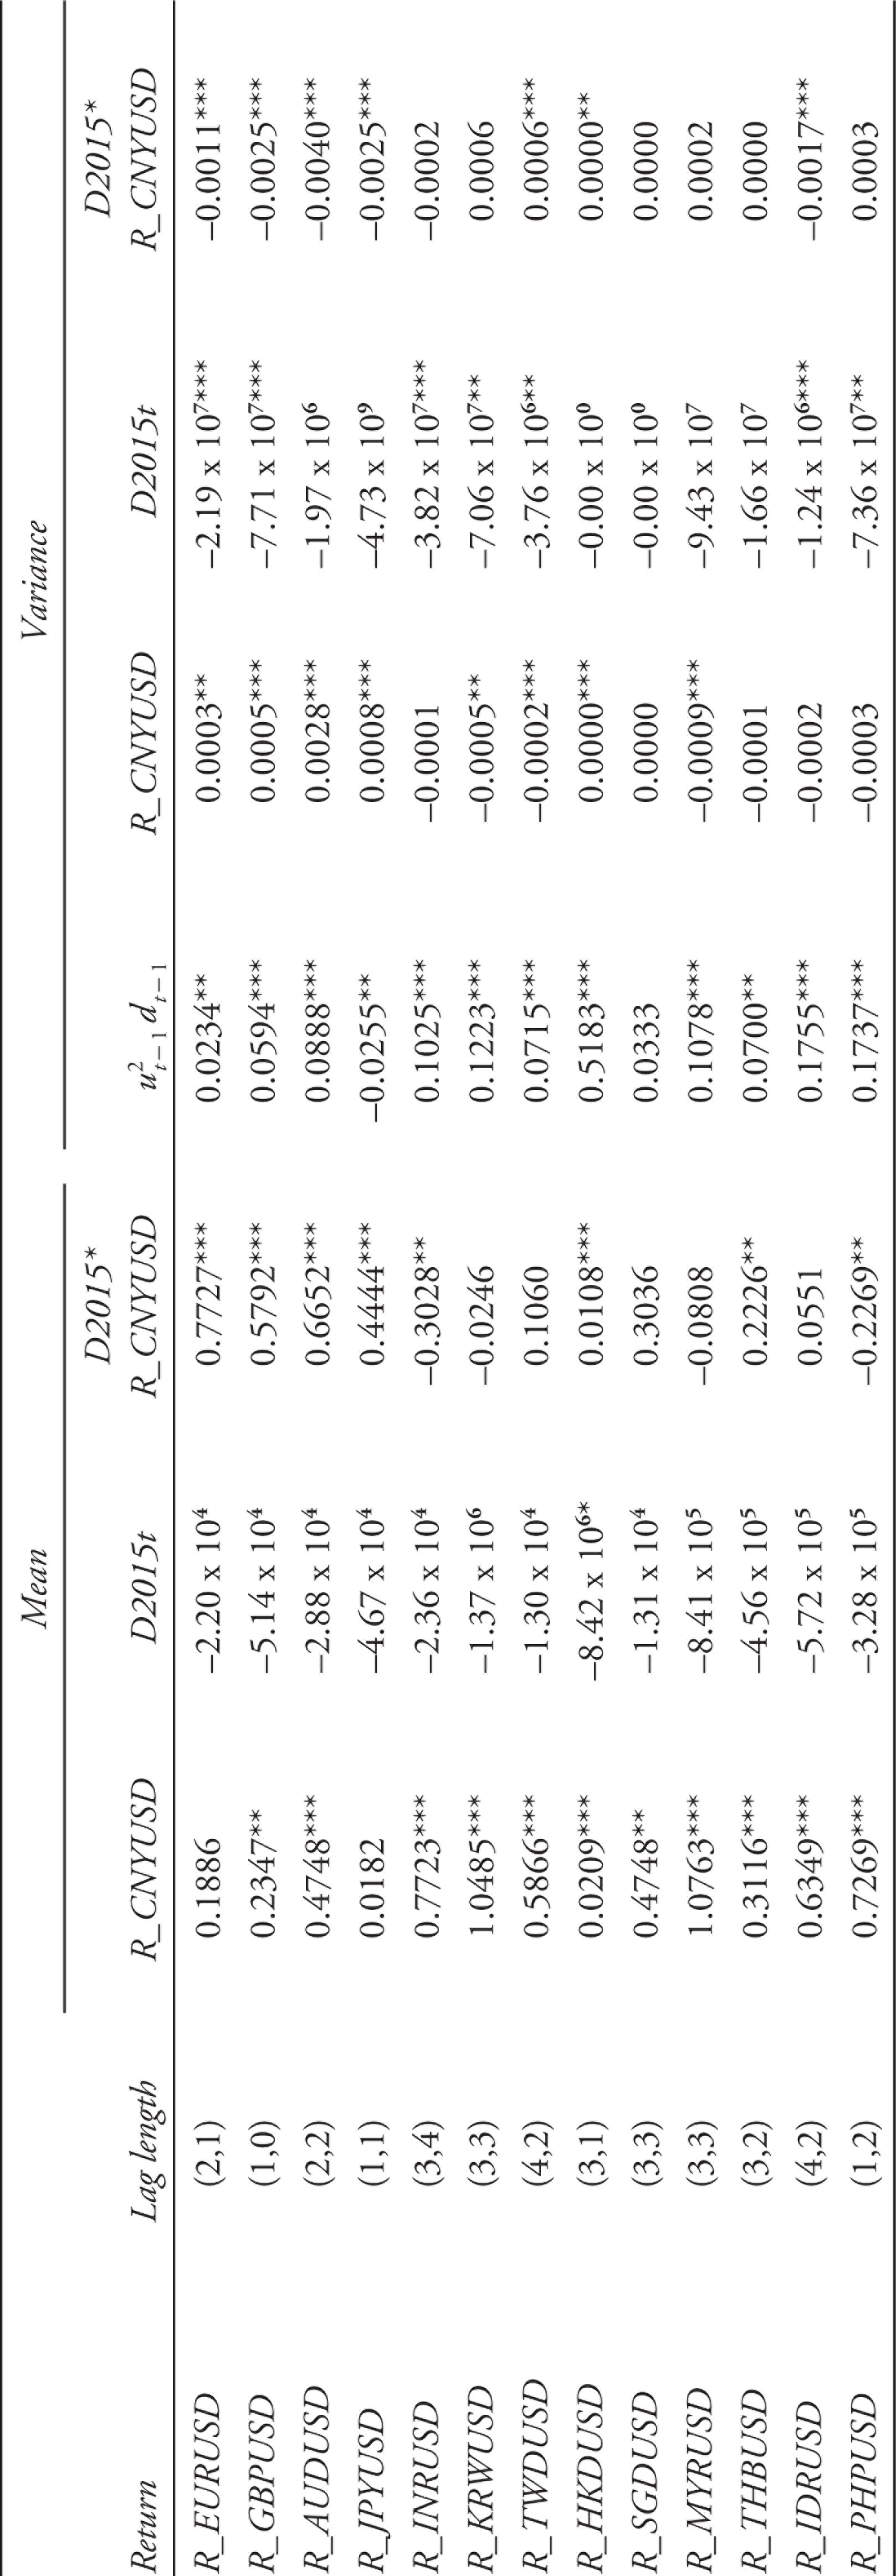
The sensitivity of returns and volatility of 13 selected exchange rates to the CNY and CNH movements are examined by estimating equation (6). The results in Table 2 show that all of the exchange rate returns have significant positive relationship with the CNY return, except for EUR and JPY. MYR is the currency that is most sensitive in reaction to changes in CNY rate, followed by KRW. Overall, when CNY registers a depreciation, the exchange rate returns of other currencies move in the same direction as well.
Estimated Parameters from TARCH Model for CNY Returns

R_CurrencyUSD represents the return of US dollar (USD) vis-à-vis the selected currency. The currencies are euro (EUR), British pound (GBP), Australian dollar (AUD),Japanese yen (JPY), onshore Chinese yuan (CNY), Indian rupee (INR), Korean won (KRW), Taiwan dollar (TWD), Hong Kong dollar (HKD), Singapore dollar (SGD), Malaysian ringgit (MYR), Thai baht (THB), Indonesian rupiah (IDR) and Philippine peso (PHP).
The dummy variable D2015 t in the mean equation is not significant. The interaction term R_CNYUSDt • D2015 t is significant for eight return series, and most of them are the major currencies. They have become more sensitive in reaction to the CNY movements after the unexpected policy move of RMB devaluation. The sensitivity to CNY movements has increased the most in the case of EUR, AUD, GBP and JPY.
The estimates in the TARCH variance equation suggest that bad market news increases return volatility significantly in almost all of the currency markets, providing justification to the use of the model. After the RMB devaluation, the volatility in exchange rate returns of the major currencies including EUR, AUD, GBP and JPY have turned to become higher when CNY weakens. The same effect is found only in the case of IDR among the other currencies.
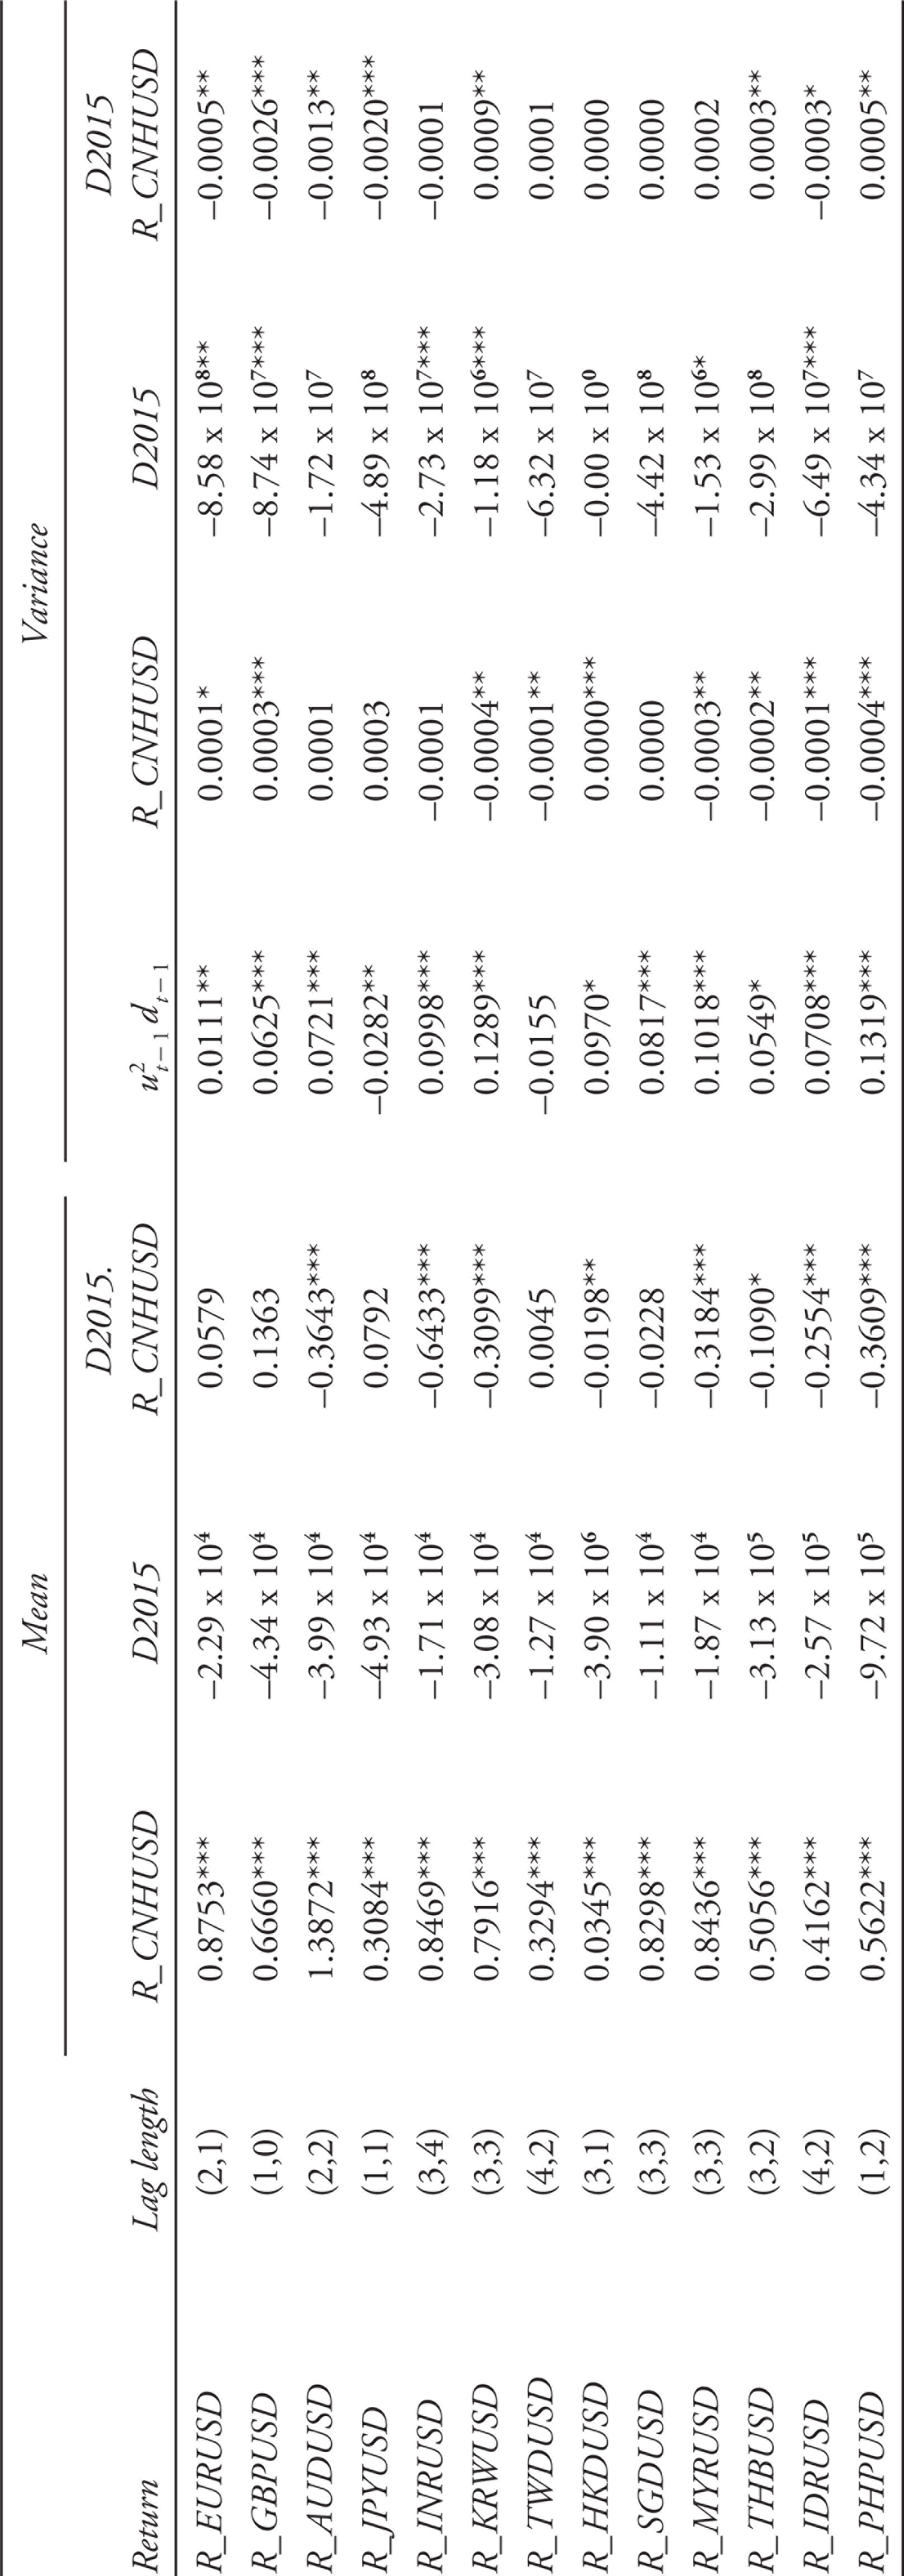
The estimated relationship with movements in CNH is reported in Table 3. After the CNY devaluation, the sensitivity of some exchange rate returns to the CNH movements have eased off in at least eight currencies. This is in contrast with the impact of the CNY movements reported in Table 2. The stronger association between the returns of the major currencies with CNY movements after the RMB devaluation is not found with CNH.
Estimated Parameters from TARCH Model for CNH Returns

R_CurrencyUSD represents the return of US dollar (USD) vis-à-vis the selected currency. The currencies are euro (EUR), British pound (GBP), Australian dollar (AUD),Japanese yen (JPY), offshore Chinese yuan (CNH), Indian rupee (INR), Korean won (KRW), Taiwan dollar (TWD), Hong Kong dollar (HKD), Singapore dollar (SGD), Malaysian ringgit (MYR), Thai baht (THB), Indonesian rupiah (IDR) and Philippine peso (PHP).
On the other hand, the impact of CNH movements on volatility is consistent with the findings for CNY after the RMB devaluation. The volatility in exchange rate returns of the major currencies has become higher when CNH weakens. The same impact is found for IDR only among the other currencies. However, the volatility in R_KRWUSD, R_PHPUSD and R_THBUSD has turned to become lower when CNH depreciates.
As a summary, the CNY devaluation has a significant impact on not only the return, but also the volatility of returns in the exchange rate of other currencies. After devaluation, a depreciation in both CNY and CNH leads to higher return volatility of the major currencies. This impact, however, is generally not significant for the exchange rates of the selected Asian and ASEAN-5 countries.
Copula-Tarch Model
The distributions of financial data are known to be highly skewed and do not follow a normal distribution. These properties can affect the findings from TARCH model. The dependence structure between the CNY and CNH exchange rate returns with the return volatility of the other exchange rates is further examined using the copula-TARCH model. Our analysis focuses on the upper tail dependence between the negative CNY and CNH returns (transformed to positive values) with the volatility of other exchange rate returns. The Gumbel copula that captures the upper tail dependence and allow for asymmetric tail responses is applied in this case.
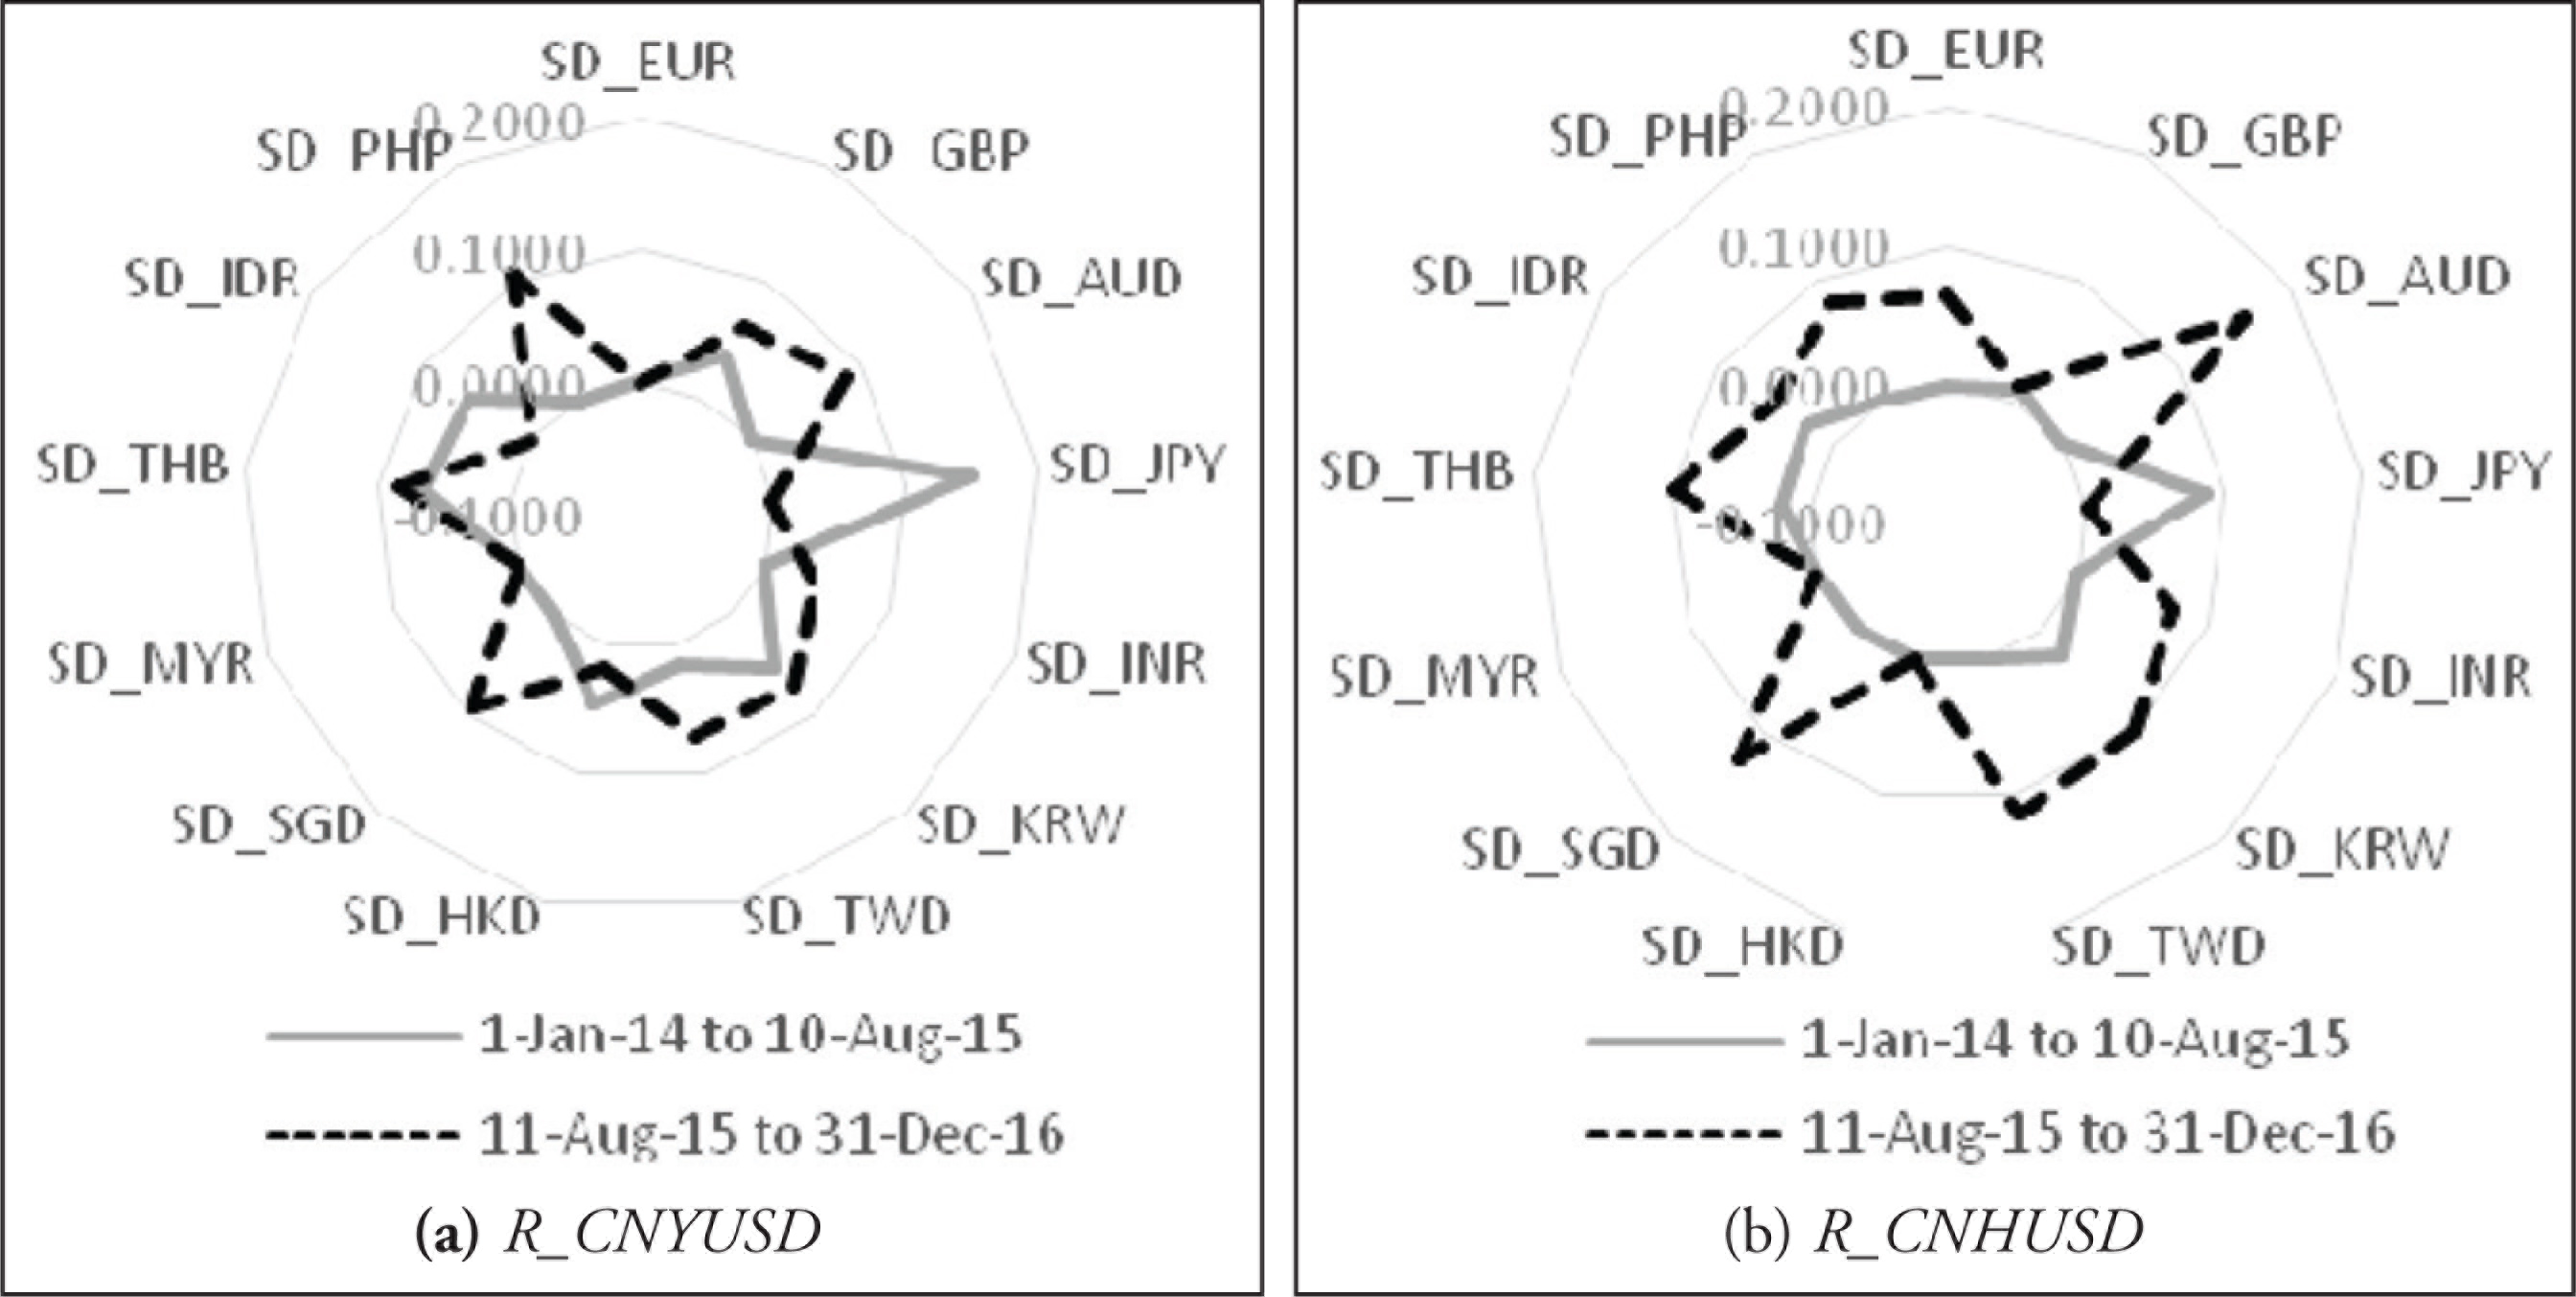
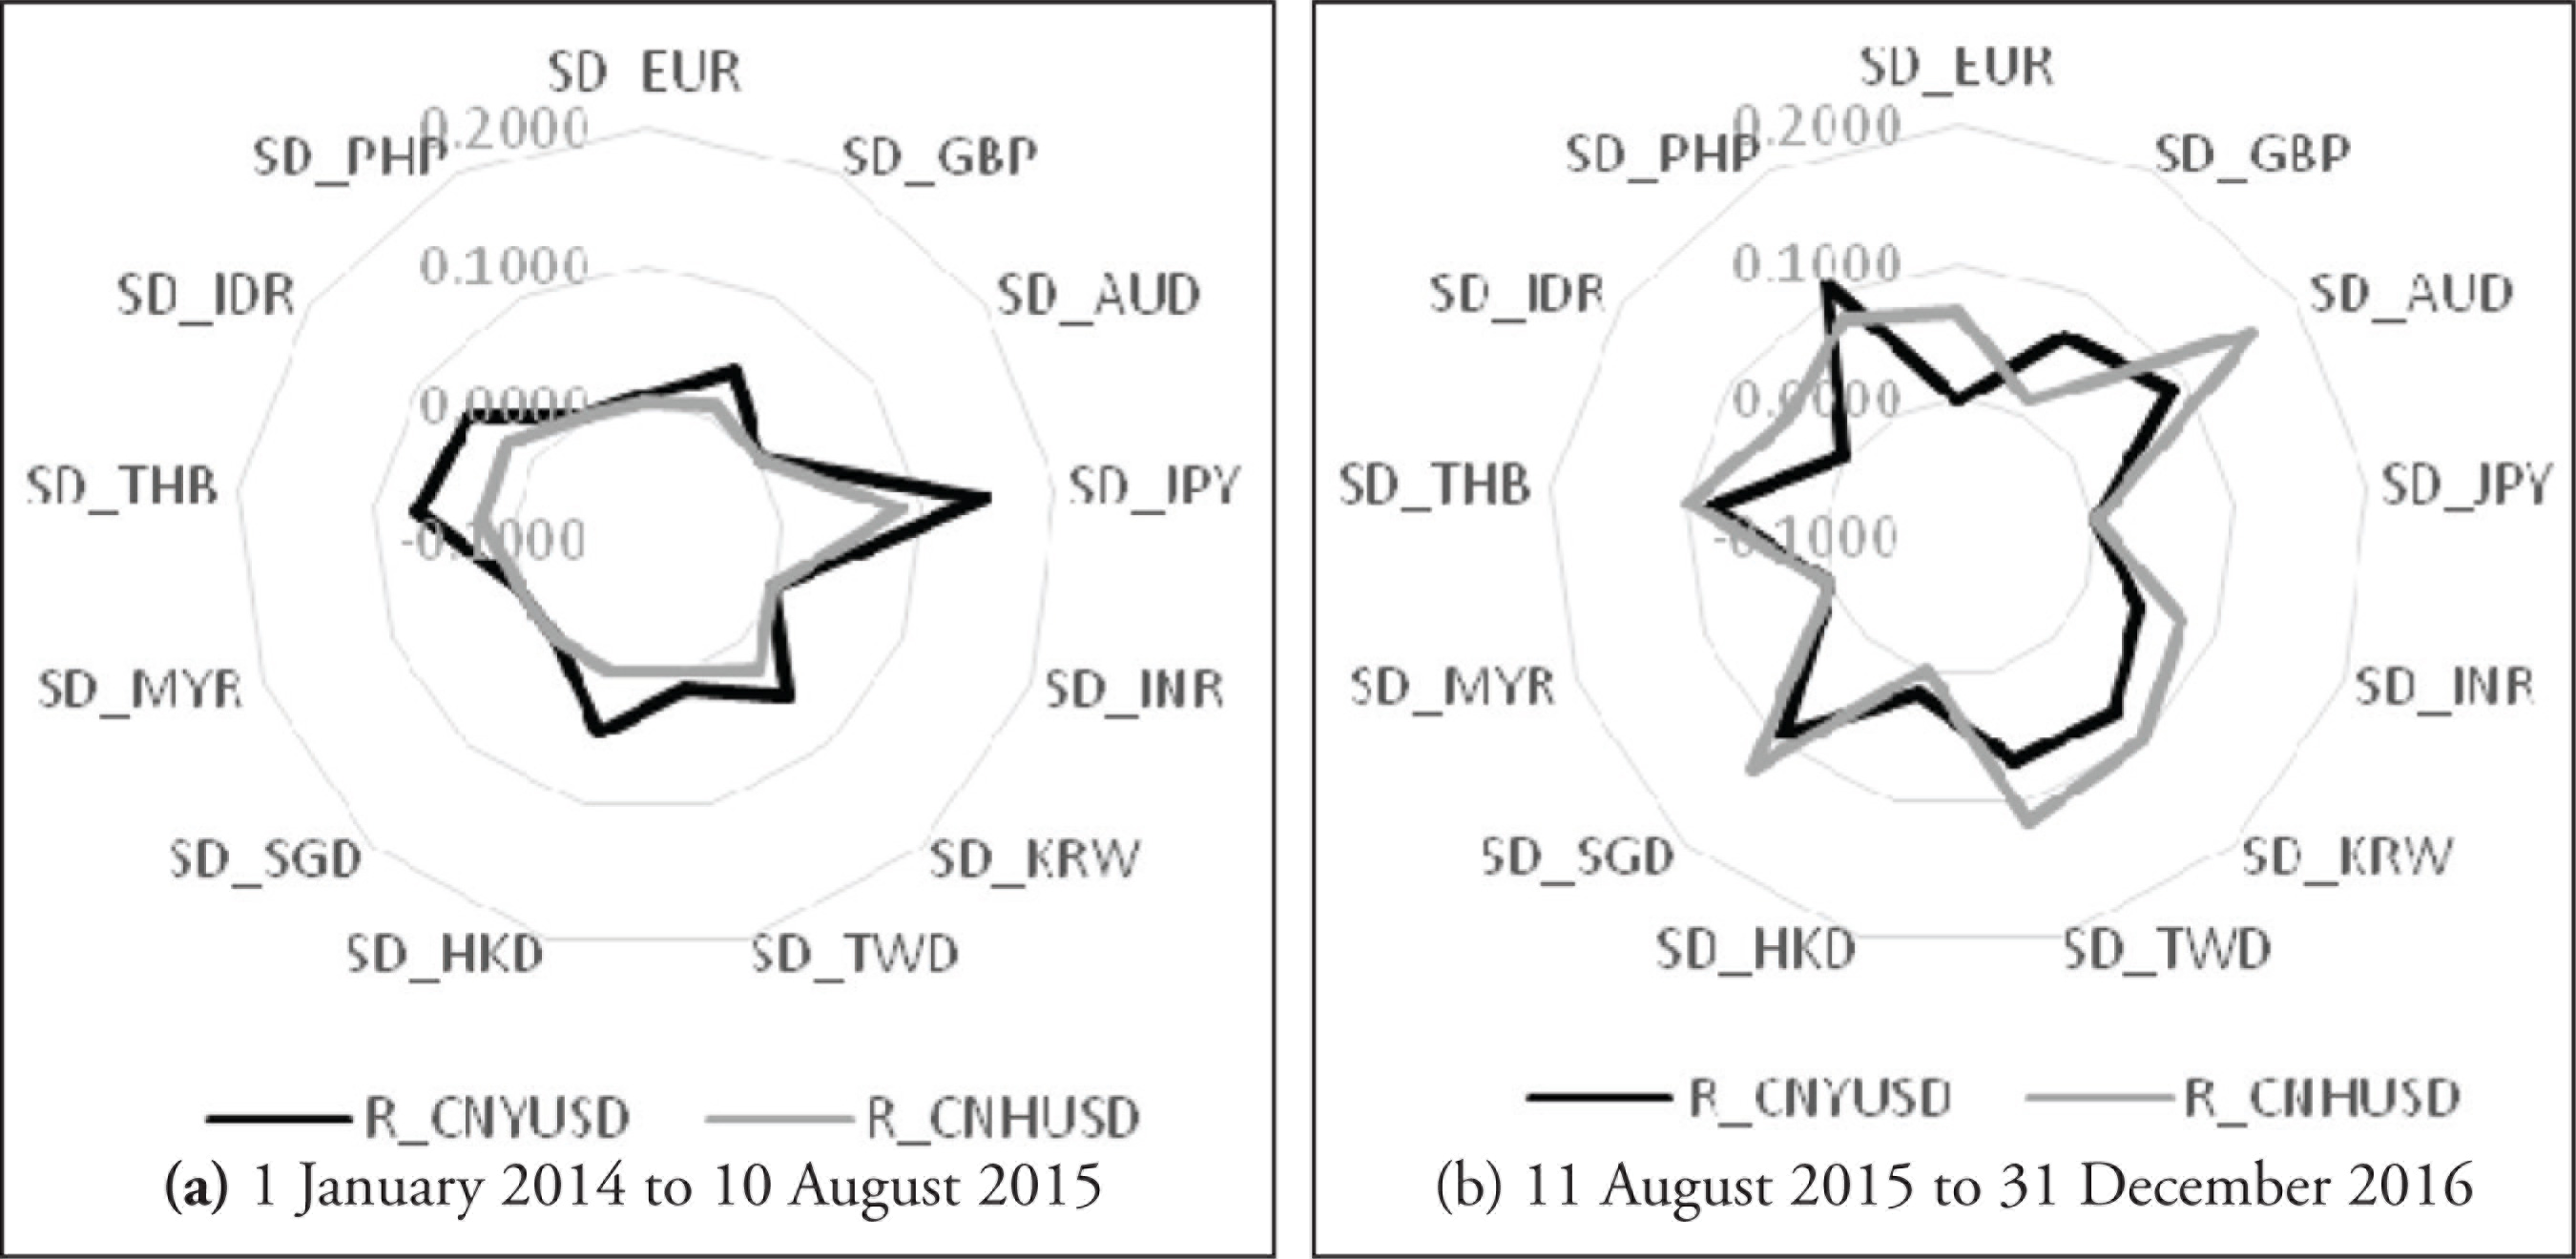
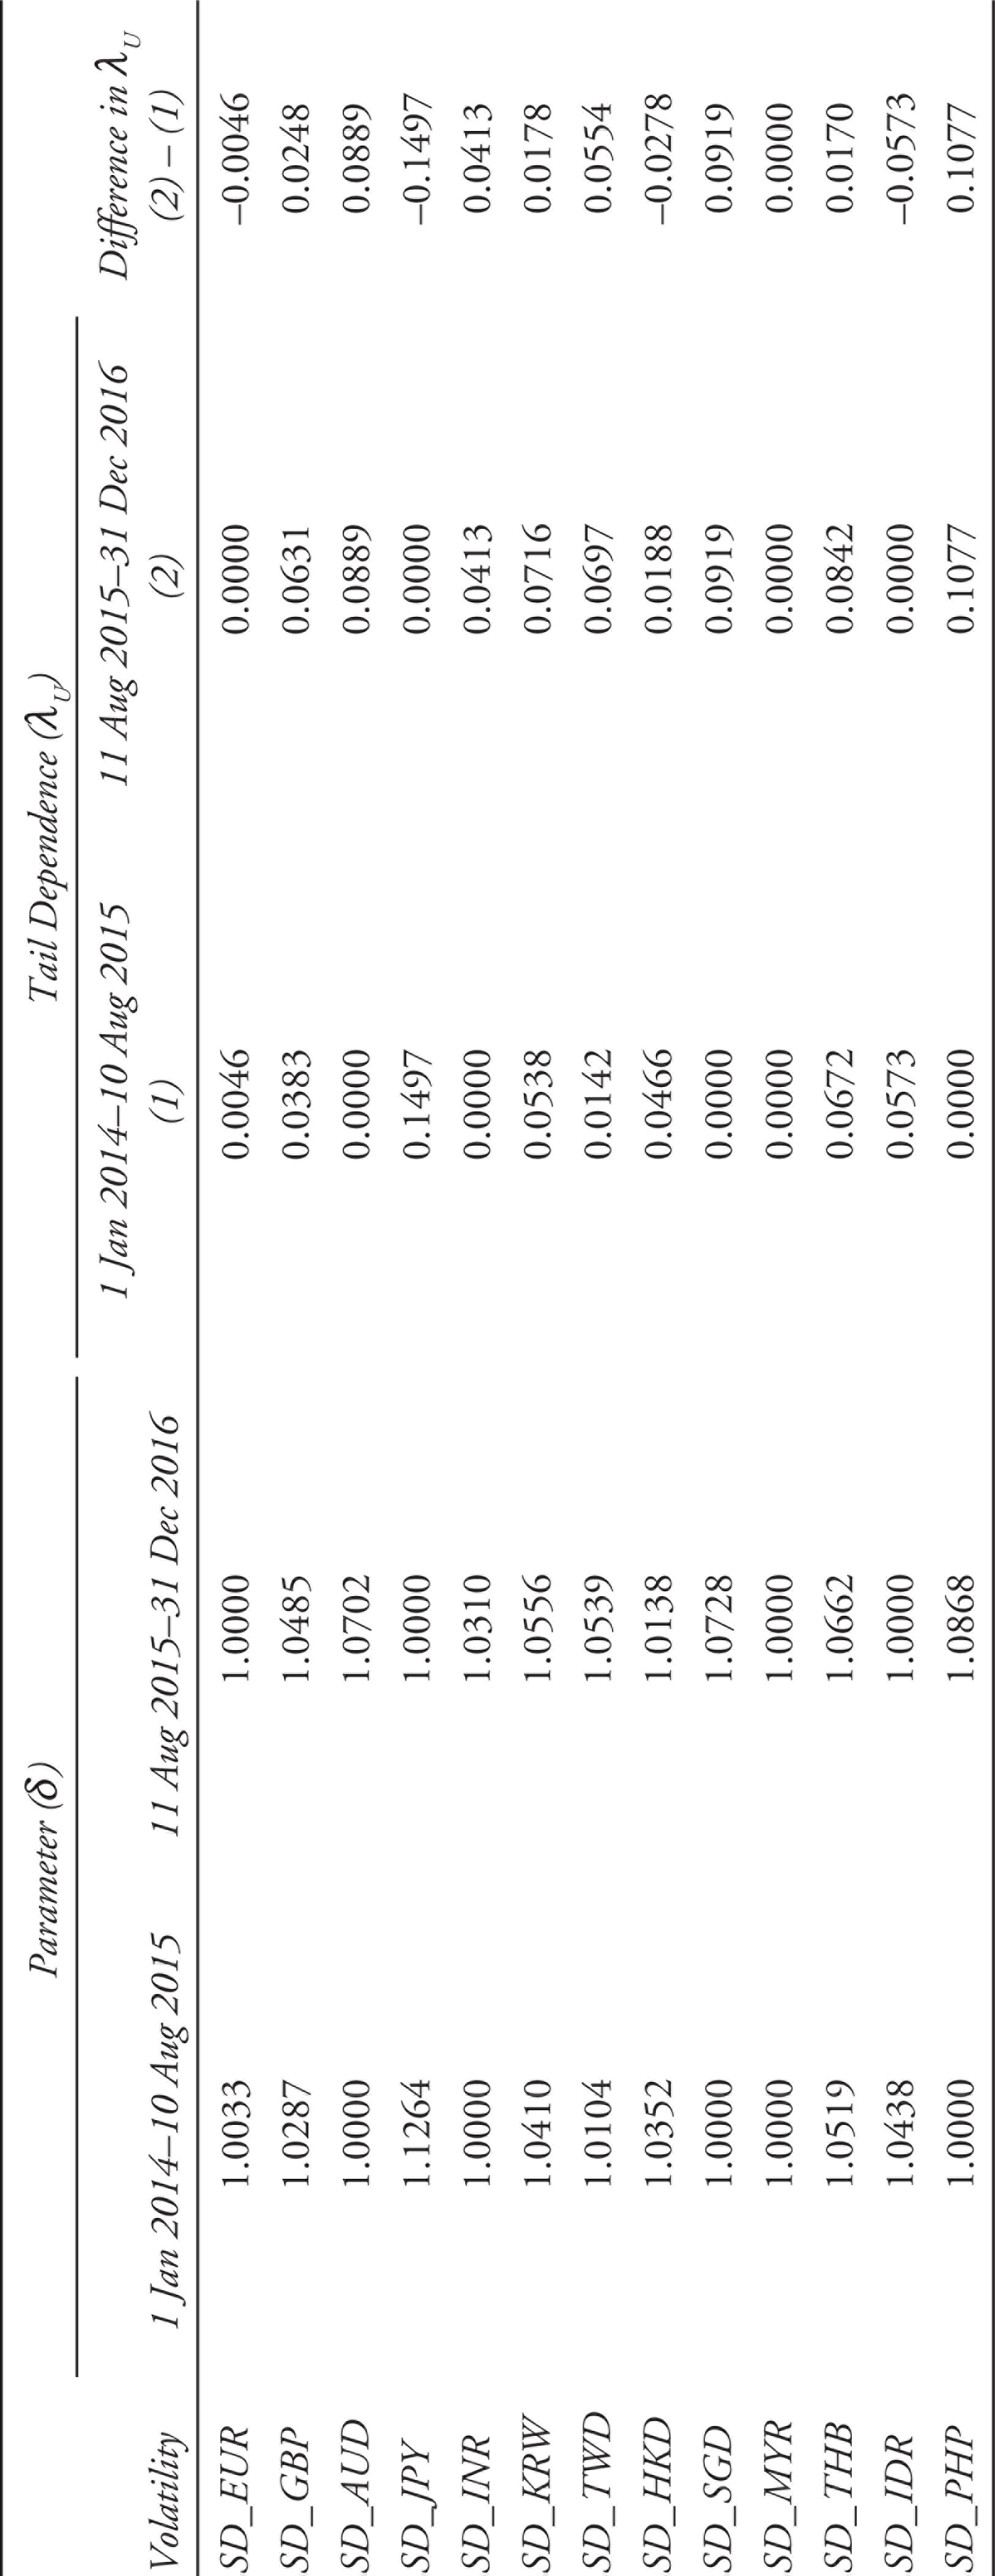
When two non-overlapping sample periods, before the RMB devaluation (1 January 2014 to 10 August 2015) and after the devaluation (11 August 2015 to 31 December 2016) are compared for the case of CNY, a strong contrast is found in the results (see Table 4). The estimates of tail dependence are generally much larger for the period after the RMB devaluation compared to the estimates for the period before the devaluation, suggesting that a higher dependence has occurred. The tail dependence has increased after the devaluation for nine of the 13 currencies considered (see Figure 3[a]). This is especially obvious for AUD, INR, TWD, SGD and PHP—the currencies of countries that have trade and financial linkages with China.
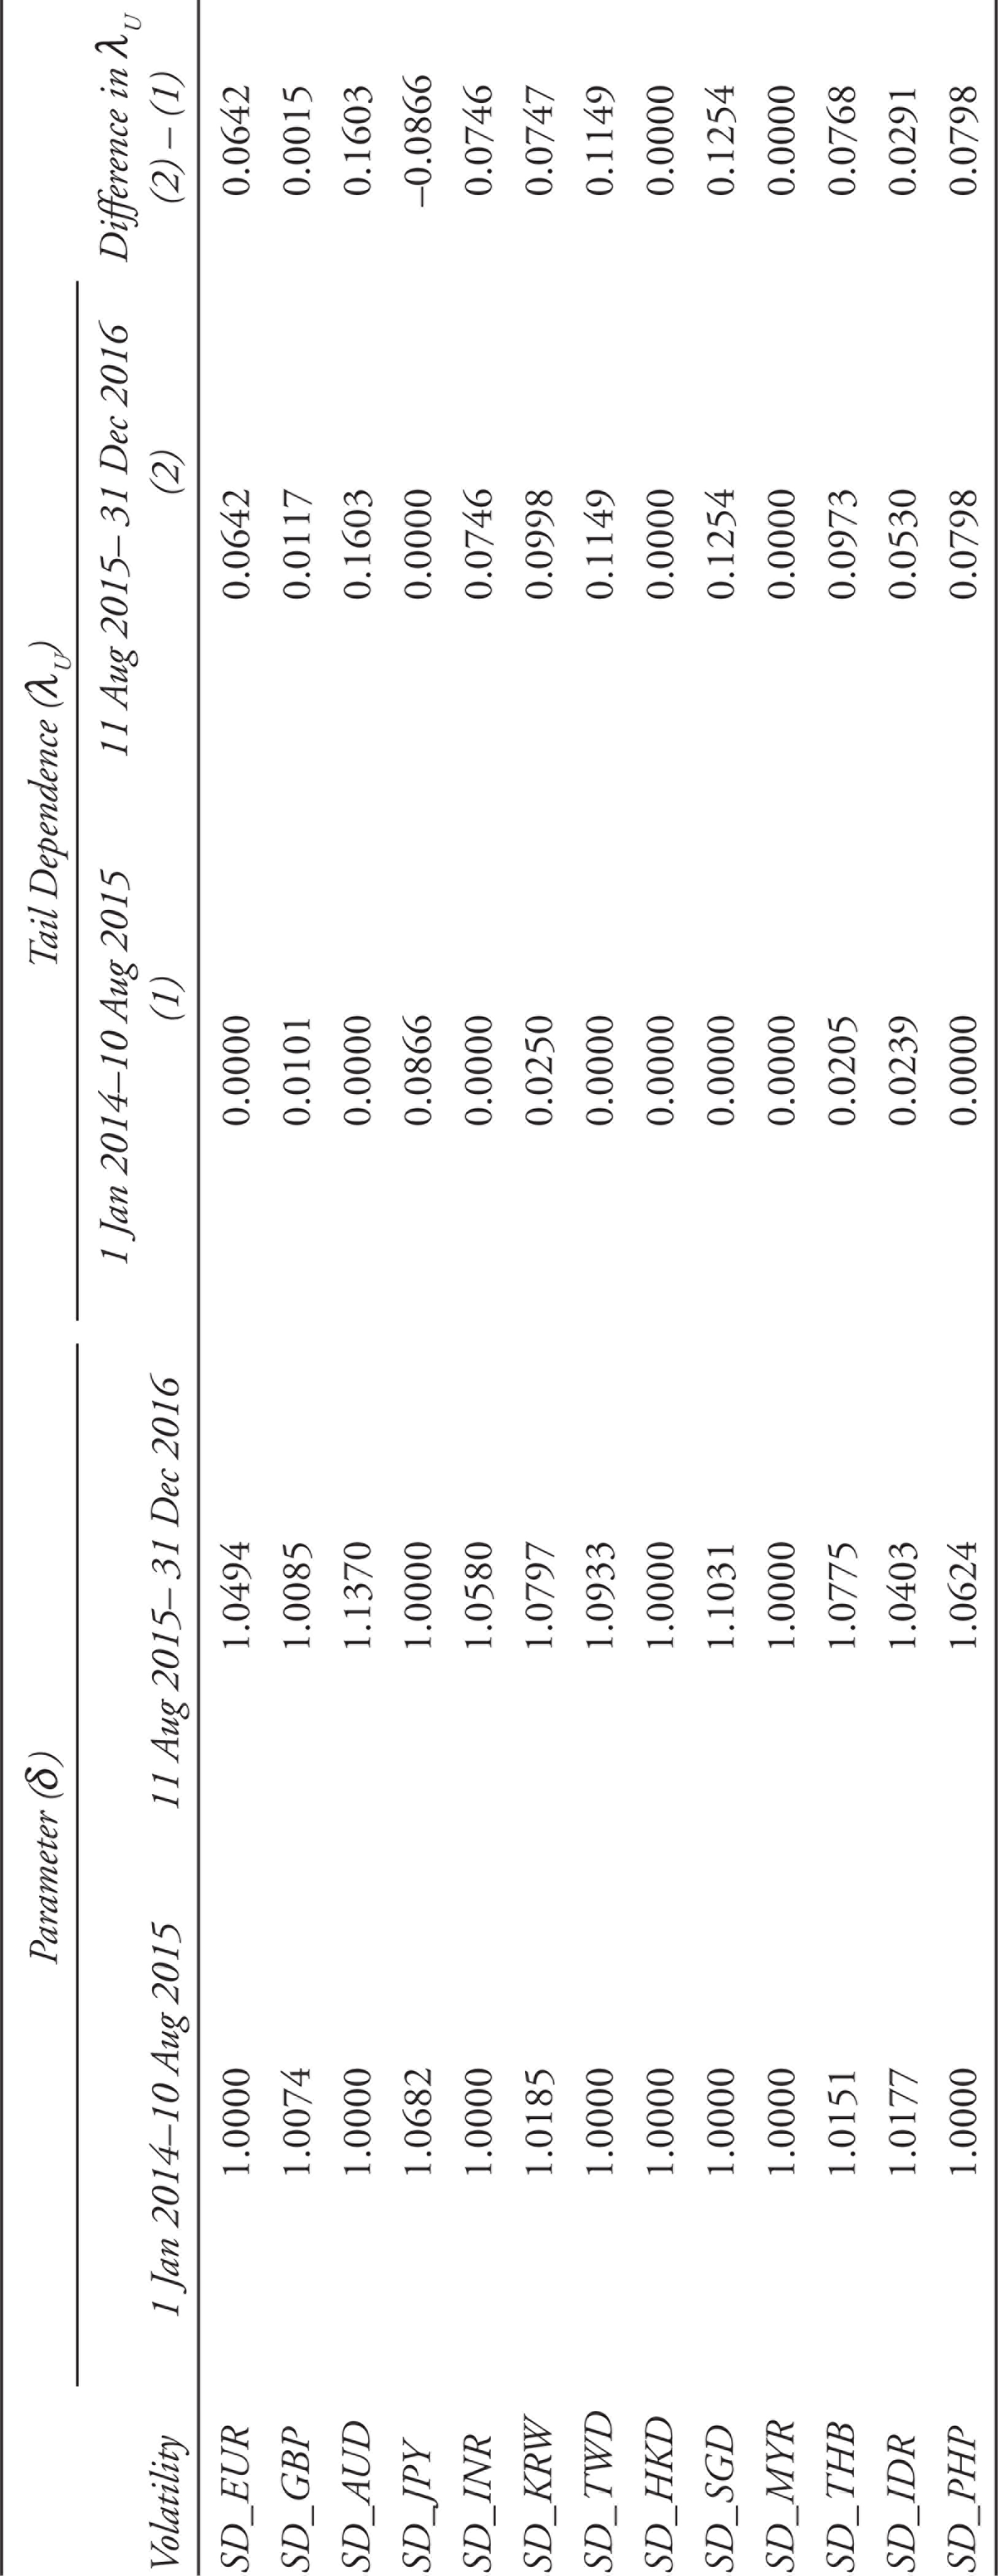
In the case of CNH, the increase in tail dependence after the CNY devaluation is even more noticeable (see Table 5 and Figure 3[b]). This occurs for all currencies except JPY. The increase is high for EUR and AUD among the major currencies, INR, TWD and KRW among the Asian currencies, and SGD, THB and PHP among the ASEAN currencies. These findings indicate that the dependence between volatility of exchange rate returns and RMB movements is not only confined to the major currencies as is found using the TARCH model. The currencies of the Asian and ASEAN-5 countries are similarly affected after the RMB devaluation. McCauley and Shu (2018) found evidence that the magnitude of co-movements between Asian currencies (including South Korean won, Taiwan dollar and Indian rupee) and ASEAN-5 currencies (including Malaysian ringgit, Indonesian rupiah and Philippine peso) with RMB has increased significantly after the devaluation. Similarly, increased dependence between the movements of RMB and the exchange rates of Asian and ASEAN-5 currencies after the RMB devaluation was also reported by Lai and Goh (2019). Given these linkages, RMB movements are also expected to affect the currency risks of Asian and ASEAN-5 countries, as revealed by the copula-TARCH. The TARCH model, on the other hand, has underestimated the tail dependence between the currency risks and RMB movements.
A comparison of the summary results in Figure 4 shows that the volatility in exchange rate returns for most of the currencies has higher upper tail dependence with the more volatile offshore CNH returns compared with onshore CNY returns after the unexpected RMB devaluation. This adds to the evidence that dependence structure has shifted away from dominance of CNY movements before the devaluation to the growing importance of CNH movements after the devaluation.
Estimated Gumbel Copula Parameters and Tail Dependence Coefficients for CNY Returns
Estimated Gumbel Copula Parameters and Tail Dependence Coefficients for CNH Returns
Concluding Remarks
This study examines the dependence structure between RMB movements and the volatility in exchange rate returns of selected major and regional currencies, and how the structure has changed after the unexpected policy move of the Chinese government to devalue CNY in August 2015. A comparison between CNY and CNH is made. Findings from the widely used TARCH models show that the impact of CNY devaluation on the sensitivity of volatility to movements in the currency is marginal, and it happens mainly for major currencies. The sensitivity of volatility to both CNY and CNH movements has increased and become approximately equal after the devaluation.
TARCH models may underestimate the tail dependence between the Chinese yuan and the volatility in other exchange rate returns, and fail to capture tail risks, as the effect of the sensitivity betas is assumed to be constant, regardless of the magnitude of exchange rate volatility and changes. The Gumbel copula approach is then applied to overcome these limitations. The results show that the tail dependence between both CNY and CNH with the volatility in most of the exchange rate returns considered has increased after the RMB devaluation, and this is also obvious in the case of Asian and ASEAN-5 currencies, apart from major currencies.
In contrast to the findings from TARCH model, the volatility of most of the exchange rate returns has higher tail dependence with CNH, compared with CNY after the devaluation. This offers evidence that the dependence structure has shifted away from the dominance of onshore CNY movements to the growing importance of more volatile offshore CNH movements after the devaluation. In other words, the volatility in most of the exchange rate returns has become more sensitive in reaction to changes in the CNH rate, where a large depreciation in CNH is expected to lead to a higher volatility compared with similar movements in CNY.
This finding provides useful implications for hedging strategy for institutional investors. The popular TARCH model may not yield accurate results and underestimate risks in the exchange rate market. Currency tail risks are better captured with the applications of copula models. The presence of tail dependence reported in this article suggests that exchange rate risks can be high due to a sharp decline in RMB, with the offshore CNH rate playing a bigger role after the devaluation. As a result, currency risks due to any unexpected movements in CNH will be higher. Higher FX volatility will lead to possible direct losses if the exposure to these currency risks is unhedged, as it could affect a firm’s profit margins and asset values (Papaioannou 2006). Glick and Hutchison (2013, 23) highlighted that the ‘countries with greater sensitivity to RMB are with stronger linkages to China’s bond market’. The need to hedge against the exposure to currency risk is therefore higher for countries that have stronger financial linkages to China. This also extends to linkages in terms of trade and investment (Campanella 2014).
As the Chinese authorities further promote the internationalisation of RMB, the differences between CNY and CNH will be reduced subsequently and higher currency risks are expected due to a more market-oriented Chinese yuan in the future. The latest 13th Five-Year Plan (2016–20) of China (Central Committee of the Communist Party of China 2016) underscores the country’s commitment to increase RMB convertibility by 2020 to facilitate the global usage of the currency in promoting its internationalisation. One of the moves is the introduction of a new approach to determine CNY daily reference rate, which is based on the market closing rate of the day before, while allowing for a more market-oriented and flexible exchange rate arrangement through the offshore CNH market. Steps were taken to further liberalise capital control to narrow the gap between CNY and CNH rates. These include the liberalisation in China’s capital account (e.g., the removal of Qualified Foreign Institutional Investors [QFII] and Renminbi Qualified Foreign Institutional Investors [RQFII] quota) and financial market (e.g., the inclusion in global equity and bond benchmarks). Funke et al. (2015) observed that policies that allow cross-border renminbi movements have led to a reduction in the volatility of the gap between CNY and CNH. Hence, exchange rate losses in overseas portfolio investment due to global uncertainties, such as those resulting from RMB internationalisation and liberalisation, can be avoided with more accurate estimates of dependence on extreme Chinese yuan moves.
Footnotes
Declaration of conflicting interests
The authors declare that they have no competing financial interests or personal relationships that could have appeared to influence the work reported in this article.
Funding
The authors received no financial support for the research, authorship and/or publication of this article.