
Abstract
Does increasing police strength deter more crime? Some studies have found apparent negative effects of police manpower levels on crime rates, and the most common explanation of such findings is that greater police strength increases perceptions of arrest risk, thus reducing crime via general deterrence mechanisms. The authors directly tested this hypothesis by estimating the association between survey respondents’ perceptions of arrest risk and the level of police strength prevailing in the counties where they live. No relationship between the number of police officers per capita and perceptions of the risk of arrest was found, suggesting that increases in police manpower will not increase general deterrent effects and decreases will not reduce these effects. The authors also considered the possibility that police manpower levels influence the number of criminals incarcerated, and thus affect crime rates via the incapacitative effects of incarceration, but concluded that such an effect is unlikely. These findings point to a need to reconsider previous interpretations of findings as supportive of a deterrent effect of increased police manpower on crime rates.
One of the most commonly proposed, and politically popular, strategies for controlling crime is to “put more cops on the street.” For example, in response to rising crime rates, President Clinton proposed, and Congress passed, the Violent Crime Control and Law Enforcement Act of 1994, which called for the hiring of 100,000 additional police officers nationwide. This policy decision, however, had little research-based support at that time. In 1996, Marvell and Moody summarized the scholarly consensus in the following way: “Many if not most students of police behavior believe that police have little or no impact on crime” (p. 610). This assessment reflected the findings of early studies showing no effect of police activities on crime rates (see, e.g., Chamlin & Langworthy, 1996; Greenberg, Kessler, & Loftin, 1983; Kelling, Pate, Dieckman, & Brown, 1974; Police Foundation, 1981).
Some of the most powerful and direct evidence on the effect of police strength on crime rates came from two field experiments. The Kansas City Preventive Patrol Experiment (Kelling et al., 1974) assessed the impact of changes in patrol frequency, which is arguably the most visible manifestation of police manpower levels, on a number of outcomes, including crime rates. The Kansas City Police Department altered motorized patrol levels across 15 precincts, which were randomly assigned to have anywhere from no routine patrols to four times the normal frequency. Results indicated that variation in police strength had no significant effect on crime rates, whether measured with police-based statistics or victim survey data. What was most striking about these findings is that they implied that there was no impact of even huge proportional increases in police patrols on crime rates—increases far larger than any police department could realistically hope to sustain on a citywide basis.
The Newark Foot Patrol Experiment (Police Foundation, 1981) assessed whether varying levels of police foot patrols affected crime rates and citizens’ perceptions of crime. Foot patrols were completely stopped in four areas, started in four areas where there previously had been none, and maintained in four other areas. Results from the Newark Foot Patrol Experiment mirrored those of the Kansas City Preventive Patrol Experiment: There were no differences in crime rates between the experimental and control areas. These early studies were influential in shaping researchers’ view of the effects of police activity on crime rates, though some scholars have remained skeptical of the findings generated by these studies (Junior & Muniz, 2006; Larson, 1975; Sherman & Weisburd, 1995).
In contrast, others have cited historical incidents such as the Boston police strike of 1919, and similar near-total eliminations of the police, such as the mass arrest of the entire Copenhagen police by the German occupation forces during World War II, as evidence of the impact of police force levels on crime (e.g., Andenaes 1966). These experiences, however, may have little relevance to routine variations in police strength, or even to the kinds of police strikes experienced in recent decades, because research on 11 police strikes in the 1970s indicated that they had “neither a significant nor a systematic impact on rates of reported crime” (Pfuhl, 1983, p. 489).
Part of the explanation may be that the use of substitutes such as police reserves, state police, supervisory personnel, and the like reduced the drop in actual police protection during the police strikes of recent decades. Nevertheless, even with the use of such substitutes, these strikes still entailed substantial reductions in active police manpower, with no measurable effect on crime. Thus, near-total eliminations of the police may well have large effects on crime, but reductions in police strength of the magnitude actually experienced in the United States in the past half-century may have little or no impact. The relationship between police numbers and crime may be negative but strongly nonlinear, such that the difference between no police and a few police has a substantial impact, but little or no further impact is produced by further increases in police beyond the minimal levels.
In contrast, a number of recent nonexperimental studies, using a variety of methodologies, have found significant negative associations between police strength and crime rates (Corman & Mocan, 2000; Fagan, Zimring, & Kim, 1998; Levitt, 1997, 2002; Marvell & Moody, 1996; Rosenfeld, Fornango, & Rengifo, 2007; Tella & Schargrodsky, 2004; but see Sever, 2001, who obtained unsupportive results despite the use of instrumental variables techniques to model a possible two-way relationship). Marvell and Moody (1996) asserted that prior research was misleading because it failed to take account of a simultaneous two-way relationship between police strength and crime rates. They argued that elevated crime rates lead to increases in the number of police, whereas increases in the number of police lead to decreases in crime rates. After accounting for this purported relationship, Marvell and Moody concluded that the effect of police strength on crime rates was substantial and that each additional officer at the city level translates to approximately 24 fewer crimes. Fagan et al. (1998) approached the same issue using a trend analysis of homicide rates in New York City. They concluded that the 25% increase in the number of police officers in New York City between 1991 and 1995 may have had a negative effect on gun homicides. Similarly, Corman and Mocan (2000) found support for a negative effect of police strength on crime rates.
It is questionable, however, whether actual crime rates affect police levels and, thus, whether there really is any two-way relationship between the two. McCarty, Ren, and Zhao (2012) recently analyzed this relationship using fixed-effects regression models estimated with data from 85 large U.S. cities and relating lagged crime rates to police strength over the period from 1991 to 2000. Their findings indicated that violent crime rates had no effect on police strength, whereas lagged property crime rates were actually negatively related to police strength (i.e., more property crime, fewer police). Thus, the authors concluded that “this finding supports the notion that decisions about police strength are based more on the perception of danger (i.e., percentage of Black population) than on objective measures of danger (i.e., crime rates)” (p. 17).
It is possible that publicity about crime and other forces affecting public perceptions of danger influence the demand for more police but actual levels of crime do not. Crime news may affect public support for more police, but the volume of news reporting on crime is largely unrelated to actual crime rates (Barlow, Barlow, & Chiricos, 1995; Davis, 1952; Jones, 1976; McClellan, 1997). Thus, even if news coverage of crime did influence policy decisions such as hiring more police, this would not imply that official or actual crime rates affect such decisions. And if crime rates do not affect police levels, models assuming a two-way relationship between police strength and crime are misspecified and may yield misleading results.
Deterrence and Police Strength
Analysts finding an inverse relationship between police strength and crime rates commonly invoke the concept of general deterrence to explain the negative effect of police strength on criminal behavior. For example, Corman and Mocan (2000, p. 601) stated that their results, which had indicated an inverse relationship between police strength and crime rates, were “strong support for the deterrence hypothesis.” The general deterrence hypothesis states that increases in the certainty, severity, and swiftness of punishment will decrease criminal activity. To explain the deterrent effect of police activity on crime, researchers typically point to the changes in punishment certainty (especially the certainty of arrest) that follow from changes in police activity. It follows from the deterrence hypothesis, therefore, that increases in police strength should cause potential offenders to refrain from criminal acts because of their perception of a higher likelihood of being arrested and punished. These effects of changes in police strength on changes in perception of the risk of arrest may or may not be mediated by actual changes in arrest risk.
The general deterrence hypothesis, especially as it pertains to the effect of police strength on crime rates, is based on the assumption that individual-level perceptions are affected by macro-level actions such as increasing police patrols, police making more arrests, or other changes in police activity facilitated by increased police numbers. If the level of police strength affects crime rates via deterrence mechanisms, as is usually hypothesized (Corman & Mocan, 2000; Marvell & Moody, 1996; Sherman, 1990; Sherman & Weisburd, 1995), then this effect must work through prospective offenders’ perceptions of punishment. Marvell and Moody (1996) made this rationale quite explicit: “Additional police presence deters crime . . . by making criminals believe arrests and subsequent sanctions are more likely” (p. 609). Similarly, Sherman (1990) hypothesized that police crackdowns reduce crime by increasing offender perceptions of the risk of being caught.
Despite the intuitive theoretical linkage between police activity, individual-level perceptions of punishment risks, and crime rates, no studies have assessed these associations empirically. Purely macro-level research cannot directly assess the deterrent effects of police activity because it cannot directly measure perceptions of risk among potential offenders. More broadly, only one study that we are aware of has considered the relationship between macro-level measures of punishment risks and individual-level perceptions of those punishment risks. Kleck, Sever, Li, and Gertz (2005) directly assessed the association between actual punishment risks (as reflected in official statistics)—certainty, severity, and swiftness—and individuals’ perceptions of those same factors. They found that variations in actual punishment levels have no effect on individuals’ perceptions of punishment risk and, by extension, do not affect crime rates via general deterrence mechanisms. The question of whether more visible indicators of punishment risks—such as the level of police strength—have an impact on perceptions was not, however, addressed by Kleck et al. and thus remains open to empirical scrutiny.
The Current Study
Research concerning the deterrent effect of police activity on crime is decidedly mixed. The contradiction between the results of direct experimental tests of very large manpower changes and the findings of some recent nonexperimental analyses raises questions about whether the latter reflect actual deterrent effects. Researchers have hypothesized that potential offenders can be deterred from criminal action by increasing the number of police in a given area (Marvell & Moody, 1996; Sherman, 1990), but no prior research has directly tested whether police strength levels actually affect prospective offenders’ perceptions of arrest risks. This theoretical relationship is critical to the general deterrence hypothesis.
The current study analyzes this relationship by examining whether county-level rates of police per capita affect individual-level perceptions of arrest likelihood. In line with the evidence from recent research, we hypothesized that police strength might directly affect individuals’ perceptions of punishment risk (e.g., through greater police visibility in the form of more patrols), such that more police per capita would produce higher perceived risks of arrest. We also hypothesized that greater police manpower could indirectly affect perceptions of punishment risk by increasing actual arrest rates, and that actual arrest rates would in turn affect the perceived risk of arrest. It should be stressed that we are not trying to assess the effects of various police strategies or policies (problem-oriented policing, hot spots patrolling, crackdowns, etc.) on crime, but only whether increasing the number of police officers—regardless of what a department might do with that increased manpower—generates more crime deterrence as evidenced by higher perceived risks of arrest. It also bears emphasizing that we are not performing a macro-level analysis of the sort frequently used to address this topic in the past but rather are performing an individual-level study in which we assess the relationship between (a) the perceptions of individual persons of arrest risk and (b) the characteristics of the counties in which they reside, including police strength and arrest rates. To our knowledge, this is the first time anyone has studied the effect of police levels on individuals’ perceptions of legal risk.
Sample
The current study employs data from a randomly selected sample of individuals residing in 54 large urban counties across the United States. These counties were the largest of the 300 counties sampled in the Bureau of Justice Statistics’ National Judicial Reporting Program. The National Judicial Reporting Program selected these counties to be representative of the United States, but larger urban counties were disproportionately covered (U.S. Department of Justice, Bureau of Justice Statistics, 1999). As a result, the 54 counties included in the current study are representative of the 75 largest counties (by population) in the United States, which in 1998 accounted for 50.2% of the nation’s murders, 61.9% of robberies, and 51.4% of all violent crimes known to the police (U.S. Department of Justice, Federal Bureau of Investigation [FBI], 2000). In sum, the current results can be generalized to the 75 largest counties that account for the majority of the nation’s crime.
Within the 54 counties, a total of 1,500 adult respondents were selected in 1998 using random digit dialing sampling procedures. Telephone numbers were randomly generated for each county using the area code and residential prefixes operative in that location. Approximately 95% of all U.S. households, including those with unlisted numbers, were therefore included in the sample frame. Sample sizes for each county were proportionate to the population size of that county. (It merits reemphasizing that since we are not doing a macro-level analysis, it does not matter if sample sizes are small for some of the counties; we do not use the survey data to estimate any county-level variables.) Study subjects were interviewed by telephone. At the beginning of each contact, an adult respondent within each household was randomly selected by asking to speak to the resident aged 18 years or older who had most recently celebrated a birthday. The interviews were conducted in April and May of 1998 by Research Network, a professional survey research firm that has conducted hundreds of telephone surveys, including many concerning crime.
Dependent Variables
Perceptions of arrest risk
Perceptions of arrest risk were measured by asking each respondent to estimate the likelihood that an arrest would be made given that a crime of a particular type was committed in their county. Separate questions were asked regarding the arrest likelihood for homicide, aggravated assault, robbery, and burglary. In each case, to put all respondents on an equal footing, the interviewers provided a nontechnical definition of the offense type being referenced. For example, when referring to homicides, the interviewer would say, A criminal homicide is the intentional killing of another person without legal justification. In the past ten years in your county, out of every 100 criminal homicides known to the police, about how many do you think resulted in the arrest of the killer?”
Respondents were thus asked to provide a number ranging from 0 to 100. Similarly worded questions were asked regarding the probability of arrest for aggravated assault, robbery, and burglary.
Key Independent Variables
Police strength
Data on the number of full-time sworn police officers were obtained from the Census of State and Local Law Enforcement Agencies (CSLLEA; U.S. Department of Justice, Bureau of Justice Statistics, 1998). The CSLLEA was conducted in 1996 by the Bureau of Justice Statistics by providing a self-administered questionnaire to each of the approximately 18,000 publicly funded state and local law enforcement agencies across the nation. The original data were available at the agency level (e.g., police department, sheriff’s office, or special police agency such as state or campus police). We aggregated these data up to the county level and created a new variable reflecting the number of full-time sworn police officers per 100 residents in each county. The 1996 Census estimates of county population were used to compute this rate. Prior researchers have used the CSLLEA data to examine the link between police strength and other contextual factors at the county level (Stults & Baumer, 2007).
Information for one of our 54 sampled counties, Kings County (Brooklyn), New York, was not available in the 1996 CSLLEA data. Data for this county were also missing for the 2000 CSLLEA data collection period, suggesting systematic exclusion of this county from the sample. We substituted the police/population ratio from New York County (Manhattan), which is contiguous to Kings County and is served by the same police department. Because of the spatial proximity of these areas, it is possible that the perceptions of Brooklyn residents are influenced by the levels of police strength in Manhattan. Substantive conclusions, however, were unaffected when we omitted Kings County residents from the analysis versus retaining these cases and using an estimate of police strength.
Jail ratio
Police manpower levels might affect perceptions of arrest risks by affecting the number of people in local jails. In places where more criminals are incarcerated in local jails, prospective offenders may infer that there is a higher risk of arrest. Therefore, a measure of the local jail population was included in all the models. Data for this variable were retrieved from the 1993 National Jail Census (NJC; U.S. Department of Justice, Bureau of Justice Statistics, 1996). The NJC is conducted every 5 to 6 years and includes information from all locally operated confinement facilities (n = 3,287 in 1993). Information on the average daily population for each facility was available. For the analysis, we used the average daily population variable aggregated up to the county level. We standardized this variable by dividing it by the population of each county in 1993 and then multiplying by 100. Thus, we employed a measure of the average daily population of jail inmates per 100 residents in each county.
Jail data were missing for four of our sampled counties (Fairfield and New Haven, Connecticut; Honolulu, Hawaii; and Kings, New York). NJC data are not collected in Connecticut and Hawaii because the local jails are administered by state-run prison systems. To be consistent with the police strength variable, we substituted the value for New York County, New York, for Kings County, New York. To avoid sample bias resulting from the systematic exclusion of respondents from the other three locations, we estimated the values of jail populations for the other three counties. A model was developed to predict the missing values in jail population rates using numerous county-level variables such as the county crime rate, the percentage voting Republican in the previous election, and government expenditures on correctional facilities as predictors. The police strength variable was not included in the prediction model to avoid artificially inflating the correlation between the two variables. The model showed high predictive power, with an adjusted R2of .89, indicating that we had good ability to predict the missing values in jail population rates (results are available from Gary Kleck on request).
Arrest ratio
Police manpower levels may indirectly affect the perception of arrest risks by affecting the actual arrest rates. Therefore, we tested the impact of actual arrest ratios (arrests per 100 offenses known to the police) for each specific crime type (murder, assault, robbery, and burglary) on perceptions of the certainty of arrest, using unpublished Uniform Crime Reporting arrest statistics (U.S. Department of Justice, FBI, 2000).
Control variables
We controlled for the overall index crime rate based on the hypothesis that people may interpret a high crime rate as evidence that risks of arrest and other punitive measures must be low. This information was derived from unpublished county-level Uniform Crime Reporting data (U.S. Department of Justice, FBI, 2000).
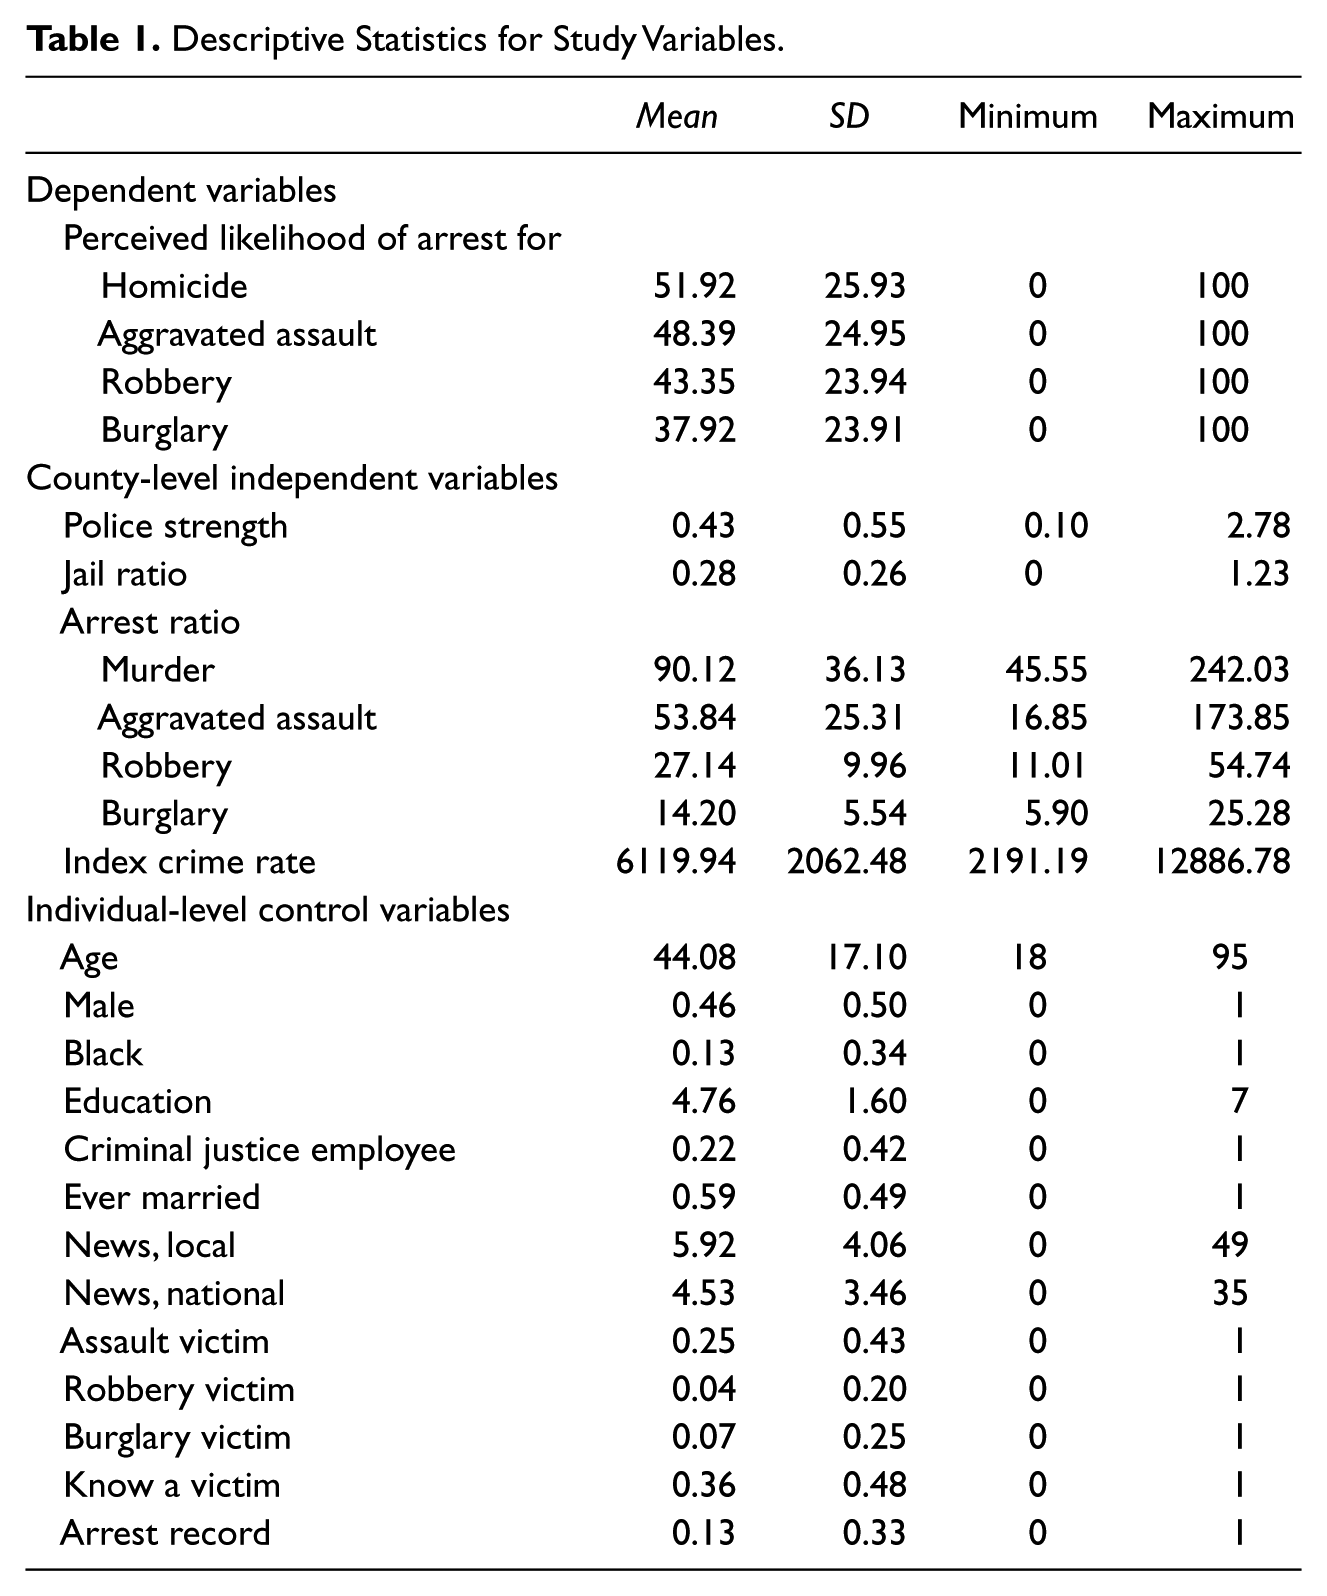
A variety of individual-level variables were also controlled, including the respondent’s age (in years), gender (1 = male, 0 = female), race (1 = black, 0 = other), education level (the highest grade completed), and whether the respondent had ever been married (1 = yes, 0 = no). Variables measuring the frequency with which the respondent watched televised local and national news broadcasts (number of times per week) were included, based on the hypothesis that greater exposure to crime news might suggest to some people, independent of actual crime rates, that control mechanisms, such as police ability to arrest criminals, are inadequate. Other control variables indicated whether the respondent or anyone within the respondent’s immediate family had ever been employed by the criminal justice system (1 = yes, 0 = no), whether the respondent or anyone the respondent knows had recently been victimized (1 = yes, 0 = no), and whether the respondent had ever been arrested for a nontraffic violation (1 = yes, 0 = no), to control for the possibility that prior personal or vicarious experiences of being arrested would influence the respondent’s perception of arrest risks. All the variables used in the analysis are listed in Table 1.
Descriptive Statistics for Study Variables.
Findings
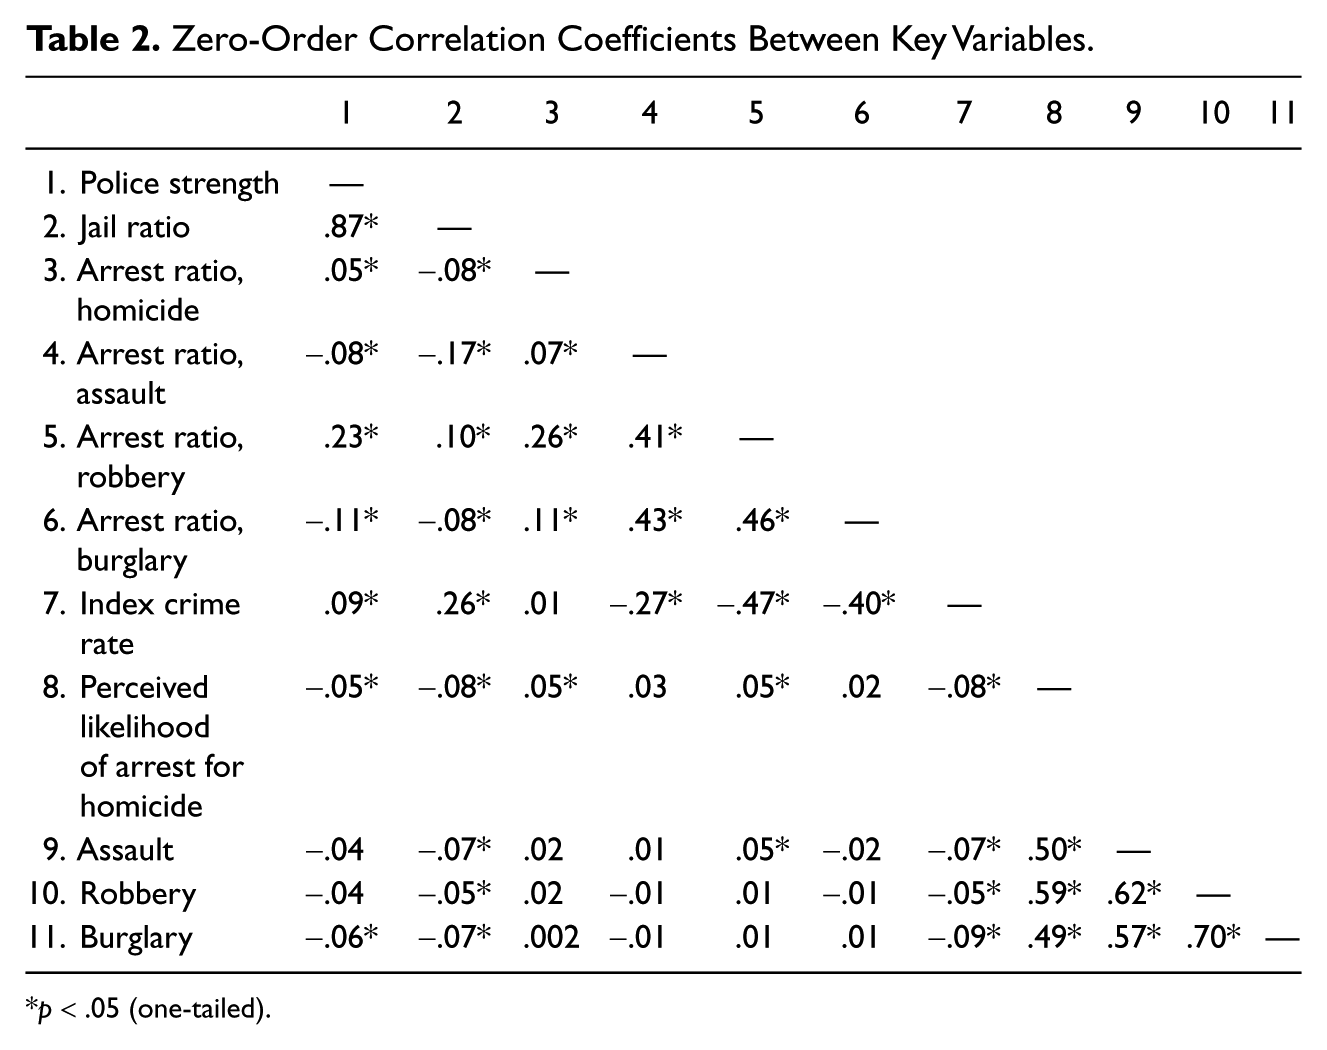
The bivariate correlations among the key study variables can be found in Table 2. The police strength variable, which is measured at the county level, was significantly related to respondents’ perceptions of arrest likelihood for homicide and burglary. These relationships, however, were in the opposite direction to our predictions. People who live in places with more police perceive slightly lower risks of being arrested. The negative correlations, however, are quite weak; none of the four correlations between the police strength variable and the perceptions of arrest likelihood variables were more than .10 in magnitude. A larger number of people incarcerated in local jails might also communicate the message that the police are catching more criminals, but the simple bivariate findings do not support this hypothesis either since the correlations were all negative, albeit weak, between the jail ratio variable and the perceptions of arrest likelihood variables. Most important of all, with the exception of the homicide variable, people who reside in places where the police are more successful in solving crimes by the arrest of perpetrators were no more likely to perceive high risks of arrest than people who live in counties where the police are less effective (see the correlations between arrest ratio variables and perceptions of arrest likelihood variables). The homicide arrest rate has only a very weak, albeit statistically significant, positive association with the corresponding perceived arrest risk. These findings suggest, preliminarily, that the negative associations found between either arrest rates or police strength measures and crime rates in macro-level studies should not be regarded as evidence of the general deterrent effect of arrest rates on crime rates since higher arrest and police manpower levels do not appear to produce higher perceived legal risks.
Zero-Order Correlation Coefficients Between Key Variables.
p < .05 (one-tailed).
As predicted, the index crime rate was found to be negatively correlated with perceived arrest risk. Previously, one conventional interpretation of this association would have been that a greater perceived risk of arrest produces lower crime rates via a general deterrent effect. Our findings indicate that this interpretation is untenable. Instead, an alternative explanation of this association may be that higher crime rates encourage people to believe that arrest risks are low, because they believe that this must be part of the reason why crime rates are high. High crime rates, to which people are sensitive, may serve as an indicator of insufficient police strength, to which people are not directly sensitive.
The very weak bivariate correlations between police strength and perceptions of arrest risk may, however, be misleading if the effects are being suppressed or distorted by other variables. Therefore, multivariate models predicting individual-level perceptions of arrest risk were estimated; the results are shown in Table 3. Recall that the sampled individuals were nested within 54 counties. To account for the clustering of observations within counties, multilevel modeling techniques were employed. Specifically, random intercept models regressing perceptions of arrest likelihood on the individual- and county-level variables were estimated (Raudenbush & Bryk, 2002). All individual-level variables, with the exception of those coded dichotomously, were grand-mean centered prior to estimation. The county-level variables were unmodified.
Random Intercept Models Predicting Perceptions of Arrest Likelihood.
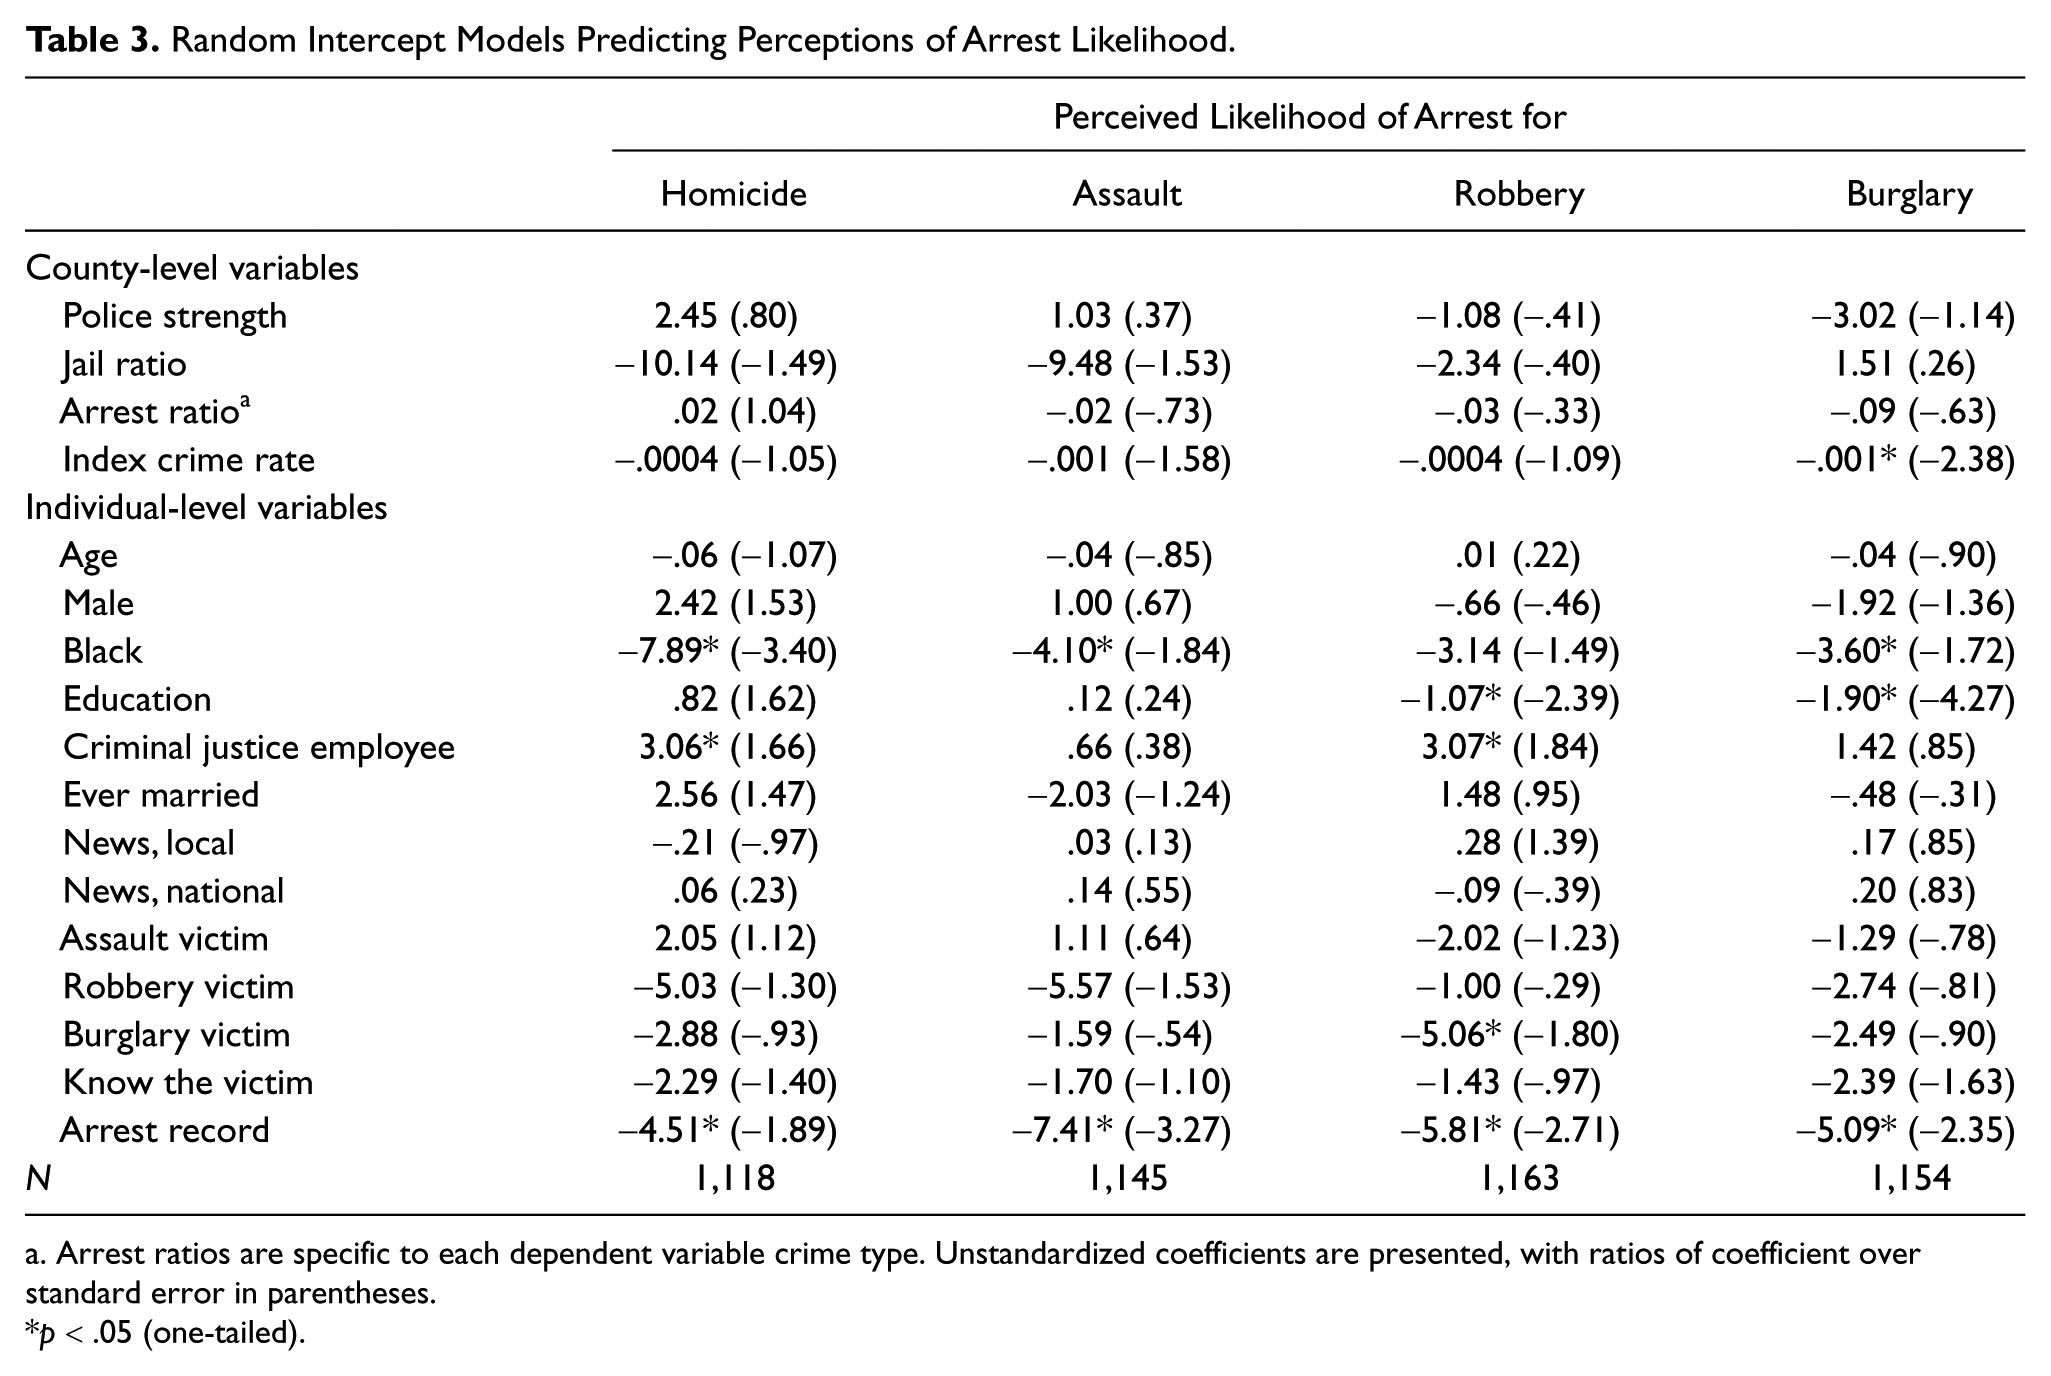
Arrest ratios are specific to each dependent variable crime type. Unstandardized coefficients are presented, with ratios of coefficient over standard error in parentheses.
p < .05 (one-tailed).
We estimated four multilevel models, one for the perception of arrest risk for each of the four crime types. Our main focus was on the effects of the police strength and arrest rate variables on these perceptions. As can be seen in the Table 3 findings, neither police strength nor actual arrest rates showed a significant positive relationship with perceived arrest risk for any of the four crime types. Living in a county with more police officers per capita did not lead to increased perceptions of arrest risk for any of the four crime types examined. Likewise, the actual arrest risk that prevailed in an area showed no significant positive relationship with perceived arrest risk. Thus, the hypothesis that police strength (or the arrest rates that police strength levels might produce) affects perceived arrest risk was not supported by any of the eight tests. Higher police strength levels apparently do not increase perceived risk of arrest and consequently cannot produce greater deterrent effects.
Substantive findings were unchanged when different combinations of the four county-level variables were used and when the four counties with estimated (i.e., imputed) values for the jail variable were omitted. It should be noted that the police strength variable was found to be significantly related to three of the four perceived arrest likelihood outcomes when it was the only county-level variable included in the model, but all three of these coefficients were negative. In other words, the coefficient was in the direction opposite to what would be expected from the general deterrence hypothesis.
Although our interest was centered on the effect of police strength on general deterrence, the study also yielded findings with some bearing on special deterrence—the effect of punishment on the person punished. Special deterrence occurs if the personal experience of punishment causes the punished person to become more fearful of future punishment and to therefore refrain from crime (Andenaes, 1966). If arrest is regarded as a punishment experience, our results fail to support a special deterrent effect. Respondents who self-reported having been arrested in the past reported significantly lower levels of perceived arrest risk for all the four types of offense. Negative associations of this sort are a surprisingly common finding in individual-level perceptual research on deterrence. The findings are typically explained as evidence of offenders’ belief in the “gamblers fallacy”—the notion that because they have been caught by the police, they have used up their bad luck and are bound to have lower arrest risks in the future. They then “reset” their perceived risks back down to a lower level (Pogarsky & Piquero, 2003). It should, however, be stressed that ours was a weak test of the special deterrence hypothesis. Since our study pertains to a single point in time, we cannot tell what risk perceptions were before these respondents were arrested, and we thus cannot know how their perceptions changed following arrest. It is possible that arrestees began, before their arrests, with very low perceived risks, which increased following arrest but still remained below those of nonarrestees.
Space limitations preclude detailed discussion of findings concerning other control variables, but one is especially intriguing. Black respondents perceived a significantly lower likelihood of arrest for homicide, assault, robbery, and burglary than White respondents. Could this reflect actually lower risks for African Americans, perhaps because of inadequate police levels in Black neighborhoods? Or might it reflect group differences in how legal risks are perceived? These issues could be important because if deterrence is less effective for African Americans than for Whites, it could help explain group differences in offending.
It might be suspected that more criminally involved persons give more thought to, or possess more information relevant to, arrest risks and might be more attentive to police presence than noncriminals. If this were true, analyses such as those presented in Table 3 might not detect an effect of police manpower levels on perceived arrest risk that is confined to offenders, since criminals are probably only a small subset of our sample. We tested this idea by separately analyzing those who reported having been arrested and comparing them with the rest of the sample. Similar to the previous analysis, multilevel modeling techniques were used. The results, as shown in Table 4, indicated that even among arrestees, perceptions of arrest risk had no significant association with police manpower levels. Thus, police strength appears to have no more effect on perceived risk of arrest among offenders, as approximated by self-reported arrestees, than among nonoffenders. 1
Regression Coefficients Estimating the Effect of Police Strength on Perceptions of Arrest Likelihood, as Moderated by Respondent Arrest Record.
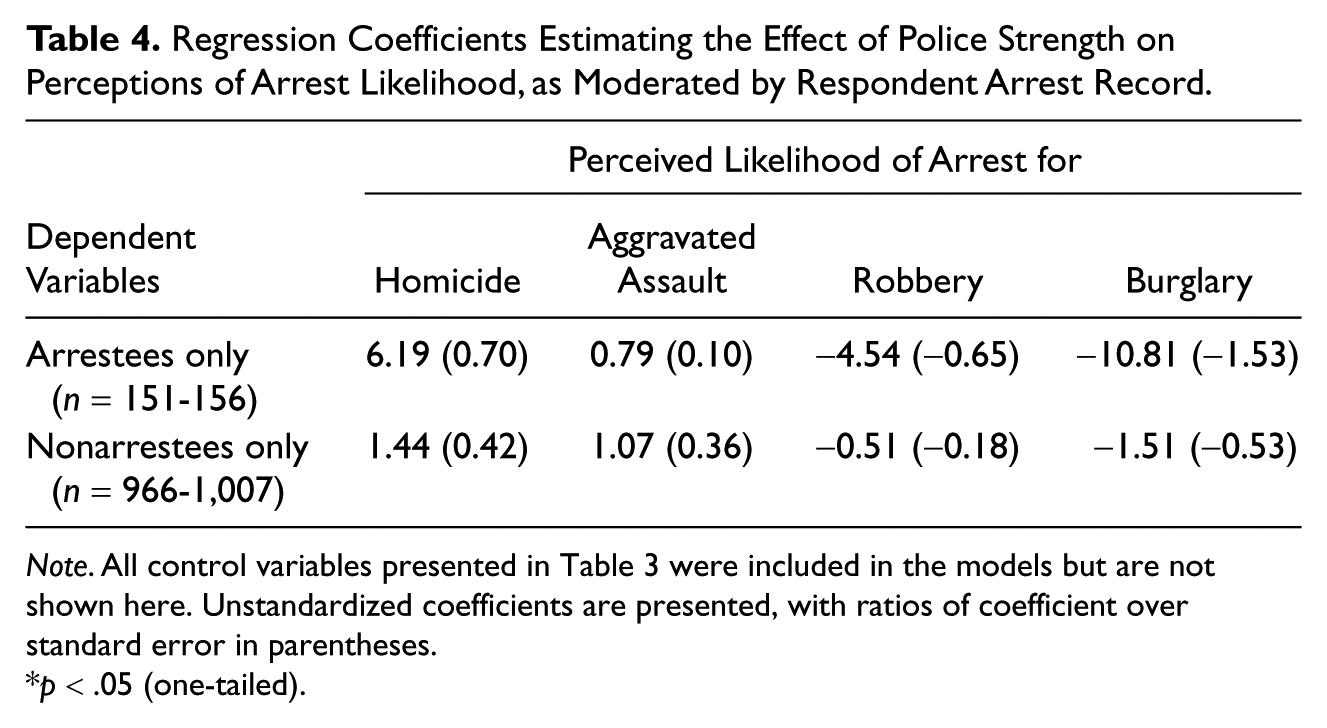
Note. All control variables presented in Table 3 were included in the models but are not shown here. Unstandardized coefficients are presented, with ratios of coefficient over standard error in parentheses.
p < .05 (one-tailed).
Police Strength and Incapacitative Effects
It is possible that the reason why some prior studies found an apparent impact of police strength on crime rates was that larger numbers of police officers make larger numbers of arrests, which result in more criminals being incarcerated. Criminals who are locked up cannot commit crimes against the general public, regardless of how they perceive the legal risks. Thus, police strength could affect crime rates via incapacitative effects. Depending on the degree to which arrestees would have been repeat offenders had they not been incarcerated, these incarcerations could have substantial incapacitative effects on crime rates that do not depend on altered perceptions of legal risk.
Can higher police manpower levels reduce crime by increasing the number of criminals incarcerated, thereby increasing the incapacitative effects of incarceration? Although many arrests do result in incarceration, and this in turn has incapacitative effects on crime, the answer to this question is nevertheless almost certainly no. Police already arrest far more criminals for offenses meriting a prison sentence, with sufficient evidence to result in conviction, than the prison system can possibly absorb. In the United States in 2004, police made an estimated 1,204,314 arrests for just six “imprisonable” offense types—murder and nonnegligent manslaughter, robbery, forcible rape, aggravated assault, burglary, and drug selling (U.S. Federal Bureau of Investigation, 2005, p. 280). The entire state and federal prison system, however, was able to admit only 457,096 persons that year (U.S. Department of Justice, Bureau of Justice Statistics, 2008). Thus, the police, at the manpower levels that have prevailed in the United States in recent decades, are already capable of arresting at least three times as many felony offenders guilty of imprisonable types of crime as the U.S. prison system can absorb each year. Thus, increasing the number of police could not increase the number of offenders locked up.
Furthermore, prisons are nearly always full, so increasing the number of police, and thus the number of criminals arrested, cannot significantly increase the number of criminals incarcerated. Under these conditions, which have prevailed for decades, when one more criminal is admitted to prison, one more must be released. Nearly all prisons in this country operate at or near capacity, so there is little “slack” or unfilled prison capacity that could absorb increased numbers of arrestees. The nation’s prisons, in the aggregate, operated with populations of more than 100% design capacity in every year from 1984, the earliest year for which data are available, through 2007 (U.S. Department of Justice, Bureau of Justice Statistics, 2008, and previous issues in this series). Although some persons arrested for prison-worthy crimes are not convicted, the currently prevailing numbers of arrests also result in far more convictions than the prison system can absorb, despite the huge increases in prison capacity in recent decades. For example, even back in 1990 an estimated 829,344 persons were convicted of felonies in state courts alone, although the state and federal prisons were able to admit only 323,069 offenders (U.S. Department of Justice, Bureau of Justice Statistics, 1994). If one took account of the convictions in federal courts, especially for drug offenses, the excess of convictions over prison admissions would be even greater. In sum, police capacity to arrest criminals, and the courts’ capacity to convict them, has always greatly exceeded the capacity of the prison system to incarcerate them, a state of affairs that continued even after prison capacity was increased to the record levels that prevail today.
Consequently, it is unlikely that increases or decreases in police strength—even a doubling or halving of manpower—could have any measurable effect on the number of criminals incarcerated. Because nearly all prison systems are full nearly all the time, the only factor that substantially affects the number of criminals “taken off the streets,” in the sense of being incarcerated, is prison capacity. Police ability to arrest criminals guilty of prison-worthy offenses is never a limiting factor on the number imprisoned, so it is implausible that variations in police manpower affect the collective incapacitative effect of the criminal justice system.
Discussion
If police manpower levels have no effect on perceptions of the risk of arrest, and thus do not influence the amount of general deterrent effects on crime, and also have no effect on the collective incapacitative effect of incarceration, why have some researchers found significant negative associations between police levels and crime rates? As previously noted, it is possible that their models wrongly specified a simultaneous two-way relationship between the two variables, based on an erroneous belief that actual crime rates, as distinct from media coverage of crime (which is uncorrelated with crime rates), affect police levels.
Alternatively, if there really is a two-way relationship, research estimating these relationships with instrumental variables techniques may have used invalid instruments, resulting in underidentified models and biased estimates. For example, Levitt (1997) attempted to identify the effect of police levels on crime rates using dummy variables for election years as instruments for police levels, based on the reasonable assumption that political actors “put more cops on the street” in election years as a vote-getting stratagem. Use of this instrument, however, also required Levitt to make the extremely dubious assumption that political actors do nothing else in election years that affects crime rates besides hiring more police. Only if this were true would it be appropriate to exclude the election year dummy from the crime rate equations. It is, however, likely that prosecutors and elected judges have the same political motives for taking crime-control actions in election years as mayors and city council members do and that they take actions of their own, such as increasing prosecutions or pronouncing harsher sentences, that might also affect crime in election years. Likewise, political actors might, in election years, reduce the “broken windows” effects of uncollected garbage, graffiti, and vandalism by mounting cleanup campaigns; temporarily reduce unemployment in high-crime areas by increasing municipal hiring; or take myriad other election year crime-reducing actions having nothing to do with police manpower levels. Because the election year dummies could not legitimately be excluded from Levitt’s crime rate equations, his models were probably underidentified and his estimates of the effect of police manpower variables were likely biased and inconsistent.
As an initial step toward examining the hypothesis that police levels do not affect crime rates once valid instruments are used, we estimated a two-stage least squares regression model of county-level police levels and crime rates. The instruments we used for police strength were government spending on police protection, the percentage voting Republican, and the sources of competing demands for local government resources (per capita school enrollment and per capita spending on highways). Overidentification of the instruments was determined by a nonsignificant J statistic. The resulting model of crime rates regressed on instrumented police strength indicated that the estimated effect of police strength on crime rates was positive and nonsignificant (results are available from Gary Kleck on request).
Perhaps most likely of all, the negative relationships between police levels and crime rates in past research may simply be garden-variety spurious associations, attributable to the common effects of public intolerance for crime on levels of punishment and on rates of criminal behavior. Rising public intolerance for criminal behavior can reduce criminal behavior through informal social control mechanisms such as interpersonal expressions of disapproval for criminal acts or ostracism of rule violators. At the same time, elevated levels of public intolerance for rule breaking can also express itself in increased support for formal punitive measures against crime, such as increasing the number of police officers so as to apprehend more criminals and subject them to legal punishments. None of the studies finding a negative police–crime association controlled for this likely source of spuriousness, and until a serious effort is made to do so, it will remain doubtful that the negative associations found in some macro-level studies between police levels and crime rates reflect the causal effects of police levels.
People may be much more aware of police strength in their own neighborhood than in the entire county in which they reside, in which case the link between perceptions of arrest risk and police levels measured at the county level understates the association that may prevail at the neighborhood level. This observation, however, may have little relevance for policy. The county-level number of police per capita is, in effect, a population-weighted average of police strength in the smaller areas that compose the county. Some local areas have higher-than-average police strength, but these are (by definition) balanced by other local areas with lower-than-average police strength. If local police strength really does influence perceived risk of arrest, higher police levels in some areas will produce higher perceived risk, but this also implies that lower police levels in other areas also produce lower perceived risks. The net effect therefore should still result—if the deterrence assumption were correct—in individuals residing in counties with more sworn officers per capita perceiving higher risks of arrest. Our results indicate that this is not the case.
Since there are no comparable data on individual perceptions of arrest risks for areas smaller than counties, we invite future researchers to test whether our findings are supported using perceptions of arrest risk for smaller areas such as neighborhoods. Nevertheless, for the sake of argument, suppose that people are reasonably sensitive to police strength in their own neighborhoods, perhaps because they notice and remember the frequency with which they see patrol cars. Suppose further that this affects their perceptions of arrest risk in the expected direction—an assumption for which, it should be emphasized, there is no supporting empirical evidence. These hypothetical conditions would have little significance for crime-control policy and for issues such as whether more of the public’s dollars should be spent on hiring more law enforcement officers. The more localized a perception of legal risk is, the more easily criminals can adapt by shifting their activities to other areas. Likewise, the more temporary a perception of risk is, the more easily a prospective offender can evade its effects simply by waiting. No doubt, offenders are temporarily deterred from committing a particular contemplated crime at a particular moment if they see a police patrol car passing by, but there is no social benefit if all that they need to do to proceed with the crime is wait a few seconds until the car is out of sight. The displacement of crime from more patrolled neighborhoods to less patrolled ones does not, by itself, produce any social good, since the harms of crime are merely relocated rather than reduced. Unless there were police strength increases at the level of entire political jurisdictions, such as cities or counties, increases in police presence in some neighborhoods would necessarily have to be balanced by reduced police presence in others. Thus, even if increases in perceived arrest risk were produced by patrol increases in some local areas, decreases in perceived risk in areas with reduced patrols would be likely to cancel out those benefits, in the absence of any jurisdiction-level increases in police strength.
For policy purposes, then, it is reasonable to expect a net increase in deterrent effects from increased police strength only if increased manpower at the level of legal jurisdictions produces net increases in perceived risk within the population of those legal jurisdictions. The policy question we are concerned with is whether the political entities that determine police strength levels through the hiring of police officers—municipal and county governments—will gain more crime-deterrent effects if they increase police strength. Although data limitations gave us little choice regarding the kinds of areas we could analyze, we believe that the use of county-level police strength measures is appropriate because the policy question at issue is addressed at the level of counties or cities, not at any lower level of aggregation, such as neighborhoods.
Finally, our study was limited by its cross-sectional nature and could not directly detect changes in perceptions of arrest risk following changes in police strength. In future research, panel studies with direct survey measures of risk perceptions could be used to track changes over time in police strength and perceptions of the likelihood of arrest for crime.
Conclusion
Increasing police manpower levels may have various benefits other than crime control, such as traffic control or the delivery of various public services, or it may affect crime rates in ways that do not involve either increased general deterrent effects or increased incapacitation effects. At this point, however, the evidence indicates that police manpower levels do not affect crime rates by affecting perceptions of the risk of arrest and punishment. This does not mean that prospective offenders are unaware of the risk of arrest but rather that variations in police strength do not affect perceptions of that risk. Although prospective offenders’ decisions whether to commit crime may well be influenced by their perceptions of the risk of arrest, these perceptions are not affected by the number of police officers operating in their area, nor are they affected by the actual arrest rates that these officers produce. Furthermore, it is very unlikely that increases in police manpower levels reduce crime rates by increasing the number of criminals incarcerated, since police already arrest, even in areas with low police strength, far more criminals convictable of serious crimes than the prison system can possibly absorb. Finally, alterations in what police do and how they do it, rather than how many officers there are to do it, may affect perceptions of arrest risk. We are not, however, aware of any research that directly demonstrates the effects of changes in police practices on perceptions of arrest or punishment risk, as distinct from indirectly inferring them from crime drops following changes in police tactics. Future tests of the impact of changes in police practices would be beneficial if direct before-and-after measures of perceived arrest risk were built into the evaluation.
In light of these findings, policy makers may want to reconsider whether increases in police manpower bring sufficient crime reduction benefits to justify their costs. Conversely, in times of fiscal crisis, it is worth considering the possibility that cuts in police strength may be implemented without causing crime increases. Even in times of fiscal plenty, it may be worth thinking about alternative investments that are more likely to reduce crime.
Footnotes
Declaration of Conflicting Interests
The author(s) declared no conflicts of interest with respect to the authorship and/or publication of this article.
Funding
The author(s) disclosed receipt of the following financial support for the research, authorship, and/or publication of this article: The original survey data for this research were gathered with support from a grant from the Charles E. Culpeper Foundation, Stamford, CT (later merged with the Rockefeller Brothers Fund).