
Abstract
The current study addresses the spatial clustering of all crimes, property crimes, and violent crimes on days the Atlanta Falcons play home games versus days with no sporting events, and examines whether opening a new stadium affects the spatial clustering of crime. The study finds that spatial clusters of crime are stable for days with no sporting events across time frames. When the Falcons play home games, there is a significant spatial clustering of all crimes and property crimes near the stadium. Violent crime clusters show the most instability across game days and time frames. The study provides evidence that stadiums have a spatial and temporal effect that alters the spatial clustering of crime on game days.
Introduction
There is a growing body of research examining stadiums’ effects on jobs, revenue generation, and crime. Stadiums are the physical manifestation of sports’ effect on a city and offer contexts for how facilities affect crime when spatial and temporal conditions overlap. Economists focus on the monetary outcomes like jobs, tax revenue, and income, after the stadium is built, and the subsidization of costs by the government through direct funding and tax benefits. The literature points to either a negative or insignificant relationship between a stadium and employment or wages (Coates & Humphreys, 2003; Islam, 2019; Jasina & Rotthoff, 2008; Propheter, 2019), although some studies document an improvement in local property values and median home prices (Humphreys & Zhou, 2015; van Holm, 2019). On the latter note, Gayer et al. (2016) found that the federal government contributed $3.2 billion in implicit subsidies and $3.7 billion in forgone tax revenue through tax-exempt vouchers on facilities constructed between 2000 and 2016.
This paper addresses how Atlanta Falcons home games affect the spatial clustering of all crime, property crimes, and violent crime by comparing game days and days with no sporting events. Additionally, how does the opening of a new stadium affect the spatial clustering of crime? The terms spatial clusters and hot or cold spots are used interchangeably and refer to statistically significant clusters of high or low values. The study utilizes data from the Atlanta PD open data portal crime reports and covers 2012 to 2022. To approach this problem, the study integrates theories of the political economy of place and environmental criminology. Hot spot analysis and hot spot comparisons are computed to evaluate the spatial clustering of all crimes, property crimes, and violent crimes on game days and days with no sporting events in Atlanta.
Study Location
This paper exploits Atlanta, Georgia, as a study location. In 2017, Mercedes-Benz Stadium opened a $1.6 billion stadium financed through public and private investment. The stadium, land, and property are state-owned, while the NFL Atlanta Falcons team operates the stadium. Mercedes-Benz Stadium was constructed across the street from the Georgia Dome, home to the Falcons from 1992 until its demolition in 2017. Therefore, the stadium allows a natural-experimental design to compare the spatial clustering around the old and new stadiums. Thus, the location provides a novel comparison to understand how or if the crime patterns are affected by the change in the stadium and changes from days with no sporting events to game days.
The stadium sits at the intersection of Downtown Atlanta, Vine City, and Castleberry Hill, and the Georgia World Congress Center to the north functions as an edge between the three neighborhoods. The Atlanta Hawks play in the State Farm Arena to the east, closer to downtown. While the stadium is physically near these areas, the edges and land use physically isolate the stadium. Thus, foot traffic is most likely when the Atlanta Falcons are playing home games, because of the convergence of situational factors, especially when considering RAT. The location of the Mercedes-Benz Stadium is abnormal for NFL stadiums, which are routinely located in suburbs, primarily due to space constraints.
In addition to the location of the stadium, the various methods of transportation to the stadium must also be considered. Fans can arrive at the stadium via car, the MARTA (train), or on foot from downtown or Castleberry Hill. Mercedes-Benz Stadium’s capacity is roughly 71,000, and parking must accommodate this number of fans. For fans, the presence of a game day can fundamentally alter their daily routines, but while fans are the primary suitable target, fans vehicles are also suitable targets. The NFL games are over 3 hr in length on average (Kennedy, 2025), which means fans’ vehicles are possible suitable targets during this time. Based on these factors, Atlanta is a prime location to analyze crime clustering on game days.
Theory
The Political Economy of Place
The political economy of place views communities as actively constructed through the interaction of capital, state, local governments, and the public (Logan & Molotch, 2007). This framework emphasizes that cities are not passive outcomes of economic or demographic change but are manifestations of practical activities. The urban growth machine conceptualizes the city as a site where coalitions of entrepreneurs, real estate developers, and political elites promote growth as a universal public good (Logan & Molotch, 2007). These pro-growth coalitions advocate for deregulated, market-driven urban expansion, arguing that development leads to job creation, tax revenue, and improved public services.
Logan and Molotch (2007) argue that growth is institutionalized through public-private partnerships and state policies that manufacture consent, suppress dissent, and frame development as beneficial. One key indication of the growth machine and the public-private partnership is the construction of sports stadiums, which are positioned as tools of urban revitalization and symbols of civic identity. As Delaney and Eckstein (2007) explain, stadium projects often emerge from coalitions of city officials, corporate leaders, and developers who aim to attract businesses, reverse population decline, and stimulate a stagnant tax base. While such developments may be public goods, they also result in spatial reconfigurations of the city, possibly changing citizens’ movement and daily routines.
Environmental Criminology
This paper bridges the political economy of place with two complementary theories from environmental criminology: Crime Pattern Theory (CPT) and Routine Activity Theory (RAT). CPT explains how urban form and movement patterns shape the spatial distribution of crime. People move through cities along nodes, paths, and edges, forming activity spaces where criminal opportunities may arise (Brantingham & Brantingham, 1993). Crime is most likely to occur where possible offenders’ spatial awareness and suitable targets intersect near their homes, entertainment districts, transit hubs, or workplaces (Brantingham & Brantingham, 1981, 1995; Johnson & Summers, 2015; Menting et al., 2020).
Crucially, CPT differentiates between crime generators that bring large volumes of people together and crime attractors, which draw motivated offenders to areas with known opportunities (Brantingham & Brantingham, 1995). Contemporary focuses on risky or micro facilities, including fast food, bars, liquor stores, and hotels, and their impact on crime at the local and city level (Bernasco & Block, 2011; Bowers, 2014; Jennings et al., 2014; Kurland & Johnson, 2021; Tillyer et al., 2021). These spatial concepts are useful for understanding how development reshapes crime opportunity structures, especially in the context of stadiums.
RAT complements CPT by emphasizing that crime occurs when three elements converge in space and time: a motivated offender, a suitable target, and the absence of a capable guardian (Cohen & Felson, 1979). Urban development influences this convergence by altering land use, foot traffic, and concentrating on attractive targets. The effect of a stadium is not consistent, and RAT helps articulate the temporal effect when the temporal confluence of motivated offenders, suitable targets, and a lack of capable guardianship occurs.
Toward an Integrated Framework
Bringing together the political economy of place with CPT and RAT shows that crime near urban projects like stadiums reflects social processes, temporal catalysts, spatial reconfiguration, and the convergence of space and time. Restructuring the city’s physical and social space can create new nodes, pathways, and edges, thus altering daily routines. In this context, the stadium is not inherently criminogenic but becomes a temporally and spatially contingent crime generator or attractor. The stadium attracts suitable targets and the potential for crime. Although the effect is not temporally consistent, it is contingent on situational factors such as a sporting event.
This framework situates the spatial clustering of crime around venues like Mercedes-Benz Stadium within a broader context. It acknowledges how urban political and economic forces restructure spaces by shaping how people live, move, and interact within the built environment. Therefore, expanding environmental criminology by positioning crime pattern theory, routine activity patterns, and spatial crime risks within the active process of constructing the urban context of the city. The integrated framework accounts for the construction of space and the physical and situational convergence of factors that contribute to crime.
Background Literature
Sports and Crime
The overall link between sports and crime is inconsistent, but it is burgeoning into a multifaceted research field. Many studies have analyzed the impact of sports at the city level with varying results and contexts. The extant literature has found a connection between the presence of a sporting event and an increase in property or violent crime (Block, 2021; Card & Dahl, 2011; Kalist & Lee, 2016; Pyun, 2019; Pyun & Hall, 2019; Rees & Schnepel, 2009), while other studies have found no association or a decrease in crime (Andresen & Tong, 2012; Baumann et al., 2012; Copus & Laqueur, 2019; Piquero et al., 2021). The variation within results often varies based on crime type, sport, temporal factors, or a combination of these features. Even within studies, there is variation by crime type. Pyun (2019) utilized the move of the Major League Baseball (MLB) Montreal Expos to Washington, D.C., becoming the Washington Nationals, to analyze the change in crime. The study found that in Washington, D.C., assaults increased yearly by 7% to 7.5% and 14% to 15% during the MLB season, while larceny and motor vehicle theft did not significantly change. Inconsistencies are also found across locations, analyzing the same sports. Yu et al. (2016) found increased hourly robberies during NBA and NCAA college football games, whereas Kurland (2019) found that in Newark, New Jersey, NBA games (featuring the New Jersey Nets) did not increase hourly robberies. The extant literature illustrates how the relationship between crime and sports is complex and highly contextual, based upon spatial relationships that city-level analyses cannot account for.
Spatial Impact of the Stadium
Researchers have employed spatial analyses to examine local or neighborhood effects on crime. Studies have primarily found an increase in crime in the immediate vicinity of the stadium (Billings & Depken, 2011; Breetzke & Cohn, 2013; Campedelli et al., 2024; Kurland & Johnson, 2021; Kurland & Piza, 2018). The difference and similarity between the micro-level impact and the city-level impact have been tested with variation; some, like Billings and Depken (2011), find an increase surrounding the stadium but not the city, or varying by crime type (Breetzke & Cohn, 2013; Mares & Blackburn, 2019; Montolio & Planells-Struse, 2019). Even the same location can yield differing results based on the type of analysis, crime type, and type of event. A series of articles on the Prudential Center in Newark, New Jersey, primarily find an increase in crime near the stadium with variation by event and crime type (Campedelli et al., 2024; Kurland, 2019; Kurland & Piza, 2018). Recent articles on Cleveland and Chicago support the idea that crime increases around stadiums, but varies by stadium location, arena, and crime type (Menaker et al., 2019, 2023). Important for context for this study, Geibler et al. (2025) found that the construction of the Mercedes-Benz stadium did not affect general crime trends in Atlanta, and Bagwell et al. (2024) found no hot spots of crime near the Frost Bank Arena in San Antonio when the San Antonio Spurs (NBA) play home games. Therefore, this paper addresses these gaps by examining NFL gameday and non-gameday hot spots around a downtown stadium (Mercedes-Benz Stadium).
Built Environment and Crime
Stadiums do not exist in a vacuum but are located within the structure of the city in which they reside. The link between the structure of cities and crime concentration has primarily focused on the presence and density of certain facilities, land use, or the physical connectivity of the environment, with a focus on aspects like street layout and walkability. Risky facility research can range from focusing on risky facilities, like bars, which have been linked to increases in crime (Bernasco & Block, 2011; Groff & Lockwood, 2014), to the density of facilities. Although recent studies have found more nuanced effects of specific bars, connected to parking lots (Connealy & Corts, 2024), similar to the findings from the Prudential Center (Campedelli et al., 2024). Others have broadened accounting for other facilities and have found that new retail developments attract an increase in property crime (Bowes, 2007). Studies of land use and crime have shown that mixed-use zones are associated with lower overall crime (Anderson et al., 2013). Street network research on crime found that areas better connected (higher betweenness) are associated with higher crime (Johnson & Bowers, 2010; Kim & Hipp, 2020; Summers & Johnson, 2017). Moreover, Kim and Hipp’s (2021) recent analysis included measures of all three indicators and found that a consistent positive effect for facility density, an inconsistent relationship between land use and crime, and a negative relationship between connectivity and crime. Taken together, the literature on crime and place shows the importance of the built environment on crime and, when combined with previous research on stadiums and crime, articulates the stadium as a possible “super-facility” (Kurland & Johnson, 2021). The current study will extend prior research on the connection between the stadium, sporting events, and crime by analyzing the spatial clustering of crime in Atlanta. The study integrates the theory of the political economy of place and environmental criminology to address the social structuring of the city.
Data and Methods
Crime data for this study are drawn from the Atlanta Police Department’s open data portal, which provides geocoded crime data from 2010 to the present. The current research is focused on crime in Atlanta, comparing the spatial concentration of crime 5 years prior (2012–2016) to the opening of the stadium in 2017 to 5 years after (2017–2022) the stadium’s opening. The 5-year periods are selected to have a consistent time comparison and statistical data to run the game day analyses. All crime from 2020 is excluded from the analysis due to COVID-19 and Atlanta’s transition to NIBRS, where crime reports could not be cross-referenced between crime description and crime code because the NIBRS code was NULL for 2020. Therefore, the 2020-2021 NFL season will be excluded from the analysis due to fan restrictions in the stadium as a result of the COVID-19 pandemic and data considerations. Atlanta PD began utilizing NIBRS classifications in 2021, while historically they tracked murder, robbery, aggravated assault, larceny, auto theft, and burglary; therefore, the analysis includes only those crimes for consistency across crime classification and time.
The data is separated into all crimes, property crime (larceny, auto theft, and burglary), and violent crime (murder, robbery, and aggravated assault). All included crime types were verified to have matching crime types and crime codes, either Georgia Crime Information Center Codes (GCIC) before 2021 or NIBRS codes thereafter.
The game data for the Atlanta Falcons was compiled using data accessed via ESPN.com; the information includes the date and time of each game, home or away (ESPN, n.d. A) The Atlanta Hawks (ESPN, n.d. B) and Atlanta United Football Club (ESPN, n.d. C) also play in downtown Atlanta; dates for all Atlanta Hawks and Atlanta United FC home and away games were recorded from ESPN. The Mercedes-Benz Stadium hosts the Southeastern Conference (SEC) championship game (ESPN, n.d. D) and the Peach Bowl (ESPN, n.d. E). Annually, both of which are part of the NCAA college football season. The dates for each are recorded yearly from 2012 to 2022. Dates that do not have a sporting event will be separated and analyzed for the same periods. In all the 2012 to 2016 time period includes 1,315 non-sports days and 41 Atlanta Falcons home games, and the 2017 to 2022 time period includes 1,029 non-sports days and 39 Atlanta Falcons home games. See the Supplemental Appendix for maps with just Sunday non-sport days hot spots.
The study utilizes hot spot analysis in ArcGIS Pro to analyze the spatial patterning of crime. A three-mile buffer around the stadium is used to isolate the area in proximity to the stadium for a smaller-scale analysis and align with previous research (Campedelli et al., 2024) and results of previous research using distance bands around the stadiums (Billings & Depken, 2011). The three-mile buffer includes the Special Interest Zones, which designate development constraints and requirements across the zones, focusing on pedestrian movement, street-level design, and Vine City transit-oriented rules (City of Atlanta, 2025). Mercedes-Benz Stadium is located in the Special Interest Zone of downtown. Hot Spot Analysis (HSA) identifies statistically significant clusters of high or low values, or hot and cold spots, respectively. The Getis-Ord Gi statistic is the methodological foundation of the HSA and is widely used for spatial clustering analyses to identify spatial concentrations of incidents (Bagwell et al., 2023; Ceccato et al., 2002; Frazier et al., 2013; He et al., 2022; Malleson & Andresen, 2015). To find a relevant scale for the analysis, an optimized hot spot analysis was run to identify appropriate scales of analysis. Based on those results, a hexagon cell size with a perimeter of 916 meters is used for all analyses. The hexagon cells, especially at this scale, provide more granular detail. The analysis utilizes the fifteen nearest neighbors to focus on a proximity effect. The HSA outputs identify statistically significant hot and cold spots and include corrections for spatial dependency and multiple testing (Esri, n.d.). Hot spots or cold spots are defined as a significant clustering of high or low values of the fifteen nearby neighbors in relation to the general result.
The second analysis compares the hot and cold spots across maps with the hot spot comparison tool, which provides measures to compare the maps. The fuzzy spatial kappa provides a statistical association between the maps for the clustering of hot/cold spots, considering both the significance level and spatial clustering. A spatial fuzzy kappa value of
Results
All Crime
Figure 1 shows the HSA results for all crimes. Map 1A shows the results for days with no sporting events from 2012 to 2016 and indicates that spatial clustering at the 99% confidence level is primarily located in Downtown Atlanta, Midtown, near Vine City, and Atlanta University Center. Map 1B shows the results for no sporting events from 2017 to 2022. The results are consistent with Map 1A, with specific differences between the two time periods. First, the spatial clustering of crime increases in Sweet Auburn, both expanding the hot spot and connecting it to downtown. Second, on the periphery, Marietta Street Artery, the Atlantic Station, and to the west of Pouncy-Highland see either an increase in clustering or the emergence of new clusters. Maps 1C and 1D show the results of days with Atlanta Falcons home games from 2012 to 2016 and 2017 to 2022, respectively. In contrast to the maps with no sporting events, crime is significantly clustered to the south and west of the stadium, while the downtown area to the east is still significant. One important difference between maps 1C and 1D is the significance of the hot spot near Vine City, and the Atlanta University increases from 2017 to 2022.
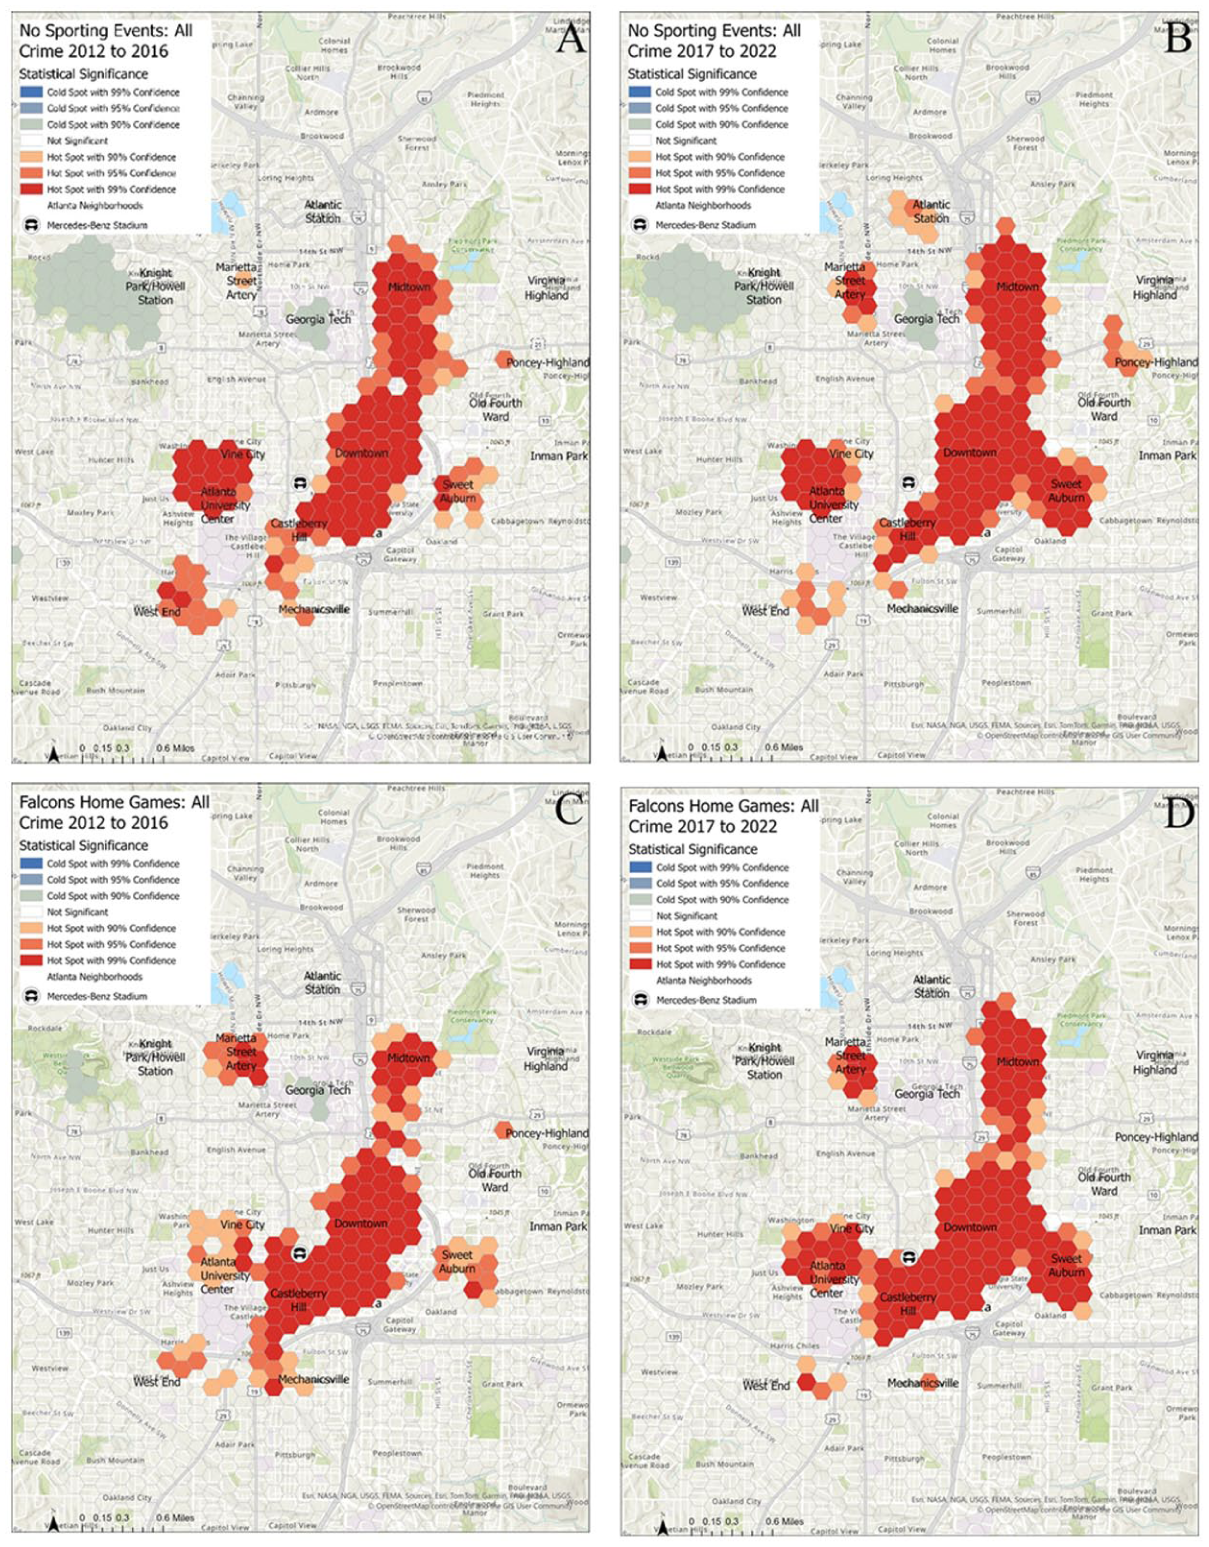
Hot spot analysis all crime: (A) no sporting events 2012 to 2016: incident count: 63,586, (B) no sporting events 2017 to 2022: incident count: 41,379, (C) falcons home games 2012 to 2016: incident count: 1,763, and (D) falcons home games 2017 to 2022: incident count: 1,405.
Property Crime
Figure 2 shows the HSA results for property crimes. Map 2A shows the results for days with no sporting events from 2012 to 2016. Significant spatial clustering of property crime at the 99% confidence level is located in downtown, Midtown, and Vine City/Atlanta University Center. Map 2B shows the results for days with no sporting events from 2017 to 2022. The results show that significant spatial clustering is consistent with increased spatial clustering outside of the main hot spots in Marietta Street Artery, Atlantic Station, Sweet Auburn, and Pouncey-Highland. Map 2C shows the results for Falcons home games from 2012 to 2016 and shows that significant spatial clustering is present around the stadium, to the point that the original hot spot in Vine City and Atlanta University Center completely disappears and shifts toward the stadium. In contrast, map 2D shows the results for Falcon home games from 2017 to 2022. Significant clustering is present around the stadium, but the Vine City/Atlanta University Center hot spot is present but slightly shifted at the 95% confidence level compared to the 99% confidence level of the no sporting event maps for property crime. In map 2C, the area of Sweet Auburn and connecting to downtown is primarily nonsignificant, with select significant grids, whereas in map 2D, the hot spot is much larger and connects with downtown.
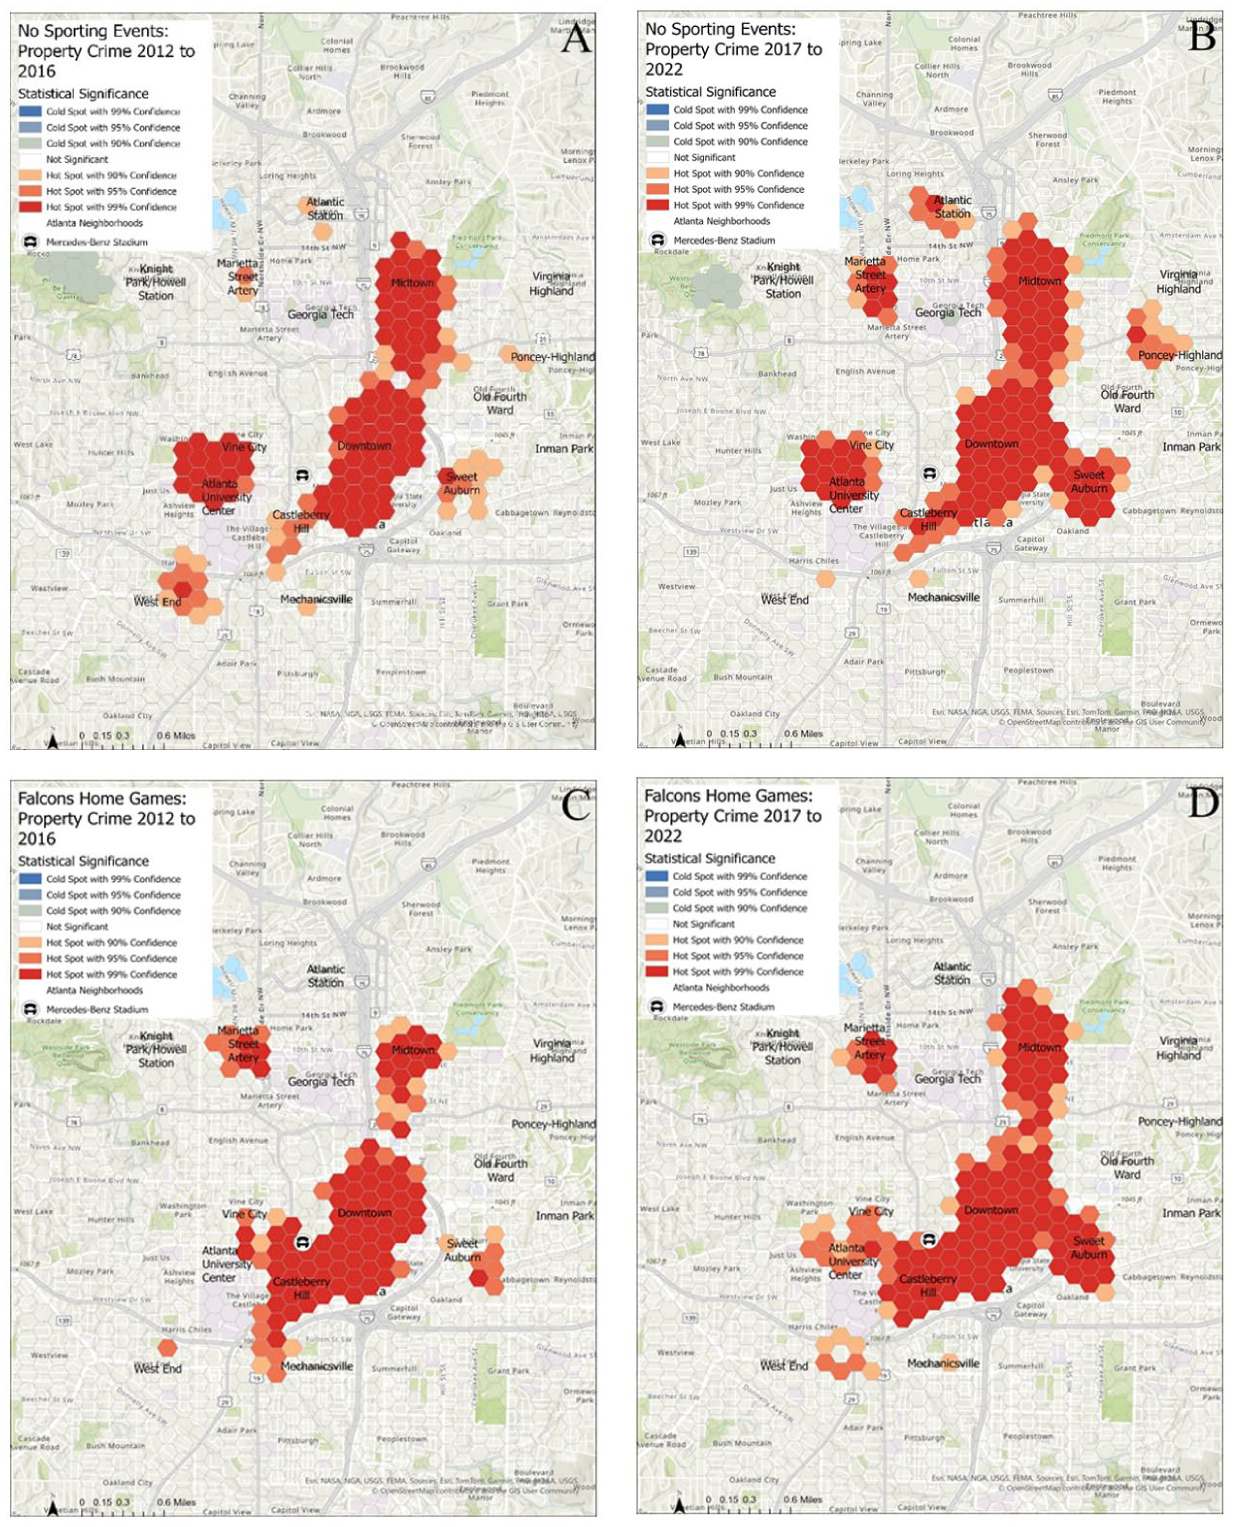
Hot spot analysis property crime: (A) no sporting events 2012 to 2016: incident count: 54,228, (B) no sporting events 2017 to 2022: incident count: 36,008, (C) falcons home games 2012 to 2016: incident count: 1,491, and (D) falcons home games 2017 to 2022: incident count: 1,229.
Violent Crime
Figure 3 shows the results for HSA for violent crime. Map 3A shows the results for days with no sporting events from 2012 to 2016. There are two main spatial clusters, the first extending from downtown, south past Mechanicsville, and north toward Midtown and Old Fourth Ward. The second extends from the West End north through Vine City. There are also three cold spots, at Georgia Tech, Westside Park, and Piedmont Park. Map 3B shows the results for days with no sporting events from 2017 to 2022. The map shows that the main hotspot areas at the 99% confidence level are still present from map 3A, but the West End no longer connects to the spatial cluster in Vine City/Atlanta University Center. The downtown cluster no longer extends past Mechanicville but now connects to Sweet Auburn.
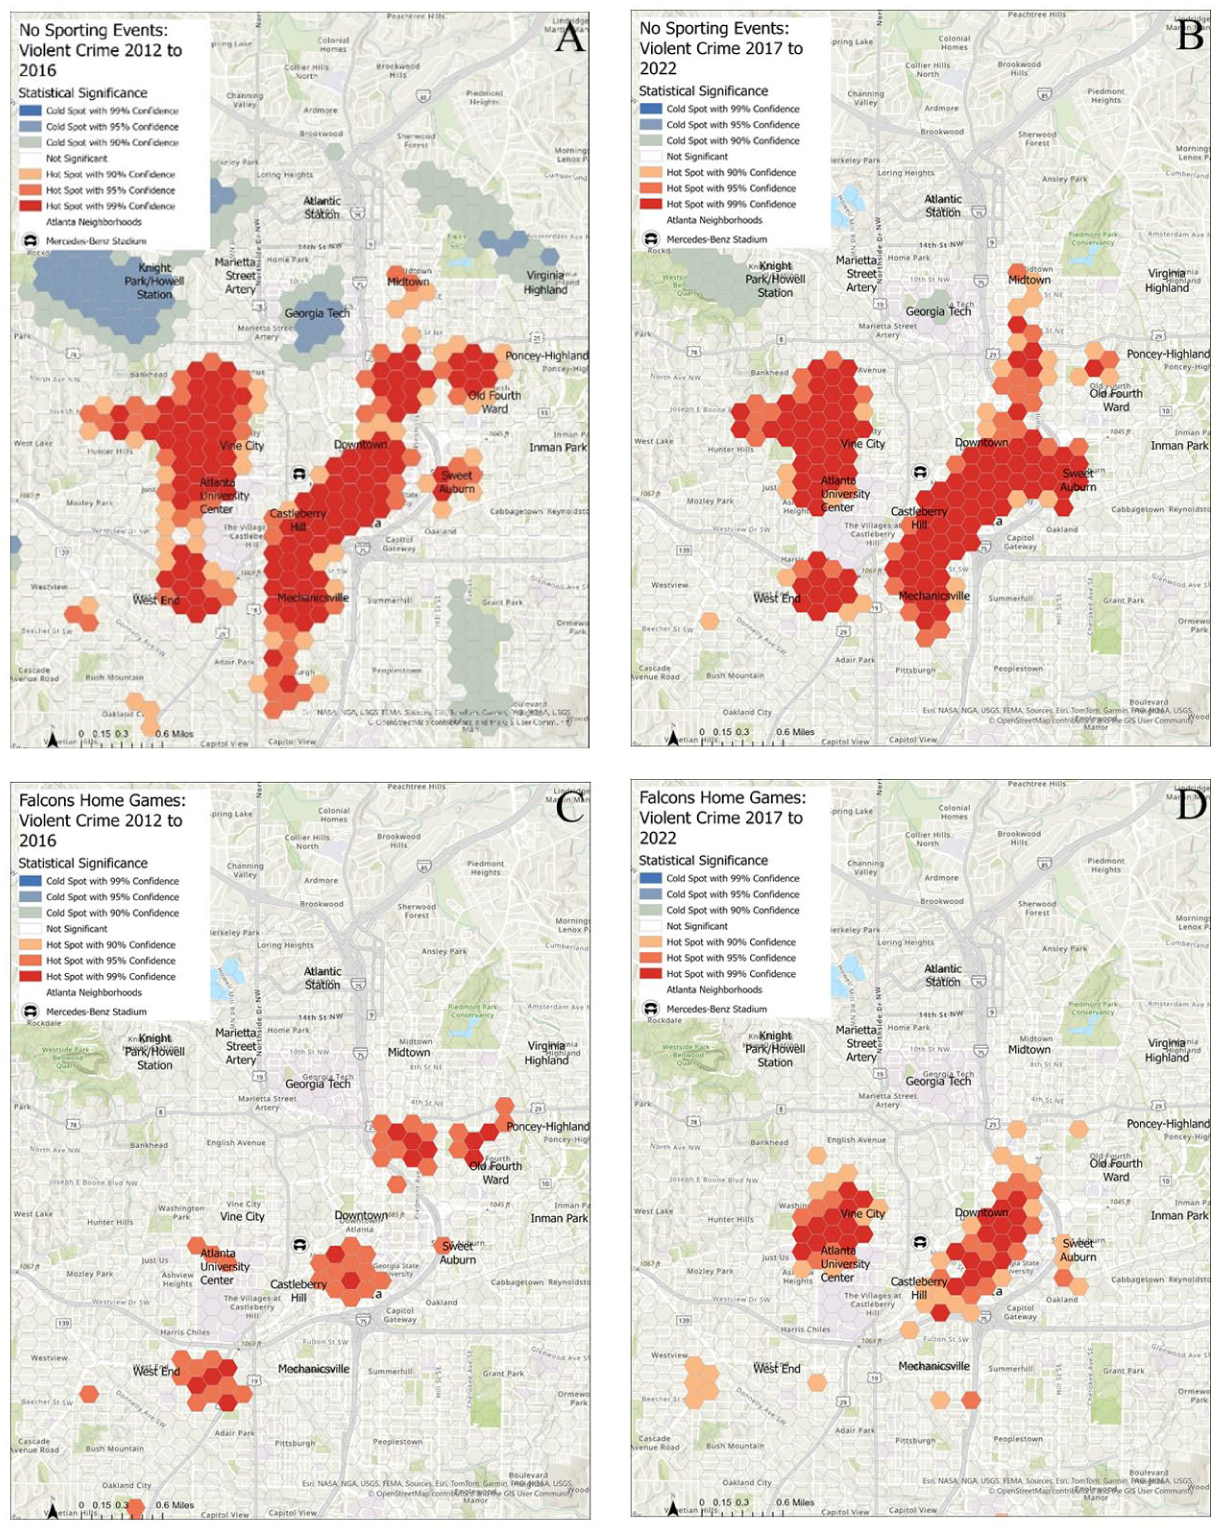
Hot spot analysis violent crime: (A) no sporting events 2012 to 2016: incident count: 9,358, (B) no sporting events 2017 to 2022: incident count: 5,371, (C) falcons home games 2012 to 2016: incident count: 272, and (D) falcons home games 2017 to 2022: incident count: 176.
Map 3C shows the results for days the Falcons played home games from 2012 to 2016, which are much different than the maps with no sporting events. The spatial clusters near Vine City/Atlanta University Center are almost gone, where only three cells are significant at the 95% confidence level. The downtown cluster shrinks and sees a decrease in the severity of clustering, primarily to the 95% confidence level. The area between downtown and Midtown now has the most significant spatial clustering at the 99% confidence level. The spatial cluster near the West End is still present, with a similar decrease in severity seen in the other areas. Map 3D shows the results for Falcons games from 2017 to 2022 and shows spatial clustering shifts to Vine City/Atlanta University Center and downtown, with some sporadic clusters on the periphery of the area.
Spatial Fuzzy Kappa Comparison
Table 1 shows the results of the hot spot comparisons for all, property, and violent crimes. The global values include all hexagon cells in the analysis, while the conditional values only include cells that were significant hot spots or cold spots in one of the maps. The results indicate a high correlation between map comparisons, particularly when including all crimes. The largest differences in all crimes are found between days with no sporting events versus days with the Falcons home games for both the 2012 (global: .75, conditional: .57) and 2017 (global: .77, conditional: .61) periods. The values indicate that sporting events do affect the spatial patterning of all crimes. The smallest difference for all crimes is between days with no sporting events in 2012 and 2017 (global: .88, conditional: .76), which indicates that hot spots are consistent across the two periods.
Hot Spot Comparisons: Spatial Fuzzy Kappa.
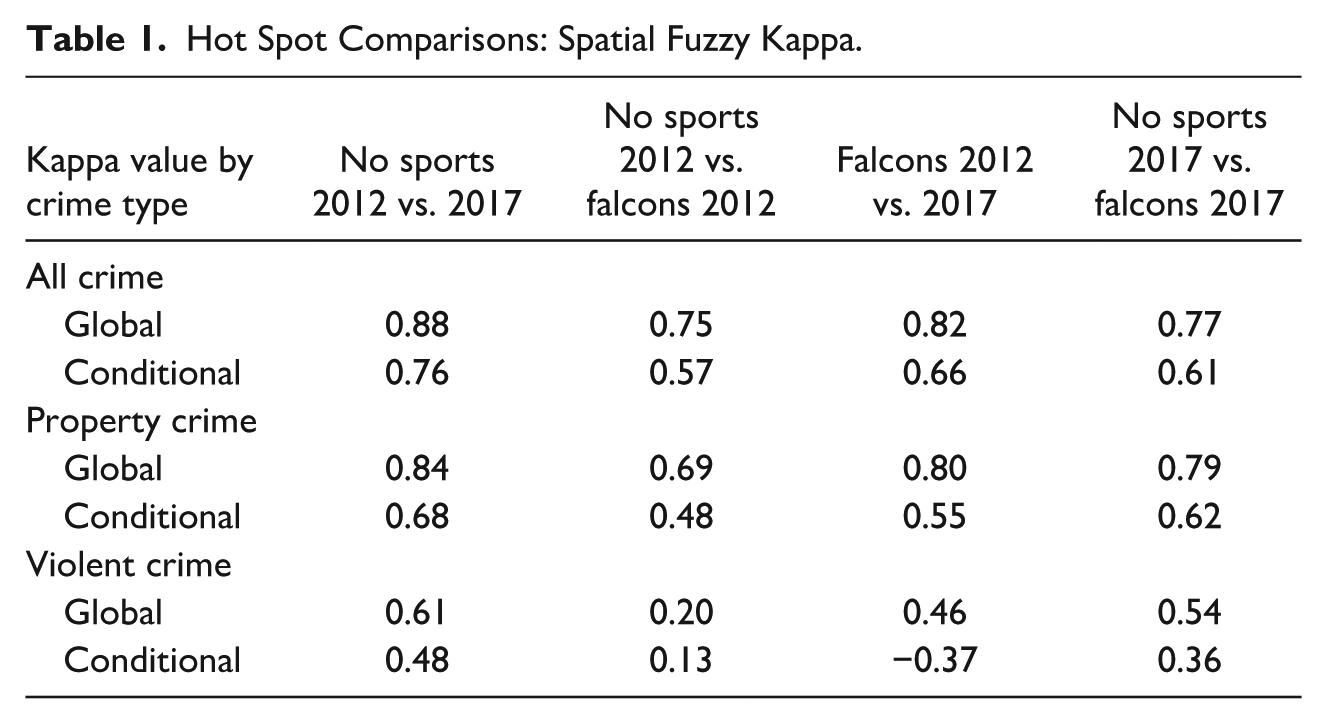
The results for property crime mirror those of all crimes, with the most prominent difference existing between days with no sporting events and Falcons home games in the 2012 period (global: .69, conditional: .48). Notably, the spatial clustering of property crime for Falcons home games in 2012 and 2017 shows some deviation (global: .80, conditional: .55), more than all crimes of the same comparison. By contrast, Falcons home games in 2017 align more with days with no sporting events (global: .79, conditional: .62), which replicates the broader patterns of all crime.
The results for violent crimes consistently show lower spatial fuzzy kappa values than all crimes and property crimes, indicating more unstable hot spots. The smallest difference is still between days with no sporting events in 2012 and 2017 (global: .61, conditional: .48). However, the comparison of Falcons home games between 2012 and 2017 shows a low kappa value (global: 0.46) and even a negative conditional kappa value (−0.37), indicating considerable changes in the spatial concentration of violent crime. Although the comparison between no sports and Falcons games in 2017 (global: .54, conditional: .36) indicates more consistency than in 2012 (global: .20, conditional: .36).
Discussion
The study addressed the spatial clustering of all crimes, property crime (auto theft, burglary, and larceny), and violent crime (murder, robbery, and aggravated assault) on days with Atlanta Falcons home games versus days with no sporting events, and whether the opening of a new stadium affects the spatial patterning of crime once it opens. To evaluate this, the study utilized Atlanta PD open portal data, which included data from 2012 to 2022, excluding COVID-19, and split the data into two five-year time frames. First, from 2012 to 2016, when the Atlanta Falcons were playing in the Georgia Dome; second, from 2017 to 2022, which follows the opening of Mercedes-Benz Stadium in 2017.
The study found that the spatial clustering of all forms of crime is consistent across time periods on days with no sporting events. Although the locations of spatial clusters are generally stable, the small variations that appear are consistent with the normal spatial-temporal variation of crime. Second, regardless of the Georgia Dome or the Mercedes-Benz Stadium, there is a significant spatial clustering of all crimes and property crimes around the stadium on days that the Atlanta Falcons play home games, particularly to the west, east, and south of the stadium. Second, the opening of Mercedes-Benz Stadium does not cause a significant shift in the spatial patterning of crime for all crimes and property crimes. Third, the results of violent crime show great instability and the greatest differences between maps. While clusters are consistent for days with no sporting events, there is a reduction in the size of the spatial clusters from 2012 to 2017, but the location of hot spots is stable. Fourth, for days with Falcons home games, violent crimes do not significantly cluster in the vicinity of the stadium.
The integrated environmental framework argues that crime concentration is fundamentally tied to the creation and utilization of space, a temporal catalyst, and the convergence of targets and motivated offenders. The stadium sits between two nodes, Downtown Atlanta and Vine City/Atlanta University Center, at the convergence of pathways linking the two nodes, but on game days, the stadium is a node or a super facility, rather than functioning as a pathway. The physical space does not change, but how it is utilized does. The integrated theoretical framework argues that crime clusters when spatial and temporal factors converge at a facility that concentrates property crime. While the results show that the stadium is not a crime attractor across all temporal factors, it is a crime attractor when the stadium is being utilized, where physical space meets the elements of crime. It is contingent on a temporal catalyst, in this case, a professional football game.
That alone is not enough; it also needs motivated offenders with a lack of capable guardianship, where the increase in guardianship does not dissuade motivated offenders. The location of the stadium is significant in the context of motivated offenders’ spatial knowledge of the surrounding areas. Therefore, the framework provides a guiding mechanism for why crime may concentrate around stadiums, particularly when they are located near downtown and other nodes. The spatial clustering of crime is in areas with parking, tailgating, and pathways to the stadium, and south and west of the stadium, which supports previous work done by Campedelli et al. (2023) around the Prudential Center. The effect illustrates the importance of the travel methods to and from the event and how fans’ vehicles become suitable targets for motivated offenders during sporting events because they are the most likely places for motivated offenders and suitable targets to converge.
The context of violent crime also deserves discussion broadly, and in the context of the stadium. Violent crime hot spots change the most between all comparisons, supporting previous works that found that violent crime hot spots are unstable over time (Deckard & Schnell, 2022; Weisburd et al., 2004). The effect is more pronounced for days with Falcons home games. Thus, limiting the time frame makes violent hot spots more unstable. Outside of this, the game days do not affect the spatial clustering of crime near the facility and reduce hot spots throughout the city. This could indicate that sporting events might function as a diversionary or incapacitative role for possible violent crime offenders (Copus & Laqueur, 2019). This results in fewer motivated violent offenders converging with suitable targets. Alternatively, the findings could indicate that violent crime is less contingent on space and more on social networks (Papachristos et al., 2012). Thus, for violent crime, the integrative framework is more suitable for property crimes than violent crimes.
Several policy considerations must be made in the relationship between the stadium and crime. First, the contextualization of creating space is a historical and ongoing process that affects the clustering of crime. The location of the stadium and the composition of space connecting the stadium to the city are at the intersection of state and local politics, event organizers, police, event security, and neighborhoods. Second, the results of this study contribute to the development and implementation of intelligence-based policing during sporting events. The facility might be secure, but there could be a spillover in the immediate vicinity of the stadium, especially on unsupervised pathways and parking lots. The pathways of the Mercedes-Benz Stadium include foot traffic from downtown, Castleberry Hill, Vine City, the bus system, MARTA, and parked vehicles, which complicate the safety of fans and the community.
The current study is limited by multiple factors. The data from the Atlanta PD open portal limited the analysis to crimes that were available in the historical data and current data sets, in this case, auto theft, burglary, larceny, robbery, homicide, and aggravated assault. The modifiable areal unit problem (MAUP) of aggregating data, which indicates that results are dependent on the scale and units of the analysis, limits all spatial analyses (Bailey & Gatrell, 1995). The analysis utilized an optimized hot spot analysis to determine the size of cells and employed the false discovery correction to limit this bias. The separation of non-gamedays, while important for the analysis, has its limitations due to how few games NFL teams play, which was one of the major reasons for the 5-year time periods. In this case, the Falcons played 80 home games across the 10 years. The issue is not as pronounced with property crime, but violent crime has 272 incidents from 2012 to 2016 and 176 incidents from 2017 to 2022, making it more susceptible to the small number problem, but still showing significant spatial autocorrelation. The small numbers or rare events at the small geographic units can contribute to the volatility of violent crime hot spots (Levin et al., 2017). Therefore, the results and implications should be interpreted cautiously. The study only controlled for college and professional sporting events. Other events, like high school football or concerts, were not included. Lastly, game day security alters where police and guardianship are located, which may inflate crime reports because police are in the location. Future research should focus on replicating this study in various cities with different NFL stadiums and methodological techniques. Future studies should address the relationship between the construction of a stadium and crime in a multicity design.
Supplemental Material
sj-docx-1-cad-10.1177_00111287251411789 – Supplemental material for The Geography of Game Day: Stadiums, Football, and the Spatial Clustering of Crime
Supplemental material, sj-docx-1-cad-10.1177_00111287251411789 for The Geography of Game Day: Stadiums, Football, and the Spatial Clustering of Crime by Ryan Bagwell in Crime & Delinquency
Supplemental Material
sj-docx-2-cad-10.1177_00111287251411789 – Supplemental material for The Geography of Game Day: Stadiums, Football, and the Spatial Clustering of Crime
Supplemental material, sj-docx-2-cad-10.1177_00111287251411789 for The Geography of Game Day: Stadiums, Football, and the Spatial Clustering of Crime by Ryan Bagwell in Crime & Delinquency
Footnotes
Author Note
A previous version of this paper was included in my dissertation and a previous version of the abstract was presented at ACJS 2025.
Declaration of Conflicting Interests
The author declared no potential conflicts of interest with respect to the research, authorship, and/or publication of this article.
Funding
The author received no financial support for the research, authorship, and/or publication of this article.
Data
The datasets generated during and/or analyzed during the current study are available from the corresponding author upon request.
Supplemental Material
Supplemental material for this article is available online.
Author Biography
References
Supplementary Material
Please find the following supplemental material available below.
For Open Access articles published under a Creative Commons License, all supplemental material carries the same license as the article it is associated with.
For non-Open Access articles published, all supplemental material carries a non-exclusive license, and permission requests for re-use of supplemental material or any part of supplemental material shall be sent directly to the copyright owner as specified in the copyright notice associated with the article.