
Abstract
This study examines the relationship between community incarceration rates and medical debt in the United States using annual county-level data from 2012 to 2019. We account for stable and varying county-level dynamics through fixed effects regression models with controls for demographics, socioeconomic status, insurance coverage, health, and crime rates. Nationally, we find increased incarceration is associated with reduced median medical debt and has no effect on the share of the population with medical debt, but we find that these patterns vary by racial and ethnic composition. Non-white communities experience worsening medical debt as incarceration rises while white communities do not. Our results suggest incarceration has a complicated relationship with medical debt and is detrimental for communities of color.
Introduction
The United States has an incredibly high incarceration rate (Widra, 2024). Nearly two million people are incarcerated on any given day in state or federal prisons and local jails (Kang-Brown & Zhang, 2024), and even more people cycle through incarceration, with 7.8 million jail admissions annually (Sawyer & Wagner, 2025). In addition, the United States has a significant medical debt problem. About 14 million people, or 6% of adults, owe over $1,000 in medical debt, and about three million people, or 1% of adults owe more than $10,000 (Rakshit et al., 2024). Both incarceration and medical debt disproportionately impact communities of color: compared to white men, Black men are incarcerated at rates four times higher, while Black women are incarcerated at 1.6 times the rate of white women (Ghandnoosh, 2023). Thirteen percent of Black people have medical debt, compared to 7% of white people (Rakshit et al., 2024). Incarceration can lead to debt and economic hardship felt by both directly incarcerated people and their families, but the relationship between incarceration and medical debt at the community level is still not well understood. In this paper, we examine the relationship between incarceration and medical debt at the county level during the 2010s, including whether the relationship varies by the racial and ethnic composition of a county.
Incarceration and Financial Hardship
Incarceration carries profound consequences for individuals, families, and communities, bringing, among other tremendous challenges, the potential for significant financial hardship. For many families, the incarceration of a loved one means the loss of a significant, or at times the only, source of household income (deVuono-powell et al., 2015; Elderbroom et al., 2025). This affects a family’s ability to pay for housing, healthcare, and basic essentials. A 2015 study found that nearly 2 in 3 families with an incarcerated family member were unable to meet their family’s basic needs (deVuono-powell et al., 2015). In addition, household wealth is demonstrably lower for families that have an incarcerated family member: a recent study found that the median wealth for households with an incarcerated family member was $7,350, while households without a criminal justice system interaction had a median household wealth of $177,800 (Weller et al., 2022). Other studies have found that families with a currently or previously incarcerated member hold about half as much wealth as households not affected by incarceration, a disparity even more pronounced among households of color (Craigie et al., 2020;Weller et al., 2022).
In addition to loss of household income, incarceration can lead to financial hardship through exorbitant fines and fees, also known as legal financial obligations (LFOs), which include court fees, fines related to crimes committed, victim restitution, and fees related to community supervision (Martin et al., 2018). Further, incarcerated people often are billed co-pays and fees for medical care they receive while incarcerated (A. Anderson, 2024). In a scoping review of financial debt and incarceration, Harper et al. (2020) found evidence that LFOs can be directly tied to individuals and families accumulating debt. LFOs-related debt particularly affects communities of color who are more than twice as likely to have unpaid LFOs (Board of Governors of the Federal Reserve System, 2020).
Debt held prior to incarceration can also grow while its holder is behind bars and may be unable to pay off the debt (Harper et al., 2020; Western & Pettit, 2010).
Incarceration and Medical Debt
Medical debt is ubiquitous in the United States: nearly one in 12 adults had medical debt over $250 as of December 2021 (Rakshit et al., 2024). Based on a survey of incarcerated people in 2016, 51% of respondents in state prisons and 43% in federal prisons reported ever having a chronic health condition (Maruschak et al., 2021), and incarcerated people are more likely to experience high blood pressure, asthma, cancer, arthritis, and infectious diseases (e.g., tuberculosis, hepatitis C, and HIV) than the general population (United States Department of Health and Human Services, n.d.). Because incarcerated people are disproportionately low-income and earn little to no wages during incarceration, even modest medical expenses can be difficult to afford without accumulating debt (A. Anderson, 2024). Research examining debt among individuals recently released from incarceration finds that medical debt is common among this population; in a survey of individuals released from jail or prison within the past year who had chronic health conditions, 84% owed at least one debt upon release, with non-legal debt – including medical bills – more common than legal debt. Nine percent of respondents faced debt ranging from $800 to nearly $20,000 due to unpaid medical bills (Ginapp et al., 2023). In Nevada, incarcerated people who sought medical care incurred an average medical debt of over $4,500 (A. Anderson, 2024; Fines & Fees Justice Center, 2022).
In addition to higher medical needs, people who have been incarcerated are more likely to be uninsured, to experience uninsurance for a year, and to lack stable health insurance coverage (Zhao et al., 2023). Studies of uninsurance rates for incarcerated people estimate a range of 40% to 90% prior to the passing of the Affordable Care Act (Testa & Porter, 2023). Those without health insurance are more likely to have medical debt (Rakshit et al., 2024). People who have been incarcerated also receive fewer preventive services, which can contribute to worsening health and higher medical costs later (Zhao et al., 2023).
Both incarceration and medical debt disproportionately impact communities of color: compared to white men, Black men are incarcerated at four times the rate and Black women are incarcerated at 1.6 times the rate of white women (Ghandnoosh, 2023). People who are Black are nearly twice as likely to have medical debt than white people and are more likely to have medical debt than any other racial and ethnic group according to self-reported data from the Survey of Income and Program Participation (Rakshit et al., 2024).
While the relationships between debt and incarceration are well studied as discrete phenomena, there is very little research that assesses the effects of these relationships at a community level. As Clear (2007), among others, has established, incarceration can have powerful effects on community economic and social conditions that create a vicious cycle in which increased incarceration leads to increased economic hardship and social destabilization, which in turn leads to increased incarceration. Such a relationship may exist at the community level for debt, but to date, few studies have investigated this. Moreover, both incarceration and medical debt operate through community-level mechanisms that individual-level analyses do not fully capture. High incarceration rates remove household income earners from communities and destabilize local economies (Clear, 2007; Western & Pettit, 2010), while concentrated medical debt in communities can threaten local hospital finances and reduce providers’ capacity to offer services (Tuttle et al., 2024), with downstream effects on housing, employment, and economic stability that extend beyond those directly impacted by incarceration (Clear, 2007;Spears, 2021). These dynamics suggest that the effects of incarceration and medical debt extend beyond individuals to shape broader community conditions, making the community level an important unit of analysis to understand their relationship.
While other forms of debt may have a straightforward relationship to the economic hardships produced by incarceration, such a relationship may not be as clearly present for medical debt. Medical debt in the United States is complicated by the inconsistent availability of health insurance which depends on employment status and the state in which one lives, among myriad other factors. For these reasons, individuals with medical conditions may find medical care in jail or prison that is not as readily available to them in their community. Indeed, while medical care in jails and prisons is often lacking, those who are incarcerated have a constitutional right to minimal, basic health care as a result of the Eighth Amendment’s prohibition of “cruel and unusual” punishment and, as such, may still have greater access to care while incarcerated (Wilper et al., 2009). In addition, in some jurisdictions, community supervision officers may act as links to necessary resources, helping reentering individuals obtain health insurance and seek out necessary medical care (Bares & Mowen, 2019; Matz et al., 2017; Schaefer & Williamson, 2017). It is thus unclear from the current literature base what, if any, community-level effects incarceration may have on medical debt. Research has also established that debt and incarceration are most powerfully felt by individuals of color (e.g., Clear, 2007; Houle & Addo, 2018), yet existing research has yet to examine how the relationship between these two factors may vary by the racial or ethnic composition of a community.
Due to the racial wealth gap, Black and Hispanic households are more likely to lack the liquid assets needed to absorb economic shocks without cutting spending on healthcare and insurance (Bhutta et al., 2020). Two-thirds of Black and Hispanic households do not have the means to sustain themselves at the poverty level for 3 months on liquid assets alone (Dean, 2024). Because of this, the medical expenses, income loss, and LFOs associated with incarceration produce larger financial consequences in communities of color; research shows the burden of equivalent income shocks is at least 50% higher for Black households and 20% higher for Hispanic households compared to white households (Ganong et al., 2020), making it likely that the relationship between medical debt and incarceration-related financial shocks varies based on the racial composition of communities.
Current Study
To address these gaps in the current understanding of incarceration and medical debt, we use county-level data on incarceration, debt, crime, and health to examine how changing incarceration rates affect medical debt within a county over an 8-year span. Specifically, we seek to address the following research questions and hypotheses:
Data and Methods
Data Sources
This study relies on data from the Vera Institute of Justice (Vera), the Urban Institute (Urban), the FBI, and the U.S. Census Bureau. The Vera Institute of Justice’s Incarceration Trends includes county-level jail and prison data, compiled from state departments of corrections, local government agencies, the Annual Survey on Jails, and the National Corrections Reporting Program. We extracted county-level jail, prison, and total incarceration rates from 2009 to 2019. County-level prison populations represent the county of conviction, not of incarceration. In most cases, county of conviction and county of residence are the same (Wagner, 2003).
The Changing Medical Debt Landscape in the United States is a dataset developed by the Urban Institute that provides county-level estimates of several measures of medical debt among adults with credit bureau records. It is based on the Urban Institute’s Credit Bureau Panel, a nationally representative sample of depersonalized consumer data from a major credit bureau from 2011 to 2023. The panel consists of a two percent random sample of consumers, and it is refreshed at each pull to maintain national representativeness. The dataset has measures on the share of adults with a credit record who have medical debt in collections and the median amount of medical debt among those who have medical debt in collections at the county level. Medical debt measures for white communities and communities of color are based on the racial demographics of ZIP code tabulation areas (ZCTAs), with white communities being defined as areas where at least 50% of the population is non-Hispanic white and communities of color being areas where at least 50% of the population is African-American, Hispanic, Asian or Pacific Islander, American Indian or Alaska Native, another race other than white, or multiracial. This dataset also includes a measure of hospital market concentration, calculated annually based on data from the American Hospital Association Annual Survey (Blavin et al., 2024).
We used the FBI’s Uniform Crime Reporting (UCR) data to generate county-level crime estimates across the United States. We used UCR data processed and standardized by Kaplan (2024) to create measures of index property crime, index violent crime, and total crime for counties. UCR data are reported by agency, not location, meaning that they cannot readily be aggregated to the county level. We instead assign the crimes associated with local police departments, sheriff’s offices, and specialty agencies to the primary county associated with the agency. We exclude state and federal agencies from the analysis. This leads to imperfect estimates of crime at the county level, as crimes captured by state and federal law enforcement agencies are not included, and agencies that cover multiple counties would have all crime assigned to the primary county. We calculate annual crime rates per 100,000 residents.
Lastly, these data were supplemented with county-wide demographic data from the Census Bureau’s American Community Survey (ACS) 5-Year Estimates and by data on heart disease and stroke mortality at the county-level from the National Vital Statistics System collected by the Centers for Disease Control and Prevention.
Our core analysis spans 2012 to 2019. To support lagged measures of incarceration, we included data from 2011, 2010, and 2009. Not all county-year observations from 2012 to 2019 are covered by every dataset due to differences in data availability across counties and years. We use listwise deletion when encountering missing data. Counties with populations under 10,000 were excluded from the analysis because rate-based measures, particularly incarceration rates, become highly unstable in counties with very small populations.
Measures
Dependent Variables
Our dependent variables are (1) the share of adults with medical debt in collections and (2) the median amount of medical debt in collections, adjusted to 2023 dollars. The share of adults with medical debt in collections is based on the share of adults with a credit bureau record whose records indicate they have outstanding medical debt. The median amount of medical debt in collections is the median medical debt among those who have medical debt in collections in their records. For both median medical debt and the share of adults with medical debt, there are community-specific measures, with a measure for white communities and a measure for communities of color. Only counties in which at least one such community exists are included in these measures. Table 1 describes all dependent, independent, and control variables.
Descriptive Statistics of Dependent, Independent, and Control Variables, 2012 to 2019.
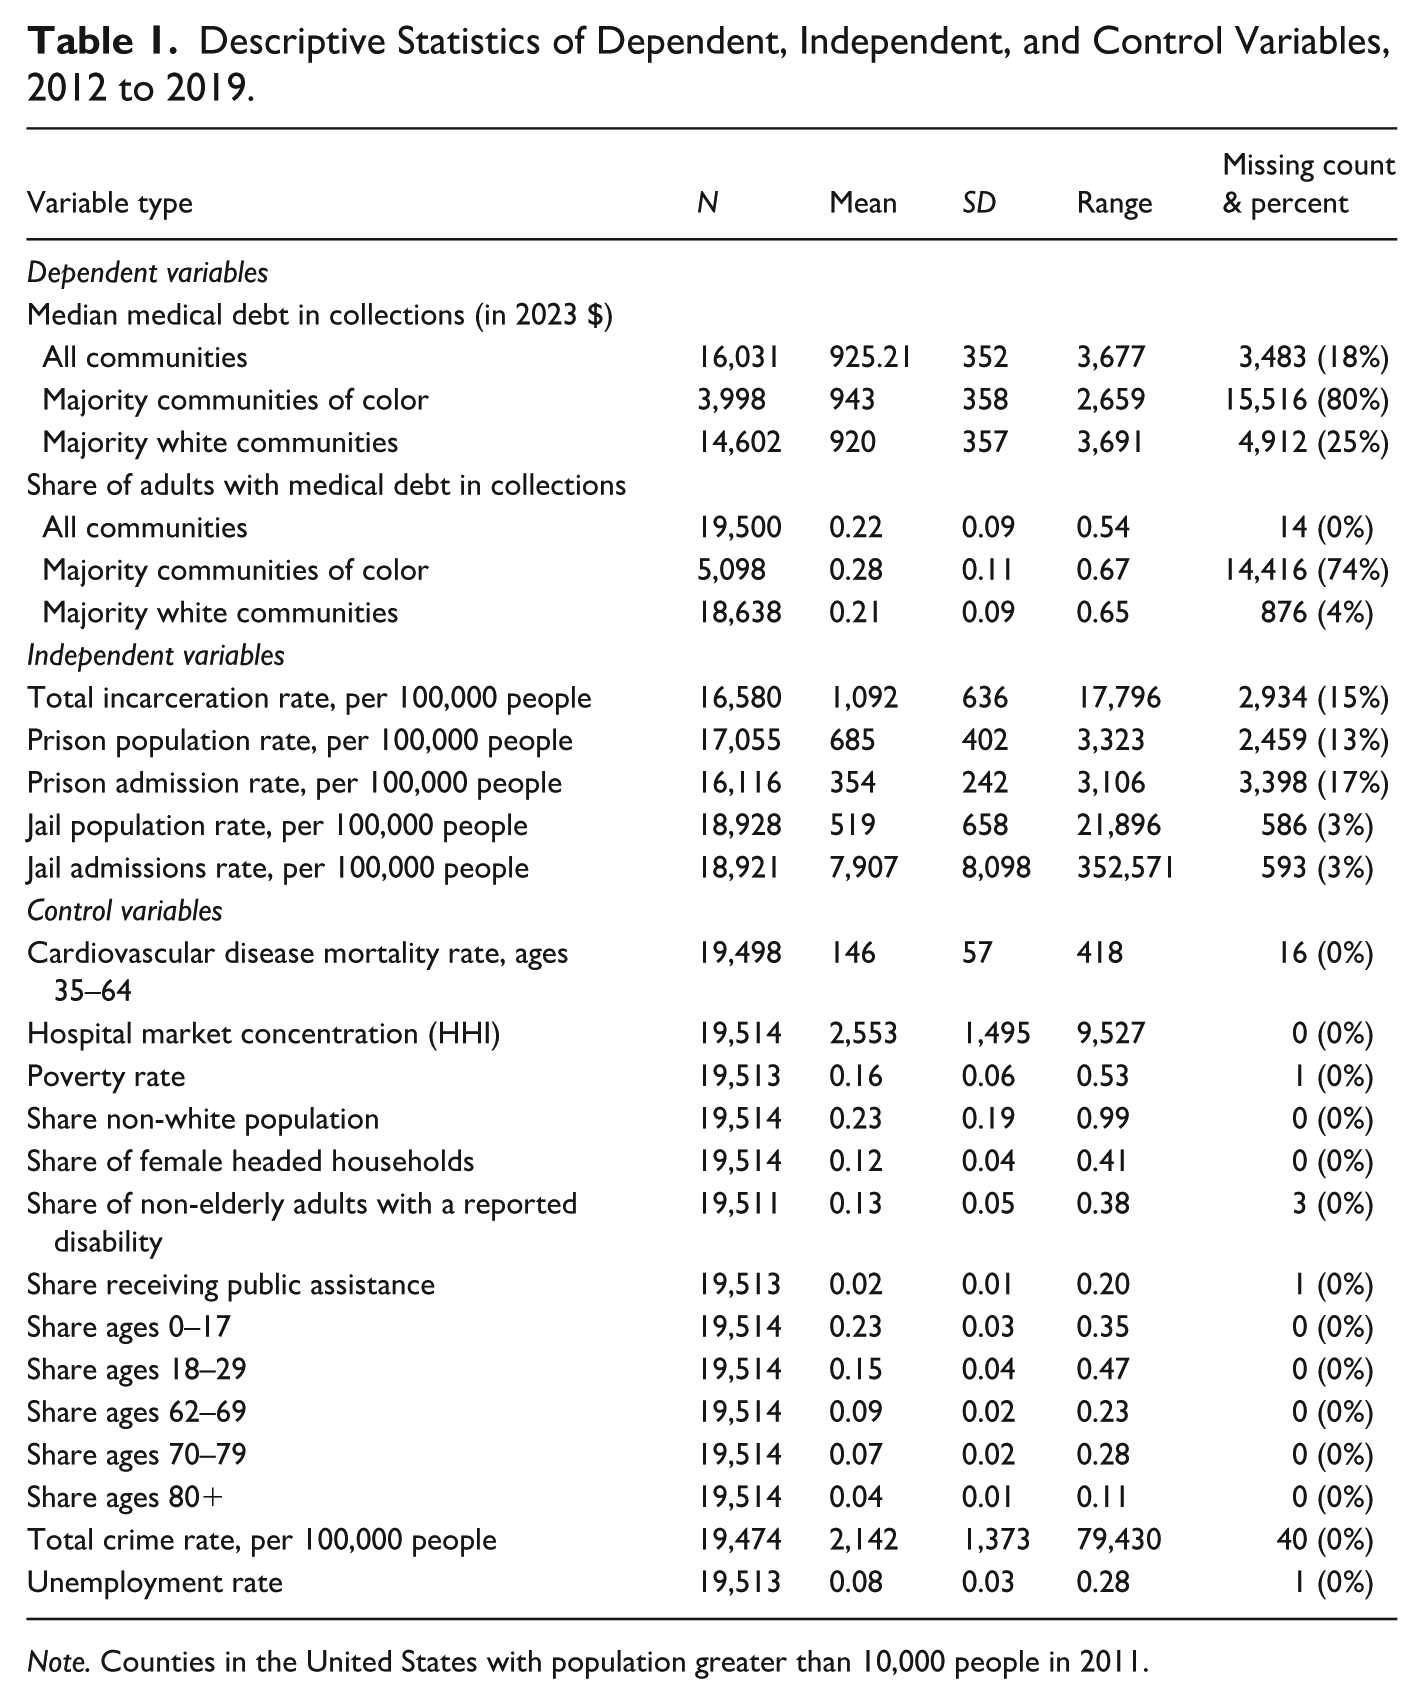
Note. Counties in the United States with population greater than 10,000 people in 2011.
Independent Variables
The independent variables in our models are the following county-level incarceration measures: the total incarceration rate, the jail population rate, the jail admission rate, the prison population rate, and the prison admission rate. Each measure is expressed per 100,000 people. The jail population measure includes individuals held under both local and non-local authorities (e.g., BOP, state facilities) at a point in time. The prison population reflects the number of people sentenced to state prison, aggregated by the county of conviction at a point in time. The total incarceration variable represents the sum of the jail and prison population. The jail and prison admission variables represent the annual number of admissions to jail and prison, respectively. Multiple admissions for the same person are included as distinct entries.
We examine five measures of incarceration, as it is possible that each measure’s relationship to debt may vary. Incarceration in jails largely covers short sentences and pretrial stays, but new jail sentences may occur more frequently. Prison stays, on the other hand, are usually long sentences with far less frequent turnover. Total incarceration captures the overall impact of custody by the criminal legal system. Admissions and population measures capture slightly different information, as population is likely to overly represent those with long sentences and admissions are likely to overly represent short sentences. Findings may vary depending on whether it is frequent short disruptions, infrequent long disruptions, or the combined impact of the two that most strongly affect medical debt. If only a short disruption affects medical debt through its impact on job stability and family and household care, then jail, which affects far more individuals, may have a more notable countywide impact. Alternatively, short disruptions may not impact medical debt, but long disruptions might, due to the extended economic impact on a family and health impact on the incarcerated individual. Thus, prison may have a more notable countywide impact. Finally, due to differing data availability, the jail data used in this study provide broader representation across the United States than do the prison data. None of the incarceration measures were normally distributed, so the natural log was used in all models to create more normally distributed measures. Due to a small number of counties with a value of zero for prison admissions and population, we added 1 to those variables before logging.
Control Variables
To account for factors that may confound the relationship between incarceration and medical debt, we include a set of county-level controls in our models, including crime rates using data from the FBI’s UCR database, which combines all violent and property Part I index crimes. This allows us to control for the relationship between debt and crime and ensure that, in measuring the relationship between incarceration and crime, we are not simply capturing the crime-debt relationship. We explored including violent and property crime indexes as separate variables, but there was a strong correlation between these two measures (r = .54).
To account for factors that increase medical risk, we control for the share of the population that is not elderly but has a reported disability, the cardiovascular disease mortality rate, the hospital market concentration, and whether a state in a particular year had expanded its Medicaid access via the Affordable Care Act. Finally, we control for age, focusing on those at greatest risk of incarceration (18–29) and at greatest risk of medical complications (over 60).
Analytic Approach
To address our research questions, we first explore the incarceration and medical debt data visually to understand the geographic and temporal trends in each measure. Next, we use regression models to understand the relationship between these measures over time. We use a fixed effects panel regression model with robust standard errors. This allows us to measure change within a county, holding all unobserved county-level differences constant, and controlling for county changes in economic, medical, demographic, and crime conditions between 2012 and 2019. Our focus is on measuring the average impact across counties of a change in incarceration on medical debt while controlling for both the stable and time-varying aspects of a county, which a fixed effects model allows us to do (Mihaly et al., 2012).
We run models regressing each medical debt measure on each incarceration measure. We regress current year medical debt on current year incarceration and on the prior year’s incarceration. To the extent these two concepts are related, it is theoretically possible that either current or prior year incarceration rates will affect medical debt, as the impact of incarceration on health and financial wellbeing may be both immediate and subject to increase with time. We explored 2- and 3-year lags but did not find evidence for an impact of these longer lags. We also examined the possibility of curvilinear relationships between logged incarceration and medical debt but did not find clear or consistent patterns for these relationships. Therefore, we examine a potential linear relationship between these variables. We run multivariate models in which we control for the measures discussed above. Correlations across these measures were examined and did not suggest that collinearity was an issue.
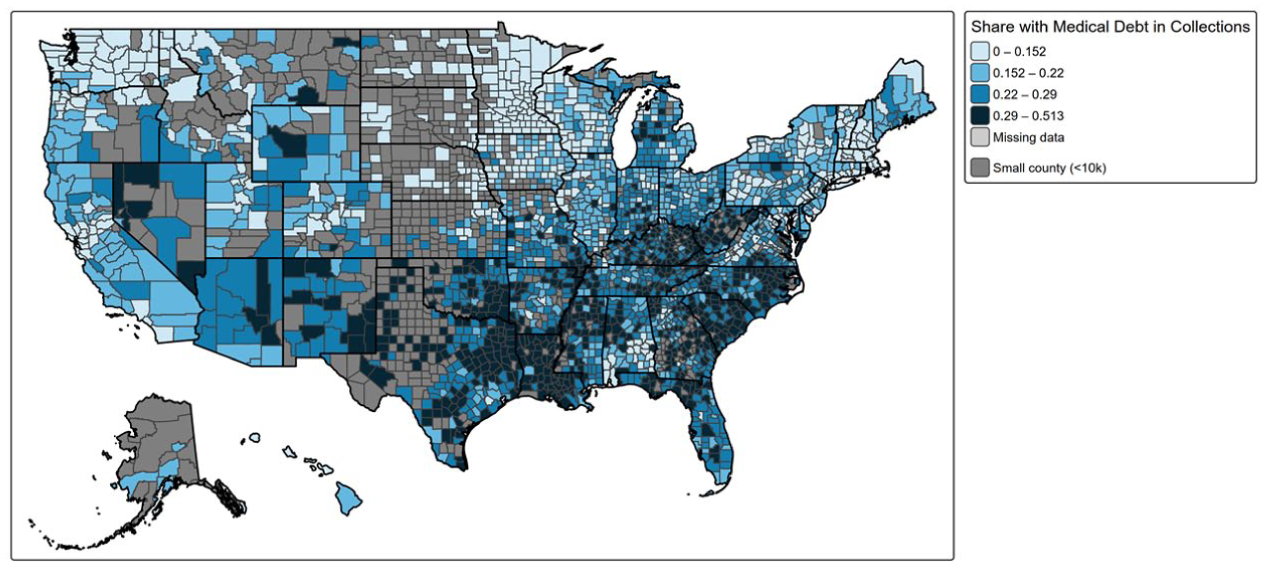
We estimate the following model:
Where t = 1, … , N indexes years; i = 1, …, K indexes counties;
Results
Descriptive Analyses
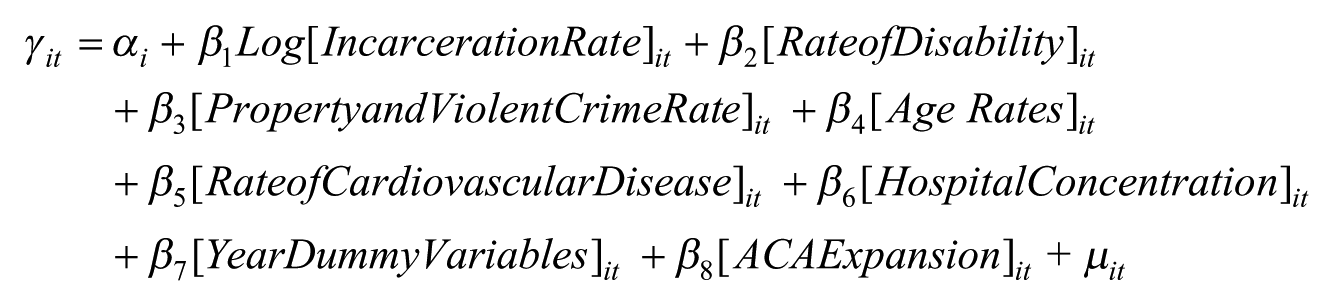
We begin by examining patterns in medical debt and incarceration across counties and years. As Figure 1 highlights, the distribution of the share of adults with medical debt in collections is relatively evenly distributed within each year. This suggests that the declining national average in medical debt is a consistent trend across many counties rather than driven by a few counties and that the impact of medical debt is relatively broadly felt.
Share of adults with medical debt in collections by year, 2012 to 2019.
While the average share of the population with medical debt in collections across counties declined from 22% in 2012 to 19% in 2019, the median amount of medical debt owed (adjusted to 2023 dollars) rose by 12%, starting at $899 in 2012 and reaching $1,004 by 2019. The combination of declining prevalence and rising debt amounts indicates that during the study period, medical debt became slightly less common but more severe.
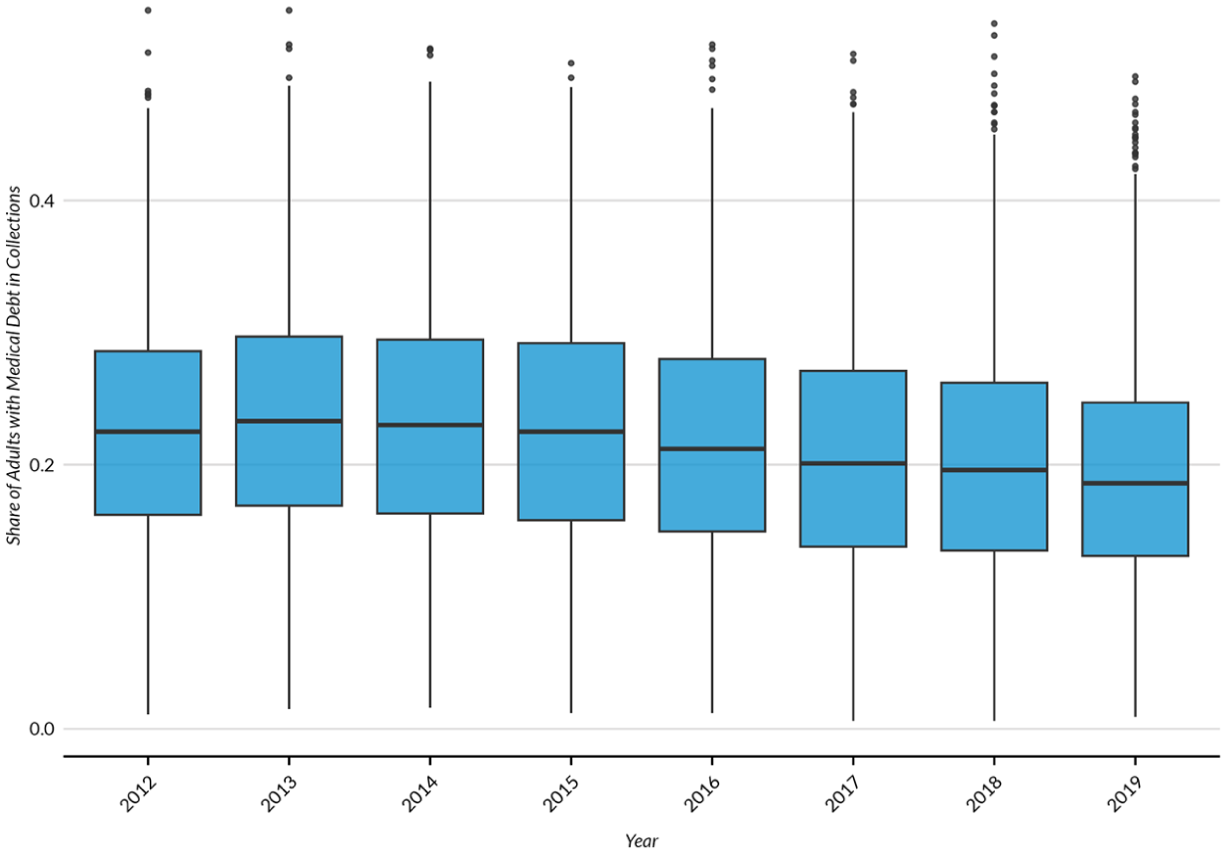
Figure 2 presents a choropleth map of the share of adults with medical debt in collections by county in 2015. Counties are grouped into four quartiles based on the prevalence of medical debt, with darker colors indicating higher shares of the population facing debt. The map suggests potential geographic clustering in medical debt rates, with medical debt most common in counties across the South and less common in the Midwest, Northwest, and Northeast.
Share of county population with medical debt in collections, 2015.
Figure 3 shows the notable differences between trends in jail and prison population rates and admission rates. The average jail population rate increased from 2012 to 2019. In contrast, prison population rates remained relatively steady during the study period. But from 2012 to 2019, the average jail admission rate was largely constant, while the average prison admission rate increased more notably, suggesting that some of the population changes may have been driven by differences in the rate of releases. County-level jail population rates have an uneven distribution, with a narrow interquartile range, significant right skew, and numerous outliers. This pattern suggests that unlike medical debt, the impact of jail incarceration is not evenly felt across the United States, with only a handful of counties experiencing the largest effects. While the distributions of county-level prison population and total incarceration rates appear more symmetrical than jail population rates, there was still a notable right skew.
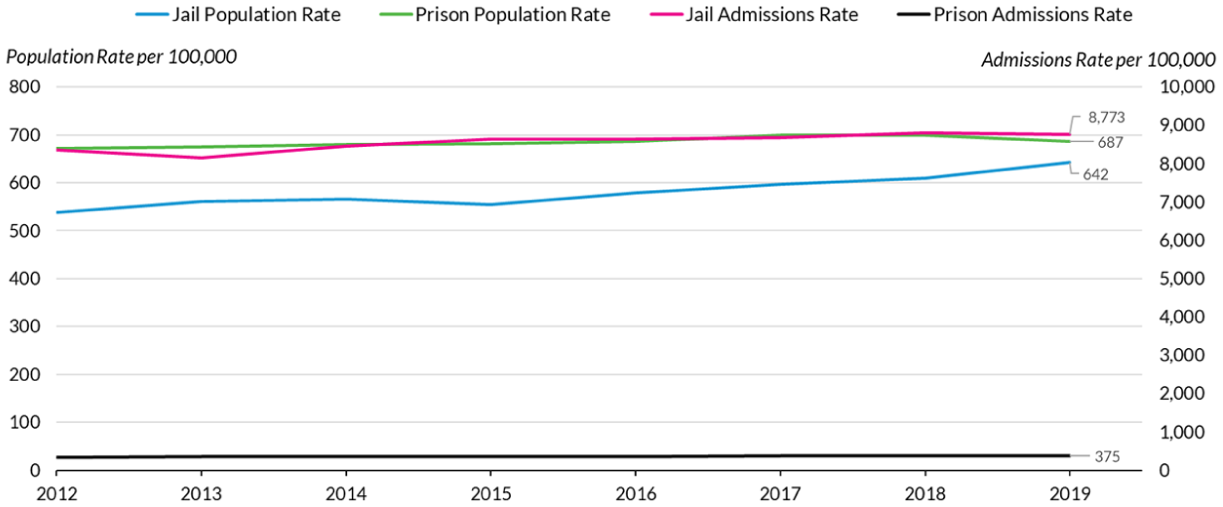
Mean annual jail and prison population and admission rates per 100,000 people, 2012 to 2019.
Although not as pronounced as trends in medical debt prevalence, geographic clustering is observable in jail, prison, and total incarceration rates. Figure 4 shows the distribution of jail population rates by county. There appears to be an overlap between medical debt and incarcerationt, with higher rates of both in the South. But while only a handful of counties throughout the rest of the country have high rates of medical debt, there appears a broader distribution of counties with high rates of incarceration spread across the West, Midwest, and even Northeast.
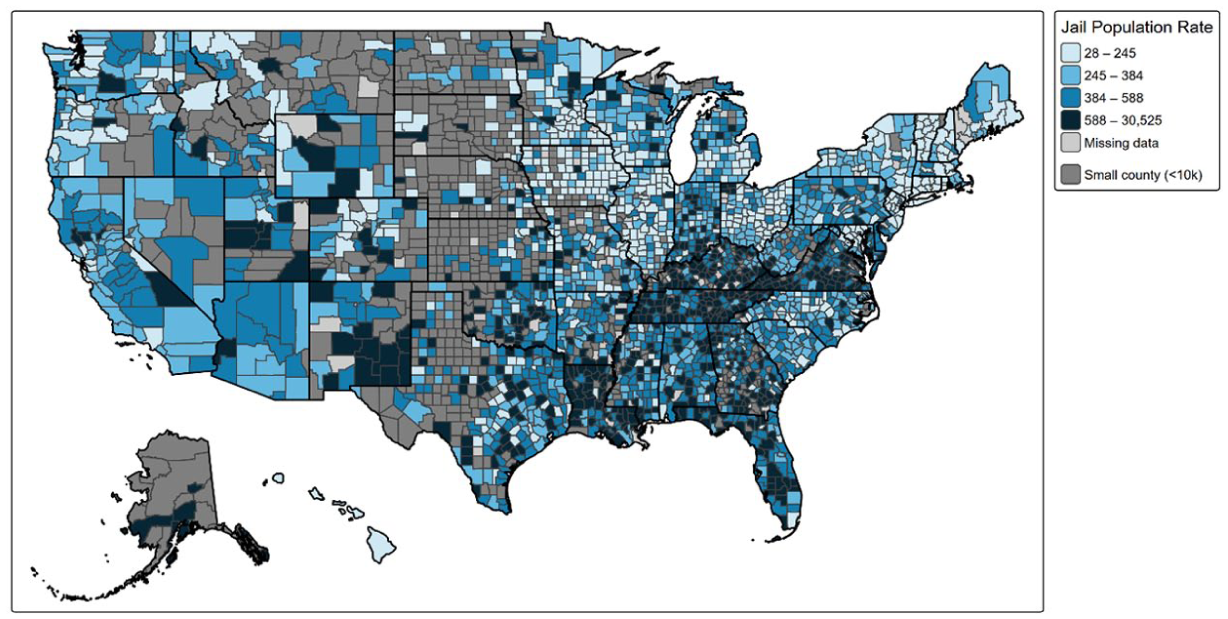
Jail population rate per 100,000 people by county, 2015.
Regression Analyses
We begin with bivariate regression models (with the inclusion of year dummy variables to ensure we account for time trends) to understand the relationship between these measures, and as we account for health and crime risks in subsequent models, whether such relationships change. To conserve space, we discuss the general findings here and present the models in Supplemental Appendix A on the lead author’s GitHub page (https://github.com/waltercamp/Incarceration_Debt_Project). Contrary to our predictions, we find that same-year increases in incarceration for all measures except jail admissions are not associated with changes in the share with medical debt. For prior year incarceration, we observe the same relationships. For median medical debt, contrary to our predictions, we find that same year increases in the total incarcerated population, jail incarceration population, and jail admission rate are associated with reduced median medical debt. For prior year incarceration, we observe similar relationships, but the differences are not statistically significant for prison admissions.
With an understanding of how medical debt and incarceration vary across time and space, we now examine the relationship between these phenomena using multivariate models. First, we explore the relationship across all communities. Following this, we examine this relationship within communities of color and white communities separately. Table 2 displays the results of regressing share with medical debt within the same year. Table 3 shows the analogous results for the median medical debt outcome. We then run the same models using a 1-year lag for incarceration and discuss findings from these models which are available in Supplemental Appendix B on the author’s Github page.
Share With Medical Debt in Collections Regressed on Same Year Incarceration Rates.
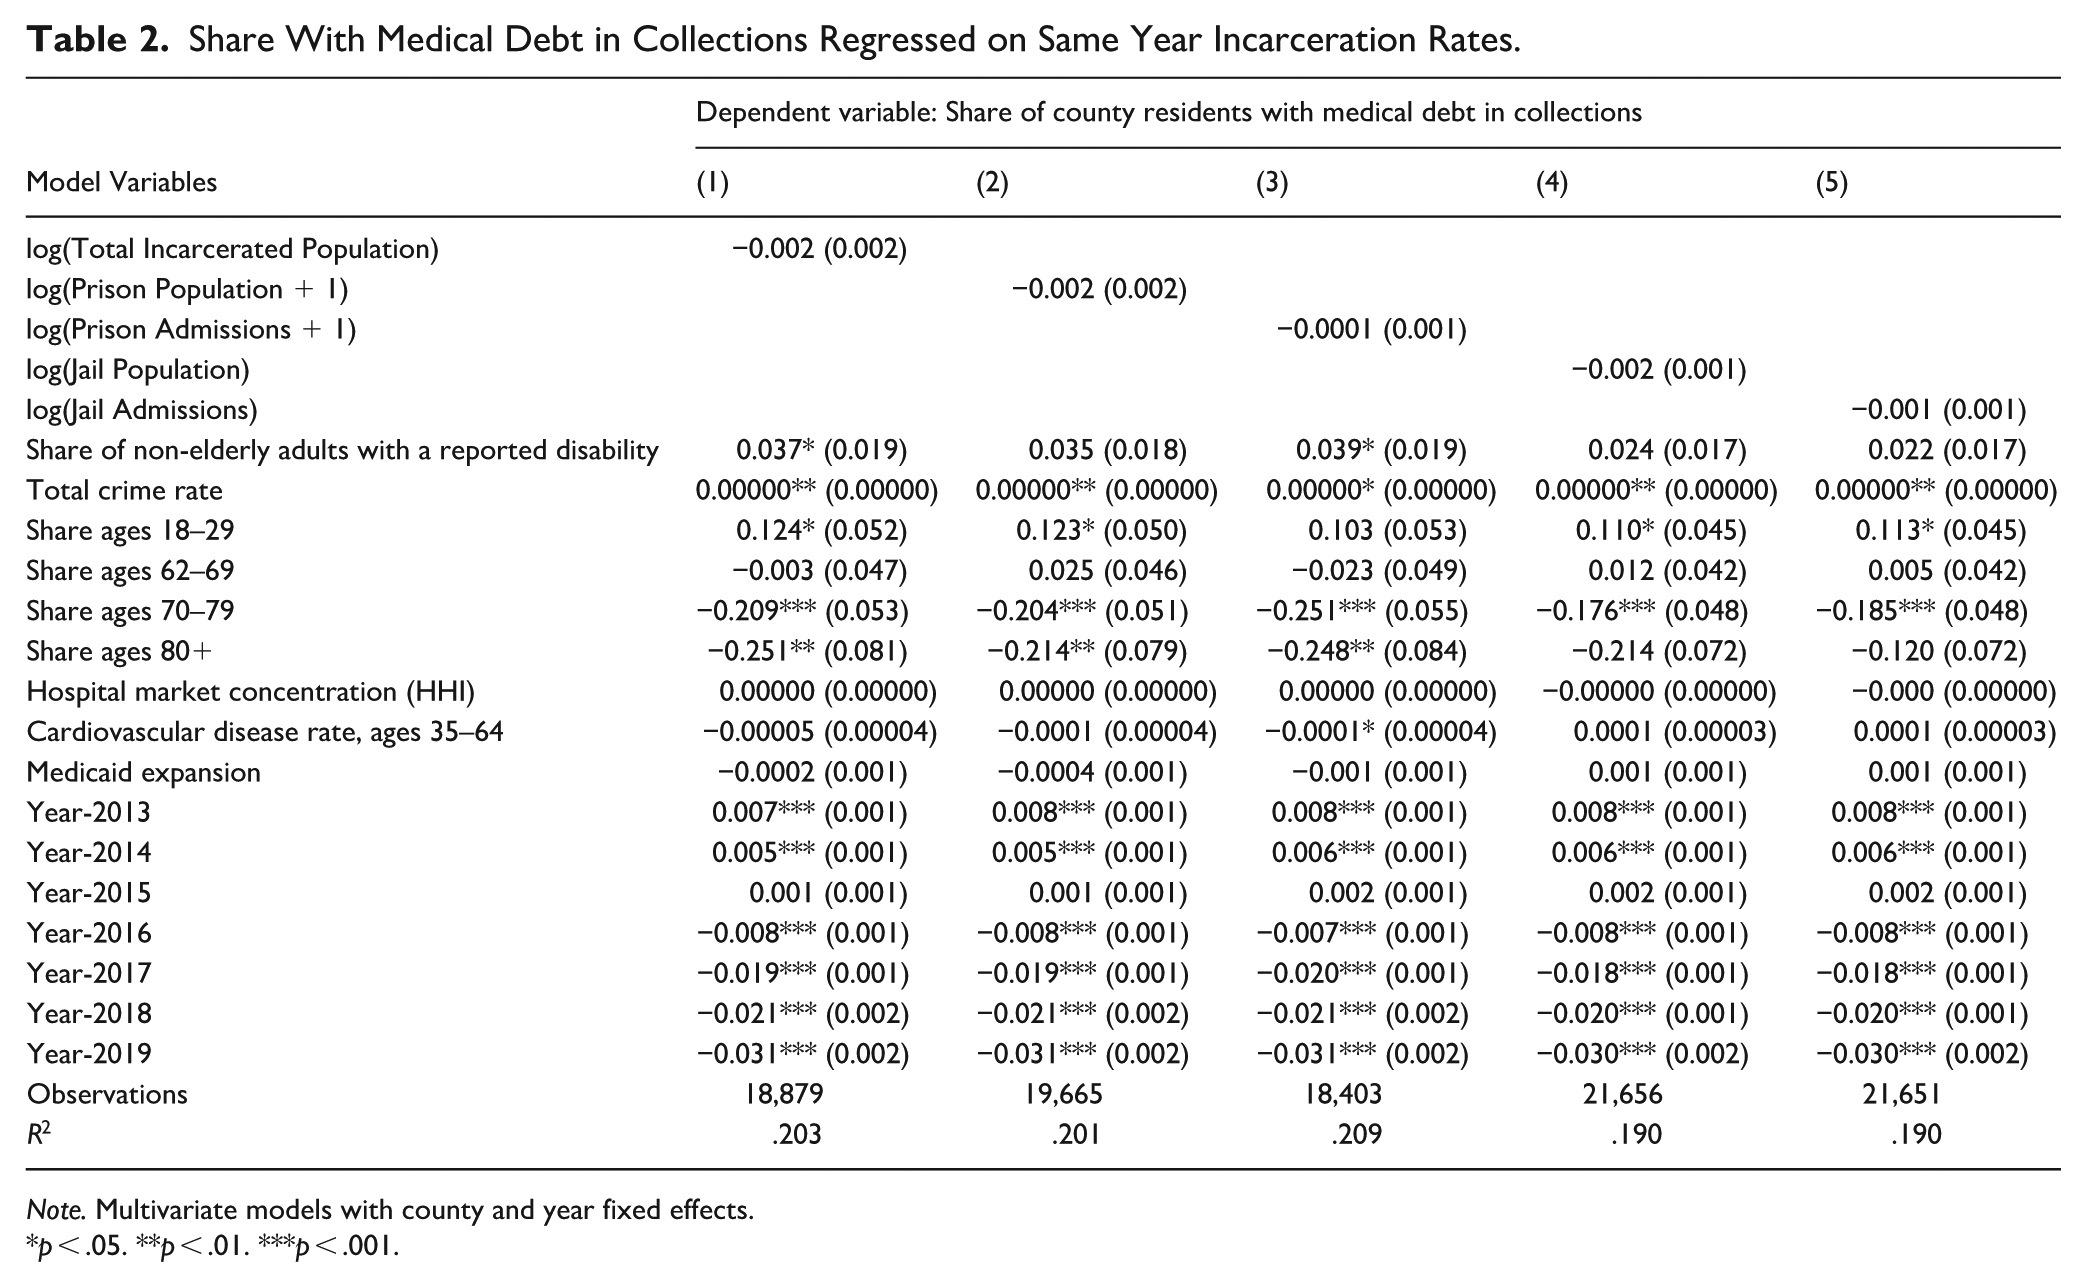
Note. Multivariate models with county and year fixed effects.
*p < .05. **p < .01. ***p < .001.
Median Medical Debt in Collections Regressed on Same Year Incarceration Rates.
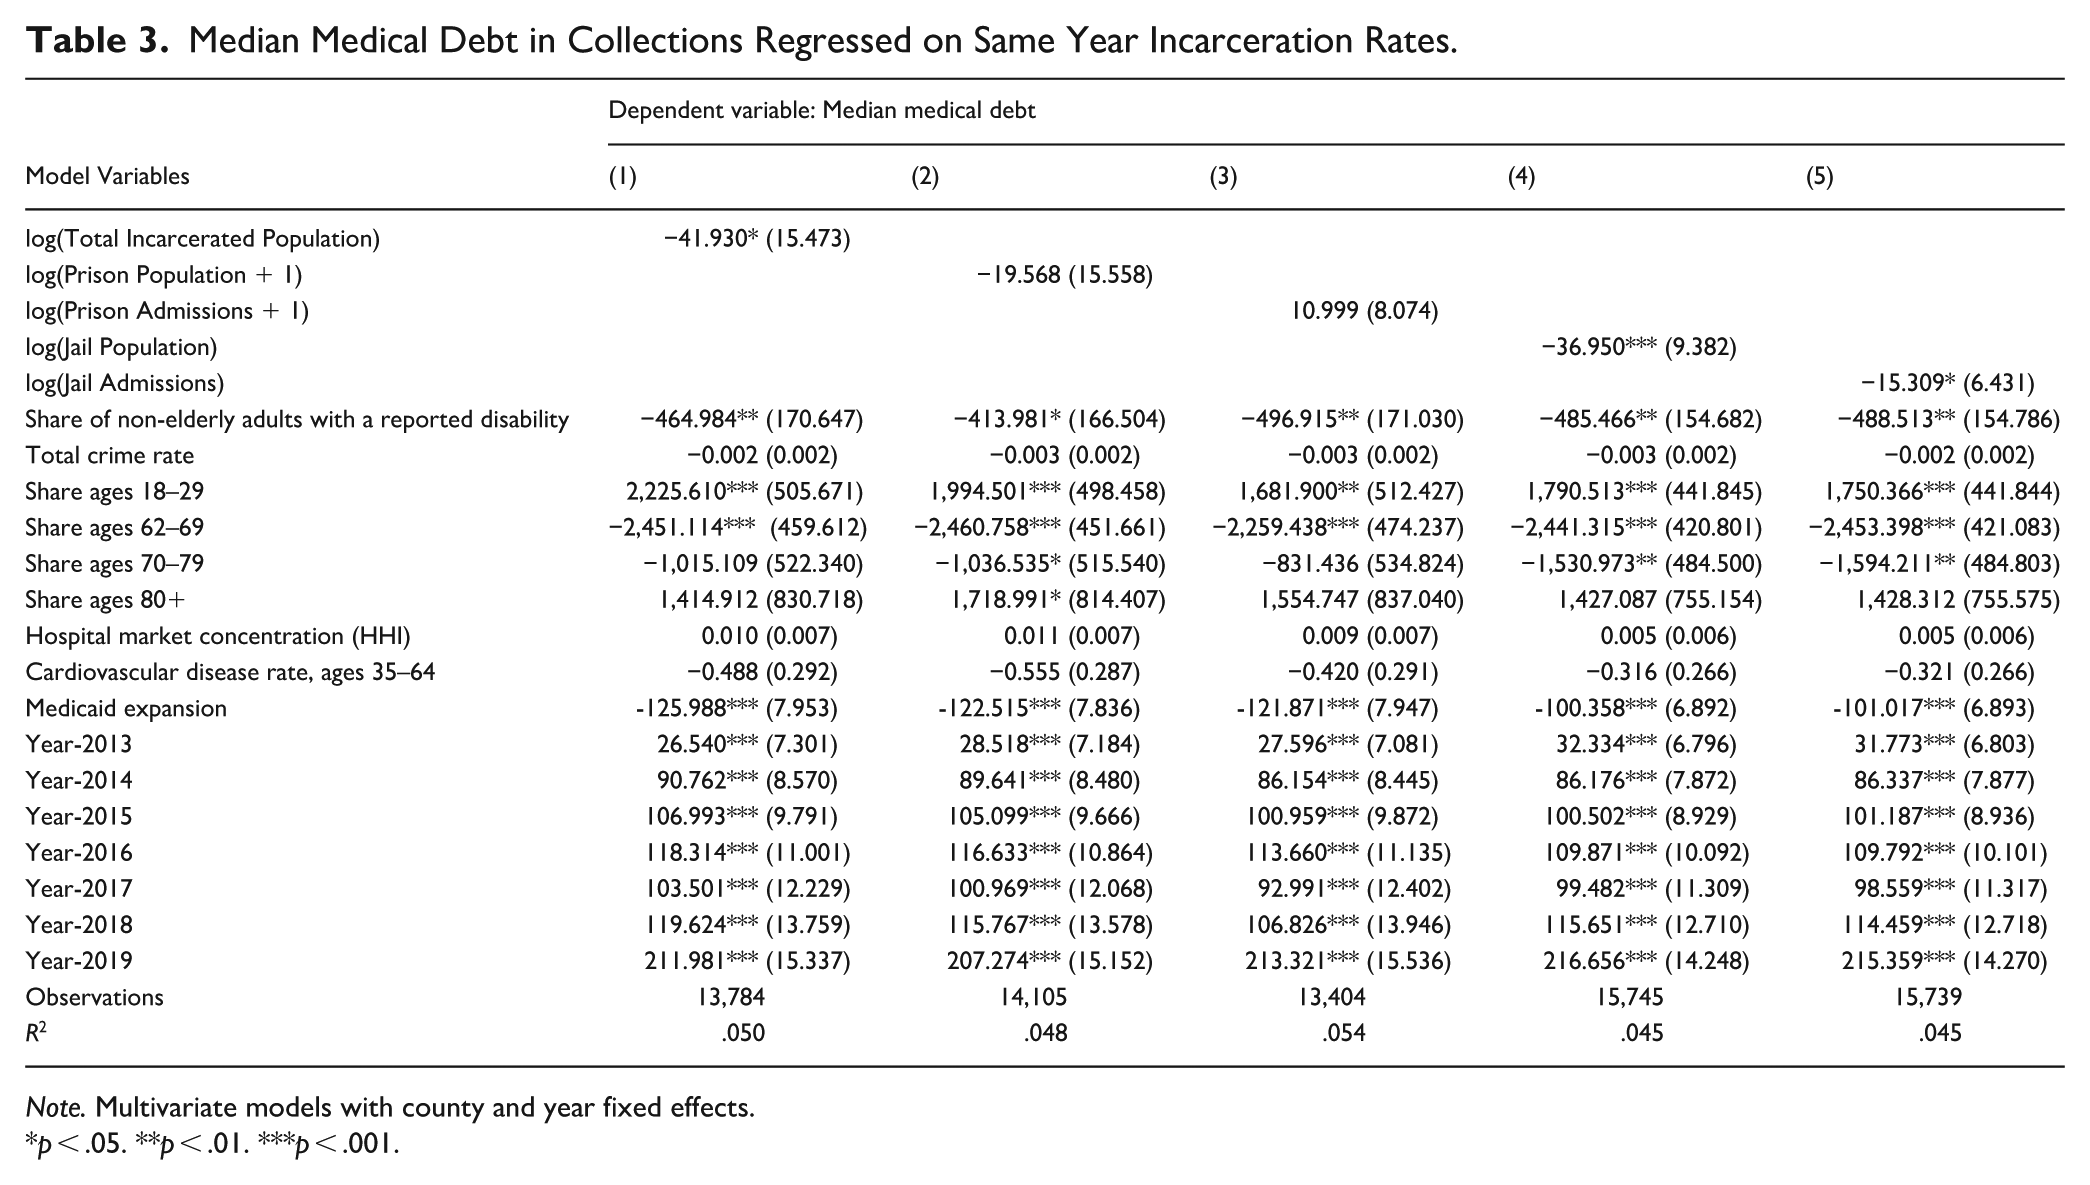
Note. Multivariate models with county and year fixed effects.
*p < .05. **p < .01. ***p < .001.
Table 2 and the equivalent lagged model show mostly null associations between incarceration rates and the share of the adult population with medical debt in collections. In the contemporaneous model, no measures of incarceration were associated with the share of those with medical debt. In the lagged model, jail admission rates are associated with a reduction in the share of individuals with medical debt. Accounting for changing crime rates and changing indicators of health results in similar findings to those identified in bivariate model, suggesting these findings are robust to model specification decisions.
Turning to median medical debt, for Table 3, the total incarcerated population, jail incarceration population, and jail admission rate all show statistically significant negative associations with median medical debt. Contrary to our hypotheses, higher incarceration rates (for both contemporaneous and lagged measures) were associated with lower median medical debt at the county level. For both prison population and prison admission, there is no statistically significant relationship to median medical debt. When examining prior year incarceration rates, we find that only the jail models showed statistical significance. These findings, again, align with those observed in the bivariate models. The consistency of the jail-only findings across the two model variations suggests the reliability of the relationship between jail population rate and median medical debt. The magnitude of these relationships is small, but even modest shifts in medical debt may result in real changes in the economic and health outcomes for county residents with medical debt. The relationship between incarceration appears to be stronger for median medical debt than for the overall share with medical debt. Seeing as the impact on median medical debt is small, this is not surprising. Eliminating medical debt for families would likely require larger reductions in the amount of medical debt. Factors that exerted a larger influence over at least one measure of medical debt are the share of individuals who are uninsured, the share with a disability, the age distribution of the county, and whether in that year, that county was in a state that had expanded Medicaid access.
To test whether this relationship varies by the racial and ethnic composition of the community, we run these models using the measures of median medical debt and share with medical debt specific to majority white communities and majority communities of color. In Table 4 below, we present the findings of these models. For concision’s sake, we present only the coefficients, standard errors, and p-values for the primary independent variables (e.g., measures of incarceration) for same year incarceration measures, but these values are derived using models with the same covariates used in Tables 2 and 3. We provide the full same year and lagged models in Supplemental Appendix C.
Median Medical Debt and Share With Medical Debt Regressed on Current Year Incarceration Rates by Racial and Ethnic Composition of the County.
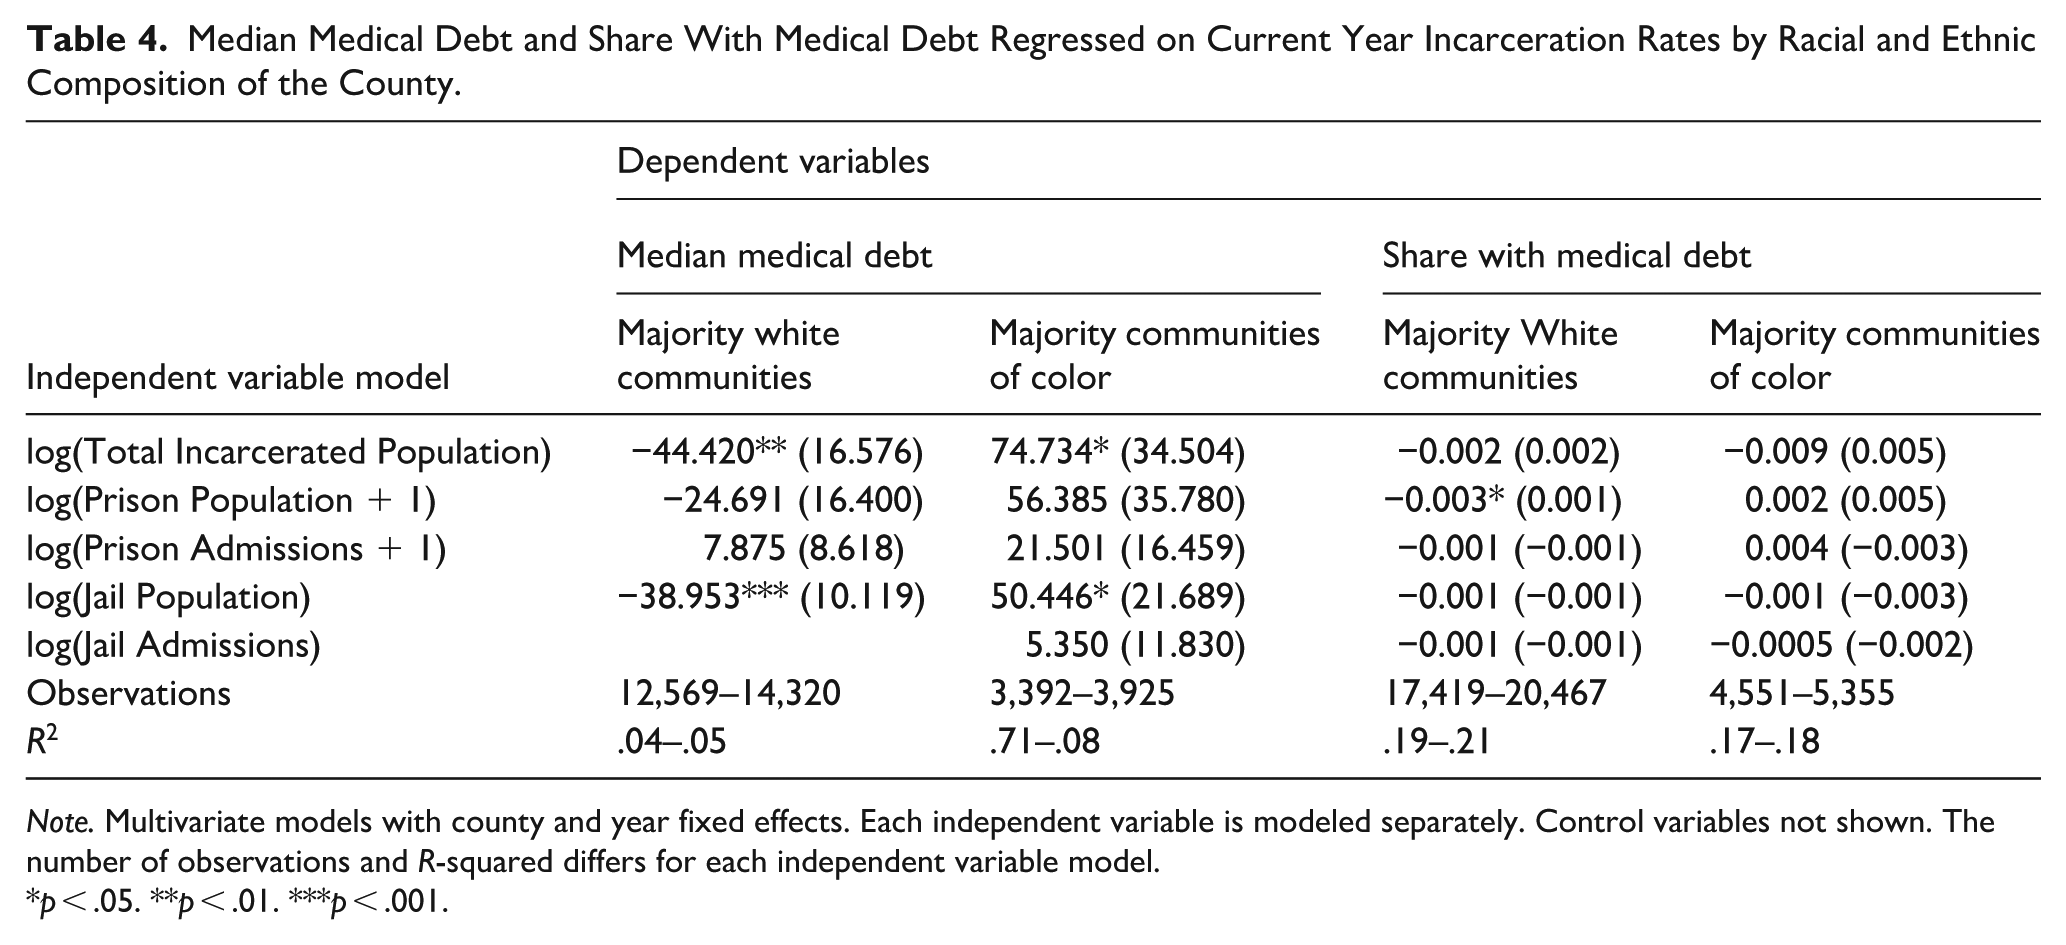
Note. Multivariate models with county and year fixed effects. Each independent variable is modeled separately. Control variables not shown. The number of observations and R-squared differs for each independent variable model.
*p < .05. **p < .01. ***p < .001.
In general, findings suggest notable variation by racial and ethnic composition of a community. While share of medical debt for the same year incarceration measures only varies slightly by racial and ethnic composition (with increases in the prison population associated with decreases for white communities but not communities of color), it varies more notably for prior year incarceration. Specifically, medical debt in white communities declines slightly as all but two measures of incarceration (the jail population and total incarceration) increase, but no such relationship exists in communities of color. For median medical debt, the difference in relationships by racial and ethnic composition is even clearer. For both same year and prior year measures of incarceration, median medical debt in white communities decreases as jail incarceration rises, and for the same year measures, this also holds as total incarceration rises. This relationship does not exist for communities of color, among which there is no relationship with prior year incarceration, although all coefficients are positive. For the same year, rises in the total and jail population correlate with increases in median medical debt.
To understand whether these findings are robust to different specifications, we also tested the relationships between incarceration and medical debt by: (1) splitting the sample into counties above and below the median rate of non-white or Hispanic residents in the initial year of data, (2) running the models as random effects models interacted with this variable, and (3) running the models as fixed effects models interacted with the rate of non-white or Hispanic residents in a county (Supplemental Appendices D and E). In all cases, models supported variation by racial and ethnic composition. While the nature of that variation changed slightly with each specification, the findings generally matched what is presented in Table 4: for white communities, there was often a negative relationship, and for communities of color, there was often a null or positive relationship.
Discussion
In this study, we examined the relationship between incarceration and medical debt and whether that relationship varied by the racial and ethnic composition of a community. We hypothesized that increases in incarceration would lead to increases in debt and that this would vary by the racial and ethnic composition of a community. Our findings were mixed, with some aligning with our hypotheses, while others varied notably from what we predicted. Specifically, while we hypothesized that increases in incarceration would be associated with increases in medical debt, we found the opposite: increases in incarceration are associated in decreases in medical debt. This is true across total incarceration and jail incarceration for both same year and prior year rates, but varies depending on how medical debt is measured – we detected this effect only for median medical debt, not for the share with medical debt. For other measures of debt and incarceration, we found no relationship.
Our findings did, though, confirm our second hypothesis. We found negative and null relationships when examining these relationships in predominantly white communities, but when examining them in predominantly non-white and Hispanic communities, we find either a null relationship between incarceration and medical debt or a positive relationship between incarceration and medical debt, suggesting that this relationship varies by racial and ethnic composition. As communities of color are more often affected by incarceration (Clear, 2007), these findings may represent a more accurate picture of the impact of incarceration on medical debt in a community. In these models, the medical debt measures are focused more closely on communities most likely to be affected by incarceration. They also align with a vast body of research that demonstrates the differing impact of incarceration on communities of color.
Our overall findings run contrary to what most evidence and theory in the field would suggest, namely that incarceration leads to additional economic hardship for those directly affected, their family and friends, and their communities (Clear, 2007;Craigie et al., 2020;Weller et al., 2022). The fact that the story for medical debt runs counter to this may say less about the impact of incarceration on economic hardship and more about the unique nature of medical care and debt in the United States. Access to medical care and to medical insurance in the United States, even after the ACA, is far more limited than in many other countries. Access to healthcare varies notably based on county-level economic indicators, as does incarceration. In the same communities with higher incarceration, access to medical care is more limited (Archibald & Putnam Rankin, 2013; Clear, 2007). While medical care in jails and prisons is often limited and poor, it may still represent a minimal level of access that exceeds what individuals may have received in the community, which may partially explain the negative relationship between incarceration and medical debt. Further, community supervision upon release from incarceration may act as a link to medical resources (e.g., treatment referrals) that individuals would otherwise not receive. The overinvestment in prison and underinvestment in healthcare may have resulted in an unexpected relationship between these two institutions.
Our study explored changing incarceration rates in the 2010s. During this period, many counties with rising incarceration rates were rural counties experiencing rising opioid and methamphetamine reliance (McCoy & Russo, 2018). Those in rural communities face barriers to accessing healthcare due to limited availability within their county or within a reasonable driving distance, but many of those released from prison or jail require immediate healthcare to address these substance dependencies upon their release from incarceration (Archibald & Putnam Rankin, 2013; Calvert et al., 2021; Heggie et al., 2025). Thus, many communities with rising incarceration rates during this time may have experienced unexpected effects from incarceration if it involved medical treatment that was otherwise unavailable or inaccessible in the community, making these findings partially a product of the period over which they were measured. In addition, many counties saw a reduction in incarceration rates during this time. Our models suggest that decreasing incarceration is associated with increasing medical debt. Counties can reduce incarceration through reductions in admissions or increases in releases. When using the latter, this could result in higher medical debt due to the medical needs of those released. The fact that our findings occur for admissions as well as the total population, though, suggests that this is not the full explanation.
It is also possible that incarceration leads to reductions in medical debt due to the ways in which debt is reported. Active credit files may underrepresent records with inactivity lasting several years, including those who have been incarcerated for long periods of time. Yet, this is not likely the full story as findings were most robust for jail incarceration, which is often under a year. Credit bureaus may also exclude medical debts under $500 and less than 12 months old. However, it is unlikely that small amounts of medical debt would drive these findings, and if the reporting period were responsible, similar findings would not occur in the lagged models. Nonetheless, it is possible that these quirks of debt reporting contributed to the underrepresentation of debt held by those who are incarcerated.
But our findings do align with vast evidence around the racially and ethnically disparate impact of the criminal legal system. While the overall trend and trend for white communities indicated an unexpected reduction in medical debt as incarceration rises, communities of color experienced the hypothesized effect, with rises in incarceration linked to rises in medical debt. This may point to differences in financial vulnerability and access to resources across white and non-white or Hispanic communities, which shape how incarceration through prison, jail, and community supervision affects economic outcomes. These differences are consistent with prior research showing that communities of color have fewer financial resources and are more vulnerable to unanticipated changes in income, which may amplify the financial consequences of incarceration and increase the likelihood of accumulating medical debt (Bhutta et al., 2020; Ganong et al., 2020). Indeed, research has highlighted the qualitatively different experiences on community supervision for non-white or Hispanic and white supervisees (Jannetta et al., 2014; Steinmetz & Anderson, 2016; Steinmetz & Henderson, 2015), as well as the racialized use of treatment and programming within a carceral setting (C. N. Anderson et al., 2022; Kerrison, 2017). In short, racial disparities in access to family assistance and reentry resources following incarceration may contribute to unequal outcomes, with individuals from communities of color facing greater structural barriers to support (Bounoua et al., 2023;Puglisi et al., 2017).
Our findings suggest that when assessing the impact of incarceration, it is important to consider community-based alternatives. In most cases, incarceration causes harm, but in cases where incarceration provides a service that is unavailable or inaccessible in the community, it may actually lead to unexpected benefits. Because access to community-based resources may vary by racial or ethnic composition of a community, being attuned to such variation allows one to capture possible heterogeneity in these relationships. There exists an analogy on nutritional access: while jails and prisons are required to provide meals for all incarcerated individuals, they are not an appropriate alternative to improving access to Supplemental Nutrition Assistance Program (SNAP) or reducing the prevalence of food deserts. The same is true for medical insurance and easy access to primary care facilities, hospitals, and treatment centers. These findings highlight the woeful state of healthcare in the United States and the inability of the system to better reach those who need it in a way that is effective, affordable, and doesn’t rely on being incarcerated.
Study Limitations and Future Research
A few limitations of the current study and their implication for future work are worth mentioning. First, we are limited by missing data in some counties across both dependent and independent variables. Nonetheless, these data represent some of the most complete data on these topics, and this issue cannot be addressed with any currently available public data. For the crime control variable, some agencies do not report data for all 12 months. It is unlikely that this missingness affected our findings, as this issue was rare, with about 96% of agencies reporting data for all 12 months, and among the agencies that are core cities, 99% reporting all 12 months.
Similarly, we are limited by a relatively short time series (8 years). An ideal study would involve a time series spanning decades. During the study’s timeframe, incarceration rates were relatively steady (Mueller, 2024). We do not capture the massive rise in incarceration that occurred in the decades prior, nor do we observe the incredible decrease in incarceration that occurred because of the COVID-19 pandemic (Carson et al., 2022; Clear, 2007).
Finally, while fixed effects models allow us to account for unobserved stable factors and many observed changing factors associated with a county, they do not allow us to make causal statements about the relationship between incarceration and medical debt. Future research that takes advantage of exogenous changes to incarceration (e.g., California realignment) should study medical debt to determine if the relationships observed in this paper are causal.
Footnotes
Funding
The authors received no financial support for the research, authorship, and/or publication of this article.
Declaration of Conflicting Interests
The authors declared no potential conflicts of interest with respect to the research, authorship, and/or publication of this article.