
Abstract
Rapid guessing (RG) is a form of non-effortful responding that is characterized by short response latencies. This construct-irrelevant behavior has been shown in previous research to bias inferences concerning measurement properties and scores. To mitigate these deleterious effects, a number of response time threshold scoring procedures have been proposed, which recode RG responses (e.g., treat them as incorrect or missing, or impute probable values) and then estimate parameters for the recoded dataset using a unidimensional or multidimensional IRT model. To date, there have been limited attempts to compare these methods under the possibility that RG may be misclassified in practice. To address this shortcoming, the present simulation study compared item and ability parameter recovery for four scoring procedures by manipulating sample size, the linear relationship between RG propensity and ability, the percentage of RG responses, and the type and rate of RG misclassifications. Results demonstrated two general trends. First, across all conditions, treating RG responses as incorrect produced the largest degree of combined systematic and random error (larger than ignoring RG). Second, the remaining scoring approaches generally provided equal accuracy in parameter recovery when RG was perfectly identified; however, the multidimensional IRT approach was susceptible to increased error as misclassification rates grew. Overall, the findings suggest that recoding RG as missing and employing a unidimensional IRT model is a promising approach.
When examinees quickly respond to an item randomly with intentional disregard for the item content and without employing their full effort (broadly defined as rapid responding), psychometrically distortive information is introduced into item and ability parameter estimation (e.g., Rios & Soland, 2021a; Wise, 2017). 1 Such information can lead to inaccurate inferences of assessed traits or knowledge, skills, and/or abilities (KSAs), given the misfit between a response pattern and a selected measurement model which assumes that each response is reflective of the intended construct(s) (e.g., common item response theory [IRT] models, such as the three-parameter logistic [3PL] model; Rios & Soland, 2021b). Although rapid responding has been documented in surveys and questionnaires (e.g., Meade & Craig, 2012), the present article focuses on this behavior in cognitive multiple-choice assessments. To highlight this emphasis, we hereon refer to rapid responding as rapid guessing (RG), given the presence of keyed response options in cognitive tests.
To mitigate the deleterious effects associated with this construct-irrelevant behavior, researchers have proposed identifying and accounting for RG in parameter estimation (e.g., Nagy & Ulitzsch, 2021; Wise & DeMars, 2006). The effectiveness of these approaches in reducing bias in ability estimates presumes that RG can be correctly identified. However, the tenability of this assumption is often unknown in operational settings given that indirect indicators (e.g., response pattern and/or log file information) of cognitive operations are utilized as proxies of test-taking behavior (Rios, 2021). This article investigates the recovery of item and ability parameter estimates for four response time threshold scoring procedures when the presumption of accurate behavior classifications is both tenable and untenable. The sections that follow describe proxies of RG, scoring approaches for handling RG, prior research examining parameter estimation accuracy under RG misclassifications, and the rationale for the current study.
Classifying RG
Response times are the most commonly utilized proxy of RG on large-scale formative (e.g., the Measure of Academic Progress; see Wise & Kuhfeld, 2021) and international operational assessments (e.g., Program for the International Assessment of Adult Competencies; see Goldhammer et al., 2016). When using this proxy, a number of assumptions are made. First, response times are presumed to monotonically increase based on examinee effort and, thus, differ between examinees engaging in solution (SB; i.e., examines actively seek to identify an item’s correct response; Kong et al., 2007) and RG behavior. Second, it is assumed that the accuracy rates of RG responses are much lower than those of solution-based responses, which has been supported in prior research (Wise, 2017). Third, given that RG is unreflective of the assessed KSAs, such responses are assumed to provide minimal to no utility in parameter estimation (Liu & Hau, 2020).
Based on these assumptions, researchers are tasked with leveraging response time information to differentiate between SB and RG behavior. To this end, two general classification approaches have been adopted based on the use of probabilities or response time thresholds. The former approach assumes that there is a dichotomous within-individual latent class variable that represents response engagement for each examinee-by-item interaction. Given that this engagement variable is unobservable, a probabilistic model is utilized to estimate the likelihood that an item response for an examinee reflects RG (see Nagy & Ulitzsch, 2021). A strength of this general approach is that some models allow for overlapping response time distributions between SB and RG; however, this requires a number of strong distributional assumptions. These assumptions include constant solution behavior pacing and equal response time means and variances for RG responses across all items (Ulitzsch et al., 2020). A number of studies have raised concerns about the tenability of these assumptions in operational settings, which, if not met, likely may lead to parameter estimate bias (Bolsinova et al., 2017; Meng et al., 2015).
In contrast, the second approach establishes a response time threshold that distinguishes between RG and SB response time distributions based on the assumption that these two behaviors are represented by distinct, non-overlapping distributions. Establishing these thresholds can be accomplished by using heuristic rules (e.g., response time percentiles), inspecting response time distributions, and combining response time and accuracy information (see Rios & Deng, 2021). When choosing a threshold, efforts are made to minimize incorrect classifications by balancing the rates of false-positive (i.e., overclassification of RG) and false-negative (i.e., underclassification of RG) errors present. 2 However, striking this balance is difficult for two reasons.
First, it is presumed that there are distinctive response time distributions for solution and RG behavior. If there are overlapping distributions, RG misclassifications and ultimately parameter estimate bias will result (Rios, 2021; Wise, 2017). 3 Second, establishing a threshold is further complicated by the fact that researchers can never truly know whether an examinee is engaging in full or partial effortful responding. Thus, there is little agreement on the best threshold to employ in establishing RG, which can lead to large differences in both the number of RG responders and the responses identified (Rios & Deng, 2021). Given these limitations, it is likely that RG is misclassified in practice. With that noted, the establishment of response time thresholds is still the most popular approach to classifying RG in the literature and operational settings (Rios & Deng, 2021; Silm et al., 2020; Wise & Kuhfeld, 2021). The current study focuses primarily on response time threshold procedures due to their popularity in applied research, capability of being estimated in readily available open-source and commercially available software, and propensity for model convergence in the presence of small RG proportions (Rios & Soland, 2021a).
Response Time Threshold Scoring Approaches to Handling RG
Upon classifying RG for each examinee-by-item interaction using a response time threshold, researchers are next tasked with deciding how to modify RG responses prior to estimating parameters. To date, five unique response time threshold approaches have been proposed that rely on unidimensional or multidimensional IRT. 4 Unidimensional approaches include penalized (PN; Wright, 2016), effort-moderated (EM; Wise & DeMars, 2006), and EM-imputation (EM-I; Hauser & Kingsbury, 2009) scoring, while the multidimensional methods are characterized by modifications to the Holman and Glas (HG; 2005; see Liu et al., 2019) and Mislevy and Wu (MW; 1996; see Deribo et al., 2021) models (Table 1).
Comparative Breakdown of Response Time Threshold Scoring Approaches
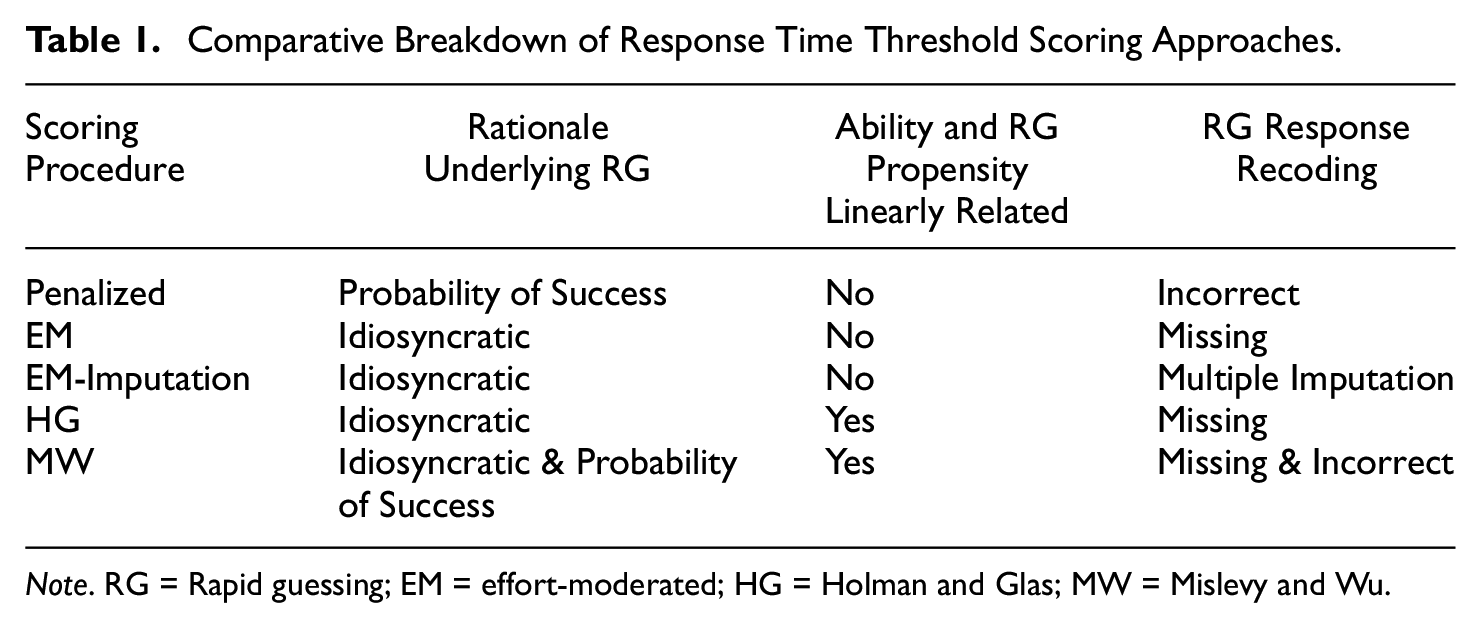
Note. RG = Rapid guessing; EM = effort-moderated; HG = Holman and Glas; MW = Mislevy and Wu.
PN scoring presumes that RG is driven by an examinee engaging in strategic guessing due to an accurate perception that they possess a probability of successfully answering an item that is below chance. Given this assumption, RG is recoded as incorrect. However, if an examinee employs RG on an item in which they have the requisite KSAs to obtain a correct response, this scoring approach will likely be associated with negative bias in ability estimation—a situation that may occur when examinees hold low task value (Wise, 2017). Furthermore, Rose (2013) noted that incorrect scoring, if assumptions are untenable, can lead to local stochastic dependence and measurement noninvariance, which violates the underlying model assumptions of IRT.
In contrast, EM scoring assumes that all RG responses are psychometrically uninformative, which leads such responses to be recoded as missing prior to estimating parameter estimates for the remaining data using full information likelihood estimation. Unlike the PN approach, EM scoring allows for idiosyncratic RG (i.e., not all examinees possess the same motives for RG); however, in doing so, this approach presumes that RG occurs completely at random (i.e., RG is independent of manifest item responses, examinees latent proficiency, and covariates in the model; see Deribo et al., 2021). If this assumption is violated, prior simulation research suggests that parameter estimates will be biased (Rios & Soland, 2021a). An additional issue with EM scoring is that it may be associated with large standard errors of ability estimates, particularly as the rate of RG increases, given the reduced psychometric information available based on the imposed missingness (Rios & Soland, 2021b). With that noted, the smaller standard errors associated with ignoring RG may be misleading as they are likely based on biased ability estimates.
To mitigate the potential for large random variation in ability estimates for the EM approach, EM-I scoring (a) calculates a probability of correct for each RG response based on a user-defined IRT model by treating the parameter estimates obtained from EM scoring as known; (b) converts the obtained probabilities to item responses by comparing each probability to a random number; (c) re-estimates the ability parameters with the imputed item responses; (d) repeats steps b and c numerous times to mitigate sampling error; and (e) treats the average estimate across replications as an examinee’s final ability estimate. Although this approach can reduce random error, its accuracy is largely driven by the initial ability estimate obtained from EM scoring, and thus, it possesses the same assumption that RG occurs at random. If violated, the biased ability estimate will be associated with inaccurate imputed values.
Each of the scoring procedures noted earlier fails to account for the possibility that an examinee’s propensity to engage in RG may be related to the construct(s) assessed. This relationship has been noted across a number of contexts in which a negative association between ability and RG behavior was observed (e.g., Deribo et al., 2021). Building off prior work related to non-ignorable missing data (Holman & Glas, 2005), Liu et al. (2019) proposed a two-factor correlated-traits model that explicitly considers the association between RG propensity and ability, which we refer to as HG scoring. In this model, RG propensity is modeled utilizing an effortful response matrix that is comprised of a dichotomous indicator (SB vs. RG) for each examinee-by-item interaction, allowing for interindividual differences in RG independent of examinee ability. Similar to EM and EM-I scoring, RG responses in the item response matrix are coded as missing. The recoded item response matrix and effortful response indicator matrix are then applied to simultaneously estimate ability and RG propensity by employing a user-defined unidimensional IRT measurement model for each latent construct. In this approach, the modeled correlation between latent variables assumes that ability and RG propensity are linearly associated. However, such an assumption may be untenable when covariates (e.g., item content) account for differential RG among examinees with the same ability level, which if violated could produce biased model parameter estimates.
HG scoring accounts for the possibility that RG may be related to examinee ability; however, it does not consider that item characteristics could be associated with RG. To account for this limitation, the MW scoring approach proposed by Deribo et al. (2021) extends the HG model by incorporating both an examinee’s RG propensity and what the authors call a sensitivity parameter into ability estimation. The sensitivity parameter can be understood as the effect of an expected response probability (estimated based on an examinee’s ability and an item’s difficulty) on employing RG for a given item. As this parameter approaches zero, an expected response probability possesses a decreasing effect on RG. In fact, MW and HG scoring are identical when the sensitivity parameter equals zero, as RG propensity is the main driving force guiding RG, and thus, RG responses are assumed to be ignorable (similar to EM, EM-I, and HG scoring). However, as the sensitivity parameter increases toward positive infinity, an examinee’s expected response probability exceedingly influences the likelihood that they engage in RG. Within this conceptualization, it is surmised that if an examinee knows the correct item response, the probability of engaging in RG approaches zero, while increasing when the examinee does not know the correct response. Given this assumption, RG is thought to reflect a strategic guess in which an examinee is likely to answer an item incorrectly given their true level of ability; thus allowing for RG responses to be treated as if they would have been scored incorrectly (similar to PN scoring) for positive values of the sensitivity parameter. Akin to HG scoring, the MW approach supposes a linear association between ability and RG propensity, which if untenable, may result in biased parameter estimates.
Comparative Evaluations of Response Time Threshold Scoring Approaches
To date, there have been minimal comparative evaluations of response time threshold scoring approaches. One reason for this is that most of the available literature has compared a given scoring approach to traditional IRT models and has generally found improvements in parameter recovery and higher convergent validity evidence (e.g., Rios et al., 2017; Rios & Soland, 2021a, 2021b; Wise & Kuhfeld, 2021; Wise & DeMars, 2006). Furthermore, given that current scoring approaches operate under different assumptions, researchers are challenged with developing simulation studies that include multiple data-generating patterns of RG to fairly contrast their effectiveness. However, a few exceptions to this trend exist and can be categorized based on applied and simulated analyses.
One of the first comparative studies was conducted by Hauser and Kingsbury (2009). In their study, EM and EM-I scoring were compared to better understand how the loss of information from RG impacts an individual’s ability estimate standard errors. To address this objective, data were examined from two item-level adaptive assessments in math and science that were administered to 69,000 students in primary and secondary schools. Overall, they found that when compared to EM-I scoring, the EM approach produced standard errors that were more than 10 times larger; however, the authors concluded that as the individual percentage of RG responses becomes large (> 20%), the benefits of EM-I dissipates.
A more comprehensive applied study was conducted by Deribo et al. (2021) in which ability estimates were compared across PN, EM, HG, and MW scoring procedures. Data were analyzed for two assessments, a 25 multiple-choice item test assessing information and communication technology literacy, and a 12-item dichotomously scored matrix test of figural reasoning. The sample was comprised of 4,960 German students enrolled in a state-accredited higher education institution. Both model fit and ability estimate associations via linear correlations on the complete sample were compared across procedures. Overall, the authors found that for both assessments the Bayesian Information Criterion (BIC), which penalizes potential model overfit, was lowest for the MW procedure followed in order by HG, EM, and PN scoring. One likely reason that the MW and HG approaches both possessed the smallest BIC values was that ability and RG propensity were found to be strongly negatively correlated, thus benefiting from multidimensional modeling.
In terms of ability estimate similarity, Expected A Posteriori estimates obtained from MW scoring showed a strong correlation with those obtained from HG (r≈ 1) and PN (r = .99), while slight differences were found for the EM approach (r = .94 or .96 depending on the assessment). The minimal variation in ability estimates noted between the MW and HG procedures can be explained based on the mean sensitivity parameter estimate of the MW model being close to zero (.58 or 1.24 depending on the assessment). This finding suggests that examinees’ employment of RG was negligibly influenced by their expected response probability and instead was due to other potential reasons, such as low task value. Furthermore, given that the MW model rescores RG responses as incorrect for high values of the sensitivity parameter, as was the case in the applied datasets, ability estimates were practically the same to the PN procedure. Finally, the differences noted between MW and EM scoring can likely be explained due to the presence of nonignorable RG (as indicated by the strong correlation between ability and RG), which is assumed by the latter approach. However, it is important to note that the use of the complete sample could potentially bury differences that could be observed when focusing on a specific subgroup (e.g., unmotivated individuals who engaged in RG behavior). The combined findings suggest that in contexts analyzed, RG is influenced by both examinees’ latent RG propensity, which is considered by HG and MW approach, and their true probability to answer the item correct, which is considered by PN and MW approach. As a result, the more complex MW model did not yield significantly different ability estimates when compared with the HG and PN scoring methods. This limited added value of MW approach is likely due to the fact that both RG propensity and true correct probability are related to the same underlying factor of test-takers’ latent proficiency. Furthermore, when the ignorability assumption was untenable, the EM approach possessed ability estimates that were most different to all other methods.
To date, the only simulation study to compare response time threshold scoring procedures was conducted by Liu et al. (2019). In their study, the HG and EM approaches were compared in terms of systematic bias and root mean square error on item and ability parameter estimates (given the ease of interpretation, our review focuses on bias). Three factors were manipulated, which included the proportion of non-effortful simulees, the percentage of RG responses per non-effortful simulee (dictated by test difficulty), and the correlation between ability and RG propensity. Concerning the latter, three correlations were manipulated, 0, .4, and .8, with the former representing a situation in which RG occurred completely at random and the latter two levels reflecting scenarios where RG was progressively driven by item difficulty.
Across conditions, differences between the two scoring approaches in item discrimination and difficulty estimate bias ranged from 0.000 to 0.002. In terms of ability parameter recovery, two trends were noted. First, HG scoring possessed average bias that was less than 0.01 logits for all examined scenarios. Second, slightly larger bias was observed for EM scoring, with increased underestimation (or negative bias) of ability found as the percentage of RG responses and the latent correlation between ability and RG propensity grew; however, the average bias did not exceed
This review of the literature provides three main conclusions. First, as noted, there have been limited comparative studies of response time threshold scoring procedures to date. Second, two of the three current studies relied on applied data, which not only limits the generalizability of findings beyond the investigated assessment contexts but also raises internal validity concerns related to the accuracy of results given the potential for incorrect RG classifications. Third, only one study leveraged simulation methods to investigate the comparability of parameter estimates across scoring methods; however, this evaluation was limited to only two approaches and it presumed accurate RG identification, the tenability of which is unknowable in operational contexts.
Prior Research Examining the Robustness of Scoring Approaches to RG Misclassifications
Although the reviewed response time threshold scoring procedures differ in their underlying assumptions, recoding processes, and modeling approaches, they all have one thing in common, which is the presumption that RG is identified with complete accuracy. Yet, given the potential for overlapping response time distributions between SB and RG as well as the inability to have complete assurance that observed response times can lead to accurate inferences of examinee behavior, it is vital to consider how RG scoring approaches perform when accurate classification is untenable. In light of this importance, only one study to date has evaluated parameter estimation accuracy of scoring approaches under RG misclassifications.
Rios (2021) investigated the effect of misclassifications on item and ability parameter estimates for EM scoring compared with a naive 3PL model that did not account for RG. Two RG misclassification factors were manipulated, which included type (underclassification vs. overclassification) and rate (10%, 30%, and 50%). Overall, Rios found that as the rate of RG misclassifications grew, bias in item and ability parameter estimates increased for EM scoring, particularly when RG was underclassified (i.e., failing to identify true RG responses); however, the degree of bias was generally smaller than that observed for the naive 3PL model. In contrast, when incorrectly classifying fast SB responses from high ability simulees as RG, the degree of parameter estimate bias was negligible. The findings from this study suggest two implications for applied researchers. First, it may be preferable to imperfectly classify RG than to ignore its presence. Second, employing liberal response time thresholds that can capture all true RG responses, while overclassifying fast effortful responses from high ability examinees, is likely better than establishing conservative thresholds that underidentify true RG responses.
Although the work conducted by Rios (2021) provides a basis for understanding the utility of an RG scoring approach under realistic conditions of misclassified non-effortful behavior, it only evaluated the EM scoring approach, which is limited to applying a unidimensional model to estimate ability after rescoring RG responses as missing. Thus, it is unclear if other response time threshold scoring procedures are more robust to RG misclassifications, given differences in rescoring and modeling approaches. Of particular interest is the performance of multidimensional scoring methods that may be susceptible to RG misclassifications based on the inclusion of a parameter that accounts for the relationship between ability and RG propensity. In regard to this relationship, Deribo et al. (2021) hypothesize that false-negative classifications of RG behavior may enlarge a negative correlation or underestimate a positive correlation between these two latent variables, while false positives may be associated with greater error in this parameter estimate; however, these hypotheses have not been formally evaluated. Therefore, there is still much to learn about the comparative utility of response time threshold scoring procedures both when assuming perfect RG classification and when such an assumption is untenable.
Study Objectives
The objective of the present study is to compare item and ability parameter estimate bias and mean absolute error (MAE) for four response time threshold scoring methods: PN, EM, EM-I, and HG scoring. MW scoring is excluded from the present study, given that it is an extension of HG scoring and has been shown to produce nearly identical ability parameter estimates across multiple applied datasets (r = .997; see Deribo et al., 2021). Given this assessment context, it is important to consider how examinees’ partial knowledge plays a role in the problem-solving process when presented with a finite number of response options by estimating ability using a multi-parameter model (e.g., the three-parameter logistic model; for a discussion, see Han, 2012). With this exclusion noted, the four remaining response time threshold scoring procedures are compared via a simulation design in which sample size, RG characteristics (percentage and the correlation between ability and RG propensity), and classification accuracy (whether RG is classified with complete accuracy or misclassified, and if the latter, the rate of misclassifications) are manipulated. The study objective is addressed via the following two research questions:
Findings from this analysis have the potential to inform practitioners about the comparative effectiveness of available response time threshold scoring methods in producing robust parameter estimates in the presence of RG misclassifications.
Method
Data Generation
Data were generated using a three-step process. First, effortful response and RG propensity probabilities were calculated for a 50-item multiple-choice linear test, which is a test length that falls within the range commonly observed in low-stakes assessment contexts (e.g., Ulitzsch et al., 2021). To investigate the performance of the response time threshold scoring procedures under varying sample sizes, the number of simulees included was either 500 or 2,500. The former level reflects a small sample context in which the stability of parameter estimates may be a concern, while the latter represents a sample size observed in large-scale assessments (e.g., National Assessment of Educational Progress). Second, to reflect that RG is largely reflective of random responding (Wise & DeMars, 2006), RG was simulated in the data by substituting a proportion of effortful probabilities with chance likelihoods (.25; assuming four response options per item). This process was completed by manipulating RG responses in the data matrix for a disengaged subsample of simulees (hereon referred to as the RG or unmotivated subsample), which comprised 28% of the total sample—an average observed across numerous low-stakes assessment contexts (Rios et al., 2022). Upon creating an item response matrix, the third step consisted of producing a RG classification matrix in which errors were imputed prior to parameter estimation. This data generation process, along with the factors manipulated in the simulation study, are described in greater detail below.
Generation of Effortful Response and RG Propensity Probabilities
To account for the relationship between ability and RG propensity, a two-dimensional correlated-traits simple structure model was used to generate effortful response and RG propensity probabilities. To do so, both ability and RG propensity parameters were sampled from a multivariate normal distribution:

where
Three covariance values were included for the RG subsample to reflect varying degrees of interrelatedness between the latent variables: −0.1, −0.5, and −0.9. Across all three levels, the direction of the relationship was stipulated to be negative, which follows prior research suggesting that ability is inversely related to RG propensity (Deribo et al., 2021). In terms of the strength of the covariance, the lowest level (−0.1) was included to investigate a scenario in which there is largely no linear relationship between the two latent variables, an assumption held by the unidimensional response time threshold scoring procedures (PN, EM, and EM-I). From a theoretical standpoint, this condition may reflect RG due to low task value in which any examinee, regardless of ability level, can engage in this form of non-effortful responding. The latter condition (−0.9) mirrors a scenario where RG is strongly associated with ability. Such a scenario may arise when examinees engage in RG due to a low perceived probability of success. Finally, the −0.5 condition was included to provide a moderate strength of association found between latent ability and RG propensity in the applied analysis of Liu et al. (2019). Across conditions, the covariance was constrained to zero for the non-RG or motivated subsample, given that they did not employ RG.
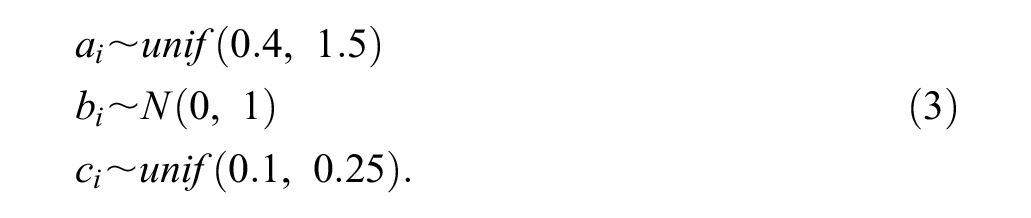
Upon obtaining person parameters, effortful response and RG propensity probabilities were generated separately. Specifically, effortful response probabilities were produced using a unidimensional three-parameter logistic model:
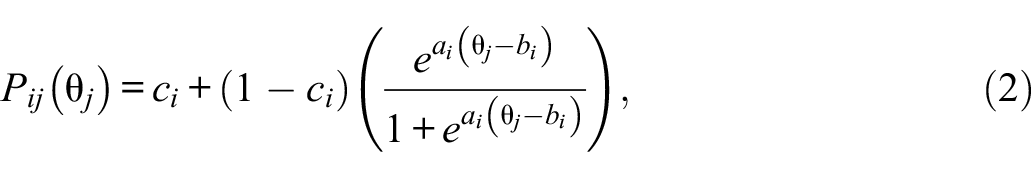
where
Similar to Liu et al. (2019), the RG propensity probabilities were generated based on the Rasch model:
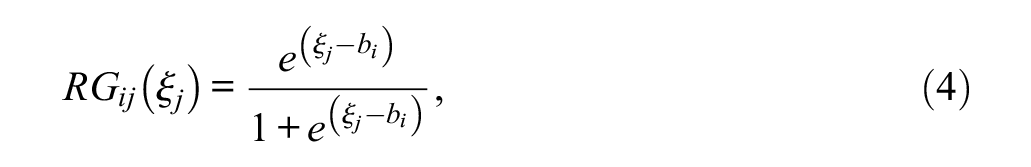
where
Replacement of RG Response Probabilities
As prior research has shown that examinees can employ varying degrees of effortful behavior across a test administration (Wise & Kingsbury, 2016), the number of RG responses for each unmotivated simulee varied from 2% to 50% of the test based on sampling from a random multinomial distribution. Although unmotivated simulees could vary in their number of RG responses, the total percentage of RG responses across all disengaged simulees was manipulated to be equal to either 10% or 20% of all item responses. The former level is reflective of the average percentage of RG responses detected in a recent meta-analysis of low-stakes assessments (Rios et al., 2022), while the latter is an upper-end percentage seen in previously applied analyses (e.g., Goldhammer et al., 2016). Upon identifying the number of RG responses for each unmotivated simulee, RG was imputed by replacing the true response probability with the chance level (.25) for the items with the highest RG propensity probabilities; all remaining items were treated as true SB in the RG classification matrix.
Upon generating response and RG probabilities, the final step of data generation entailed converting the response probabilities to item responses. This involved comparing
Creation of RG Misclassifications
The next step consisted of creating an RG classification matrix for each simulee by item interaction, which was used to recode item responses prior to ability estimation. The creation of this matrix was based on two factors, misclassification type and percentage. In terms of the former factor, there were three misclassification types simulated: no misclassifications, underclassifications, and overclassifications. 5 The first type allowed for an evaluation of parameter recovery under perfect RG identification, while the latter two reflected misidentifications. Further details of these latter conditions are provided below.
Similar to Rios (2021), when RG was misidentified, responses were generated to either be underclassified or be overclassified. The former type reflects the tendency of practitioners to employ conservative proxies of RG that may underclassify non-effortful responding (see Rios & Deng, 2021). In this condition, known RG responses were randomly treated as SB for each disengaged simulee, presuming no false positives in the RG matrix. The rate of misclassifications in the sample reflected small (20%), moderate (40%), and large (60%) rates of classification error, similar to Rios (2021). These percentages were generated in relation to the overall percentage of RG in the data. For instance, if the true RG rate and misclassification percentages were, respectively, 20% and 40%, this would result in underidentifying an average of four RG item responses per disengaged simulee (50 items × 20% RG = 10 true RG item responses × 40% = 4 misclassified RG item responses).
The third misclassification type is motivated by a scenario where SB responses are incorrectly deemed to be RG, which may occur in practice due to employing a threshold procedure that is overly liberal (e.g., setting a high item response time threshold), leading to classifying both true RG and valid responses as RG (Rios, 2021). To reflect this possibility, data were generated for a scenario in which an unmotivated subgroup of simulees (28% of the total sample) engaged in RG on 10% of items, while the remaining sample did not employ RG across items. Assuming the use of a liberal identification threshold, 100% of true RG responses from the unmotivated subsample were correctly classified as RG, while a proportion of true SB responses were misclassified as RG for the motivated subgroup. Given that some researchers have argued that fast SB responses are more likely to occur for high-ability examinees answering easy items (see Goldhammer et al., 2015; Kyllonen & Zu, 2016), SB responses were misclassified as RG for the easiest items administered to high ability simulees (simulees falling in the top 31st percentile; roughly equivalent to simulees with a θ≥ 0.5). 6 The overclassification rate was constrained to one of five levels across the sample: 2%, 4%, 6%, 8%, or 12%. These levels were selected to reflect the same average number of misclassifications observed in the underclassification condition (for further details, see Table 2) and the actual number of misclassifications per disengaged simulee were allowed to vary. 7 A summary of the simulation conditions is provided in Table 3, with each condition replicated 100 times.
Average Number of Misclassified Item Responses Across Simulees Condition
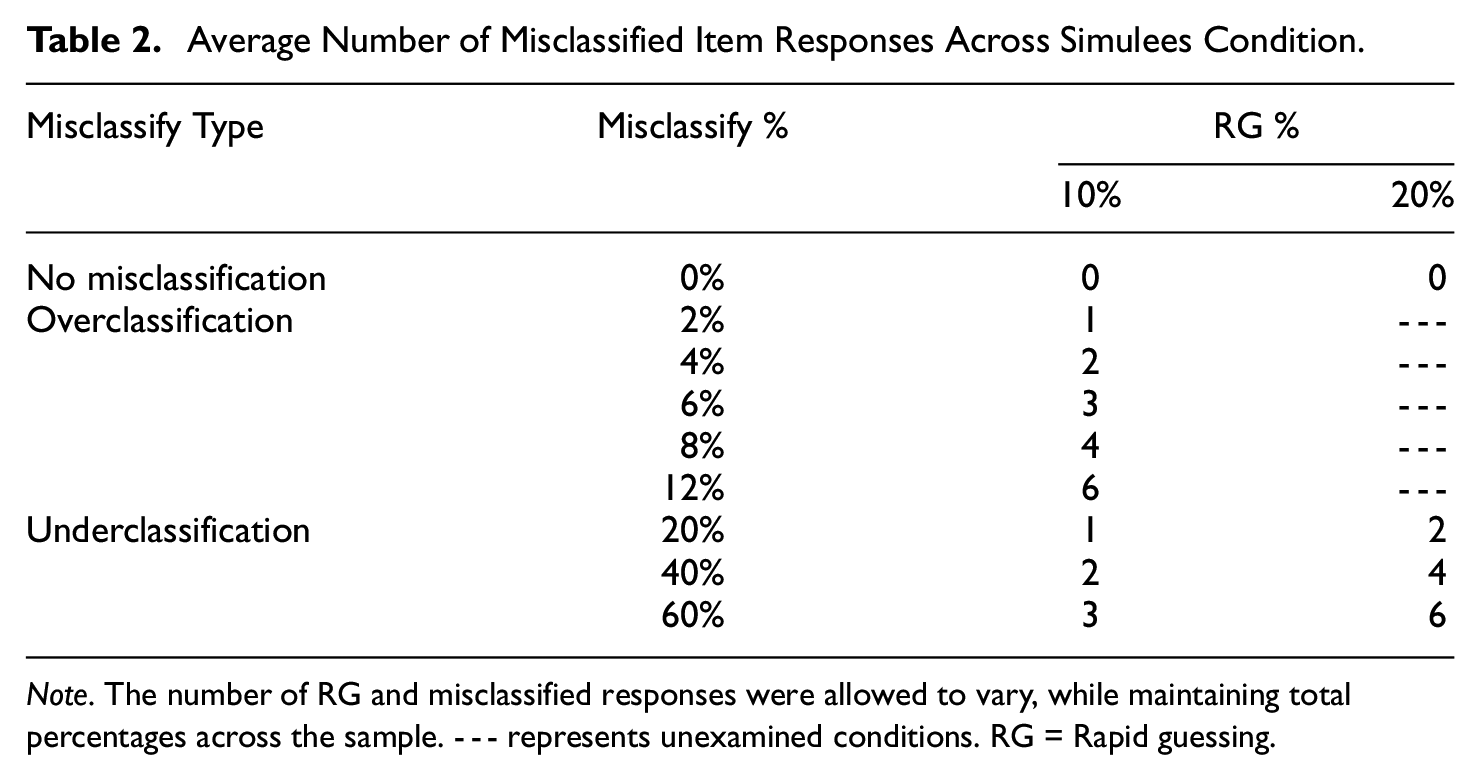
Note. The number of RG and misclassified responses were allowed to vary, while maintaining total percentages across the sample. --- represents unexamined conditions. RG = Rapid guessing.
Summary of Simulation Conditions Disaggregated by RG Misclassification Levels
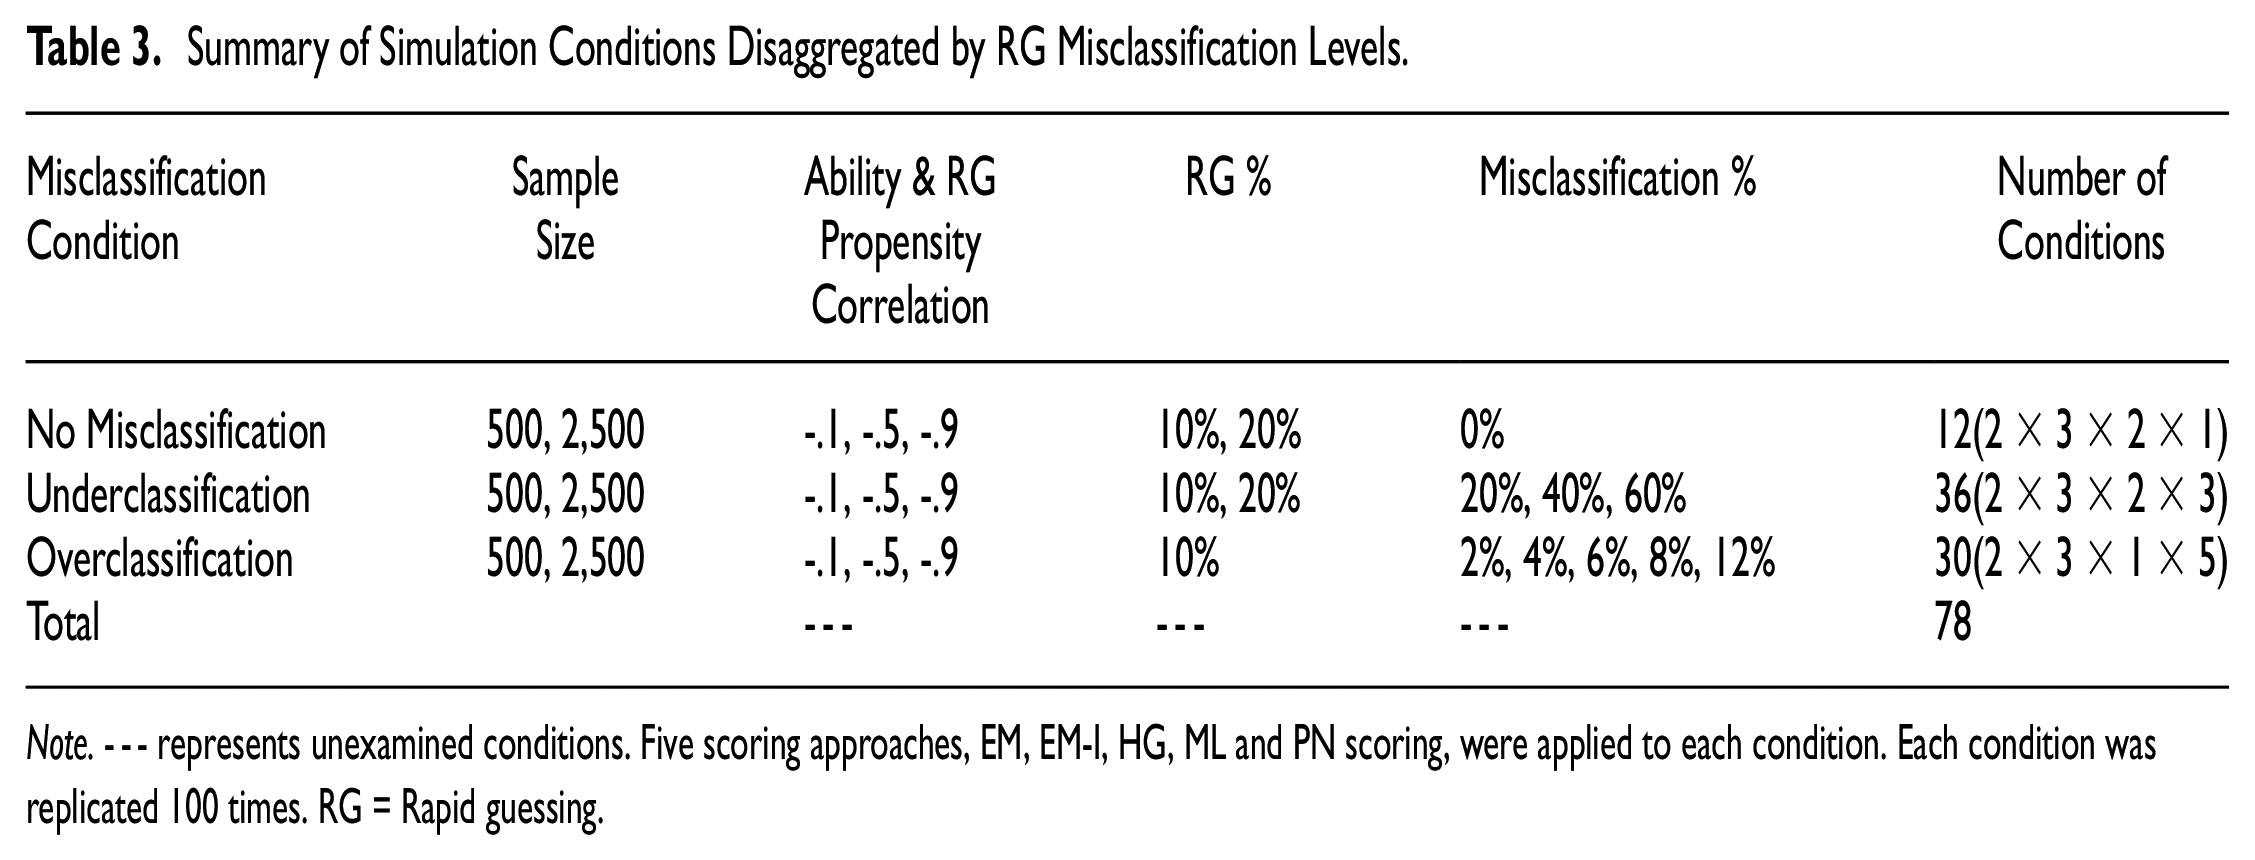
Note. --- represents unexamined conditions. Five scoring approaches, EM, EM-I, HG, ML and PN scoring, were applied to each condition. Each condition was replicated 100 times. RG = Rapid guessing.
Ability Estimation
Once the item response and RG classification matrices were obtained, item and ability parameters were estimated for the 3PL model (the c parameter was constrained to 0.25 for all items) separately for the PN, EM, EM-I, and HG approaches using the mirt R package (Chalmers, 2012). Given that EM-I employs multiple imputation, average parameters were calculated based on 10 iterations of assigning replacement values within each condition replication. 8 To serve as a baseline measure, a naive 3PL model (hereon referred to as ML) was also estimated in which the presence of RG was ignored. Across procedures, the Newton-Raphson estimation algorithm was utilized to determine the maximum of the likelihood function, with the starting value and convergence criterion established at 0 and 0.0001, respectively. The maximum number of iterations set across estimation procedures was 100. Thus, non-converged estimation occurred if the convergence criterion established was not met after reaching the maximum number of iterations set. As maximum likelihood estimation cannot find a local maximum for extreme response patterns consisting of only one response option (this can occur for the RG classification matrix when RG is not present on every item), such response strings were dropped from the analysis.
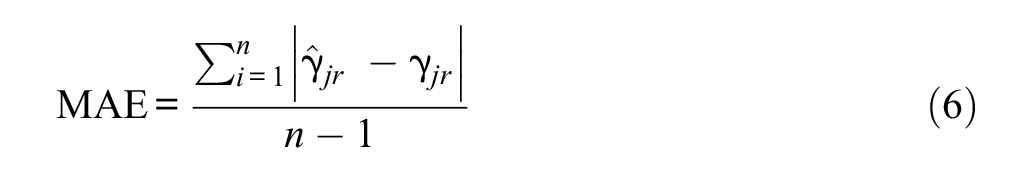
Evaluation Criteria
Two evaluation criteria were investigated for parameter estimation accuracy, bias and MAE. The former criterion was defined for each replication as follows:
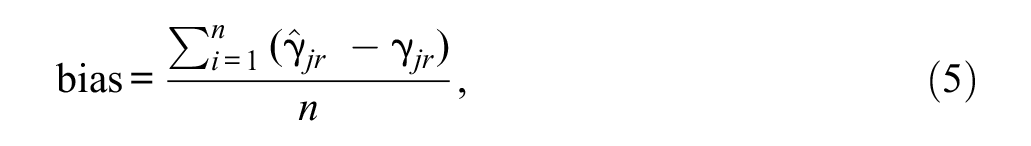
where
These criteria were evaluated separately for item and ability parameter estimates at the aggregated level (i.e., an average value was computed for each condition). In terms of the former, only a and b parameter estimates were evaluated given prior research that has shown c parameters to be negligibly influenced (Rios & Soland, 2021b). All evaluation criteria related to ability parameter recovery were calculated for the unmotivated subsample in which RG and/or RG misclassifications were present as well as for the motivated simulees (i.e., those that did not engage RG and did not have any RG misclassifications present), which aimed to separately investigate the impact of RG and/or RG misclassifications on the two subgroups.
Upon calculating the average evaluation criteria, an analysis of variance (ANOVA) was performed to compare the effect of the independent variables on each parameter under investigation individually by RG misclassification condition. For these analyses, statistical significance was evaluated at an α level of .05, while the eta-squared effect size was used to determine the amount of variance accounted for by each independent variable. Data generation, ability estimation, and all analyses were completed in R, version 4.0.0 (R Development Core Team, 2020). 9 For interested readers, an applied analysis comparing the scoring approaches under investigation is provided in Appendix A of the supplemental file.
Results
Across all conditions, model convergence was met for 100% of replications when employing HG scoring. However, as expected, higher non-convergence rates for all other procedures were obtained when the total sample size was equal to 500. Within this condition, the largest non-convergence rates were observed for PN scoring (0%–21%), followed by ML (0%–12%), EM-I (0%–11%), and EM (0%–9%). In contrast, when the sample size was increased to 2,500, non-convergence rates decreased for nearly all procedures (ML [0%–6%], EM [0%–8%], and EM-I [0%–8%] scoring); however, PN scoring (0%–21%) still possessed the largest degrees of non-convergence, with rates being as high as four times larger than other procedures under conditions where the percentage of RG was extreme (12% overclassification and 60% underclassification). Those replications that did not converge were removed from the analyses noted below. The remaining presentation of results separates findings by RG misclassification condition and parameter type. Given the importance of considering both systematic and random errors in parameter estimates, MAE will be the primary focus of the results section. Mean and confidence interval of MAE value for item and ability parameter estimates across misclassify type conditions are presented in Appendix B in the supplemental file, which is also demonstrated in Figures 1 to 3. In addition, figures for the bias are provided in Appendices C–E of the supplemental file.
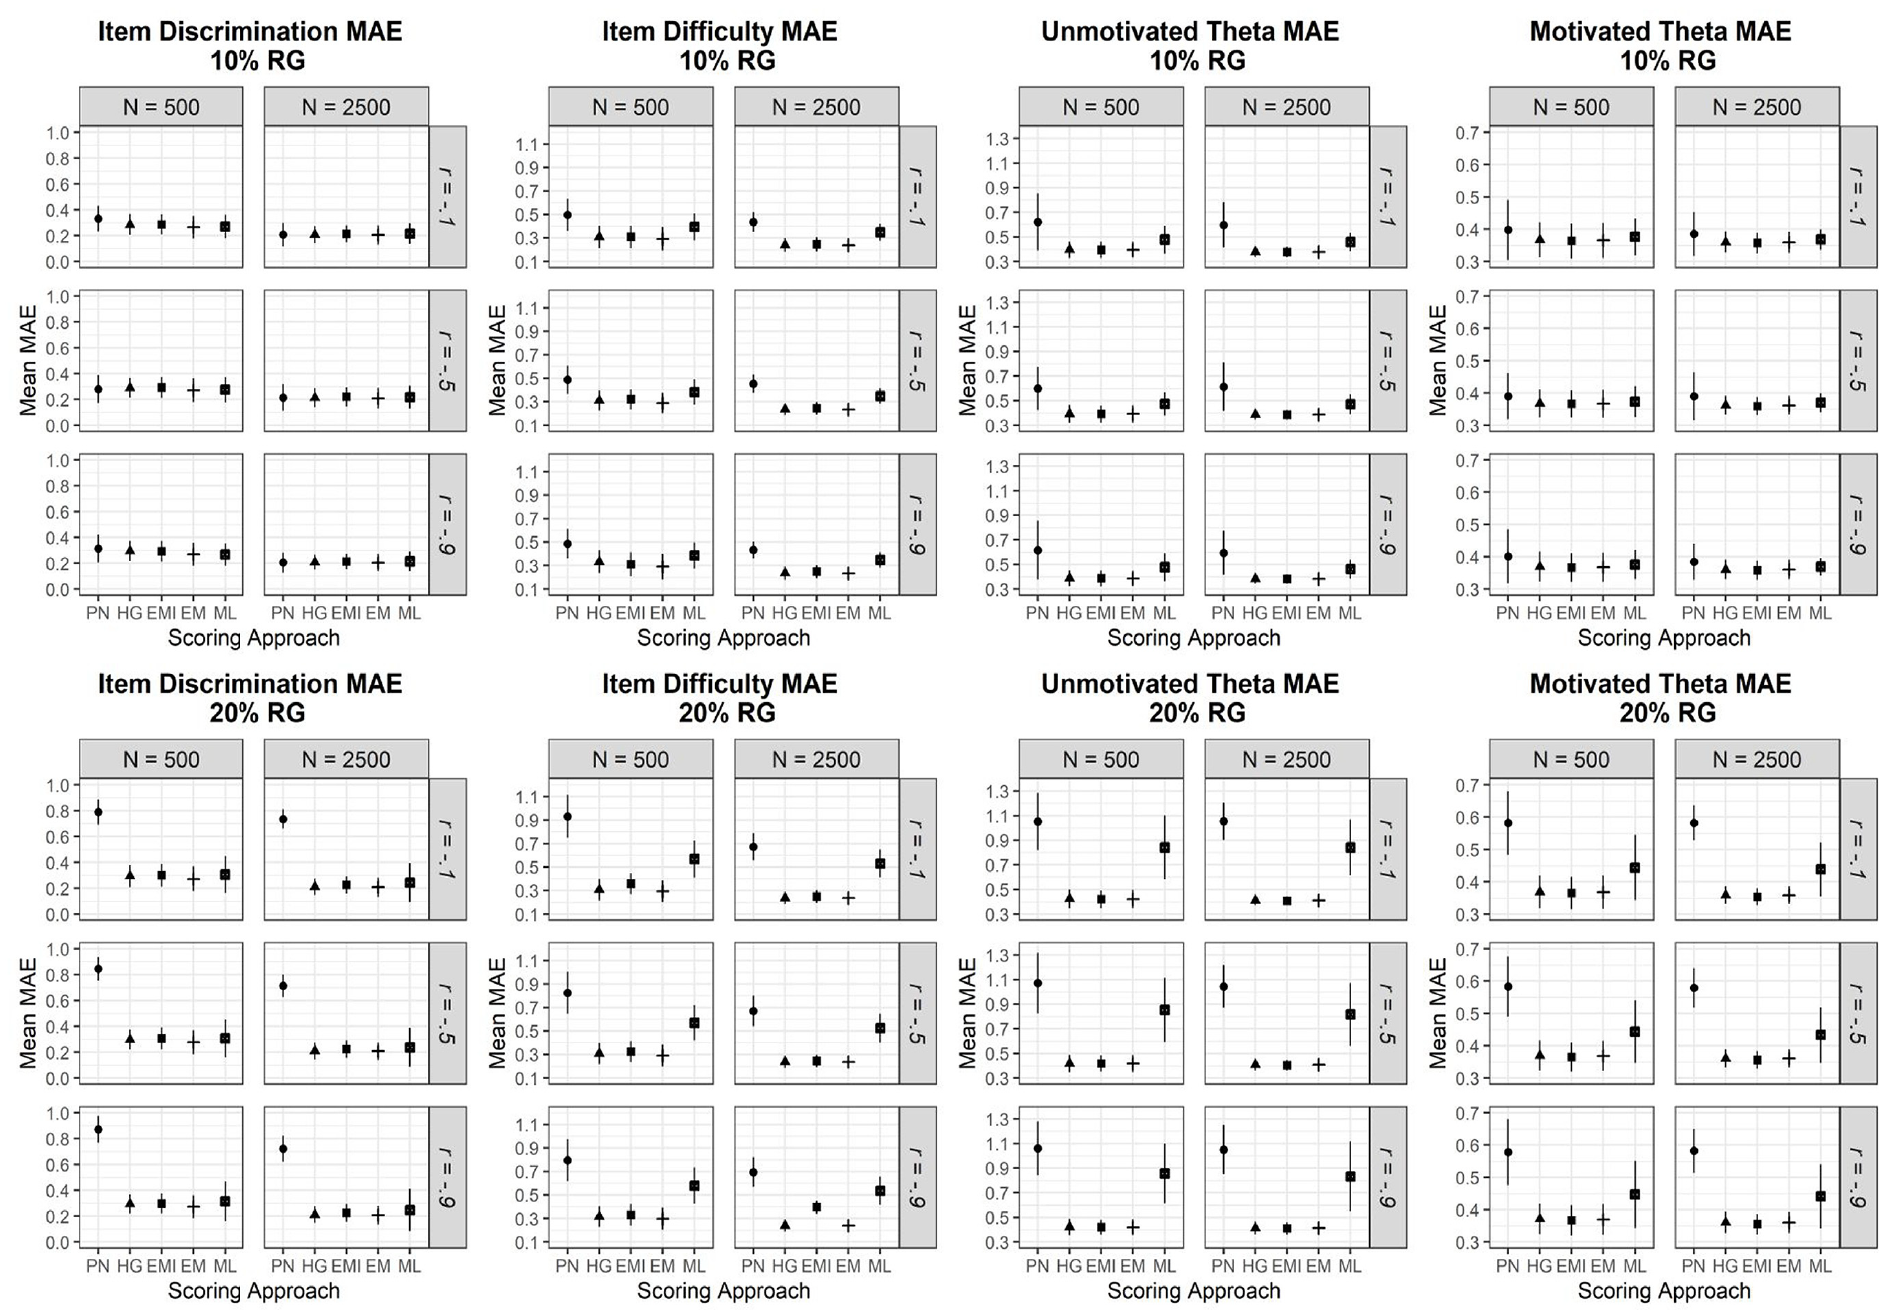
Mean Absolute Error (MAE) Results for No Misclassification Conditions Disaggregated by Parameter Type
Mean Absolute Error (MAE) Results for Underclassification Conditions Disaggregated by Parameter Type
Mean Absolute Error (MAE) Results for Overclassification Conditions Disaggregated by Parameter Type
Perfect RG Identification
Item Discrimination Parameter Recovery
Employing ML scoring (i.e., ignoring the presence of RG) was associated with positive systematic bias of 0.14 to 0.19 units in item discrimination parameter estimates across conditions. Concerning MAE, the main effect for ability and RG propensity correlation was non-significant (p = .99,
ANOVA Results Investigating the Effects of Study Factors on Parameter Recovery Disaggregated by Misclassification Condition
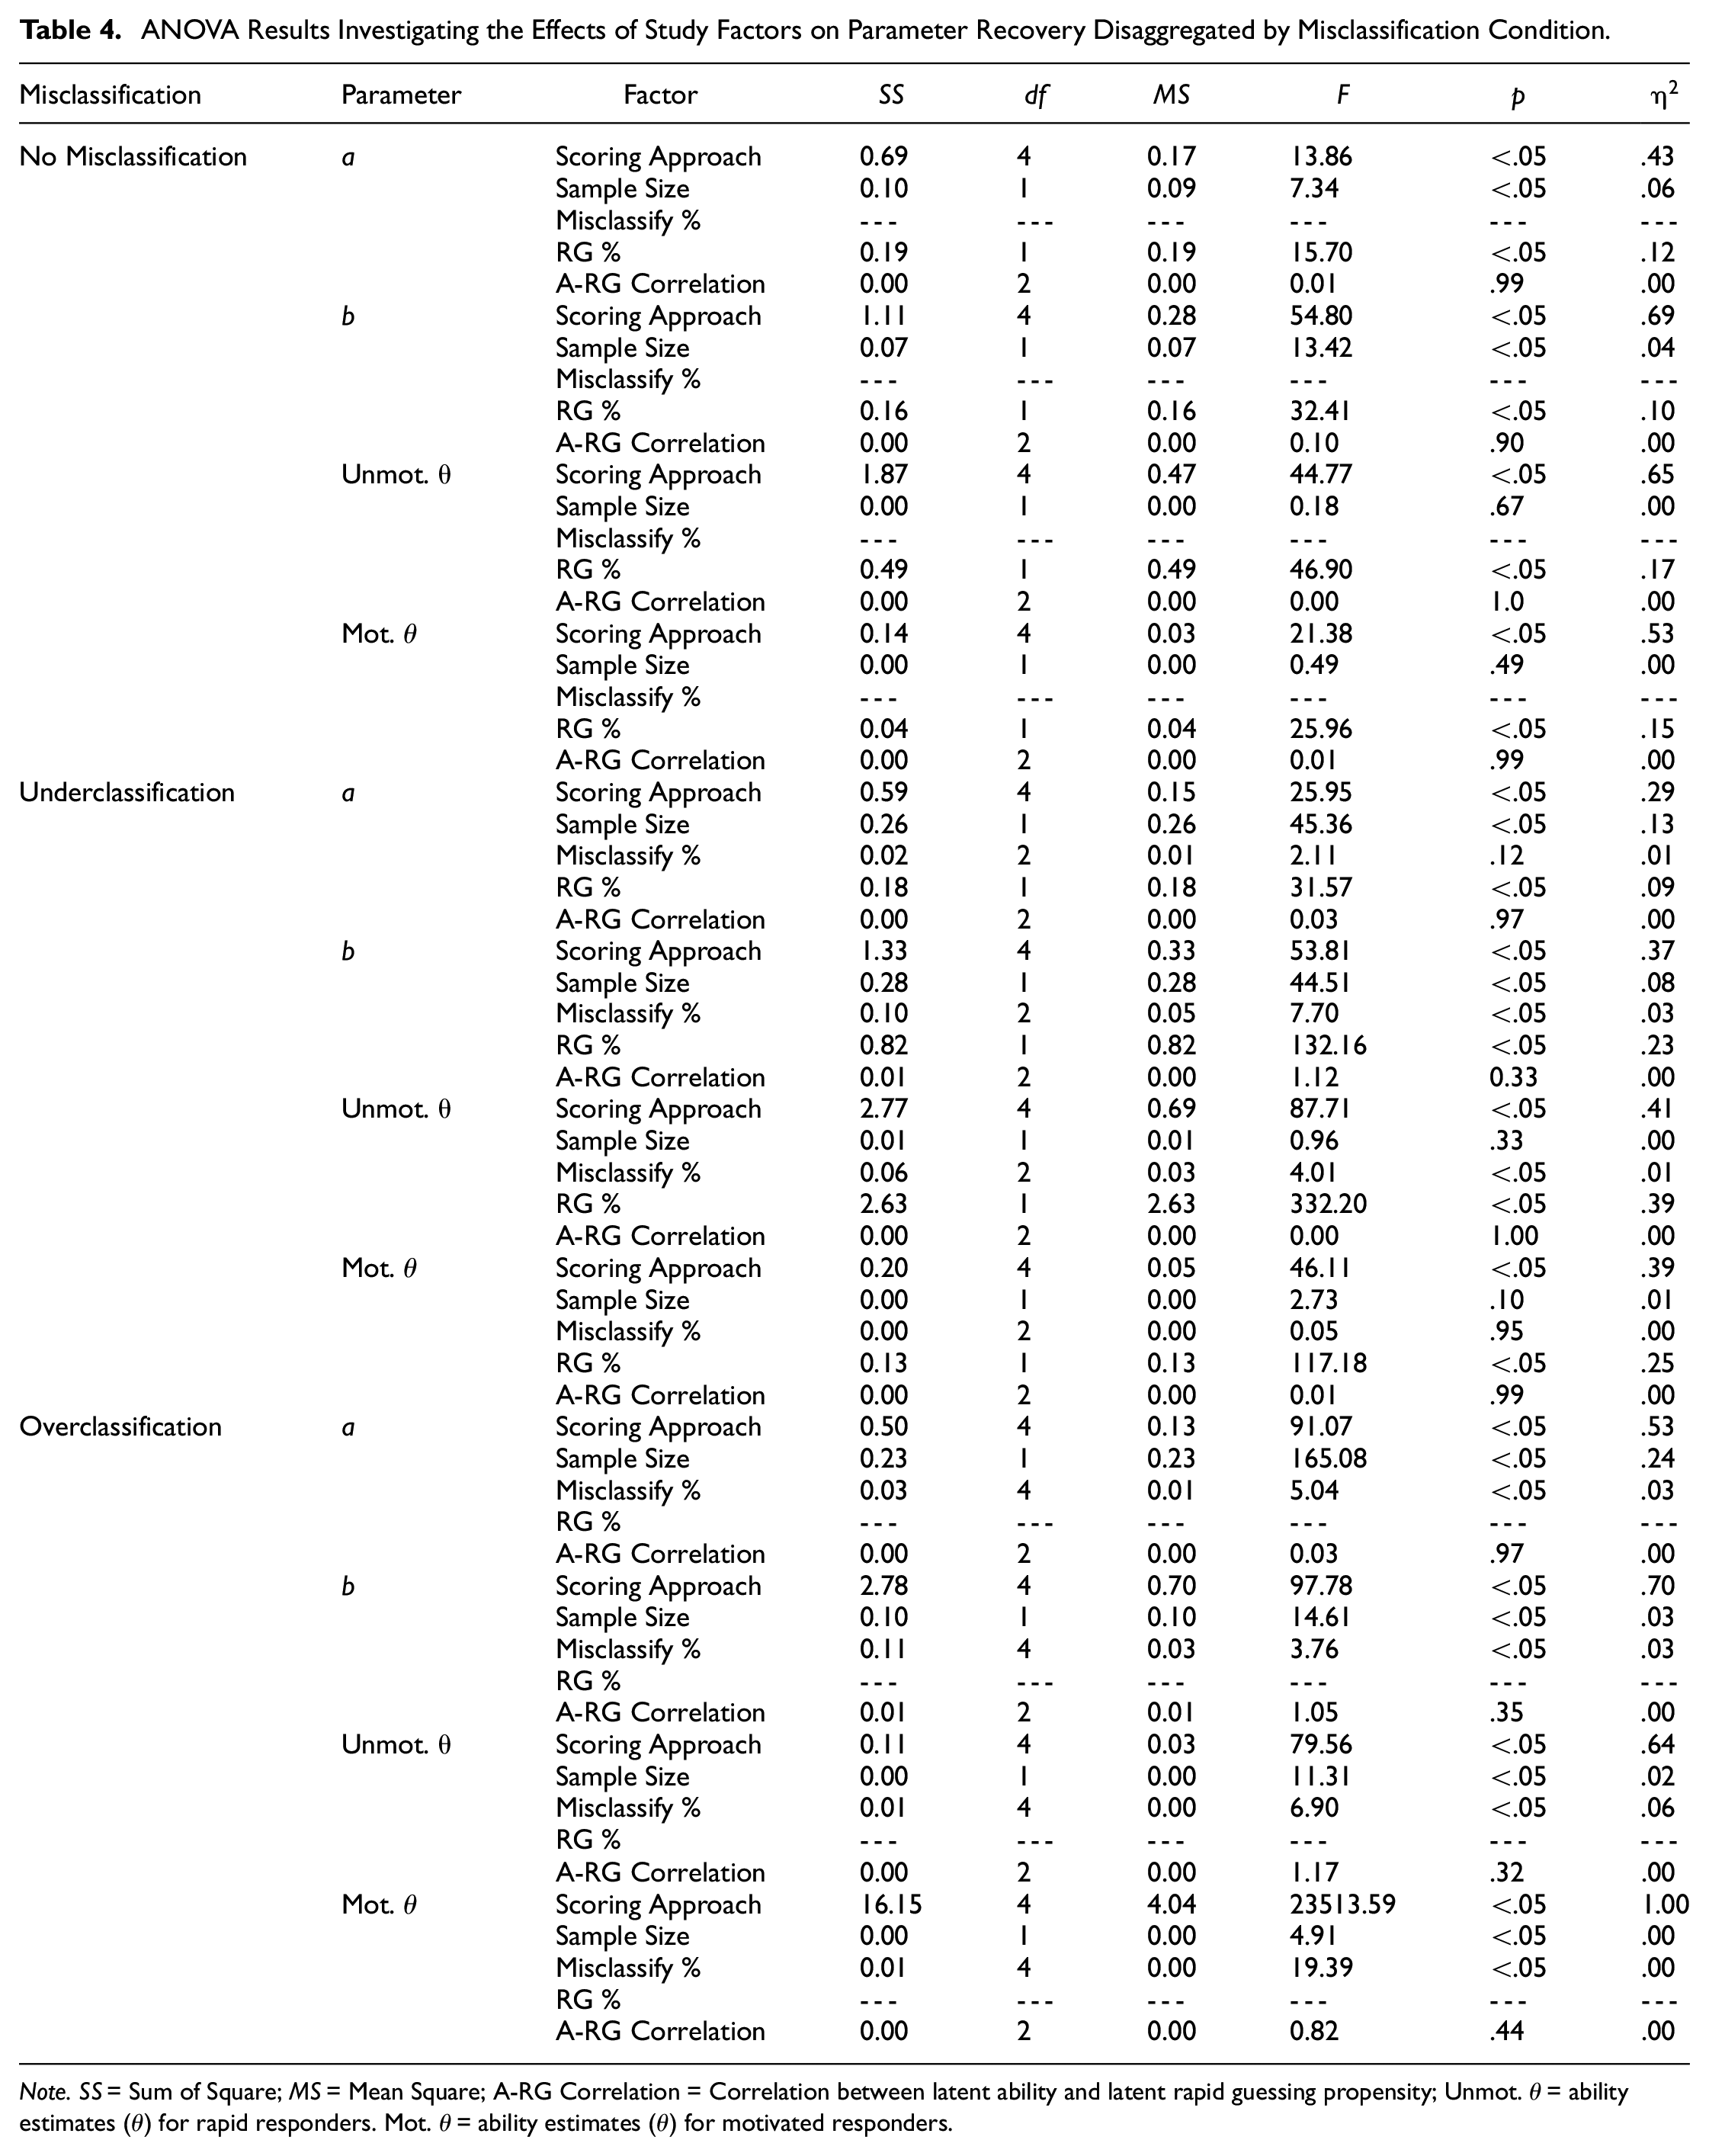
Note.
Item Difficulty Parameter Recovery
Ignoring the presence of RG responses was associated with positive systematic bias ranging from 0.30 to 0.55 units across conditions. In terms of MAE, RG percent (
Unmotivated Ability Parameter Recovery
Across conditions, the presence of RG systematically biased unmotivated simulee ability parameter estimates by an average of −0.25 and −0.75 logits when RG composed 10% and 20% of item responses for this subsample. In contrast, bias was nearly reduced to zero when employing EM, EM-I, and HG scoring, while PN scoring consistently led to biasing ability estimates by 0.47 and 0.97 logits for the smaller and larger RG percentage conditions, respectively. These general trends were supported when examining MAE, with scoring approach (
Motivated Ability Parameter Recovery
A failure to account for RG responses biased ability parameter estimates for motivated simulees by an average of 0.08 and 0.31 logits when the unmotivated subsample employed RG responses across 10% and 20% of items. Given the expected moderating effect of RG percent on combined error variance (
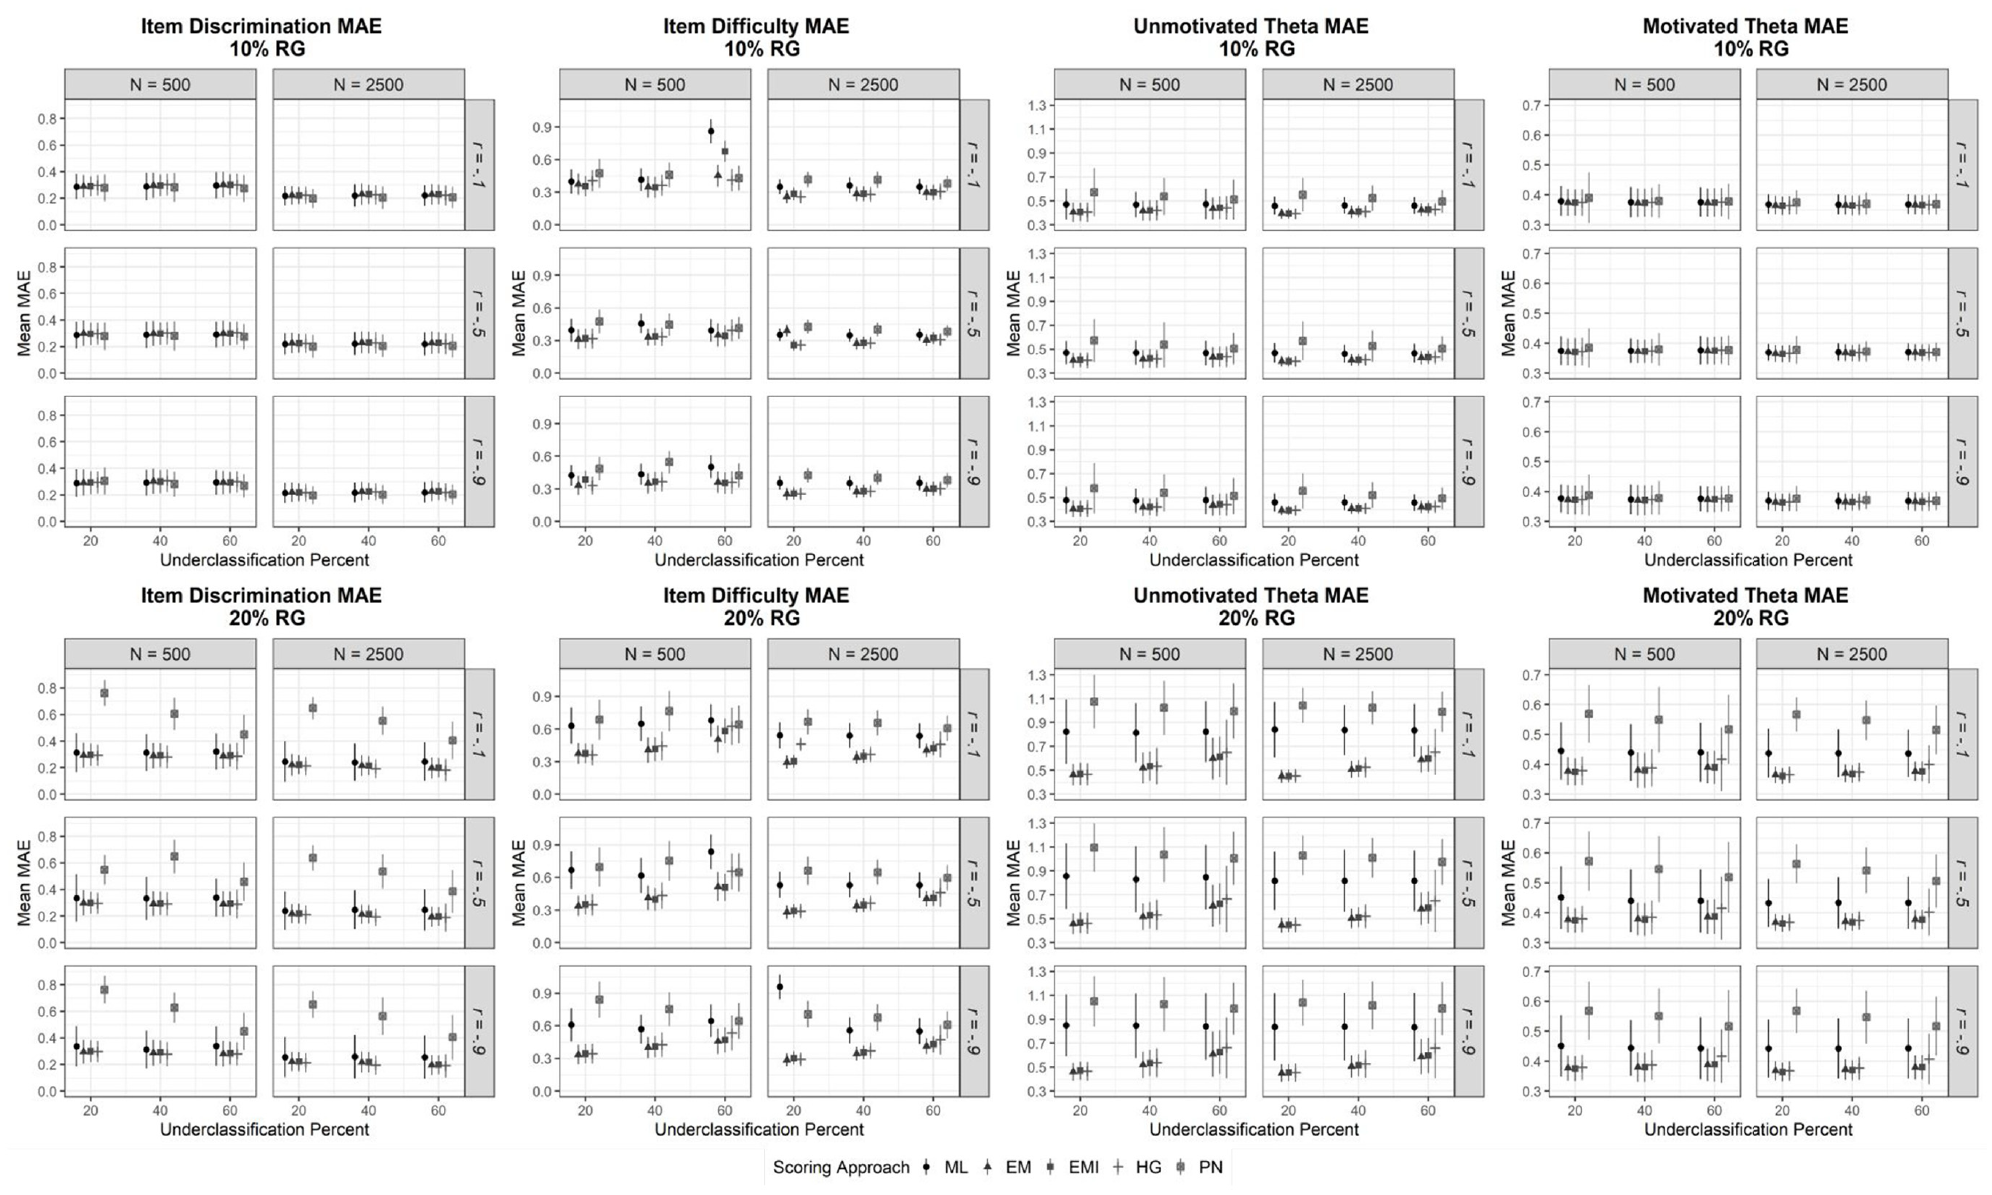
Underclassification of RG
Item Discrimination Parameter Recovery
Both misclassification percent (p = .12) and ability and RG propensity correlation (p = .97) were found to be non-significant predictors of MAE in item discrimination parameter estimates, while sample size (
In the 20% RG conditions, MAE values for PN scoring were as much as 2.5 times greater than EM, EM-I, and HG scoring (this general trend was stable across sample size conditions). Although generally higher, a closer inspection of Figure 2 shows that combined error tended to decrease for PN scoring as the misclassification rate increased. This result likely reflects that the degree of bias associated with treating RG responses as incorrect was mitigated via false negative classifications of RG (i.e., error was lower when leaving RG responses untreated than when recoding them as incorrect; MAE for ML scoring was roughly two to three times lower than PN scoring). In noting the issues associated with PN scoring, EM (pooled MAE = 0.26), EM-I (pooled MAE = 0.26), and HG (pooled MAE = 0.25) scoring generally produced similar degrees of MAE that were lower than both the ML (pooled MAE = 0.27) and the PN (pooled MAE = 0.40) approaches.
Item Difficulty Parameter Recovery
When underclassifying RG, MAE for item difficulty parameter estimates was not found to significantly differ across ability and RG propensity correlation levels (p = .33). In addition, although sample size (
An examination of Figure 2 shows that across all response time threshold scoring procedures, the degree of MAE tended to be higher as the rate of RG increased. Of the approaches examined, PN scoring was observed to be the most sensitive to changes, with MAE values increasing by a relative average of 37% when RG percentage went from 10% to 20%, while only increasing by 26% for HG and approximately 15% for EM and EM-I scoring. Similar to the perfect RG identification conditions, MAE for PN scoring tended to decrease as the rate of underclassification increased (this pattern is clearer for conditions with N = 2,500). An inverse relationship was found for the remaining response time threshold scoring approaches, EM, EM-I, and HG (i.e., MAE increased as the underclassification percent grew), with HG scoring possessing the largest degree of combined error under extreme underclassification (60%). Across conditions, PN scoring had the highest pooled MAE (0.56), while EM (0.35), EM-I (0.36), and HG (0.37) all performed similarly lower than ML (0.52) scoring.
Unmotivated Ability Parameter Recovery
Turning to ability parameter recovery for unmotivated simulees, the ANOVA results indicated that both RG percent (p < .05;
When comparing EM, EM-I, and HG scoring, similar degrees of combined error were generally found; however, as noted, MAE for these approaches increased as the misclassification rate surged. For instance, when increasing the misclassification rate from 20% to 60%, combined systematic and random error increased by approximately 0.15 units. This elevated degree of MAE was particularly noticeable for HG scoring, which produced the highest rates of error under the largest RG and misclassification rate conditions when compared with EM and EM-I scoring, although systematic error differed by only as much as 0.08 logits. These findings suggest that EM and EM-I produced the smallest degrees of combined error of all other approaches, with the rate of improvement increasing as RG and misclassification percent grew.
Motivated Ability Parameter Recovery
Of the three classification levels examined, ability parameter recovery for motivated simulees was most impacted when underidentifying RG responses at high rates (i.e., RG and misclassification rates were 20% and 60%, respectively). As an example, the positive systematic bias of approximately 0.40 to 0.60 logits was observed across response time threshold scoring approaches. As the rate of RG responses in the data matrix went from 10% to 20%, MAE values tended to increase by 1.5 times for PN scoring (the systematic bias was three times larger) across sample size conditions, which led to a greater combined error when compared with ML scoring. In contrast, relatively stable MAE values were observed for EM and EM-I scoring, with elevated degrees of error present for HG scoring under high rates of misclassification (60%). Across conditions, pooled MAE values were lowest for EM (0.37) and EM-I (0.37), followed by HG (0.38), and PN (0.46) scoring. With that noted, differences across scoring approaches were only noted when the RG rate was 20%.
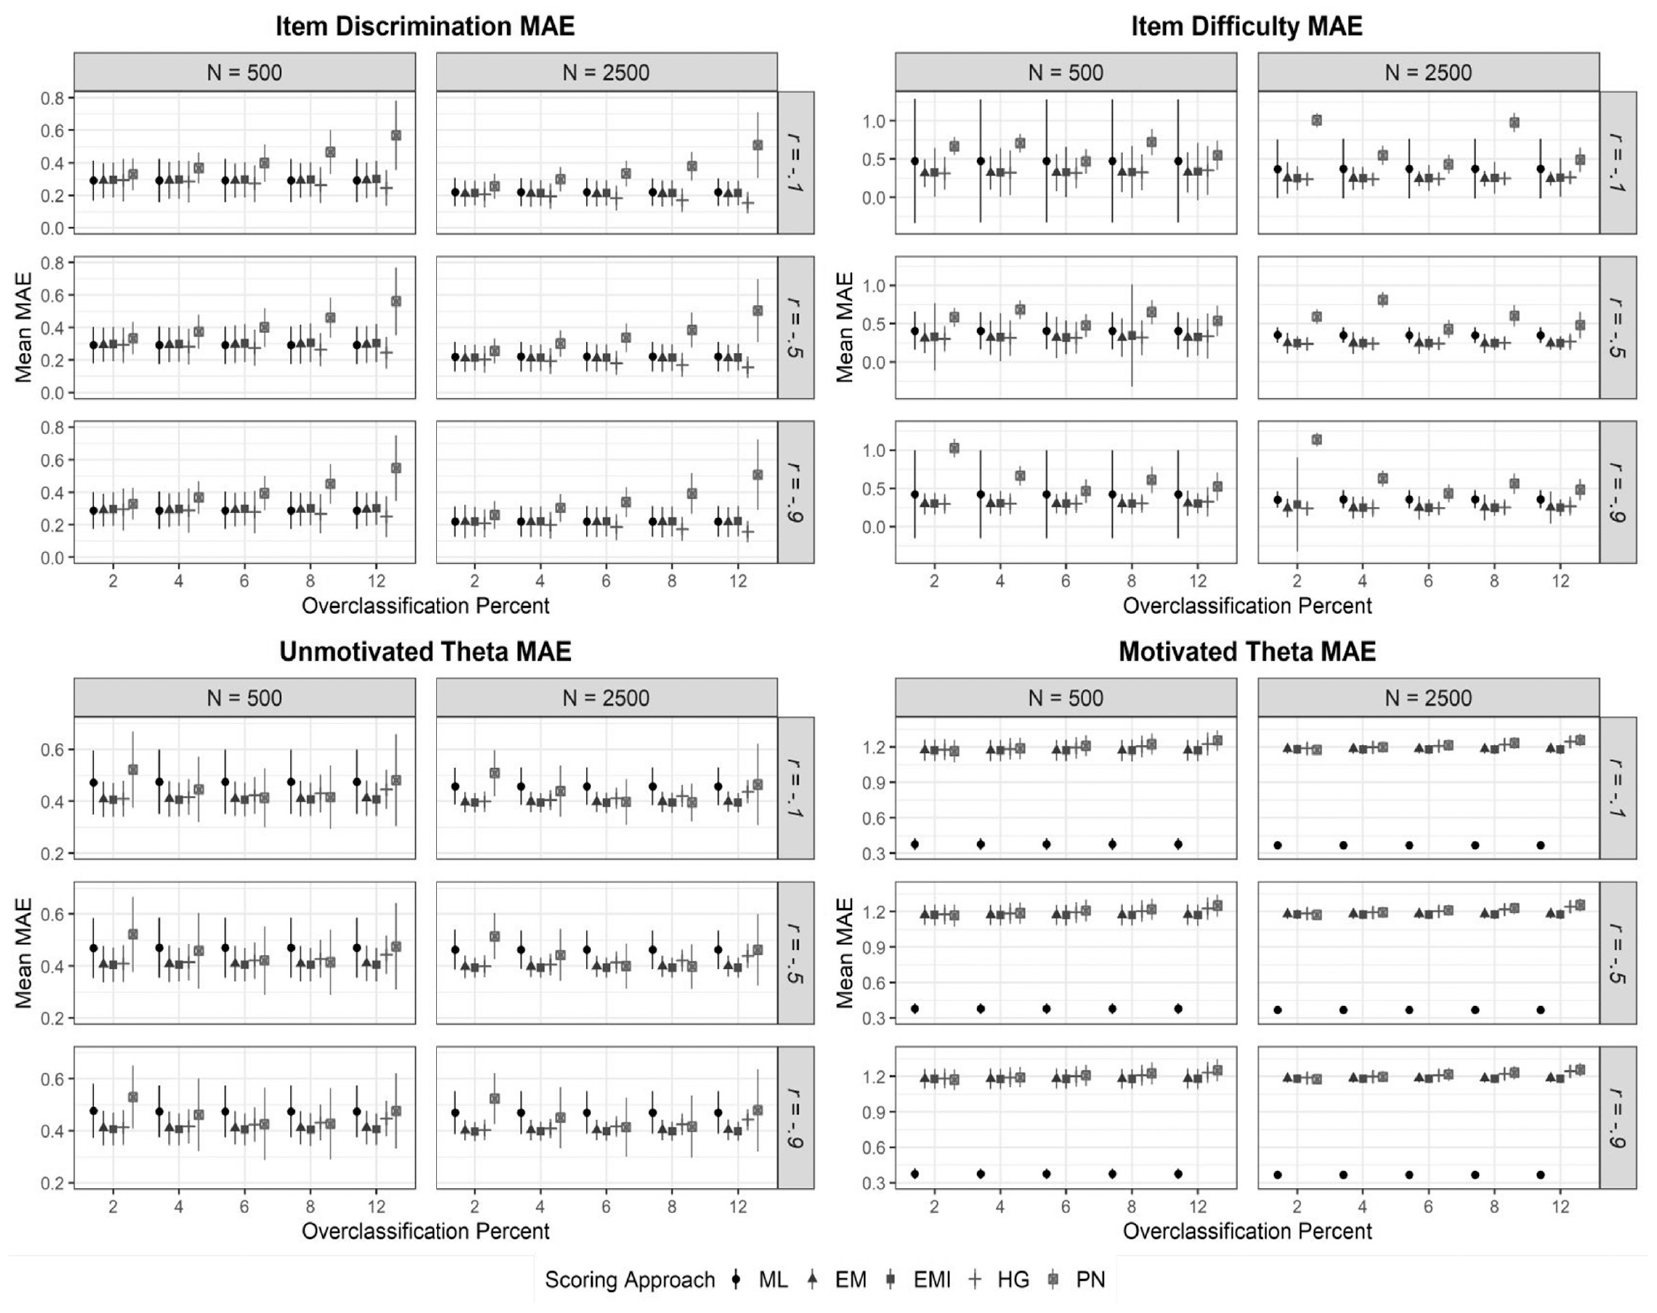
Overclassification of RG
Item Discrimination Parameter Recovery
Differences in MAE values were predominately accounted for by scoring approach (p < .05;
Item Difficulty Parameter Recovery
Figure 3 shows the item difficulty parameter recovery results when RG was overclassified. From this figure, it is clear that there was significant variation in MAE results by scoring approach (p < .05;
Unmotivated Ability Parameter Recovery
Error in ability parameter recovery for simulees engaging in RG was predominately accounted for by scoring approach (
Motivated Ability Parameter Recovery
Underidentifying RG responses from unmotivated simulees was found to lead to differing ability parameter estimate distortion for motivated simulees based on scoring procedure employed. Specifically, in examining systematic bias, PN scoring distorted ability estimates by as much as 0.10 logits, whereas the degree of bias for EM, EM-I, and HG scoring hovered around zero for all conditions. With that noted, pooled MAE values for these four scoring approaches (EM[1.18], EM-I[1.18], HG[1.20], PN[1.21]) were much higher for this subsample compared with ML (0.37) scoring (Figure 3), likely due to the amount of random error introduced from treating RG responses as incorrect or imputing RG responses as either missing data or plausible values based on biased item parameter estimates (scoring procedure accounted for all of the variance in MAE [
Discussion
The objective of the present investigation was to comparatively evaluate parameter recovery for four response time threshold scoring approaches under perfect and imperfect classifications of RG. To date, this is the most comprehensive comparative study of scoring approaches for handling RG under simulated contexts. A number of key takeaways can be drawn from the findings. Specifically, across all conditions, PN scoring possessed the highest degree of error in both item and person parameter recovery and, in many cases, performed more poorly than the naive approach of ignoring the presence of RG. These trends were consistent across conditions in which the relationship between ability and RG propensity was both weak and strong. From a statistical perspective, these results suggest that treating RG responses as incorrect can have deleterious results, given that the tenability of the assumption underlying this rescoring method (i.e., examinees only employ RG due to accurately identifying that they have an expected probability below chance) is likely questionable for all examinee-by-item interactions.
Turning to more effective approaches, the simulation results indicate that EM, EM-I, and HG scoring generally provided similar degrees of combined systematic and random error for both item and ability parameter estimates across conditions in which RG was perfectly identified.
However, as the rate of misclassifications increased, HG scoring was found to be susceptible to increased error in ability estimates, particularly when a high rate of RG (20%) was present. This finding likely occurred due to the influence of RG misclassifications on the correlation between estimates of ability and propensity to rapid guess, with this correlation decreasing as misclassifications rates rose. This finding supports the hypothesis posited by Deribo et al. (2021) who first noted the potential for RG misclassifications to be associated with inaccuracies in ability estimates for multidimensional IRT methods employed to handle RG. In contrast, EM and EM-I scoring were less susceptible to misclassification rates; however, negligible differences in pooled MAE values were observed between these two approaches. These results suggests that the added benefits of imputing plausible values for RG responses possessed an insignificant effect on item and aggregated ability estimates when compared with treating all such responses as missing.
Limitations and Areas for Future Direction
A number of limitations should be noted when interpreting the presented findings. The first limitation was associated with the data generation process. Specifically, data were generated for a 50-item test. Although this test length falls within the range commonly seen in low-stakes testing contexts (Rios et al., 2022), it is likely that due to time constraints, shorter tests may be present in applied settings. The results of this study may not generalize to other test lengths as the accuracy of item and ability parameter estimates will largely be dependent on possessing adequate statistical power for the estimated models. Thus, prior to selecting a given response time threshold scoring procedure, researchers and practitioners are recommended to evaluate statistical power for their given dataset by examining the ratio between sample size and number of parameter estimates, among other factors (for a discussion on power in statistical power in structural equation models, see Wolf et al., 2013). As demonstrated in this study, many of the scoring procedures are susceptible to model convergence issues as well as increased systematic bias and MAE when sample sizes are small (N = 500).
Another limitation associated with the data generation process was that simulee abilities were sampled from a bivariate normal distribution. This distribution presumes that there is a linear relationship between ability and RG propensity. However, prior research suggests that there may be a variety of RG correlates that may be unassociated with ability across testing contexts (for a review, see Rios & Soland, 2022; Wise, 2017). When such covariates are present, the assumption of a linear association is violated; likely leading to biased parameter estimates (Liu et al., 2019). As a result, the differences between simulation and empirical data-generating process may affect the conclusions drawn from the simulation study. Thus, future research may benefit from putting efforts to better understand the underlying data-generating process in empirical tests and employing more nuanced data generation approaches that employ structural equation models to combine both measurement and path models that may better encapsulate RG behavior.
Beyond issues associated with data generation process, this study examined only one type of non-effortful responding. However, examinees may disengage in a variety of ways beyond RG, such as omitting items or employing partial effort. To address the former, Ulitzsch et al. (2020) proposed a hierarchical latent response model that incorporates both response time information and item responses to evaluate examinee engagement based on RG and item omission. Such work provides a promising example of scoring approaches that incorporate multiple forms of disengagement. Beyond item omissions, recent work by Wise and Kuhfeld (2021) proposed a method for identifying partially engaged responding. As noted by these authors, when such behavior is present, the scoring approaches examined in this article should be interpreted with caution. A related limitation of this article is that RG was operationalized as being equivalent to random responding. Although there is general evidence to support this conceptualization (Wise, 2017), there may be circumstances in which examinees employ test-wise strategies that may be associated with guessing probabilities that are higher than that examined in the current study (Wise, 2006). Thus, future research may benefit from considering how such strategies combined with random guessing may influence parameter estimates.
Furthermore, the present study only compared response time threshold scoring procedures; however, as outlined by Nagy and Ulitzsch (2021), there are a number of mixture IRT model scoring approaches that have been proposed to deal with RG in estimating parameter estimates. These procedures were not examined in the current study given their strong assumptions concerning response time distributions (e.g., constant speed of effortful responding, equal mean and variance for RG responses), which prior research has suggested may be untenable in applied measurement contexts (Bolsinova et al., 2017; Meng et al., 2015; van der Linden & Glas, 2010). With that noted, there is a need for future research that examines the robustness of these mixture IRT models to violations of their underlying assumptions. Such an analysis, coupled with the present study, would provide applied researchers and practitioners with guidance on scoring approaches that may be most effective to employ in operational settings where investigating the tenability of their assumptions may be difficult or impossible.
Moreover, another limitation of the current study is that we did not include the MW model within our simulation study. To date, the effectiveness of this model has only been studied through an empirical analysis (Deribo et al., 2021). As a result, we were unable to compare the effectiveness of the MW model with other scoring procedures under investigation, which may limit the generalizability of our findings to other models. However, this could be a valuable direction for future research, as a more comprehensive evaluation of the RG scoring procedures could be conducted. Future investigation of the MW model will allow for a better understanding of the strengths and weaknesses of different RG scoring approaches and help inform the selection of the most appropriate scoring procedure for a given context.
Implications
Limitations aside, the findings from the present investigation provide a number of implications for estimating item and ability parameters in the presence of RG. First, where possible in the case with a similar data-generating process that the current simulation employed, PN scoring applied to all examinees should be avoided, given that it often provides greater bias in parameter estimates than simply ignoring RG responses. 11 Second, the findings from this article point to the important interaction between RG identification accuracy and response time threshold scoring approach on parameter recovery. Thus, when choosing a scoring approach, applied researchers and practitioners may benefit from considering the real possibility that RG can be classified inaccurately, as this study has shown that some approaches are more robust than others to such violations.
Grounded in this possibility, prior to selecting a scoring method to mitigate RG, applied researchers and practitioners could benefit from considering the type of response time threshold that will be employed to identify RG. Although RG identification accuracy is unknowable in applied contexts, using conservative procedures (e.g., classifying any response provided in three seconds or less), as most applied researchers have been found to do, may likely lead to false negative classifications (see Rios & Deng, 2021). Under such circumstances, some scoring procedures may be more ineffective than others. Thus, prior to selecting a scoring method, applied researchers and practitioners should clearly operationalize RG in terms of its underlying behavioral assumptions (i.e., does RG manifest itself as random guessing due to low task value, strategic guessing, or test speededness?) and employ as many sources of information (e.g., response accuracy and times) possible in establishing response time thresholds. Alternatively, employing multiple response time thresholds and calculating a pooled average and standard error of resulting point estimates using Rubin’s rules (Rubin, 1976) may also be an effective approach.
With the importance noted of considering the applied RG identification method in tandem with the RG scoring method, the findings suggest that EM scoring is an effective approach to best recover item and ability parameters in the presence of RG. The simulation results showed that the EM, EM-I, and HG scoring procedures produced comparable item and ability estimates. However, the EM approach stood out as the most efficient among the three, as it yielded the narrowest confidence interval. On the contrary, this scoring method was found to be robust to violations of RG classification accuracy and multidimensionality between RG propensity and ability. The latter conclusion supports prior work conducted by Liu et al. (2019). Overall, EM scoring is a useful method for handling RG in applied research and operational settings not only from a statistical perspective but also given that it does not assume a strict pattern of RG and is computationally simple allowing for its application in readily available software programs (Rios & Soland, 2021a). With that noted, convergence and accuracy issues may arise under small sample size conditions, thus, prior to its application, practitioners should ensure that adequate sample sizes are present. Moreover, in settings where the sample size is limited, HG scoring may be a viable alternative as it has been shown to have fewer convergence issues in prior studies. In addition, continued research is needed to not only handle the presence of RG in parameter estimation but to mitigate non-effortful responding where possible (see Rios, 2021) given that the deleterious effects of this construct-irrelevant behavior may be impossible to completely mitigate using currently available scoring methods.
Supplemental Material
sj-docx-1-epm-10.1177_00131644231168398 – Supplemental material for A Comparison of Response Time Threshold Scoring Procedures in Mitigating Bias From Rapid Guessing Behavior
Supplemental material, sj-docx-1-epm-10.1177_00131644231168398 for A Comparison of Response Time Threshold Scoring Procedures in Mitigating Bias From Rapid Guessing Behavior by Joseph A. Rios and Jiayi Deng in Educational and Psychological Measurement
Footnotes
Author Contributions
The first author conceived of the present study, designed the simulation study, interpreted the findings from the simulation, and wrote the manuscript. The second created all figures, identified the applied dataset, devised and conducted the applied analysis, and led the writing for this analysis. All authors conducted critical revisions of the article throughout the review process and approved the final version to be published.
Declaration of Conflicting Interests
The author(s) declared no potential conflicts of interest with respect to the research, authorship, and/or publication of this article.
Funding
The author(s) received no financial support for the research, authorship, and/or publication of this article.
Supplemental Material
Supplemental material for this article is available online.
Notes
References
Supplementary Material
Please find the following supplemental material available below.
For Open Access articles published under a Creative Commons License, all supplemental material carries the same license as the article it is associated with.
For non-Open Access articles published, all supplemental material carries a non-exclusive license, and permission requests for re-use of supplemental material or any part of supplemental material shall be sent directly to the copyright owner as specified in the copyright notice associated with the article.