
Abstract
In real-world situations, multidimensional data may appear on large-scale tests or psychological surveys. The purpose of this study was to investigate the effects of the quantity and magnitude of cross-loadings and model specification on item parameter recovery in multidimensional Item Response Theory (MIRT) models, especially when the model was misspecified as a simple structure, ignoring the quantity and magnitude of cross-loading. A simulation study that replicated this scenario was designed to manipulate the variables that could potentially influence the precision of item parameter estimation in the MIRT models. Item parameters were estimated using marginal maximum likelihood, utilizing the expectation-maximization algorithms. A compensatory two-parameter logistic-MIRT model with two dimensions and dichotomous item–responses was used to simulate and calibrate the data for each combination of conditions across 500 replications. The results of this study indicated that ignoring the quantity and magnitude of cross-loading and model specification resulted in inaccurate and biased item discrimination parameter estimates. As the quantity and magnitude of cross-loading increased, the root mean square of error and bias estimates of item discrimination worsened.
Introduction
One of the assumptions of item–response theory (IRT) models is that the underlying latent ability being measured is unidimensional in nature (Finch, 2011). However, there are a great number of surveys, instruments, and tests that measure multiple latent abilities, which leads to a potentially multidimensional structure of item–response data. Within-item multidimensionality refers to a set of items in which some or all items on a test measure more than one underlying latent ability (Adams et al., 1997; McDonald, 1999). Educational and psychological measurement instruments are more likely to represent a multidimensional Item Response Theory (MIRT) model where more than one underlying latent ability is being measured simultaneously (Finch, 2011; Reckase, 1985). For example, in a mathematics test, some items may be hypothesized to measure algebra skills but also require some geometry or trigonometry skills in order for an examinee to respond to that particular item correctly. Figure 1 illustrates a MIRT model where two underlying abilities (
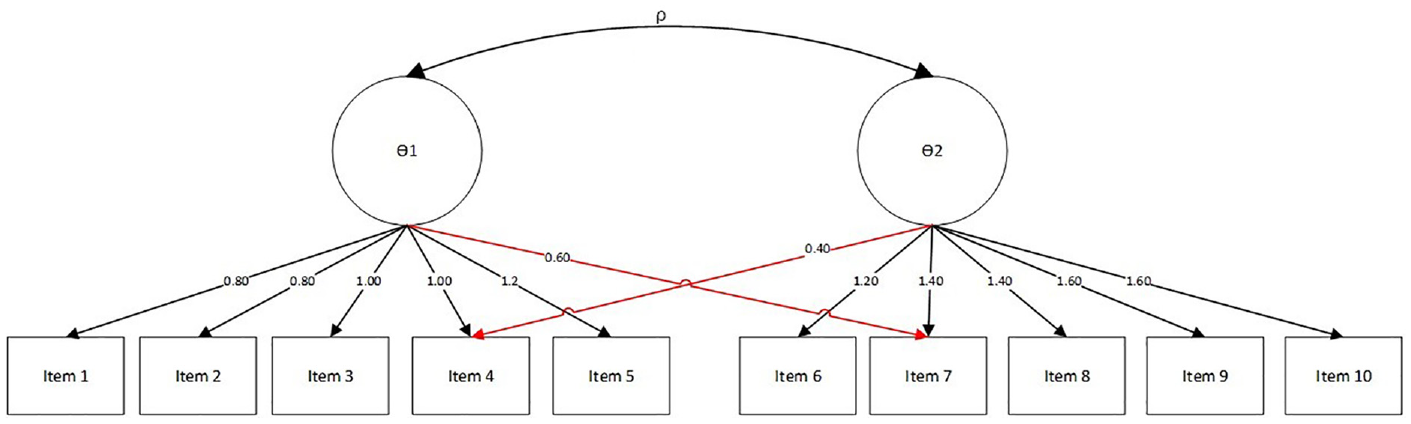
A MIRT Model With Two Underlying Abilities (
When data are multidimensional, the quantity and magnitude of the cross-loaded items should be taken into account to ensure the precision of item parameters and appropriate interpretation of item characteristics and examinees’ abilities. Understanding the true structure of the data and assessing dimensionality prior to applying IRT models in social sciences is imperative to make appropriate inferences about the underlying latent abilities (Finch, 2010, 2011; Strachan et al., 2020; Svetina et al., 2017; Svetina & Levy, 2016; Zhang, 2007, 2012).
In this study, cross-loading refers to the items that are associated with multiple abilities at the same time or those items that require an examinee to demonstrate knowledge on multiple underlying abilities. The magnitude of cross-loading is an indication of how strongly primary and secondary dimensions are associated with the items. The quantity of cross-loading items refers to the number, or percentage, of the items on a test, survey, or a measurement instrument that exhibit cross-loading. Previous research studies discussed dimensionality assessment and its performance precision under various conditions (Finch & Habing, 2005; Svetina, 2013; Svetina & Levy, 2016). Other researchers have taken into account multidimensionality and structure of the data to evaluate item parameter recovery (Finch, 2011; Svetina et al., 2017; Zhang, 2012). However, to our knowledge, these studies did not investigate the effects of the quantity and magnitude of the cross-loading on secondary dimension and model specification on item parameter estimation.
The purpose of this study was to investigate the effects of the quantity and magnitude of cross-loading on secondary dimension, and model specification on item parameter estimation. The focus of this study is a compensatory, dichotomous, two-parameter logistic (2PL) MIRT model.
Literature Review
There are a number of variables that could potentially influence item parameter estimation and must be taken into account to evaluate the precision of item parameter estimates when applying a MIRT model. These variables include but are not limited to sample size, correlation level between the latent abilities, estimation method, number of items, distribution of the latent abilities, the quantity and magnitude of the cross-loading on secondary dimension and model specification, etc. Previous studies have investigated the effects of structure complexity, the correlation between the underlying latent abilities, sample size, and distribution of examinees on item parameter recovery in complex structure MIRT models (Finch, 2011; Finch & Habing, 2005; Svetina, 2013; Svetina et al., 2017; Svetina & Levy, 2016; Zhang, 2012). Bolt and Lall (2003) investigated item parameter estimation precision of multidimensional compensatory and non-compensatory item–response models. The authors performed a simulation study to evaluate parameter recovery for the multidimensional two-parameter logistic model (M2PL) and the multidimensional latent ability model under various conditions. Results suggested that sample size, number of items, and the correlation between latent abilities had noticeable effects on item parameter estimates (Bolt & Lall, 2003). Finch (2010) investigated the accuracy of item parameter estimates in the area of MIRT model context. The results of this study indicated that regardless of the distribution of the latent ability, bias was much higher in the 3PL than in the 2PL case. In addition, higher correlation values demonstrated a greater bias in item discrimination and location estimates. Finch (2011) investigated the accuracy of item location and discrimination parameter estimation in MIRT models when some items exhibited a complex structure. The results of this simulation study indicated that item parameter estimation, when items did not exhibit a simple structure, was more accurate when a multidimensional approach was utilized compared with a unidimensional approach. Item discrimination estimates demonstrated lower levels of bias when two latent abilities were present. Furthermore, item discrimination parameters were consistently underestimated when the latent abilities were non-normal. The author noted that both bias and standard error increased when item–response data did not conform simple structure (Finch, 2011). Zhang (2012) conducted a simulation study to compare the unidimensional and multidimensional approaches with the marginal maximum likelihood method when a test was composed of several unidimensional subtests with simple structure. Results of this study indicated that item parameter estimation utilizing a multidimensional approach was more precise than item parameter estimation utilizing a unidimensional approach when the number of items in a test or an instrument was small (Zhang, 2012).
Sometimes a complex structure can be approximated to a simple structure where each item depends predominantly and strongly on one primary underlying latent ability and relatively weakly on other secondary latent abilities (Hulin et al., 1983; Strachan et al., 2020; Svetina & Levy, 2016). Svetina et al. (2017) performed a simulation study to investigate the effects of complex structures and the distribution of examinees’ latent ability on item parameter recovery in dichotomous compensatory MIRT models. The results of this study indicated that when latent abilities were skewed, item parameter recovery was generally adversely impacted. In addition, the presence of complexity contributed to decreases in the precision of parameter recovery, particularly for discrimination parameters when at least one latent ability was generated as skewed (Svetina et al., 2017). The components of the aforementioned studies investigated the effects of sample size, model type (2PL or 3PL), the correlation between latent abilities, the distribution of examinees’ ability, and the structure complexity of the data on item parameter estimation. However, to our knowledge, none investigated the effects of the quantity and magnitude of the cross-loading on the secondary dimension and model specification on item parameter estimation.
Method
In this study, we designed a simulation study to investigate the effects of the quantity and magnitude of cross-loading on secondary dimension and model specification (misspecified model vs. correctly specified model) on the precision of item parameter estimation in the MIRT models.
Correlation Between Dimensions
Previous studies investigated the effect of correlation between the dimensions within a variety of simulated correlation levels ranging from .0 to .95 (Bolt & Lall, 2003; Finch, 2010, 2011; Svetina et al., 2017; Zhang, 2012). Bolt and Lall (2003) utilized three levels of correlation between abilities (.0, .3, and .6) to investigate the accuracy of item parameter estimation. Finch (2010) and Finch (2011) investigated the effect of the correlation between latent abilities on item parameter estimation M2PL model. The two latent abilities were simulated to be correlated at .0, .3, .5, or .8. Zhang (2012) utilized three levels of correlation between abilities (.0, .5, and .8) to investigate the precision of item parameter estimation. In the Svetina et al. (2017) study, the correlations between abilities were set to .0, .4, or .7. In the current study, the data were simulated when the correlation between the abilities was set to .0, .6, or .9.
Sample Size
Previous studies have investigated the effect of sample size from 500 of examinees to 5,000 examinees on the item parameter estimation in the MIRT models (Bolt & Lall, 2003; Finch, 2010, 2011; Zhang, 2012). Bolt and Lall (2003) explored the effect of sample size at two levels of 1,000 and 3,000 on item parameter estimation in compensatory and no compensatory MIRT models. Finch (2010) and Finch (2011) simulated the number of examinees at four levels of 250, 500, 1,000, and 2,000 to investigate the item parameter precision under the influence of various sample sizes. Zhang (2012) evaluated item parameter estimation under various conditions and six levels of sample sizes (500, 1,000, 2,000, 3,000, 4,000, and 5,000). In this study, three levels of sample sizes of 500, 1,000, and 2,000 examinees were selected.
Model Specification
To investigate the effect of model specification on item parameter estimation, a correctly specified model and a misspecified model where a simple structure model was applied while the data exhibited cross-loadings.
Table 1 shows the item parameter specifications for a two-dimensional compensatory MIRT model with 10 items primarily measuring each dimension for three different types of cross-loading quantity from Svetina and Levy (2016). Three levels of cross-loading magnitude, the first of which was considered as high magnitude of cross-loading taken from Svetina and Levy (2016) and additional two modified medium and low magnitude of cross-loading on secondary discrimination values.
Item Parameters for 2D Compensatory MIRT Model for 10 Items Per Dimension.
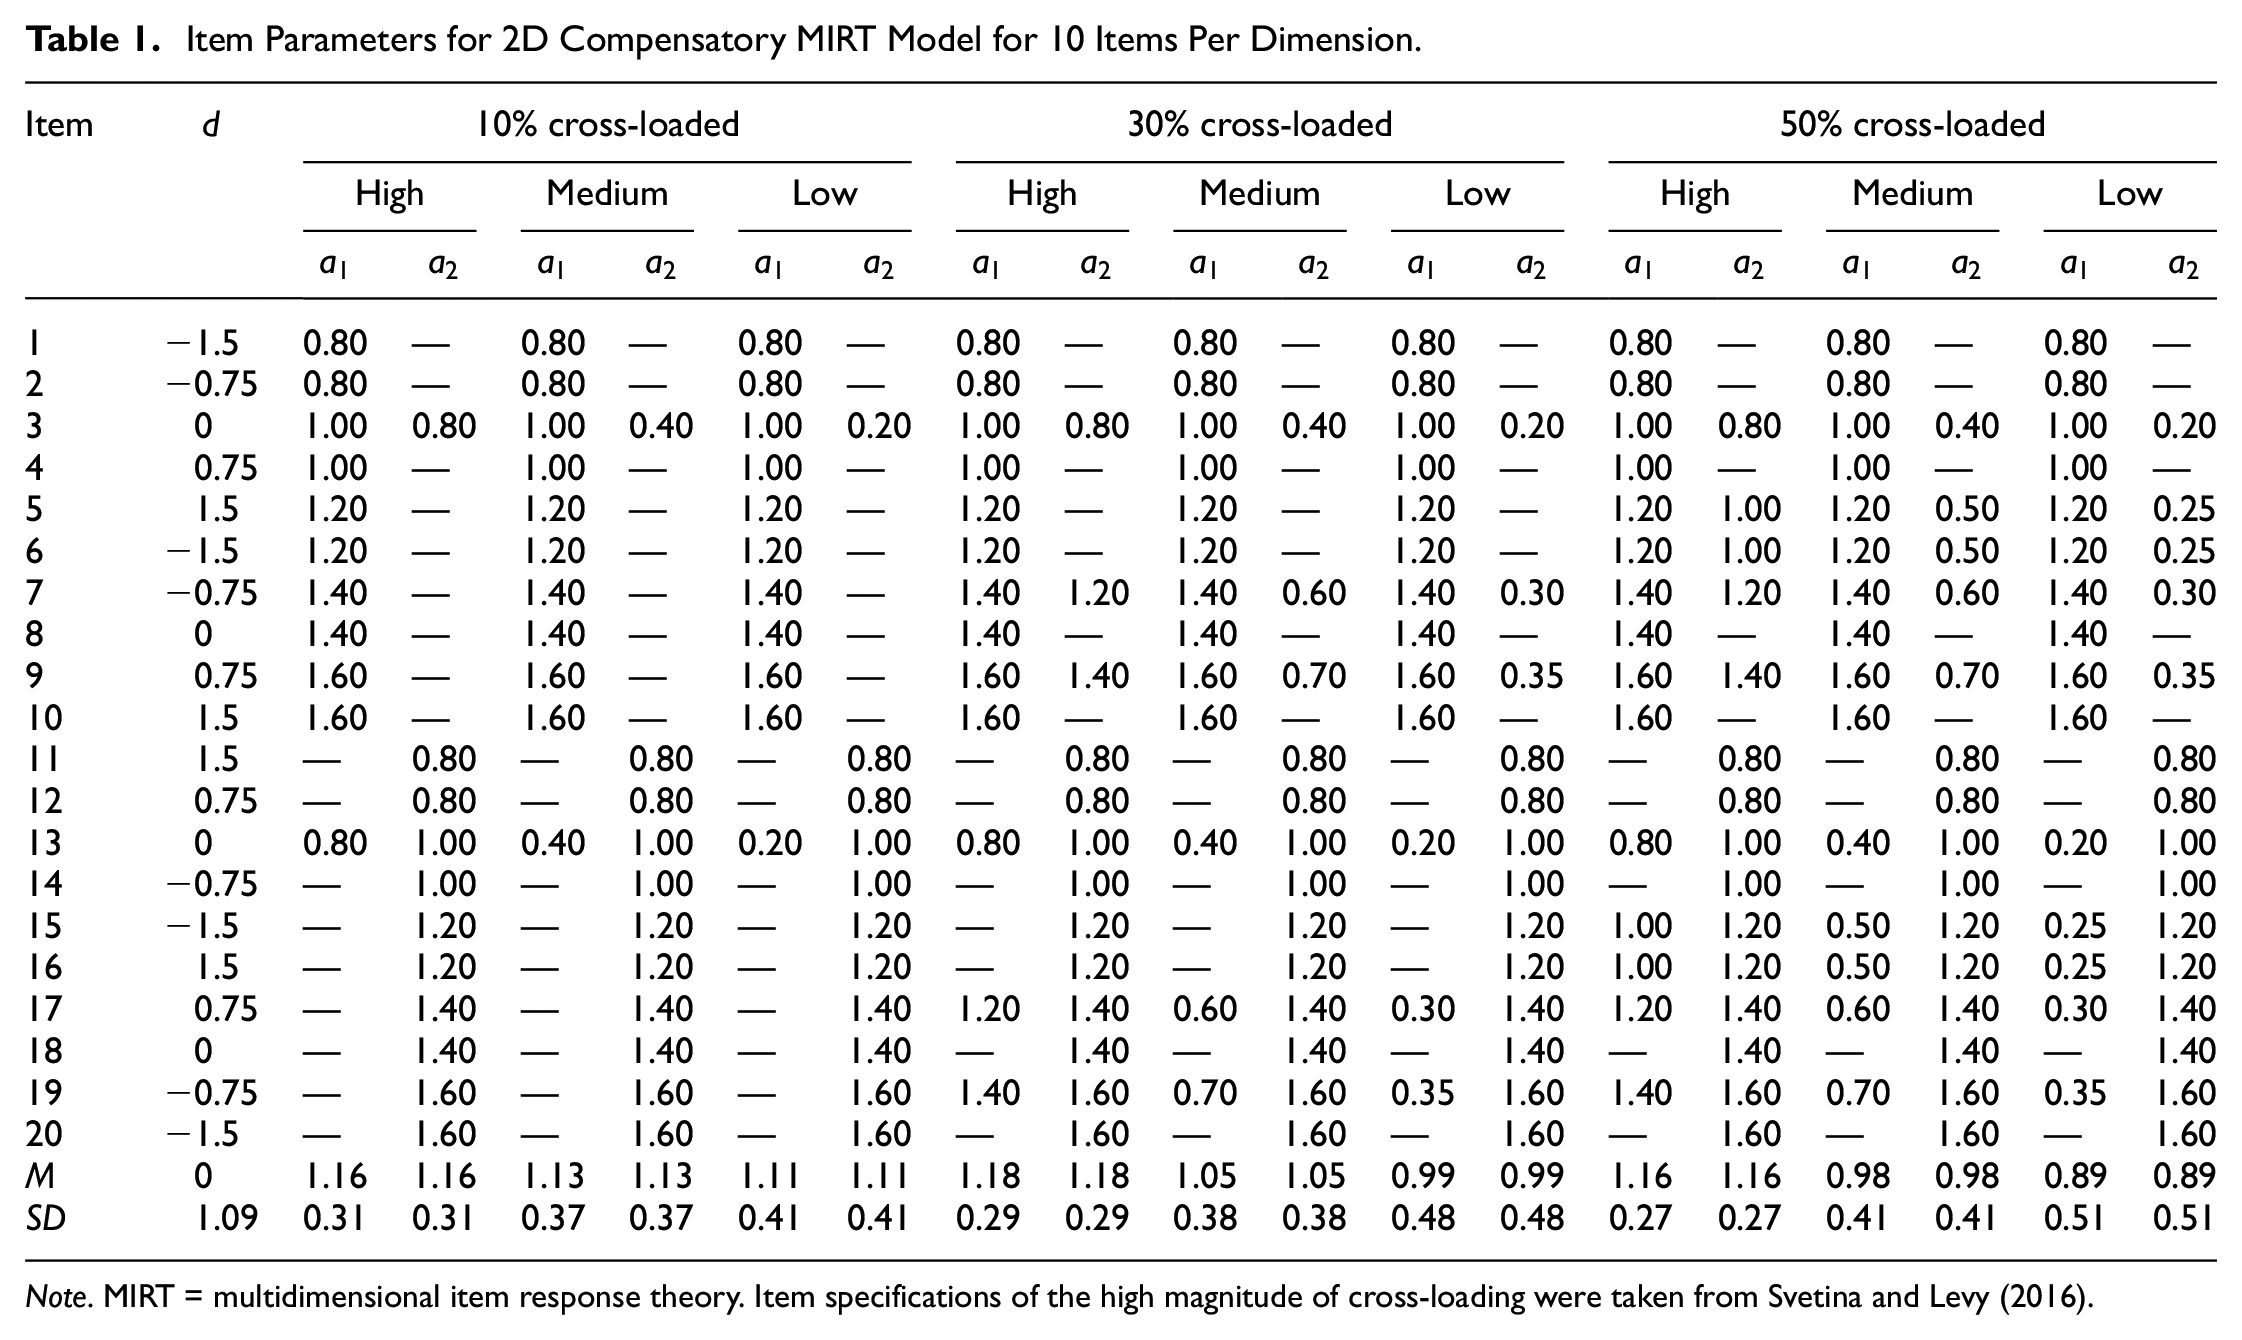
Note. MIRT = multidimensional item response theory. Item specifications of the high magnitude of cross-loading were taken from Svetina and Levy (2016).
Analysis
The described manipulated variables influencing the precision of item parameter estimation in this study led to 162 simulated item–response data sets. Each condition combination was replicated 500 times. A compensatory 2PL MIRT model with two dimensions, a dichotomous item-response type with a standard bivariate normal θ distribution (Reckase, 1985) was used to simulate and calibrate the data for every replication for each condition combination. Parameters were estimated using marginal maximum likelihood, utilizing the expectation-maximization algorithms. R Studio (RStudio Team, 2018) was used for both data generation and item parameter estimation and analyses. The “mirt” package (Chalmers, 2012) was used to generate the simulated item–response patterns for a sample size of 500, 1,000, and 2,000 examinees within each combination of conditions and for item calibration.
Evaluation Criteria
To investigate the effect of the manipulated variables, estimated item parameters within each condition across the 500 replications were compared with the true item parameters. Root mean square of error (RMSE) and bias (B) were calculated to evaluate the performance and accuracy of each item parameter estimated, that is, discrimination and location, within each combination of conditions across 500 replications.
Results
The described manipulated variables influencing the precision of item parameter estimation in this study led to 162 simulated item–response data sets. Each condition combination was replicated 500 times. Within each combination of conditions across the 500 replicated datasets of item–response data, the estimated item discriminations on each dimension (
Section I: RMSE
Item Discrimination Parameters
The RMSEs were averaged for the estimated item discrimination parameters and the estimated item location parameter within each combination of conditions for three sets of item cross-loading. When a model was correctly specified, some items had a cross-loading and others did not. For those items with a cross-loading,
Discrimination Parameter Specification for Correct Model Specification and Number of Items Within Each Specification.
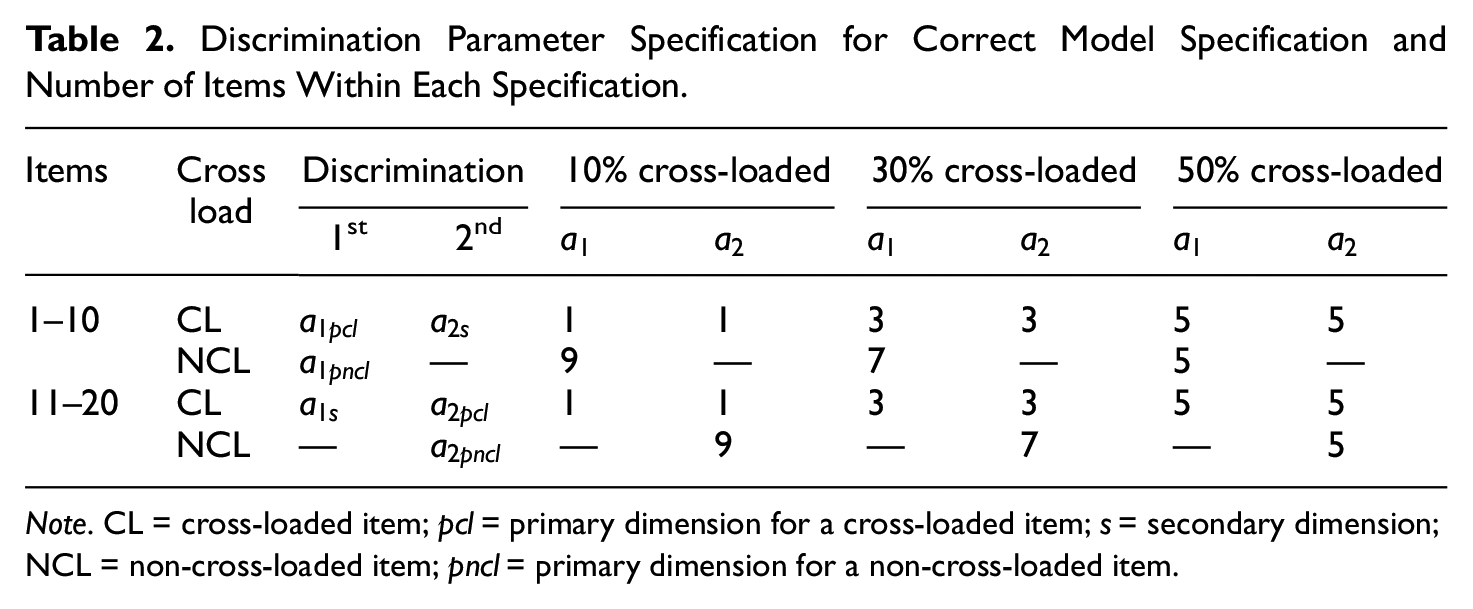
Note. CL = cross-loaded item;
Primary Item Discrimination Parameters
Table 3 shows the average RMSEs of the estimated item discrimination parameters when the models were correctly specified considering three levels of cross-loading quantity incorporating low, medium or high magnitude of cross-loading. As shown in Table 3, the average RMSEs for the primary cross-loaded item discrimination parameters on the first dimension (
Average RMSE of the Primary (CL and NCL) and Secondary Discrimination on the First and Second Dimensions When the Models Were Correctly Specified.
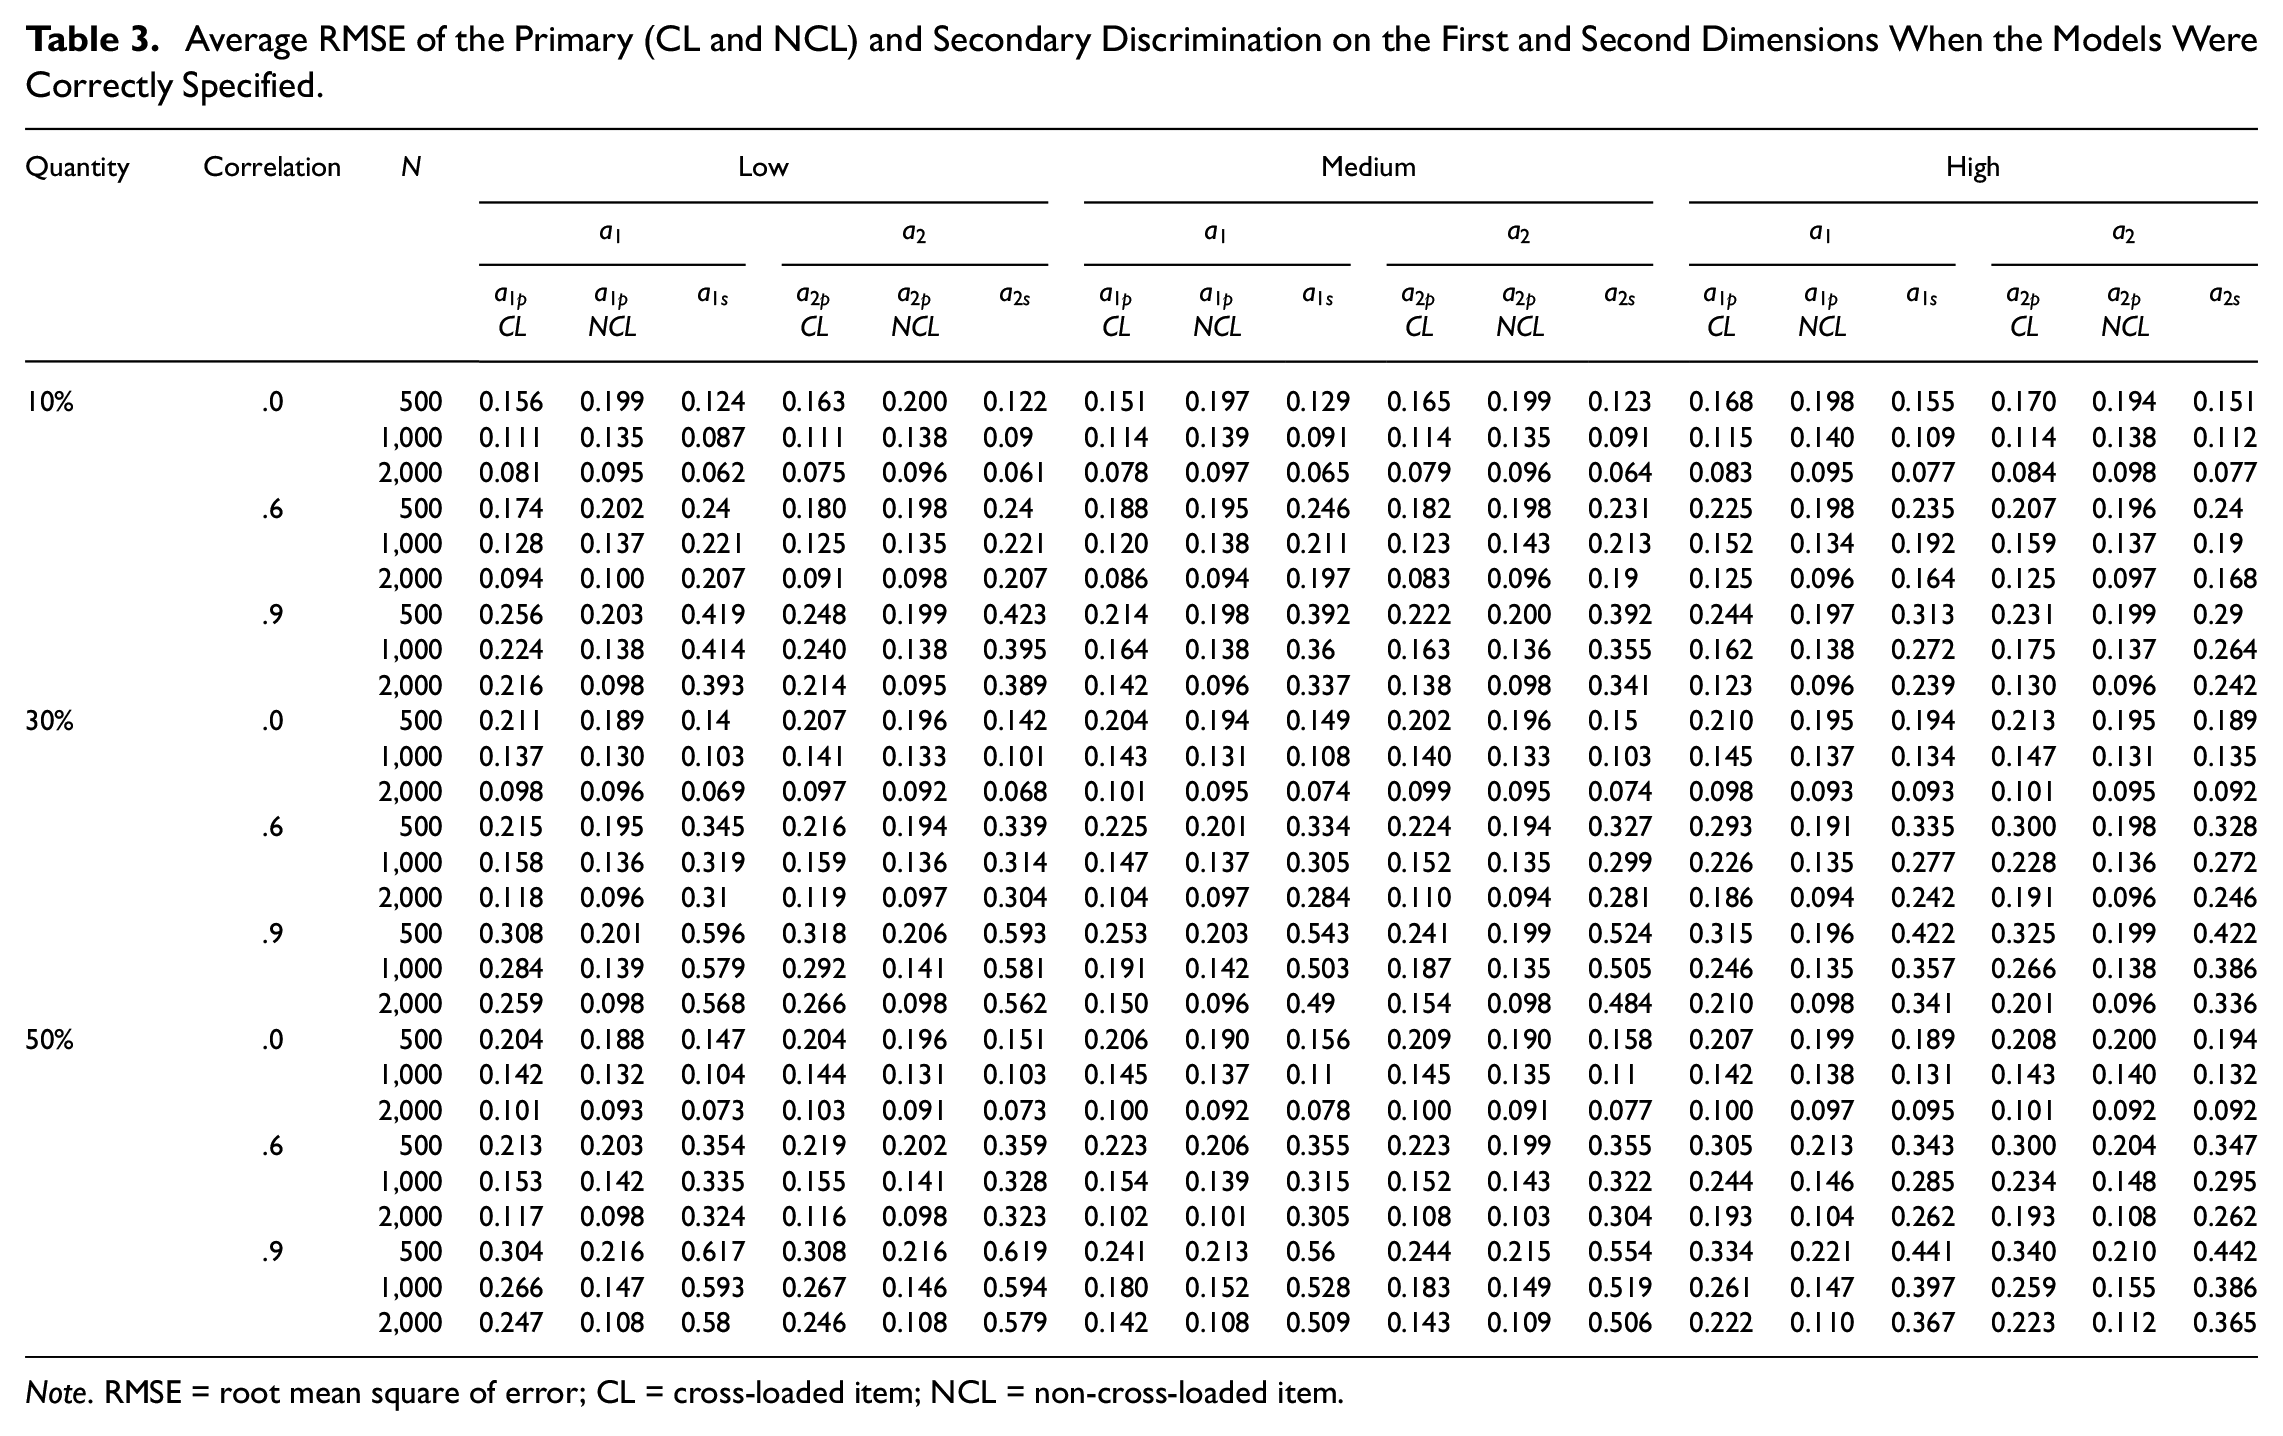
Note. RMSE = root mean square of error; CL = cross-loaded item; NCL = non-cross-loaded item.
In misspecified models, the misspecification specifically occurs on the cross-loaded items, ignoring the cross-loading. Table 4 reports the average RMSEs of the estimated item discrimination parameters when the models were misspecified considering three levels of quantity of cross-loading incorporating low, medium, or high magnitude of cross-loading. As shown in Table 4, the average RMSEs for the truly primary cross-loaded item discrimination parameters on the first dimension (
Average RMSE of the Truly Primary (CL and NCL) on the First and Second Dimensions When the Models Were Misspecified.
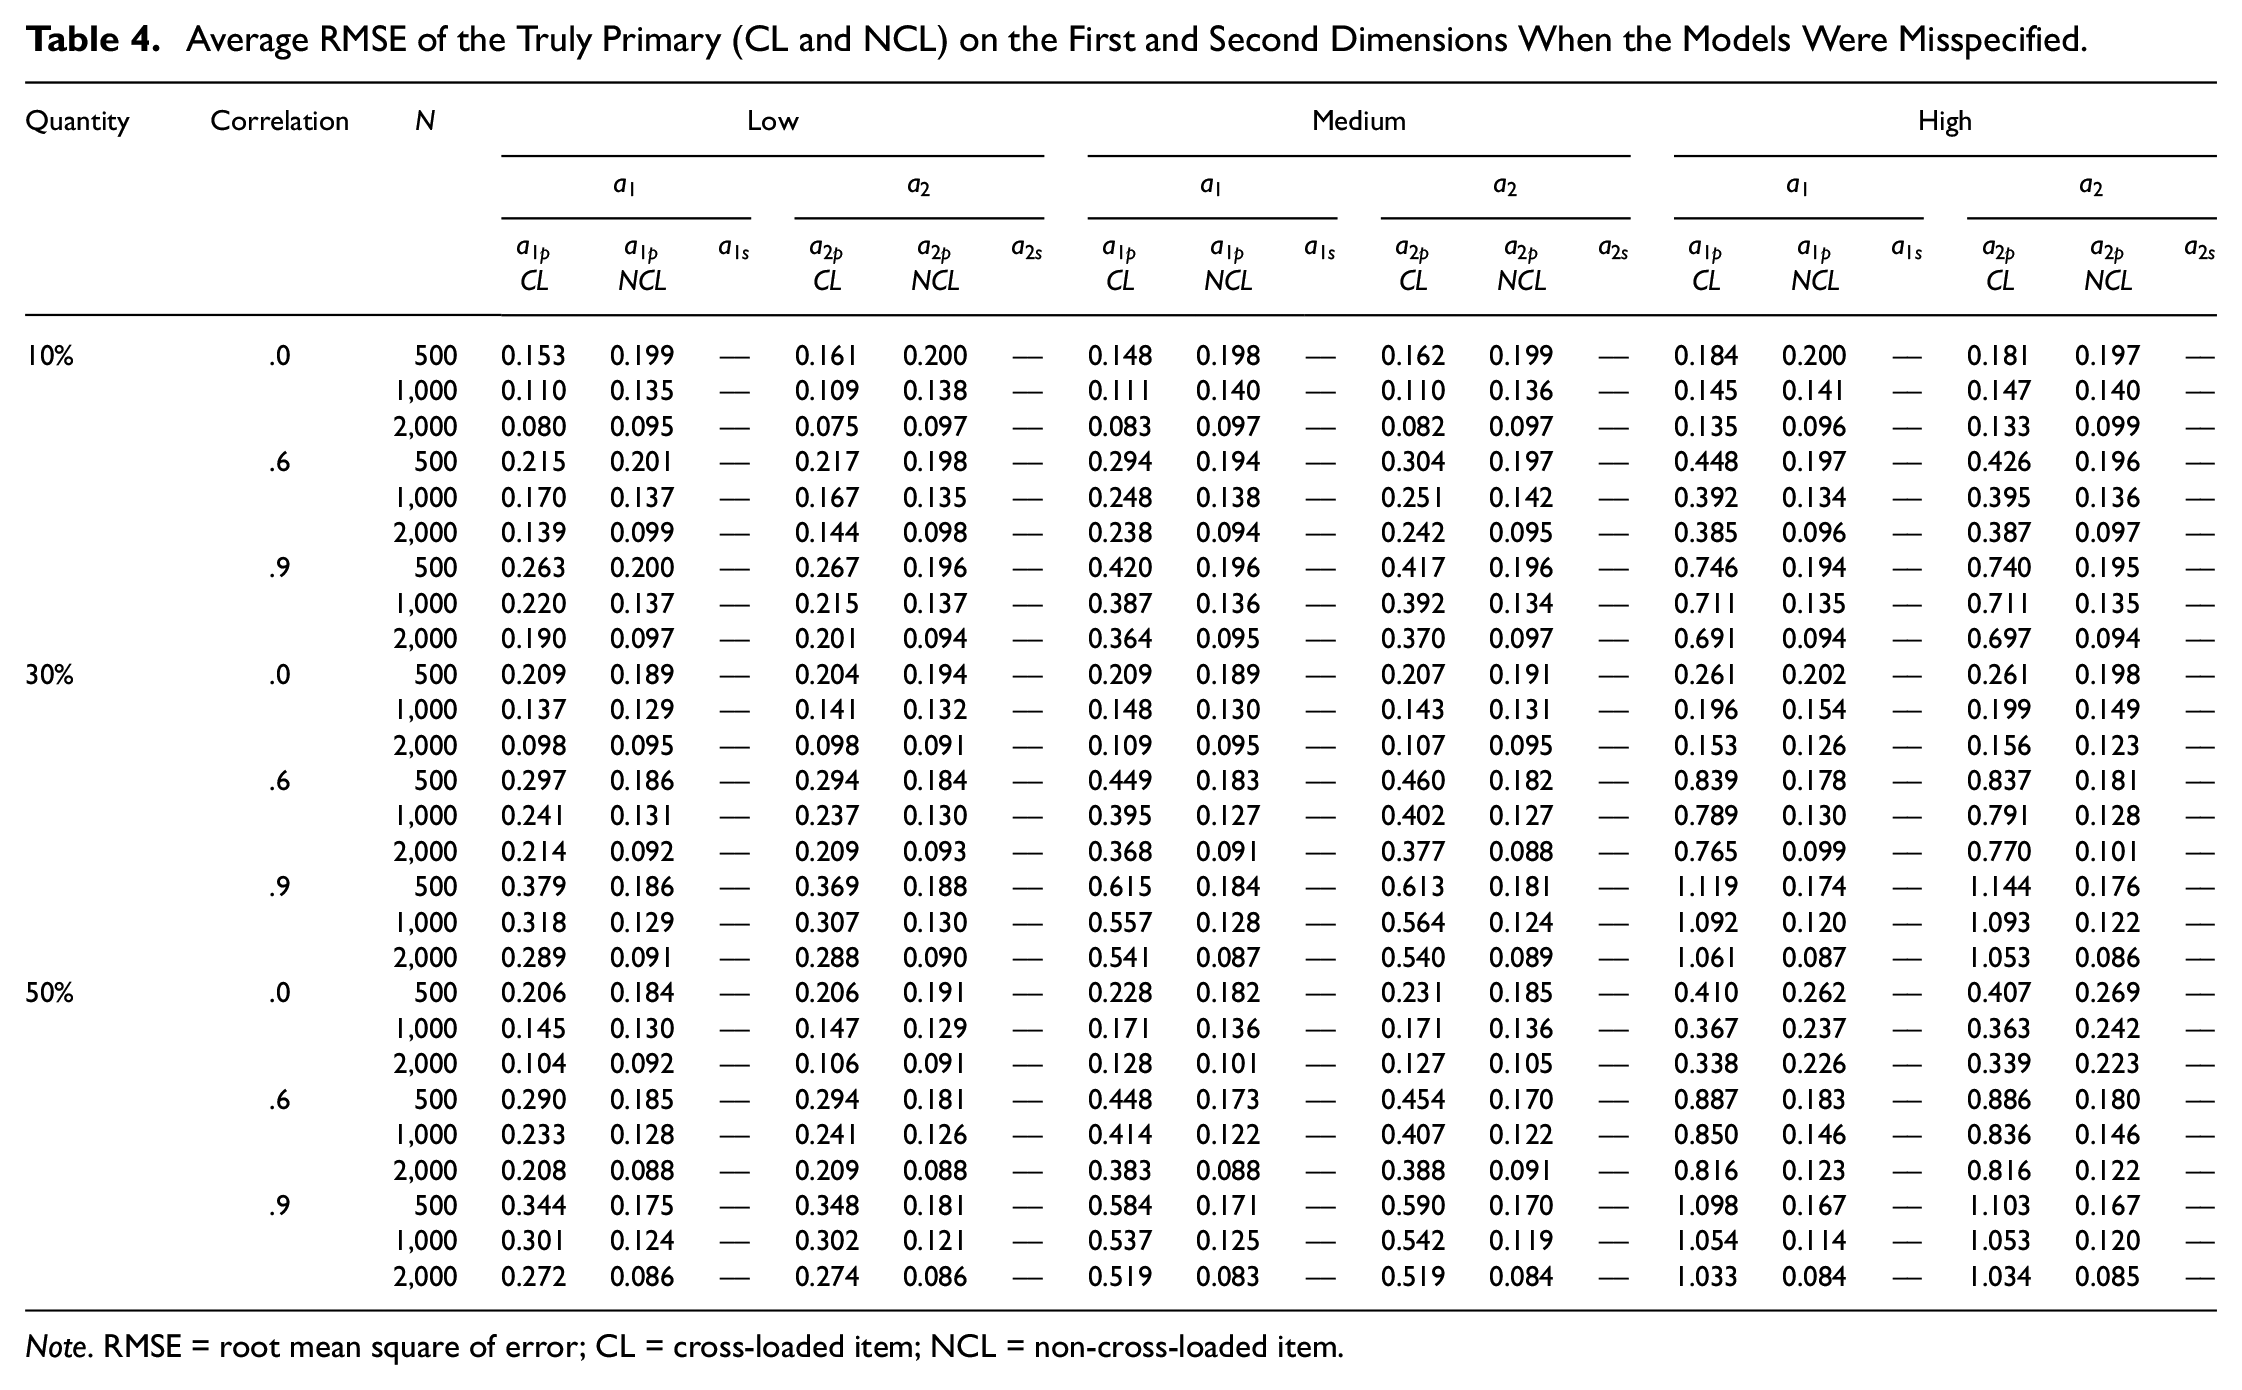
Note. RMSE = root mean square of error; CL = cross-loaded item; NCL = non-cross-loaded item.
Secondary Item Discrimination Parameters
As shown in Table 3, the average RMSEs for the secondary item discrimination parameter for the first dimension (
Item Location Parameter (
)
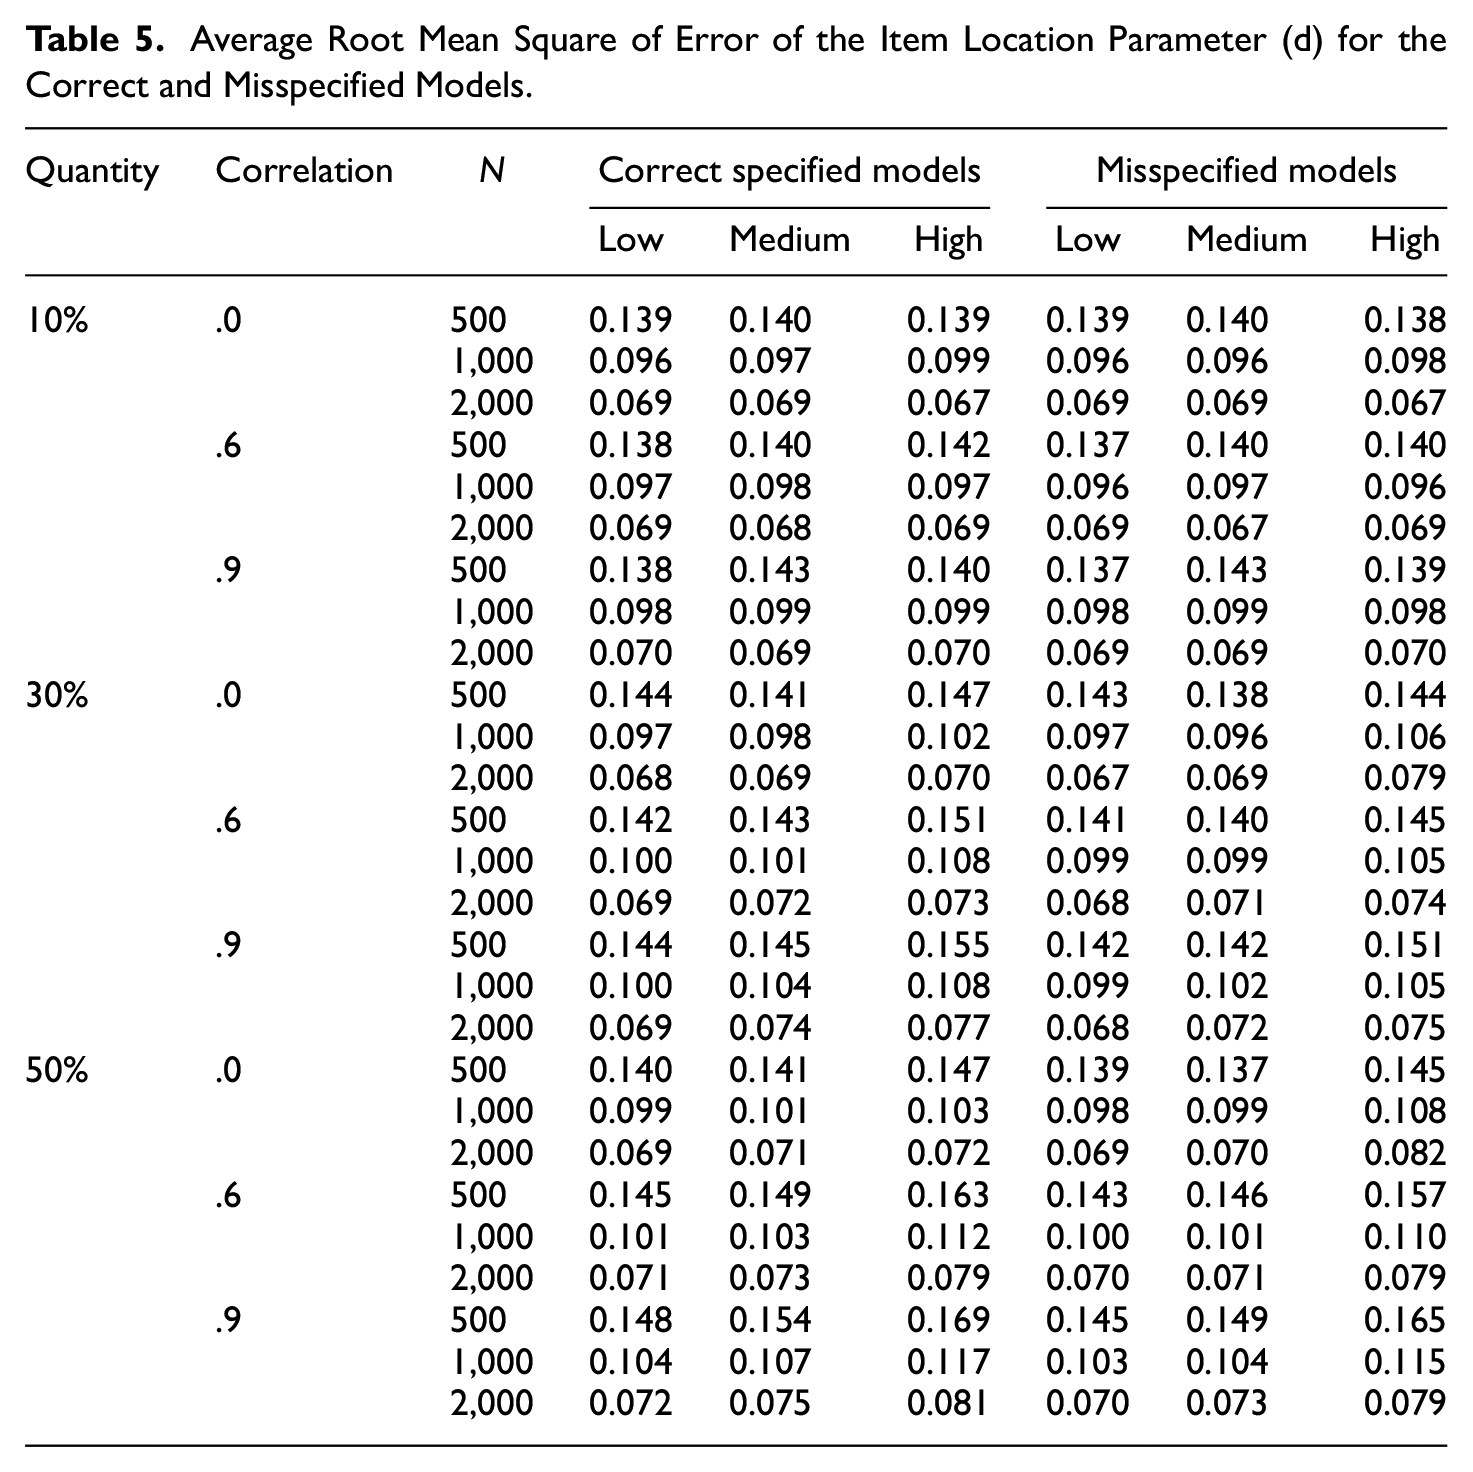
Table 5 shows the average RMSEs for the item location parameter (
Average Root Mean Square of Error of the Item Location Parameter (d) for the Correct and Misspecified Models.
Effect of Sample Size (RMSE)
Aligned with the previous studies (Bolt & Lall, 2003; Finch, 2010, 2011; Zhang, 2012), the results of this study indicated that item parameter recovery performed better in terms of RMSE as the sample size increased. As shown in Figures 2 and 3, all of the item discrimination parameters including primary and secondary item discrimination on first and second dimensions (
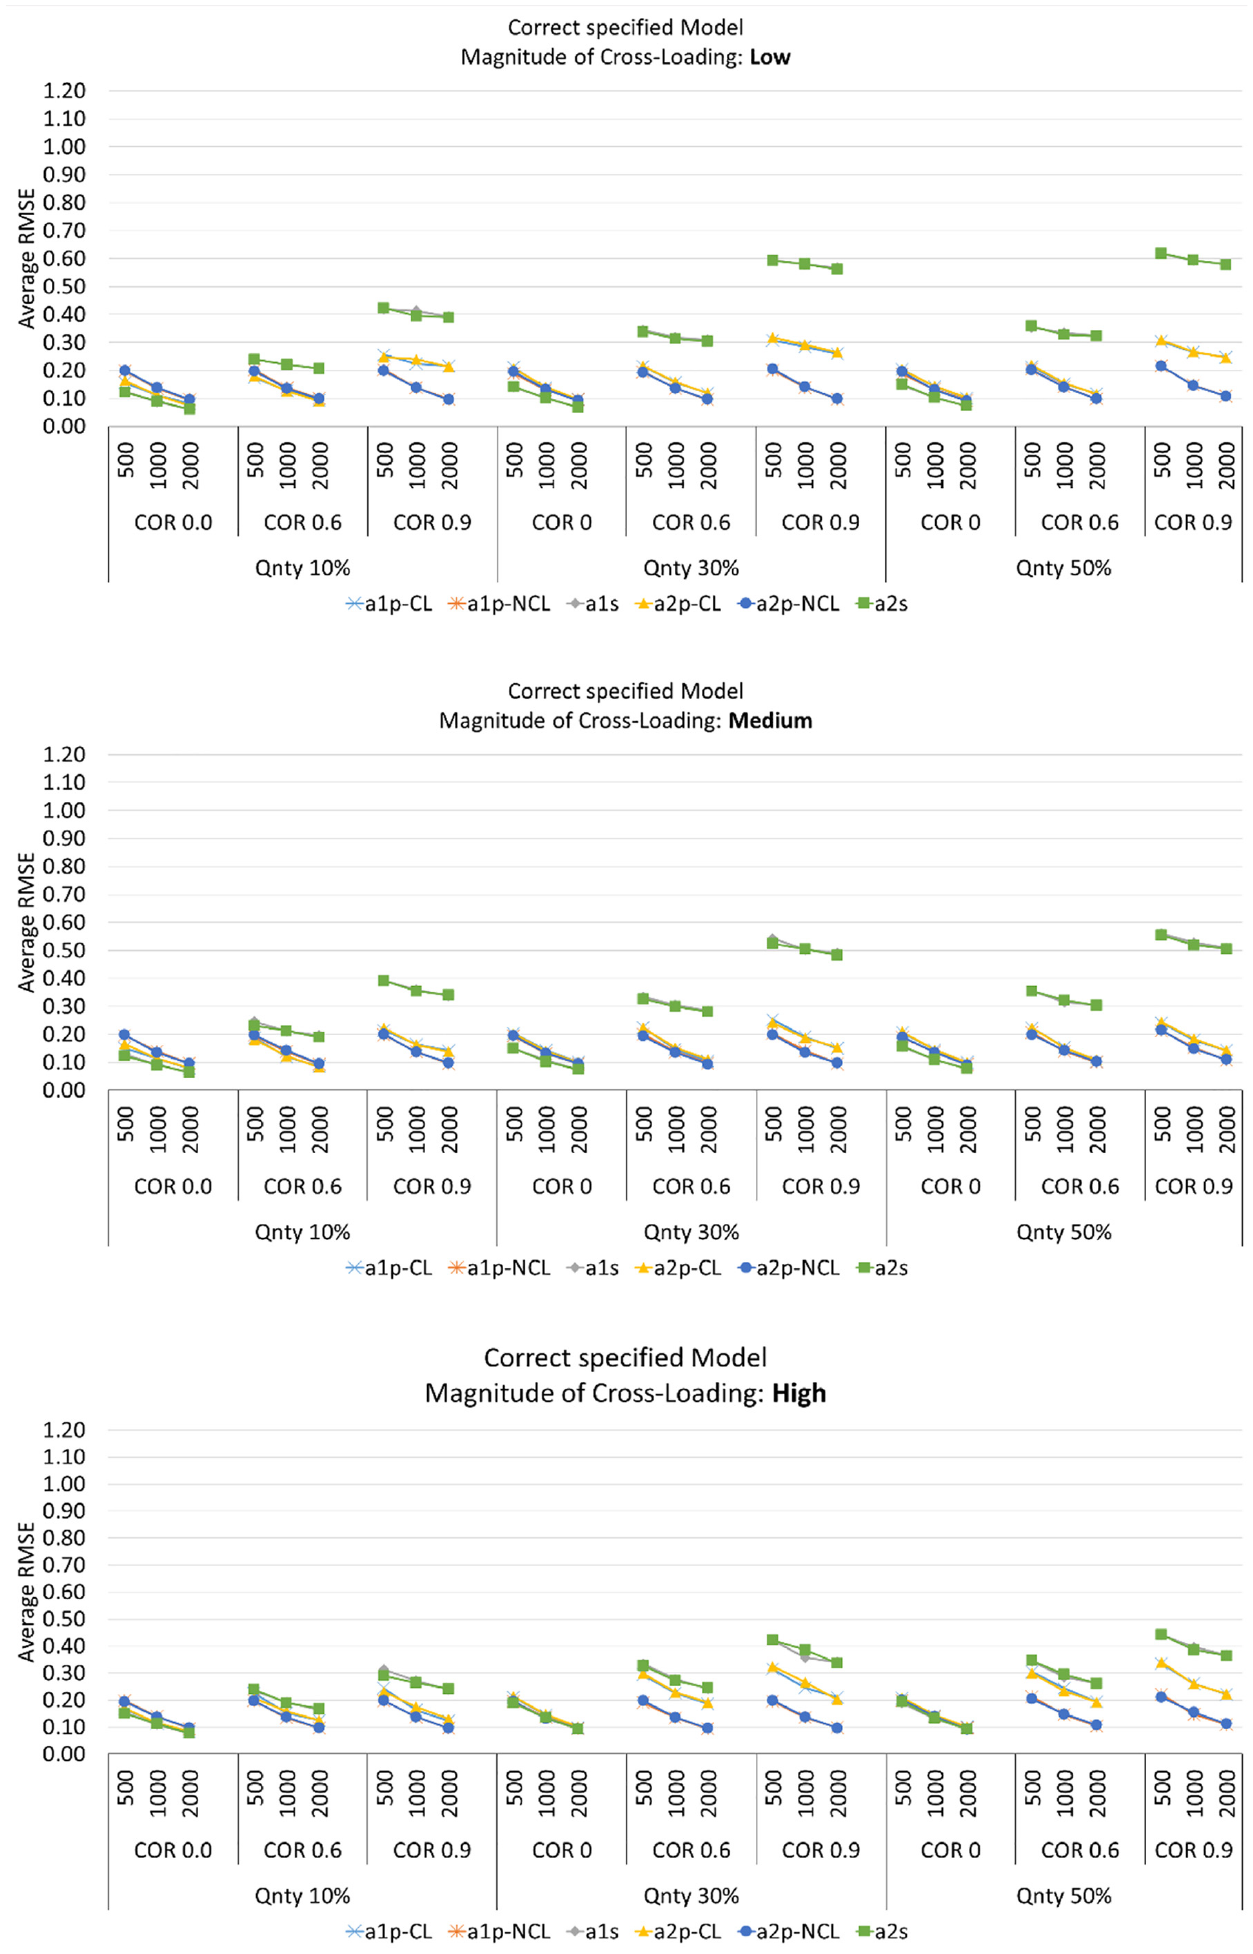
Average RMSE for Item Discrimination Parameters When the Models Were Correctly Specified.
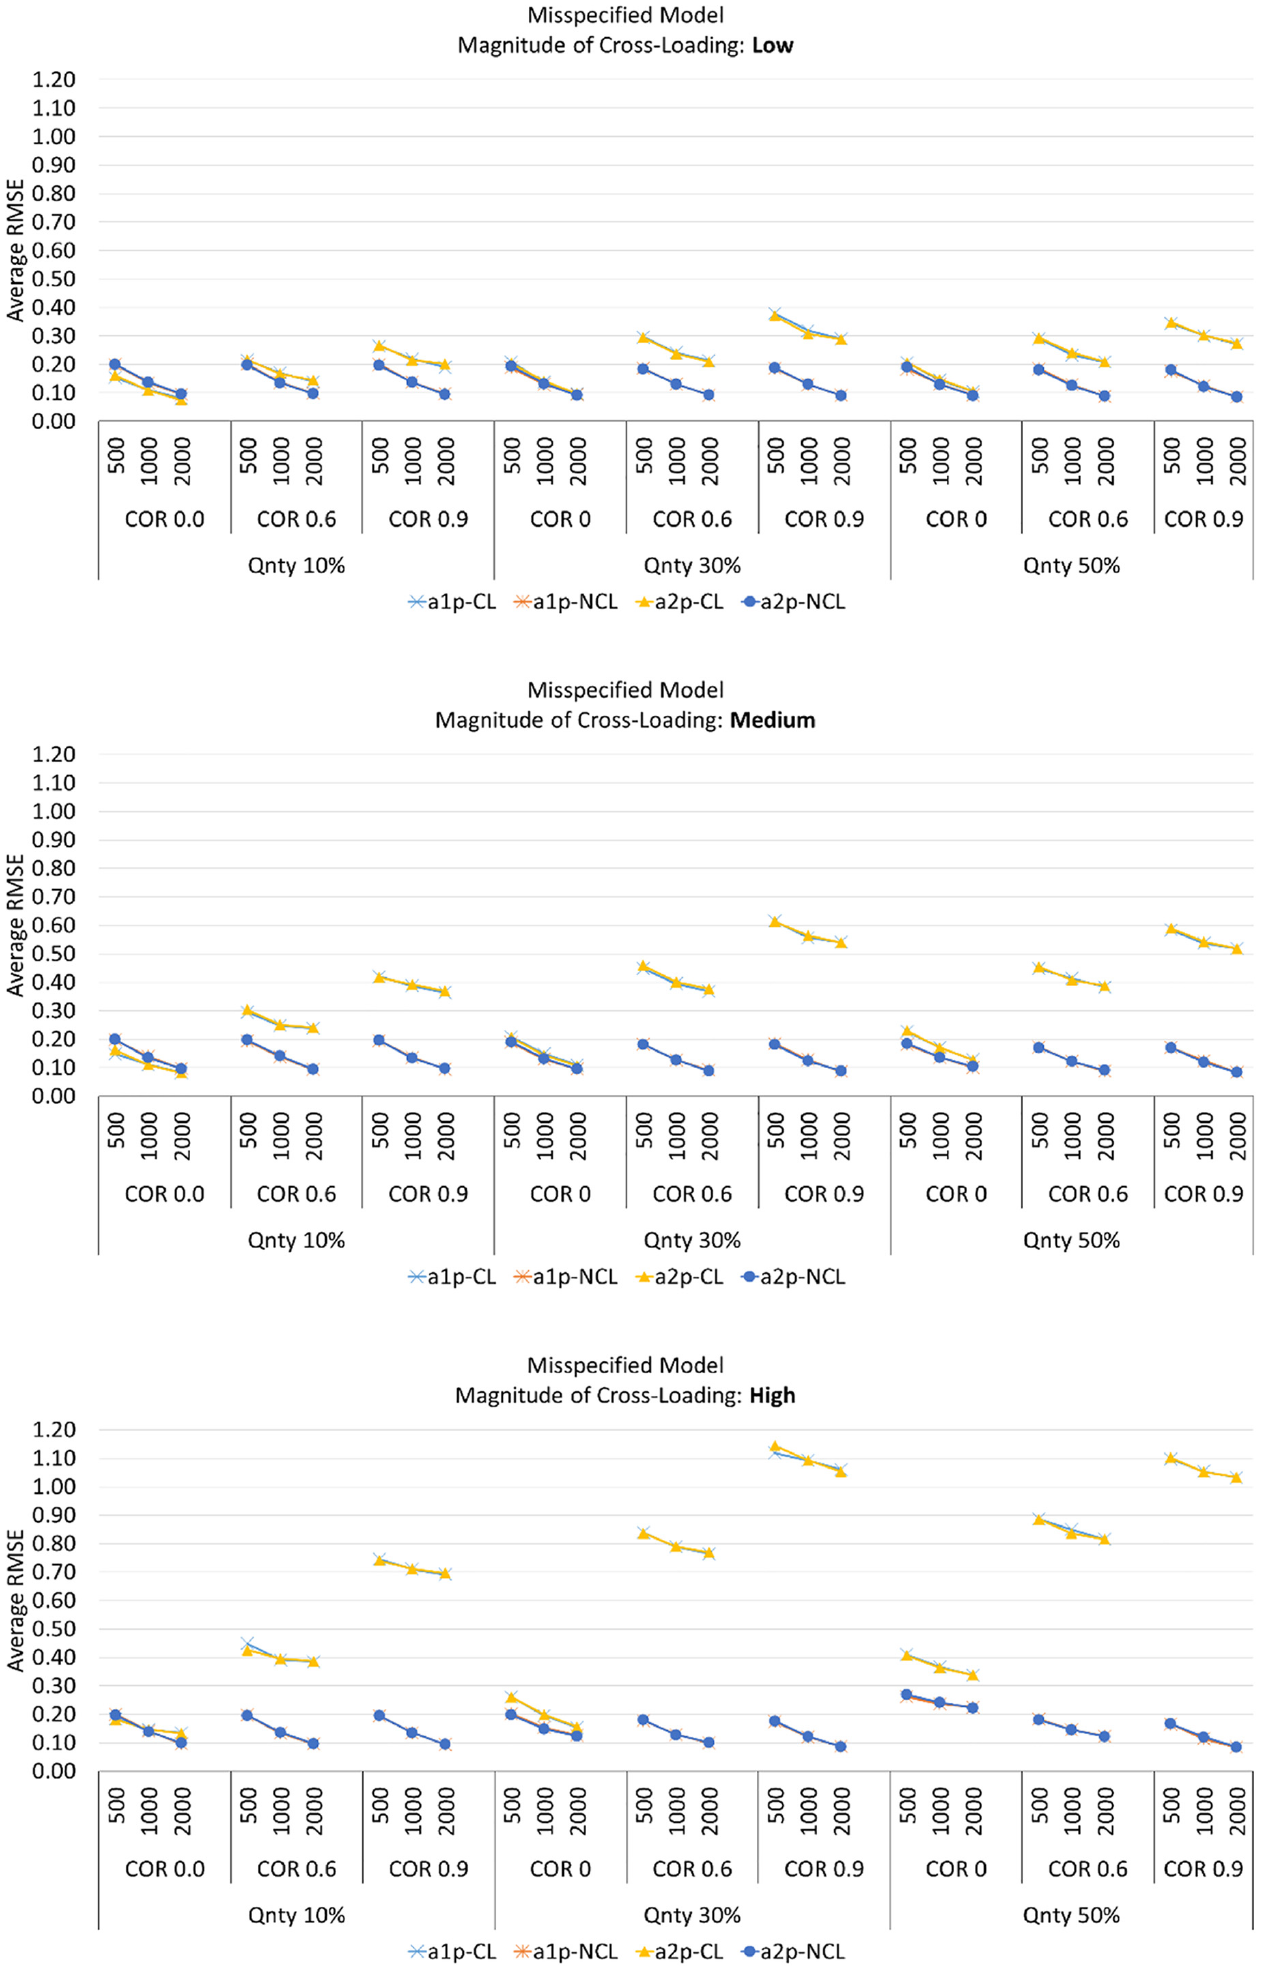
Average RMSE for Item Discrimination Parameters When the Models Were Misspecified.
Effect of Correlation (RMSE)
For the correctly specified models, when the sample size and quantity of cross-loading were held constant for each section while the correlation between abilities varied across the conditions, the average RMSEs increased consistently for the primary and secondary item discriminations on both dimensions (
Correlation had very little to no effect on the RMSE of estimated item discrimination for the primary non-cross-loaded items; as correlation increased, the RMSE of the estimated item discrimination for primary cross-loaded items tended to decrease (a slight increase in RMSE when correlation increased from .0 to .6 and a larger increase when RMSE increased from .6 to .9). As correlation increased, the RMSE of the estimated item discrimination on the secondary dimension increased substantially. This may be due to the lack of freely estimated correlation in the model specification when calibrating the simulated data; all models assumed a correlation of .0 (Figure 2).
For the misspecified models, when the sample size and the quantity of the cross-loaded items were held constant for each section while the correlation between abilities varied across the conditions, the average RMSEs of the item discrimination parameter for the truly cross-loaded item (i.e., the model did not account for these cross-loadings) on first and second dimensions (
Effect of the Quantity of Cross-Loaded Items (RMSE)
When the model was correctly specified the average RMSEs increased consistently for the primary cross-loaded and secondary item discrimination parameters on both dimensions (
Effect of the Magnitude of Cross-Loading (RMSE)
The changes in the magnitude of cross-loading from low to medium to high had very little effect on the average RMSEs of item discrimination on non-cross-loaded items on both dimensions (
Section II: Average Bias
Average bias in each combination of conditions was calculated by comparing the true item parameter specification with the estimated item parameter. For the item discrimination parameters (
Item Discrimination Parameters
Tables 6 and 7 report the average bias of the estimated item discrimination parameters when the models were correctly specified and misspecified, respectively. In the correct specified models, the average bias for the primary cross-loaded item discrimination parameters on the first dimension (
Average Bias of the Primary (CL and NCL) and Secondary Discrimination on the First and Second Dimensions When the Models Were Correctly Specified.
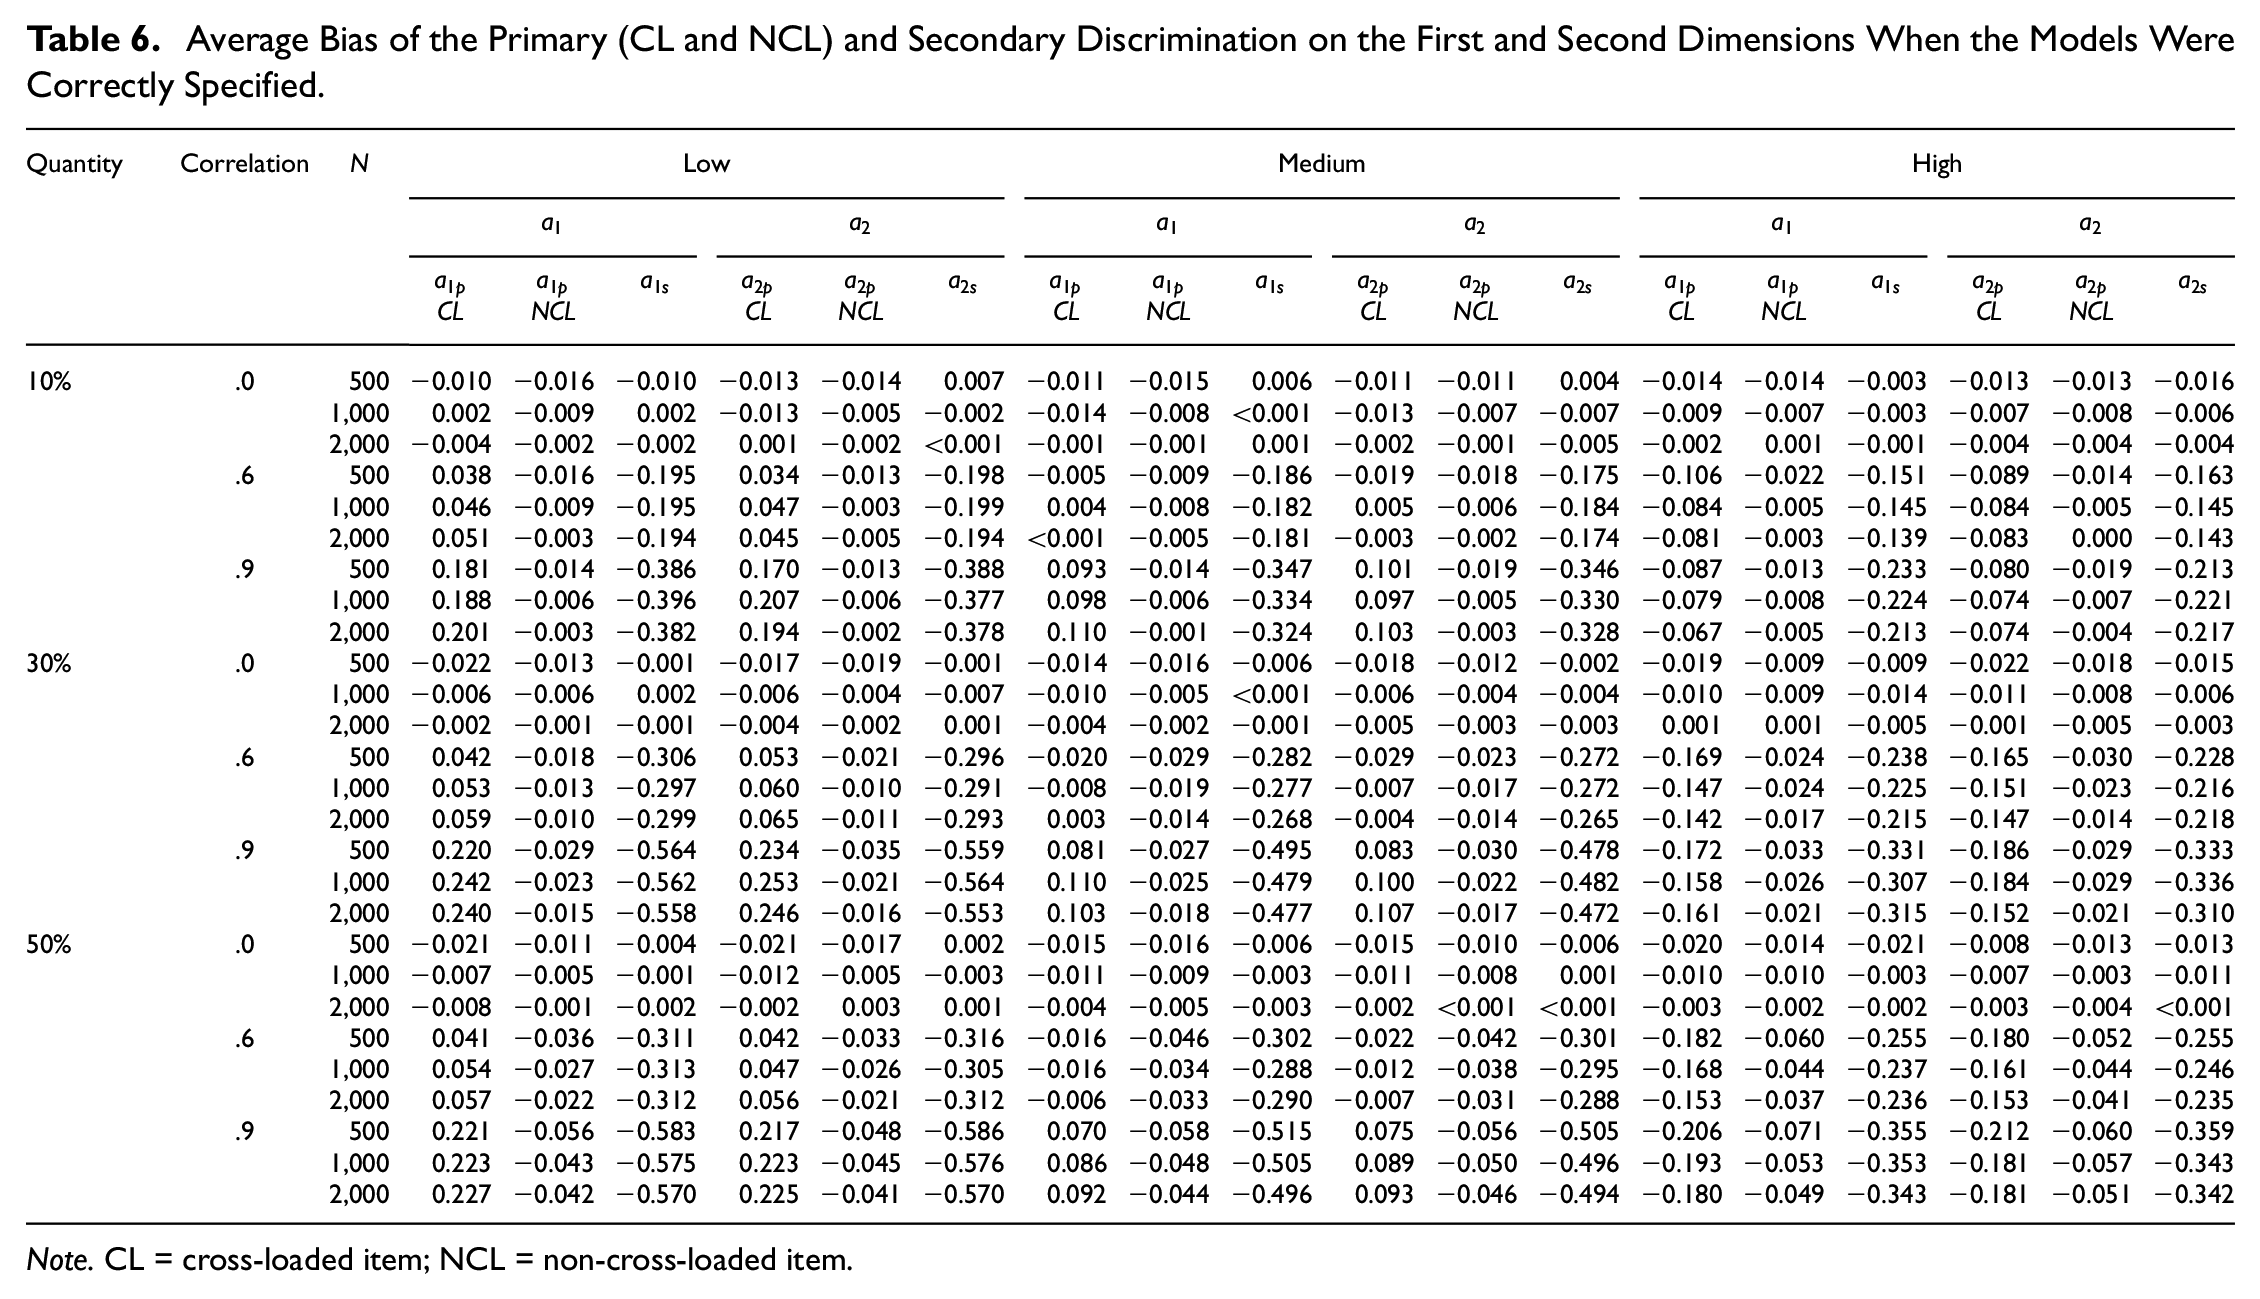
Note. CL = cross-loaded item; NCL = non-cross-loaded item.
Average Bias of the Truly Primary (CL and NCL) on the First and Second Dimensions When the Models Were Misspecified.
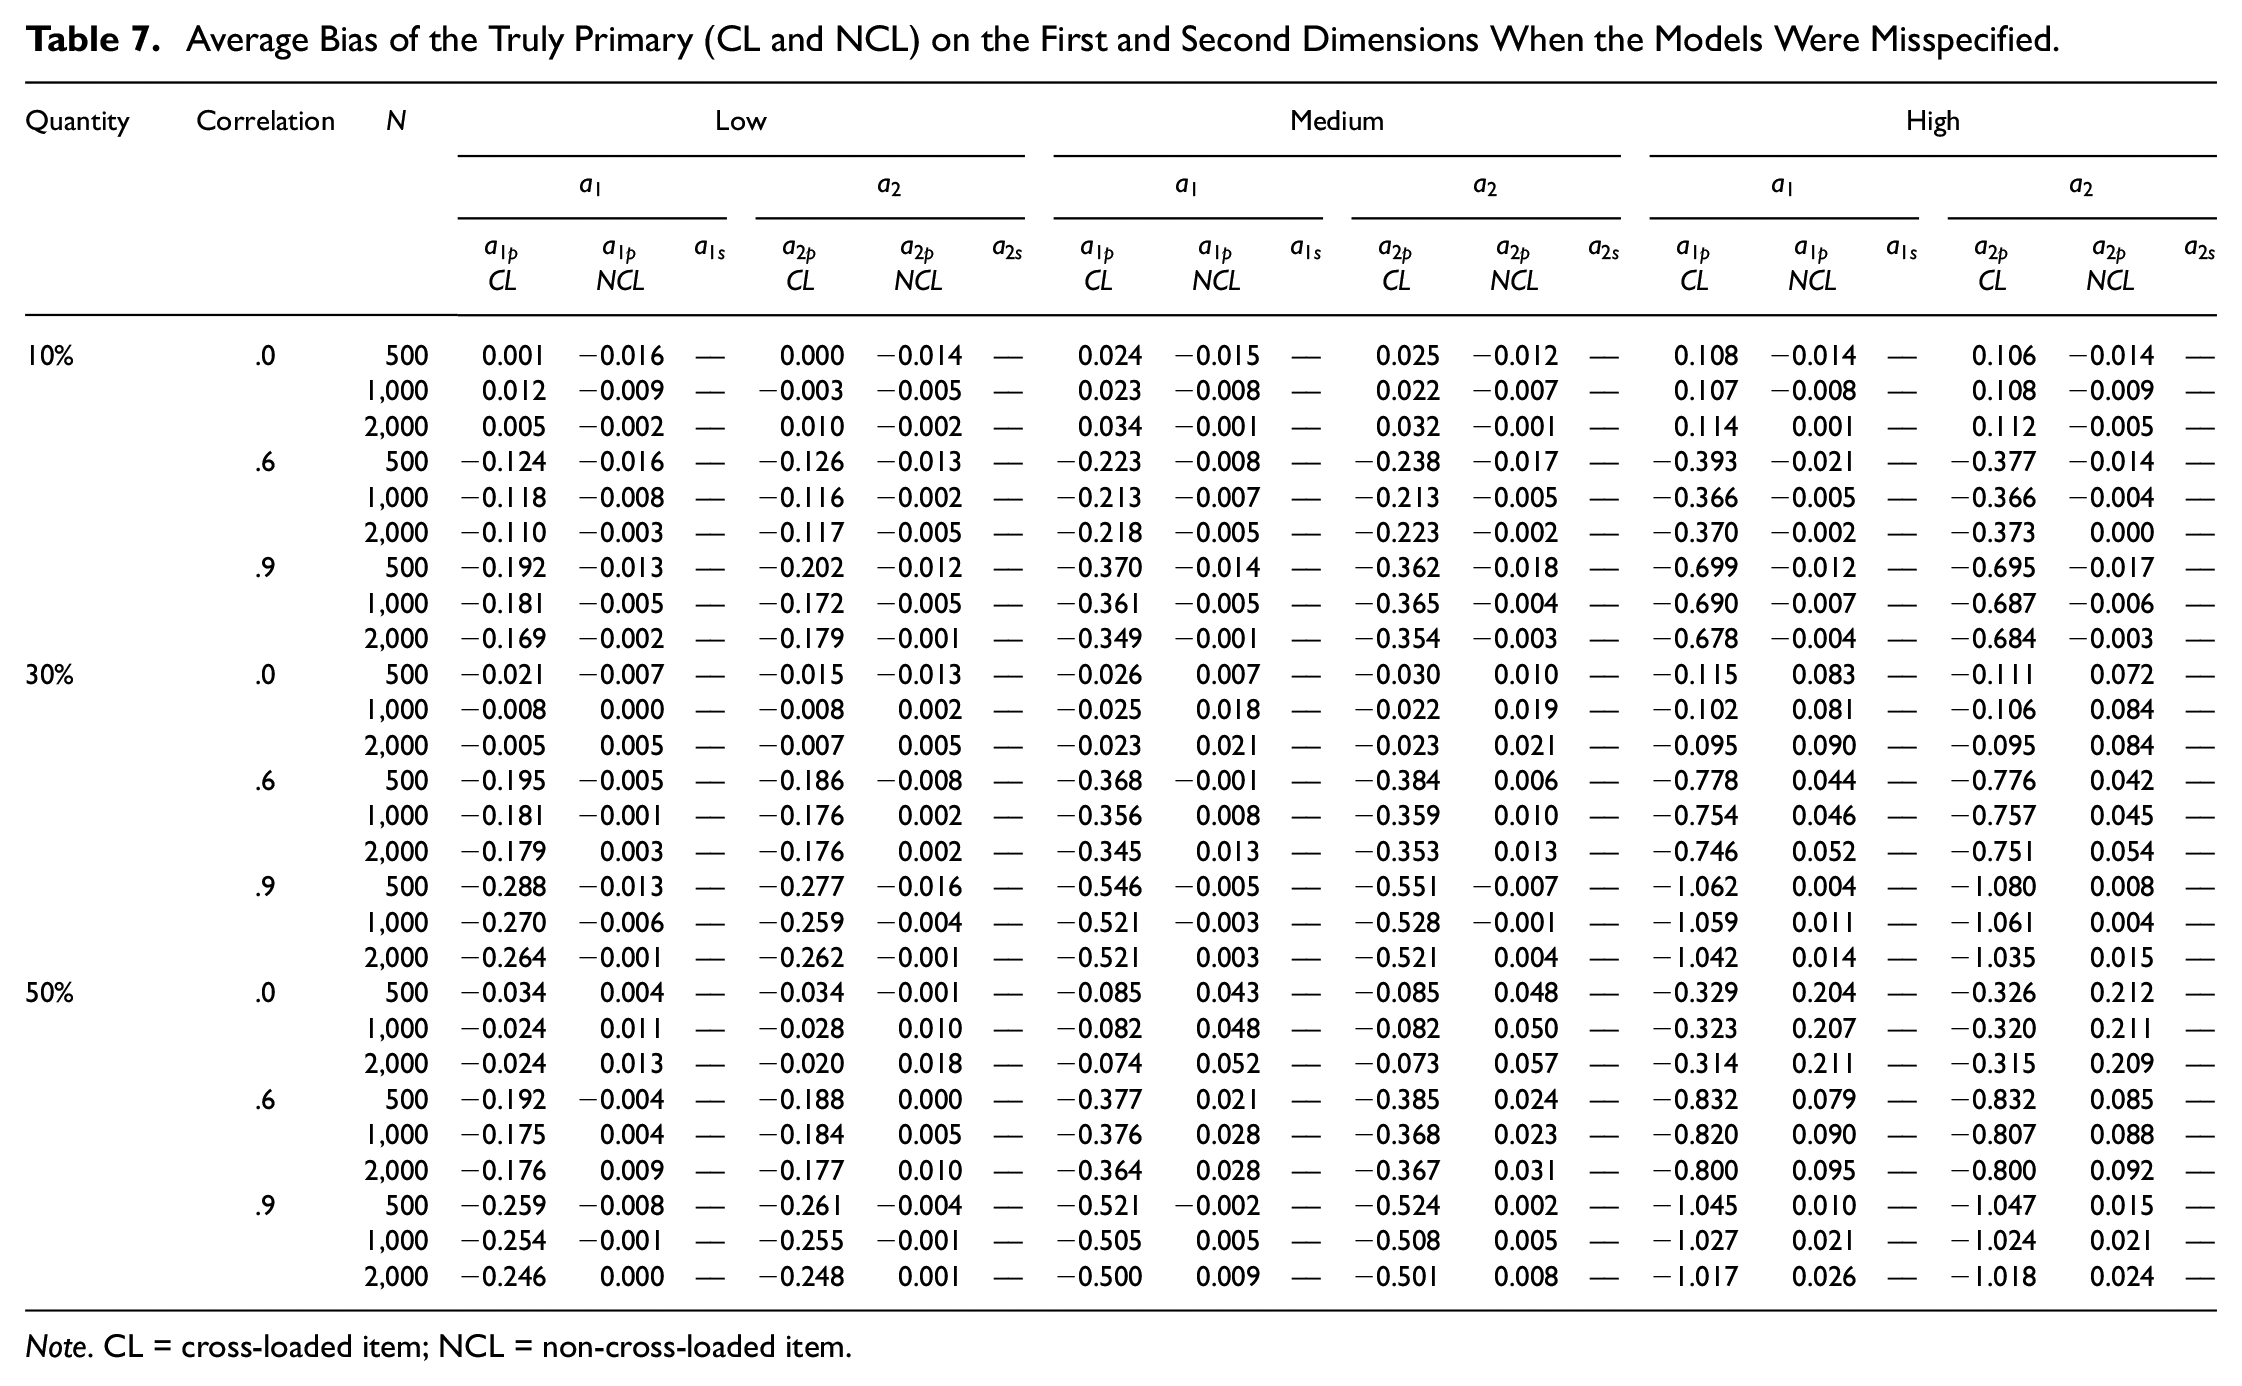
Note. CL = cross-loaded item; NCL = non-cross-loaded item.
In misspecified models, the average bias for the truly primary cross-loaded item discrimination parameters (i.e., items that were supposed to be specified as cross-loaded) on the first dimension (
Item Location Parameter (
)
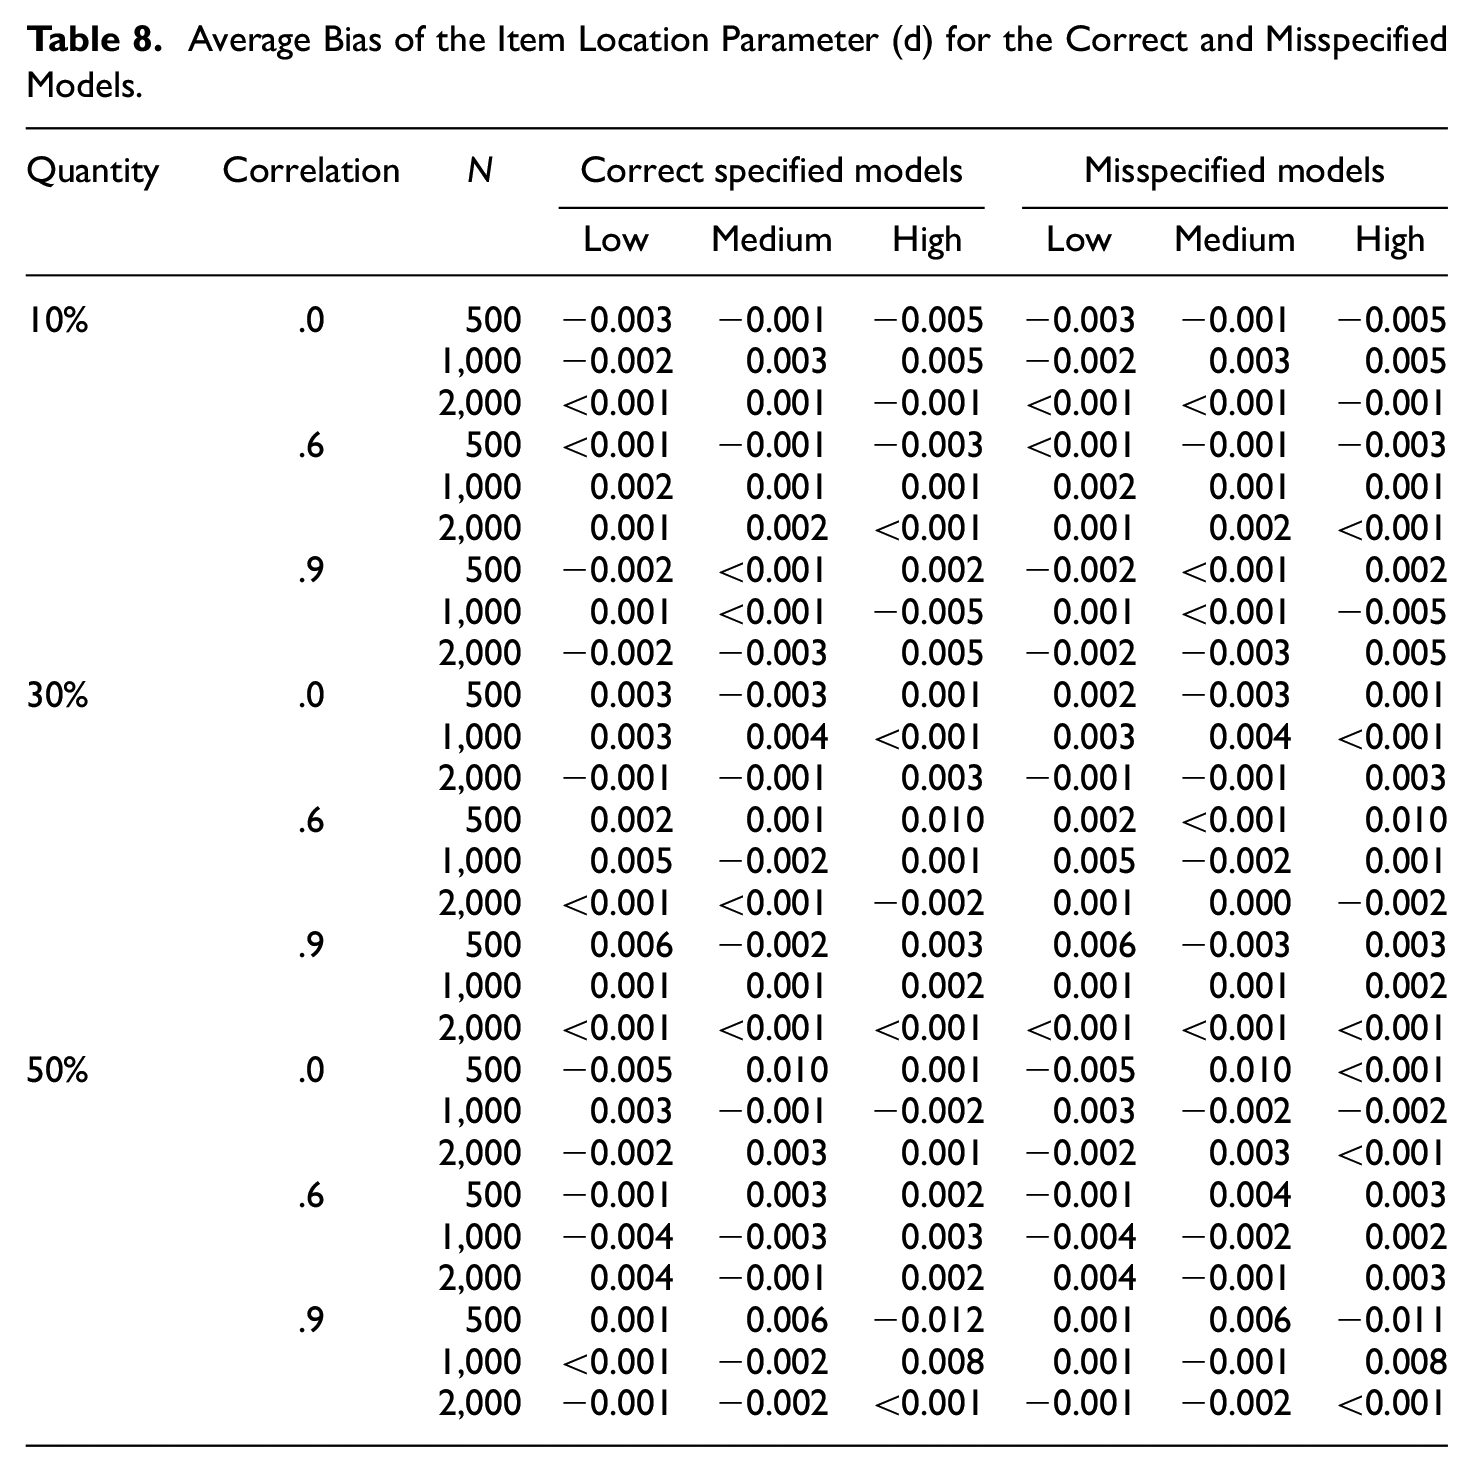
Table 8 reports the average bias for the item location parameter (
Average Bias of the Item Location Parameter (d) for the Correct and Misspecified Models.
Effect of Sample Size (Bias)
For both the correct specified and misspecified models all of the item discrimination parameters including primary and secondary item discrimination on first and second dimensions (
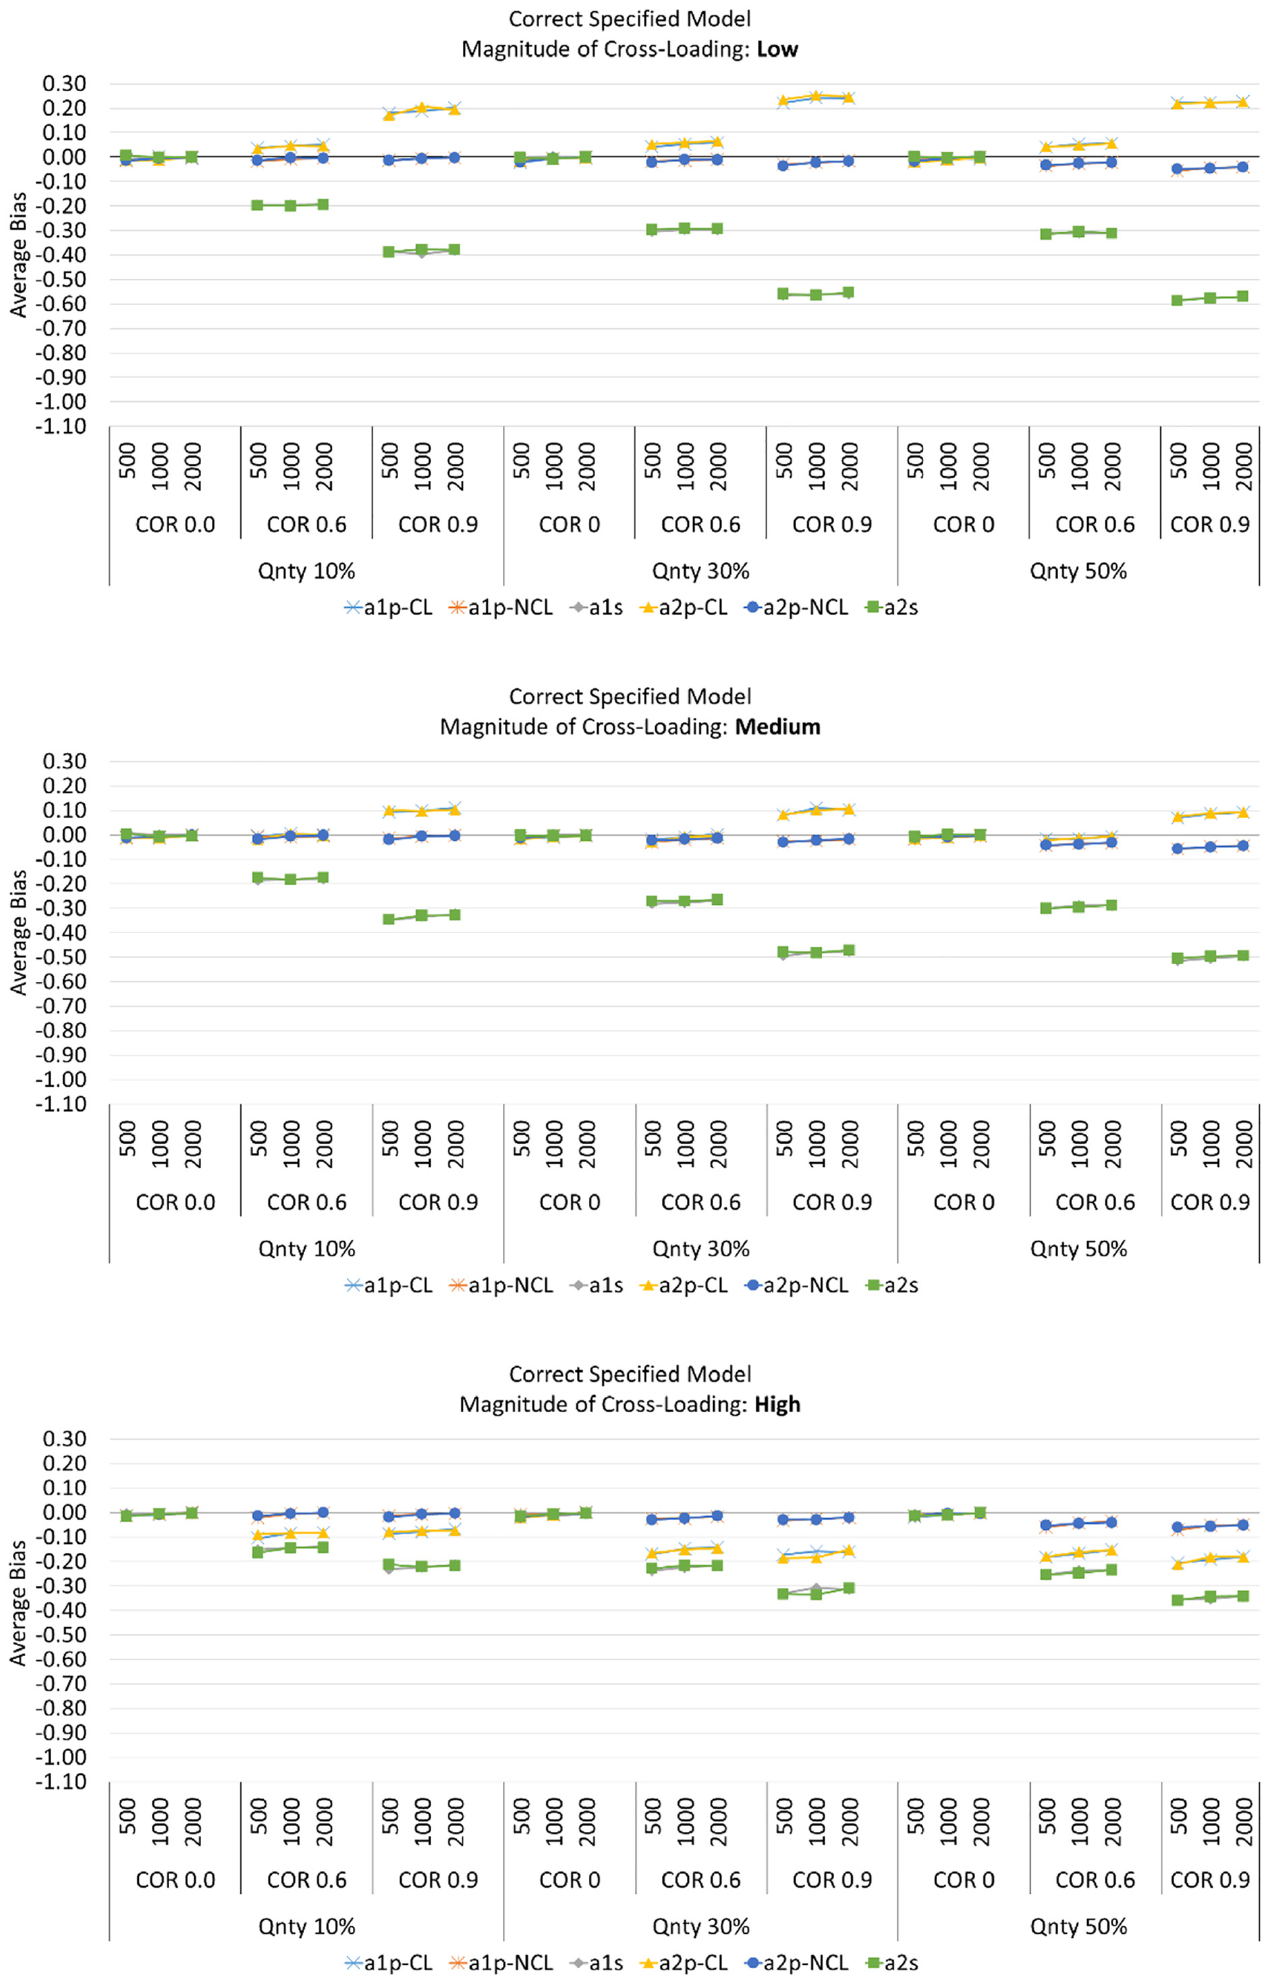
Average Bias for Item Discrimination Parameters When the Models Were Correctly Specified.
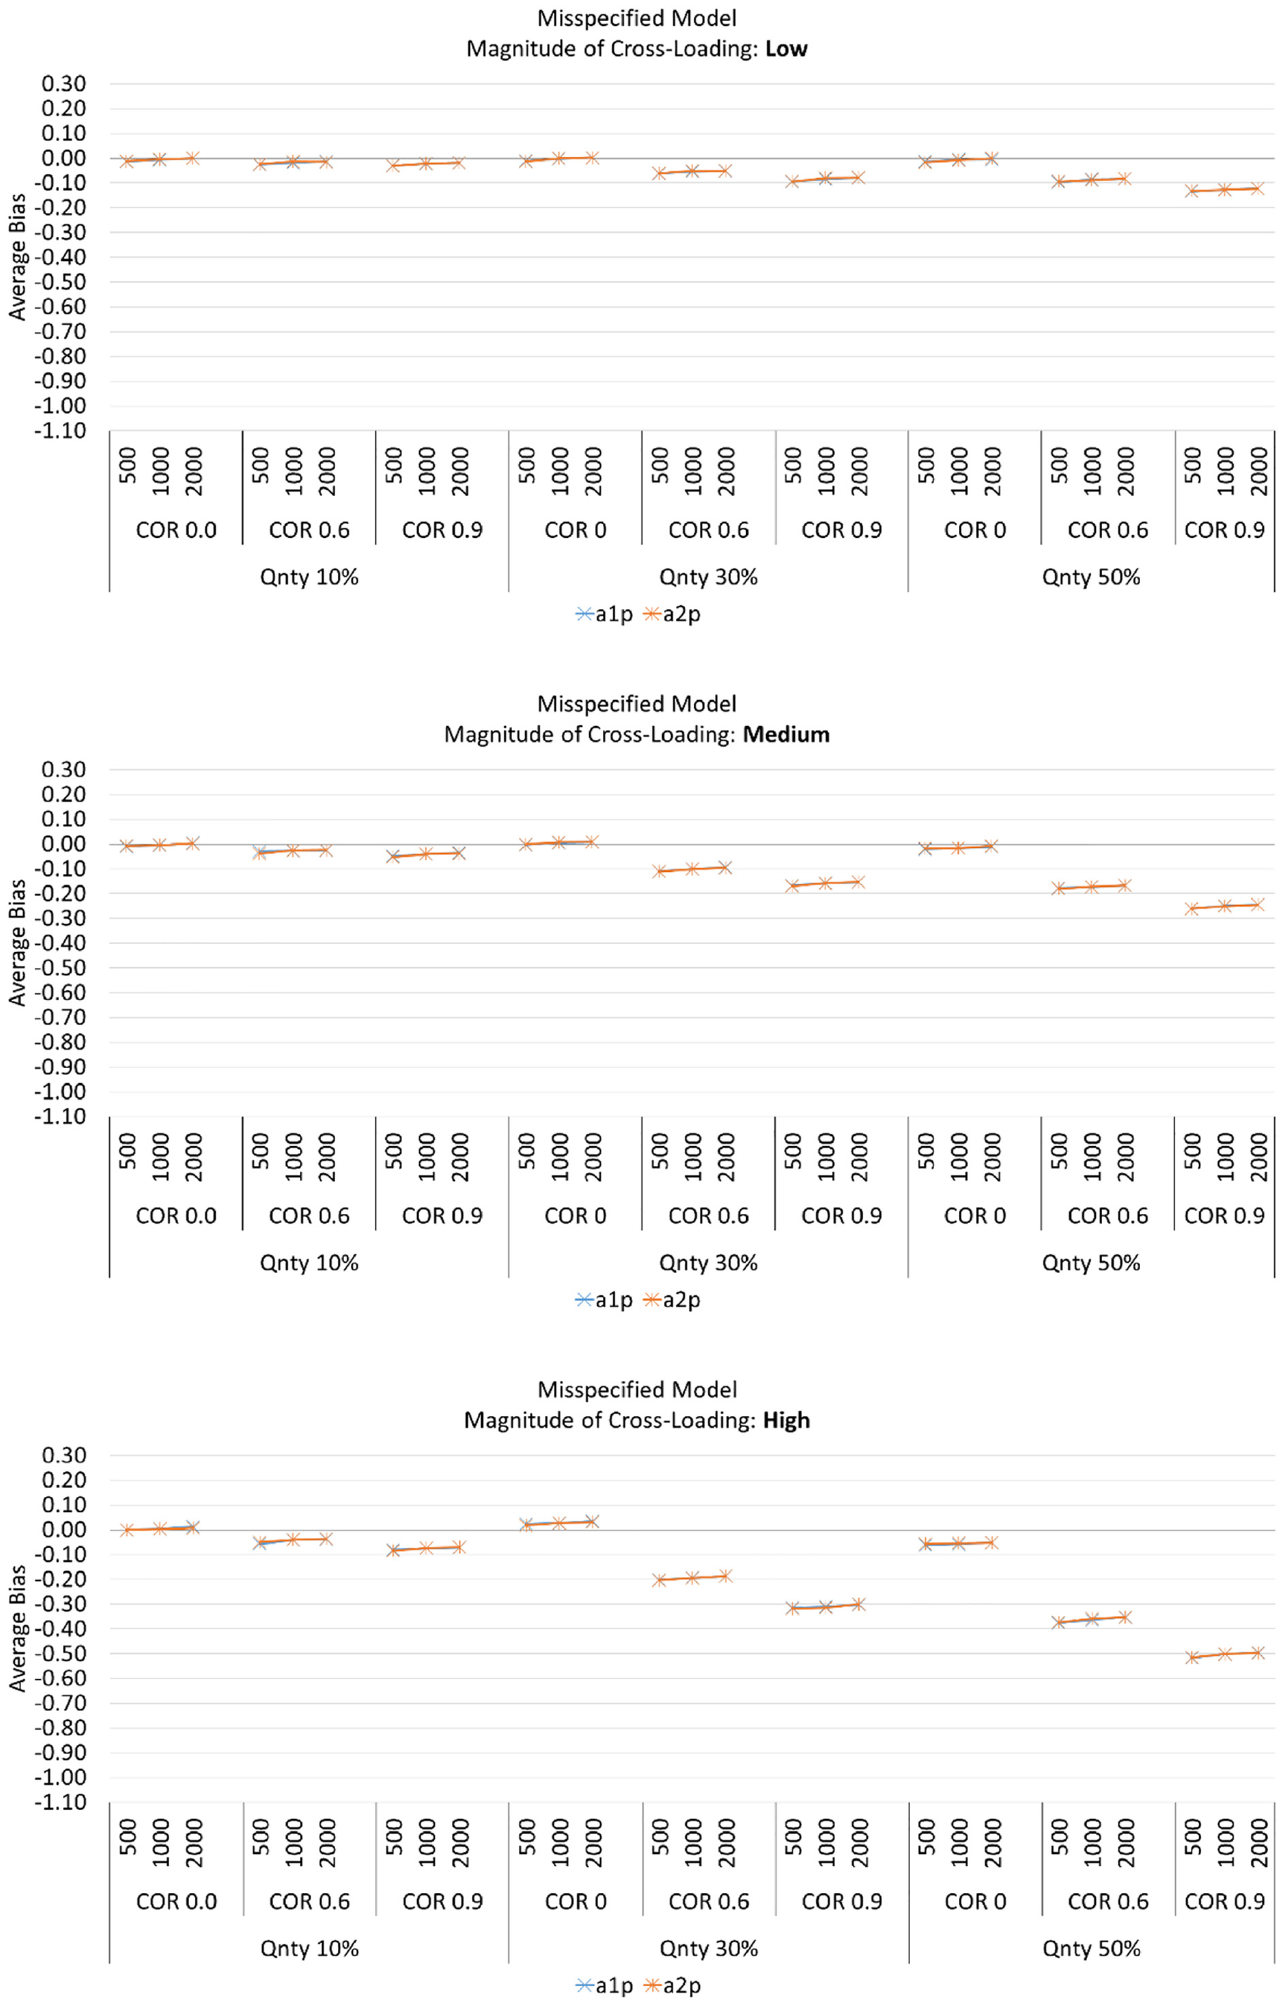
Average Bias for Item Discrimination Parameters When the Models Were Misspecified.
Effect of Correlation Between Abilities (Bias)
As shown in Figure 4, in correct specified models, when the degree of cross-loading was low or medium, the discrimination of cross-loaded items on both dimensions (
However, when the models were misspecified, the truly cross-loaded primary item discrimination on both dimensions (i.e., misspecified items
Effect of the Quantity of the Cross-Loaded Items (Bias)
As shown in Figure 4, for the correct specified models, When the magnitude of cross-loading was low or medium, the average bias of the item discrimination parameters on cross-loaded items (
For misspecified models, the primary item discrimination parameters on truly cross-loaded items (i.e., misspecified items,
Effect of Magnitude of Cross-Loading (Bias)
For the correct specified models, as the magnitude of cross-loading increased from low to medium the average bias decreased with values close to zero for the primary item discrimination parameters on cross-loaded items on both dimension (
Discussion
Although model fit could be useful to identify cross-loadings, the purpose of this study was to investigate the influence of the quantity and the magnitude of cross-loading on secondary dimensions and model specification, especially when the model was specified as simple structure, ignoring the cross-loading on item parameter recovery in MIRT models. It should be noted that it is difficult to compare the result of this study to those of Finch (2011), Zhang (2012) and Svetina et al. (2017) due to different structures of the data in terms of item discrimination and item location specifications, quantity and magnitude of cross-loading, model specification or the distribution of latent abilities. Comparison of the results of this study to studies of Finch (2011), Zhang (2012) and Svetina et al. (2017) should be made with caution as those studies focused on different combinations of influencing variables and conditions. For instance, Finch (2011) focused on the complex MIRT models when the distribution of latent abilities were non-normal. Zhang (2012) focused on comparing the precision of item parameter estimation in unidimensional and multidimensional estimation approaches within simple structure and mixed structure environments. This study was primarily an extension of Svetina et al. (2017) in which the authors focused on comparison of item parameter estimation under complex structure when the distribution of abilities were non-normal with balanced and imbalanced item discriminations but not incorporating the magnitude of cross-loading and model specification effects.
The results of this study have implications for test or instrument developers and practitioners especially for those that are involved with multidimensional item–response data. When the quantity and magnitude of cross-loadings are misspecified or ignored, item discrimination parameters are adversely affected. Under all circumstances, a larger sample size improved the item discrimination estimations, but even with a sample as large as 2,000, if cross-loadings are ignored and data are treated as having a simple structure, item discrimination estimates are severely adversely affected, especially when the magnitude of the cross-loading is high. This can ultimately result in inaccurate inferences regarding the examinees’ abilities on each dimension. Therefore, it is imperative that test designers take variables such as quantity and magnitude of cross-loading and model specification into account to have accurate inferences about the item parameter recovery and ultimately examinees’ abilities on multiple dimensions.
Test designers should consider that even if the model is correctly specified and quantity of cross-loading is taken into account, still there may be effects of the magnitude of cross-loading on the secondary dimension on item discrimination estimation precision. For instance, on a mathematics test, one or some of the primarily algebra items may require some little, moderate, or high secondary geometry knowledge to answer the item correctly (i.e., magnitude of cross-loading). Test developers should take into account the degree of cross-loading when tests for accurate item and examinee parameter estimates. In addition, test designers should be aware of and cautious that utilizing a misspecified simple structure multidimensional model to evaluate the items, ignoring the and magnitude of cross-loading of some items on the secondary dimension, could have serious consequences regarding item discrimination estimation accuracy, that is, misspecifying the model and ignoring the cross-loading on the items that primarily measure algebra knowledge and require some geometry knowledge. The results of this study support the conclusion that the quantity of cross-loaded items and the magnitude of cross-loading on secondary dimension and model specification had an influence on the precision of item discrimination recovery that ultimately result in inappropriate inferences about the latent abilities of the examinees.
In this simulation study, there exist some limitations that should be noted for future studies. First, the item–response data were generated and analyzed utilizing R programming and simulation study techniques and it is possible that the results in real-world situation differ when actual data from instruments such as tests and surveys are analyzed. Example of such factors could be the distribution of the examinees’ abilities (i.e., depression), testing environment conditions, etc. Second, item–response data in this study were simulated considering the sample size of examinees similar to large-scale tests and surveys, and it is likely that the results differ when the number of examinees are relatively small. Although many variables were manipulated within the context of this simulation study, for future studies, it should be noted that in addition to the variables manipulated in this study, there are a number of other variables that could influence the precision of item parameter recovery in MIRT models. For instance, a compensatory 2PL-MIRT model with two dimensions and dichotomous item–response type was considered to simulate and calibrate the data for every replication for each condition combinations. It would be interesting to further investigate the effect of the manipulated variables in this study on other MIRT models, such as having more than two dimensions or bifactor and higher order models. In addition, it would be interesting to see how items would be recovered under a non-compensatory MIRT model considering the manipulated variables in this study. Finally, not only is IRT used for item evaluation, it is used for scoring respondents. Scores may be used to diagnose depression or anxiety, to classify respondents into groups, or to benchmark students in education. In any situation, it is imperative that scores provide accurate understandings of underlying abilities. Model misspecification, quantity, and magnitude of cross-loading often affect item parameter estimates, which then is likely to affect estimated trait scores. Future analysis may also investigate the effects of these variables on estimated trait scores.
Footnotes
Declaration of Conflicting Interests
The authors declared no potential conflicts of interest with respect to the research, authorship, and/or publication of this article.
Funding
The authors received no financial support for the research, authorship, and/or publication of this article.