






Abstract
The purpose of this study is to examine the reliability and dependability of difference scores computed as the change between a pretest and a posttest administered to assess the effectiveness of an intervention. The data-collection design involved a nested structure, with persons (p) nested within groups (g), and groups nested within sites (s). Multivariate generalizability theory was employed to estimate the reliability and dependability of difference scores at the levels of persons, groups, and sites. The G study designs included
Keywords
In practice, difference scores are utilized for various purposes under longitudinal or repeated-measures designs. For instance, experimental research designs are conducted to assess the effectiveness of new instructional methods, educational programs, or treatments in terms of changes in educational or psychological constructs. These situations involve administering pretests and posttests in multiple schools. Another example of interest concerns assessing changes in academic success. For instance, the Every Student Succeeds Act requires states to measure academic progress in elementary and middle schools. Thus, schools are responsible for demonstrating that they provide high-quality education. One of the indicators is academic progress. Administrators want to know how much academic progress students, classes, and thus schools made between different grades. In these cases, inferences can be made using difference scores, which are computed by subtracting pretest scores from posttest scores. The data from which the difference scores are obtained have a nested structure, such that students are nested within classes, and classes are nested within schools.
The Standards for Educational and Psychological Testing (American Educational Research Association et al., 2014) state that whenever the difference between observed scores is interpreted and used for actions, the reliability of difference scores needs to be reported. Moreover, if there is an intent or need to make interpretations at the group level, then the reliability of group means also needs to be reported. When difference scores are computed at the group level, the reliability of the group mean difference scores must be reported. Generalizability theory (G theory) offers comprehensive tools for estimating reliability, including the reliability of difference scores and group scores, while considering various sources of measurement error (Brennan, 2001a).
The reliability of school means using univariate G theory was examined, and it was found that excluding class-level variance could introduce bias into the reliability estimates (Wei & Haertel, 2011). The reliability of group mean difference scores has been examined in multiple studies using classical test theory (CTT) or G theory (e.g., Brennan, 1995; Brennan et al., 2003; Cronbach et al., 1997). However, the data in these studies did not encapsulate the nested structure of schools or did not include items as a source of error, which changes the G theory study design and definitions of error variances. Moreover, the effect of ignoring lower-level variances on the reliability of school or class mean difference scores has not been investigated. Reliability of difference scores requires consideration of correlated error between the pretest and posttest from which the difference scores are computed. Multivariate G theory is pertinent in such cases, enabling the explicit modeling of variance and covariance components in the computation of correlated errors. Furthermore, the variation in the object of measurement within a single dataset was not studied, and the importance of incorporating nesting when calculating the reliability of scores derived from a specific object of measurement was overlooked. The purpose of this study is to fill this gap by identifying the sources of error, examining their contribution to the reliability coefficients, and investigating how these coefficients change when the object of measurement varies in a nested design.
In doing so, this study makes three interrelated contributions: It extends the literature on the reliability of difference scores by applying a multivariate G theory approach to two-level nested pretest–posttest designs, which is a data structure typical of K-12, higher education, and large-scale assessment contexts that has not been fully represented in prior studies; it provides empirical evidence of how omitting nested facets inflates reliability coefficients and alters error correlations across designs; and it offers a step-by-step illustration of the analysis procedure that researchers and practitioners can follow when working with similarly structured data.
For this purpose, this study used an empirical data set consisting of pretest and posttest data administered to assess the effectiveness of a statewide intervention (Wade & Yarbrough, 2007). Teams of teachers from various school districts implemented the intervention for students. Within each school district, multiple teachers implemented the intervention, and each teacher worked with multiple students. Thus, the data had a nested structure such that students were nested within teachers, and teachers were nested within school districts. In this study, the terms persons (p), groups (g), and sites (s) are used to refer to students, teachers, and school districts, respectively. Prior research on the reliability of group scores often examines students nested within classes and classes nested within schools. However, in this study, groups are equivalent to classes (one level of nesting), and sites are equivalent to schools (two levels of nesting). With this framework, this study aims to answer the following research questions:
The remainder of this paper begins with a brief overview of CTT and G theory, followed by a review of previous research on difference scores. Then, the study design and analysis procedures are described. It concludes with a discussion of results in relation to the research questions.
CTT, Univariate G Theory, and Multivariate G Theory
Suppose individuals respond to a set of essay prompts, and raters evaluate their responses. In this assessment scenario, essay prompts and raters are key sources of measurement error that should be incorporated into reliability estimation. CTT-based reliability-estimation methods treat error as a single undifferentiated entity and cannot separate multiple sources of error in the estimation process. However, G theory offers methodologies capable of accounting for different sources of error, allowing for the examination of their individual contributions to reliability.
Furthermore, G theory explicitly distinguishes between two types of error: relative error (
G theory constitutes both univariate and multivariate methodologies. One of the distinct advantages of multivariate G theory over univariate G theory is its ability to account for correlated error variances and to model composite scores. For instance, difference scores, such as the difference between posttest and pretest scores, can be specified as composite scores. In this framework, both variance and covariance components for pretest and posttest scores can be estimated and used in calculating reliability coefficients for difference scores. However, the univariate G theory approach lacks the capacity to model difference scores as composites or to estimate covariance between pretest and posttest scores. Typically, CTT assumes zero covariance between errors of pretest and posttest scores. Multivariate G theory relaxes these assumptions, allowing for a more accurate and flexible estimation of the reliability of difference scores.
Research on Difference Scores
Researchers often avoid using difference scores mainly for several reasons, as outlined by Gu et al. (2018). First, difference scores tend to have low reliability, implying a weak correlation between observed and true difference scores. Second, the reliability of difference scores is generally lower than that of the test scores from which the difference scores are obtained. Third, when reliability is low, the measurement precision of difference scores at the individual level becomes limited. Fourth, it is not possible to observe both a high correlation between pretest and posttest scores and a high reliability of difference scores simultaneously. Finally, difference scores can be potentially defective given that the correlation between difference scores and pretest scores can be negative, raising concerns about their interpretability.
However, studies have provided evidence contradicting the notion that psychometric properties of difference scores are inadequate for making valid inferences. Thomas and Zumbo (2011) demonstrated the valid use of difference scores in repeated-measures experimental designs. Gu et al. (2018) provided analytical explanations based on CTT by differentiating individual and group-level change scores. Moreover, difference scores can be useful if indices for reliability are selected according to the intended interpretations, which may be norm-referenced or domain-referenced (Yin & Brennan, 2002). G theory can provide
A key determinant for which reliability index should be used is the intended interpretations of difference scores. If the focus is not on ranking individuals based on their difference scores, the appropriate index to use is a coefficient representing the reliability of absolute change, for which G theory is particularly well suited (Yin & Brennan, 2002). Miller and Kane (2001) proposed using E/T, which can be computed using
Existing studies using the G theory framework differ in terms of their G study designs. Yin and Brennan (2002) did not strictly adhere to G theory conventions, but their design can be reasonably interpreted as a
When estimating the reliability of difference scores for groups, the nested structure of the data is a source of variance. In Yin and Brennan (2002), difference scores for sites (i.e., school districts) were examined using CTT. In Brennan et al. (2003), difference scores were expressed in grade equivalents for a site, using a
Method
Data
This study utilized an empirical data set obtained from a pretest and a posttest administered to persons nested within groups, which were in turn nested within sites. The following notational conventions are used:
Designs
The reporting starts with the
Although these designs differ, their analysis follows the same sequential steps. First, the G study variance–covariance components are estimated. Then, the D study variance–covariance components are computed using the G study variance components and sample sizes. Next, the error variances and universe score variance are computed. Finally, the generalizability and dependability coefficients are calculated from the universe score variance and error variance. A key strength of multivariate G theory is that it provides reliability coefficients for composite scores, as well as error covariances and error correlations among levels of the multivariate variable.
Multivariate G theory treats difference scores as composite scores. In this study, the typical definition of difference scores is used to define composite scores such that

where

In this study, pretest and posttest scores were available for all persons across all groups and sites, resulting in full and symmetric variance–covariance matrices. This is indicated by the use of filled circles as superscripts. That is, a filled circle on a facet denotes that the facet is crossed with the levels of the fixed multivariate variable. Accordingly, all facets in the multivariate designs have filled circles.
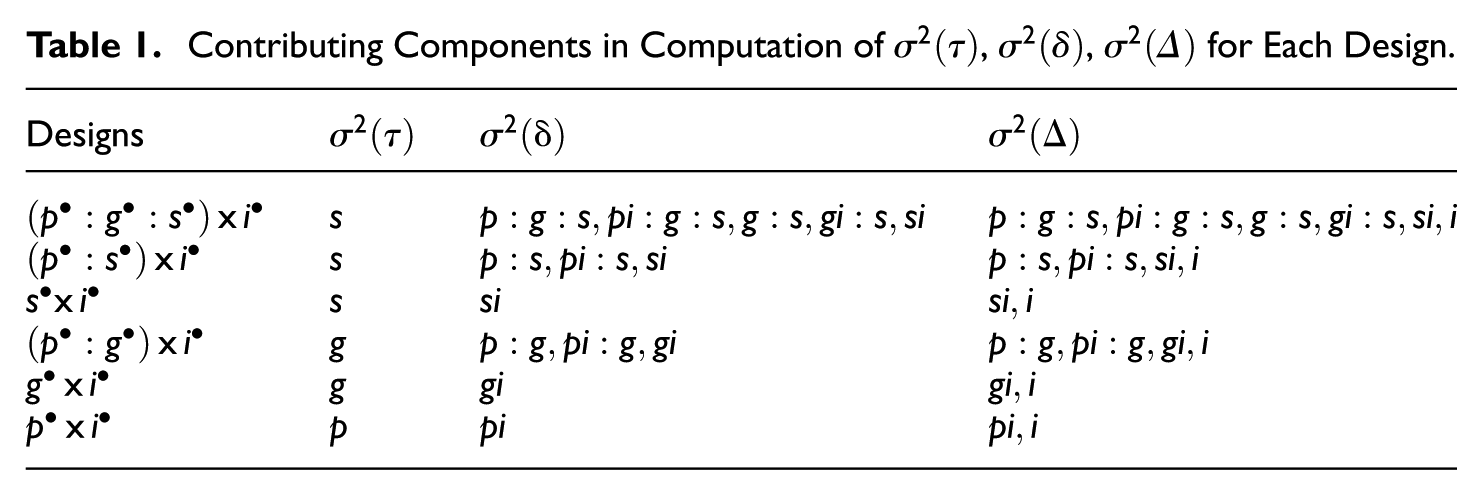
The variance–covariance matrices generated for each score effect were utilized to compute variance–covariance matrices for the universe score (i.e.,
For all designs except
Contributing Components in Computation of
Analysis
Difference scores at the site level, where persons are nested within groups and groups are nested within sites, are modeled using the

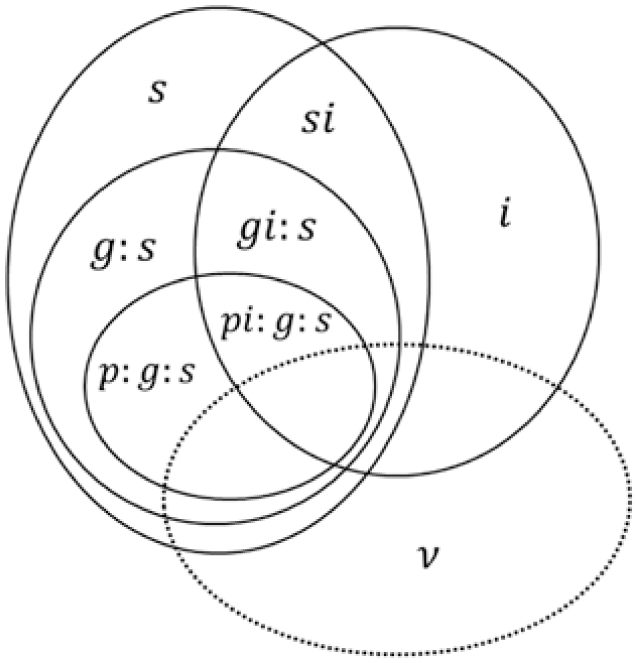
Venn diagram of the
Disattenuated correlations between pretest and posttest for each effect were computed according to the following equation:

Because urGENOVA (Brennan, 2001c) provides variance components but not covariance or correlation components, the covariance and correlation values were derived from these calculations and combined with the variance components to obtain the G study variance–covariance matrices. As a result, the following G study variance–covariance matrices were obtained:







After the G study covariance and correlation were calculated for each effect, the random effects D study






In these equations, the G study sample sizes were used as divisors in calculating the D study variance components. The number of persons within each group and site (
The next step was to compute the variance–covariance components of the
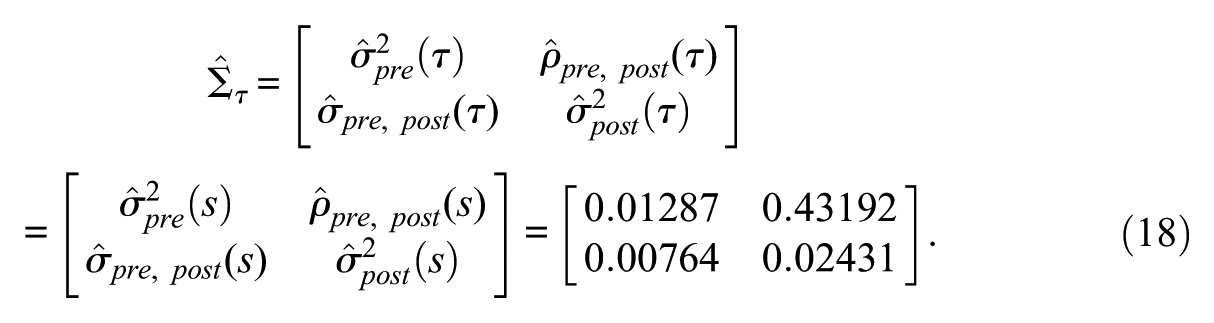


Applying the D study variance–covariance components reported in matrices in Equations 12–17 into Equations 19 and 20 resulted in a relative and absolute error variance–covariance matrix,


Universe score variance and relative and absolute error variance are used to compute the generalizability and dependability coefficients, which are defined as:


The S/N represents the ratio of universe score variance to error variance, such that


Substituting the




These coefficients can be calculated for posttest scores in a similar way, such that

Similarly, the composite relative and absolute error variances were computed as:


The composite score coefficients were then calculated using




Results
The variance–covariance components of
The estimated disattenuated correlation between pretest and posttest scores for items (i.e.,
The variance and covariance components of the D study random effects design,
Estimates of the variance–covariance components of the
As presented in Equation 34,
and
When the group facet was omitted, the G study design simplified to
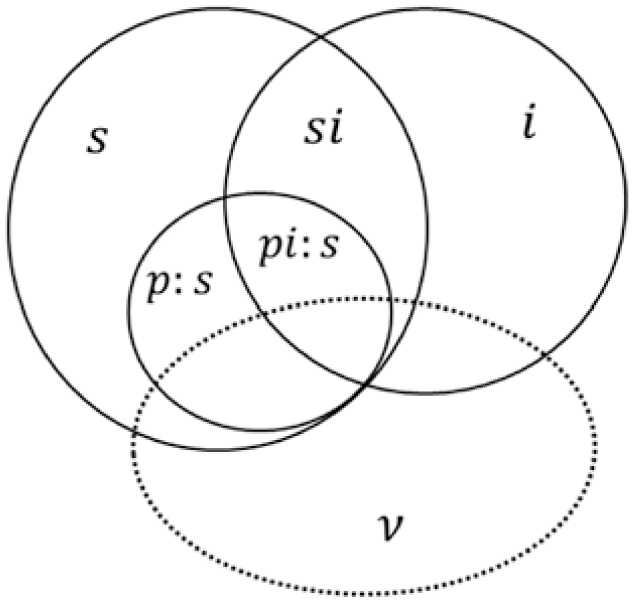
Venn diagram of
Variance and Covariance Components for
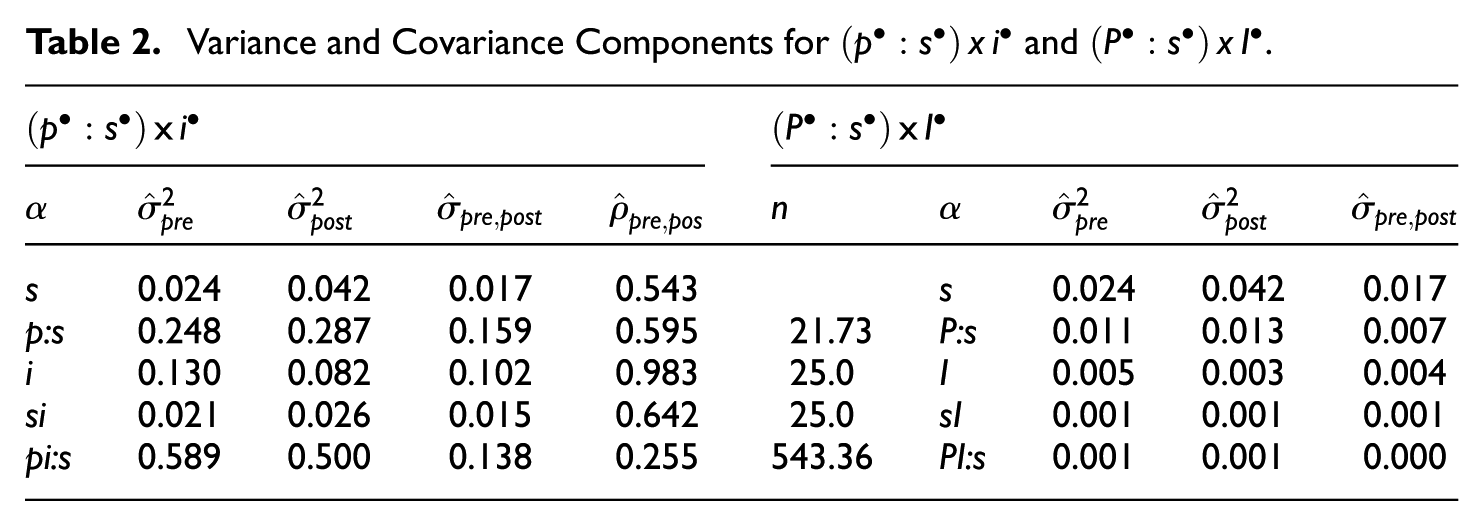
When the group facet is ignored, the within-group variability contributes to the variance of other facets. This contribution can be directly observed through the increase in the variance of
The D study random effects design, with sites as the object of measurement, is denoted as
The D study variance and covariance components given in Table 2 were used to compute the error variances and coefficients, which are reported in Table 3. When the group facet is ignored, the within-group variability contributes to the
D Study Results for
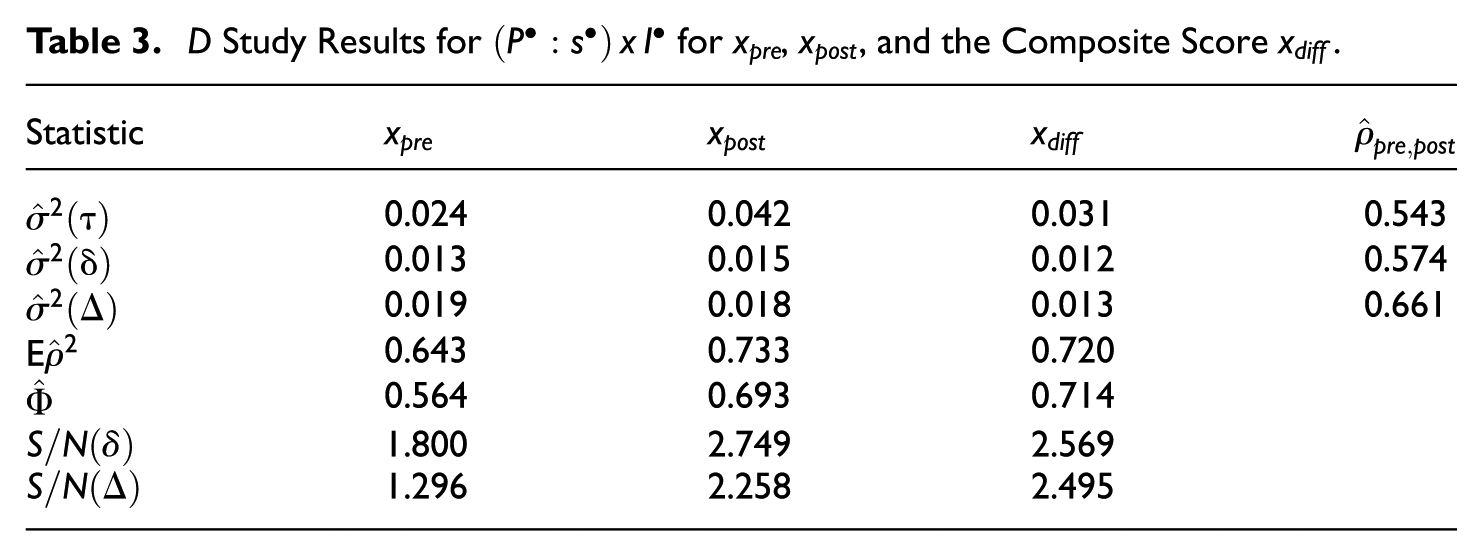
Excluding the
and
In the G study design
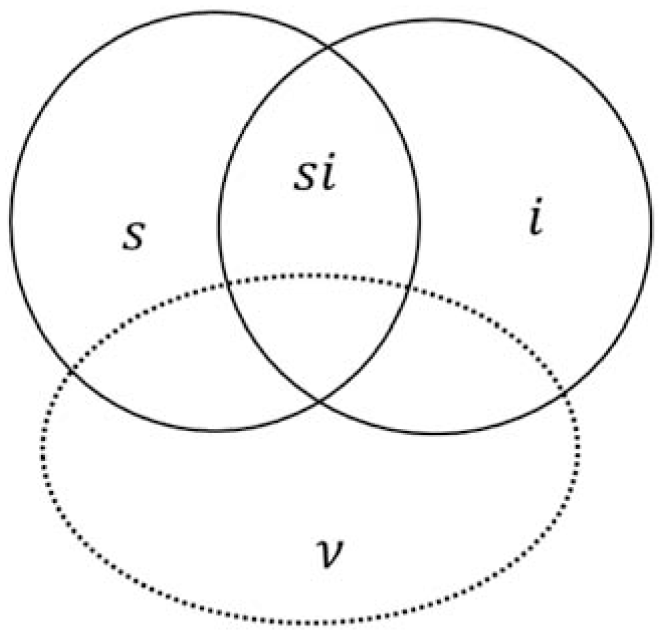
Venn diagram of
Variance and Covariance Components for
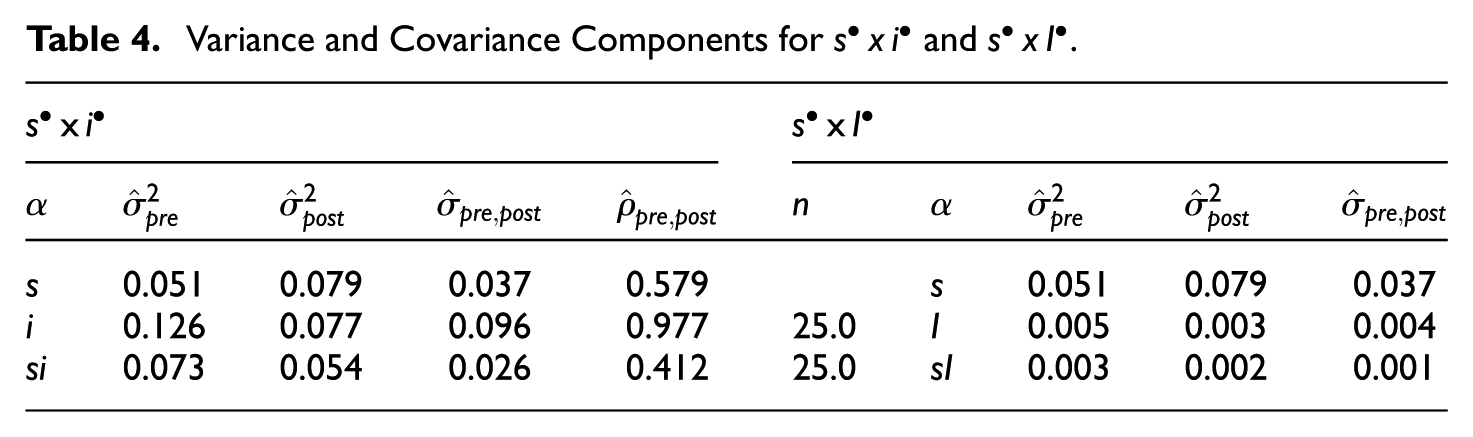
The variance and covariance components for the D study
D Study Results for
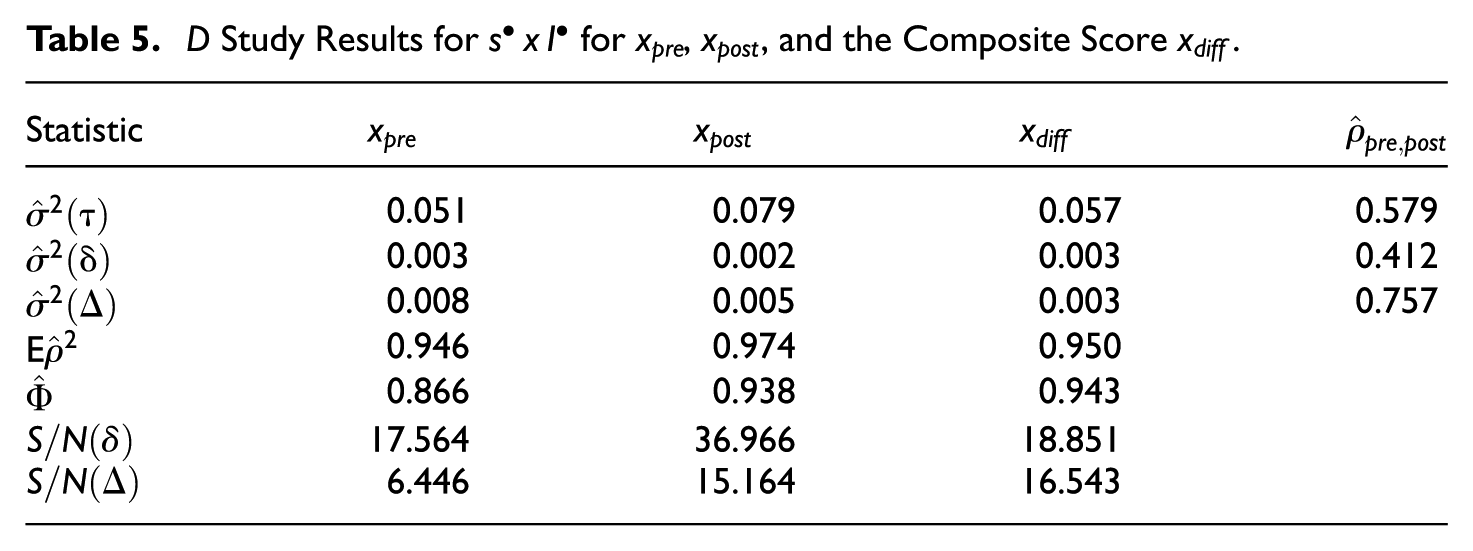
and
The G study design
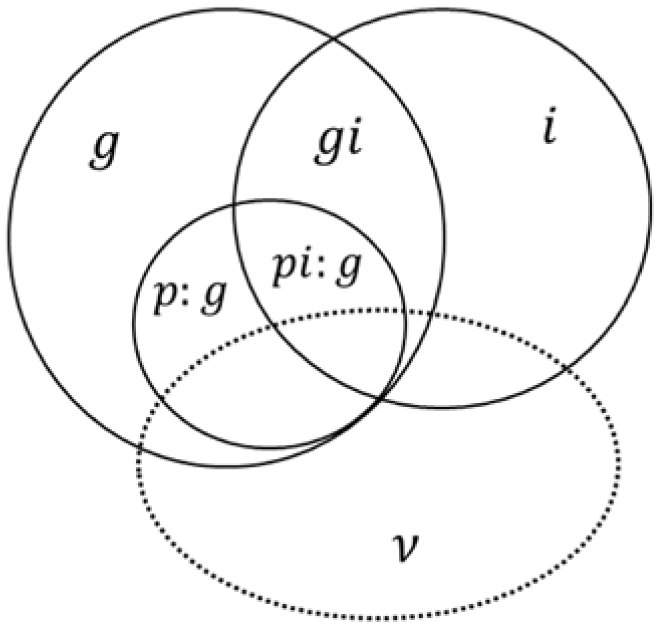
Venn diagram of
Variance and Covariance Components for
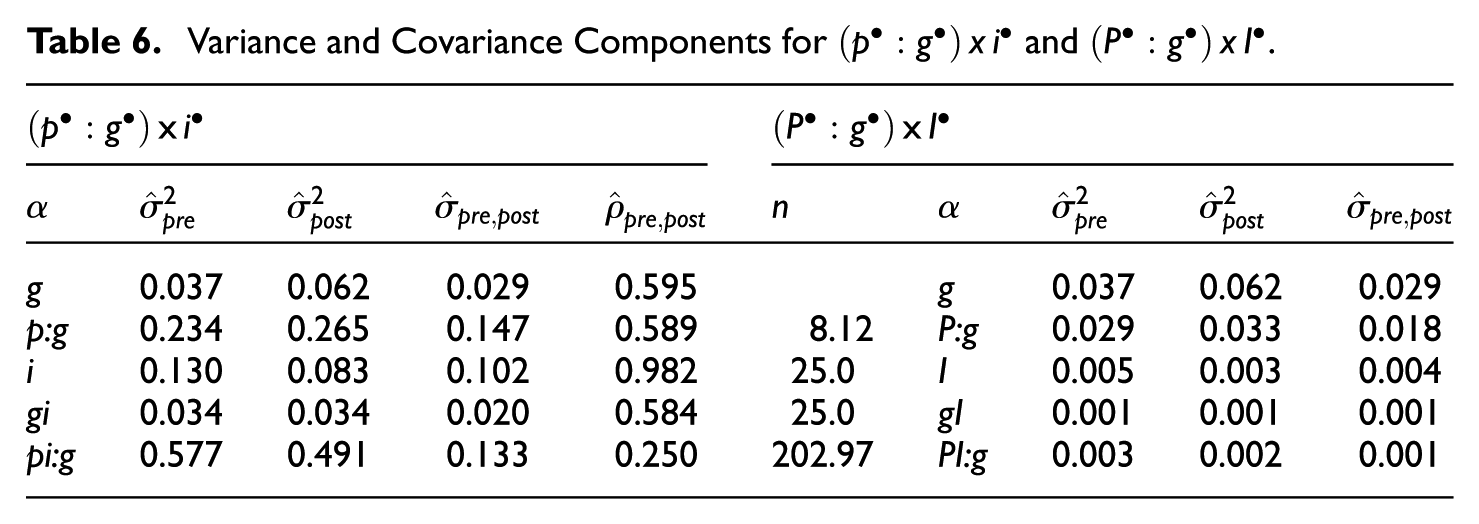
The patterns among the variance components of this design mirrored the results obtained from the
The D study random effects design with groups as the object of measurement was
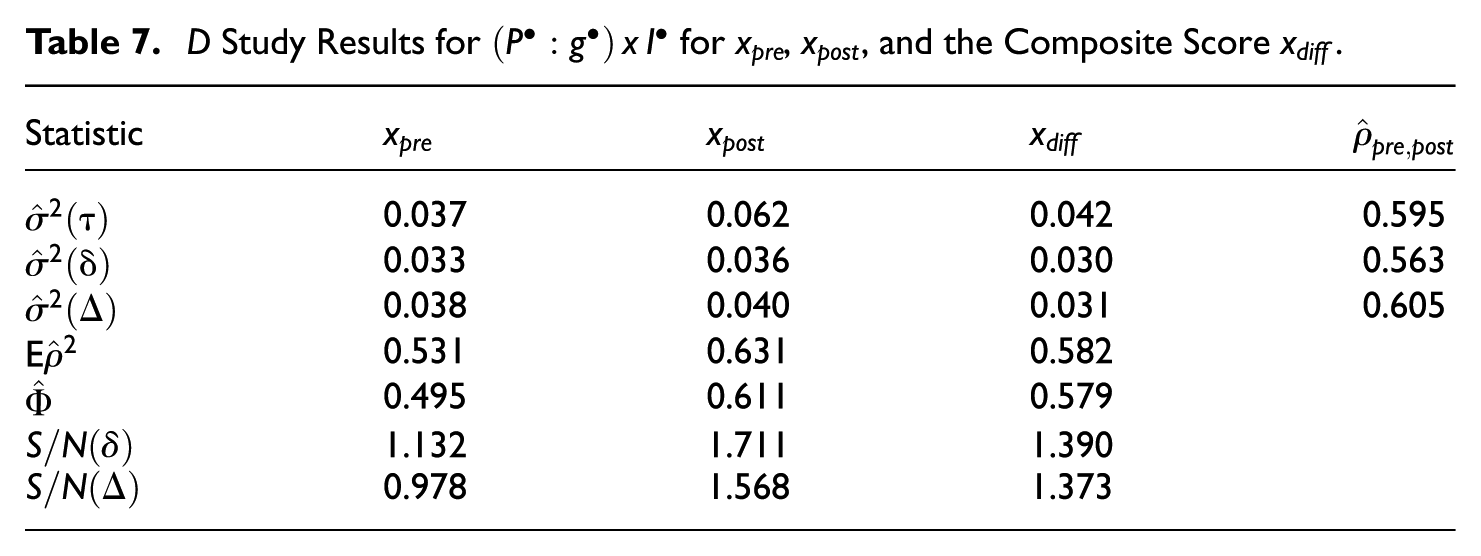
The D study variance and covariance components presented in Table 6 were used to compute the error variances and coefficients, which are reported in Table 7. Consistent with previous designs, the relative and absolute error variances were similar in magnitude, and this resulted in similar values between
D Study Results for
and
When the person facet was ignored in
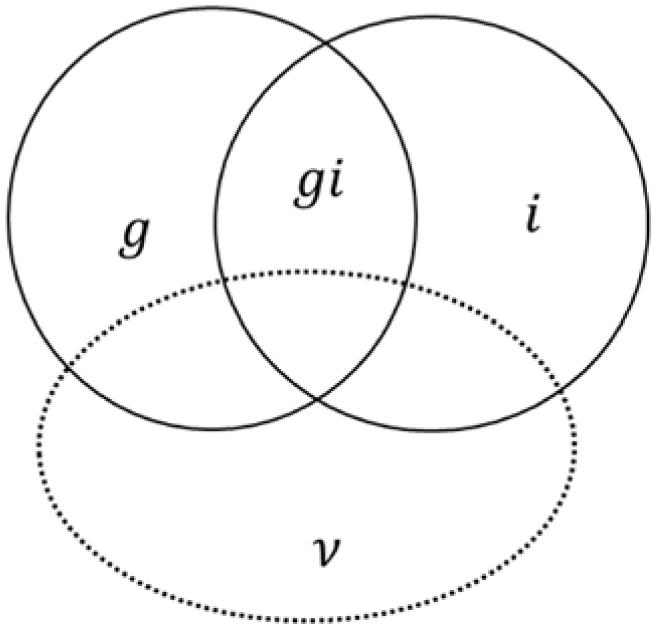
Venn diagram of
Variance and Covariance Components for
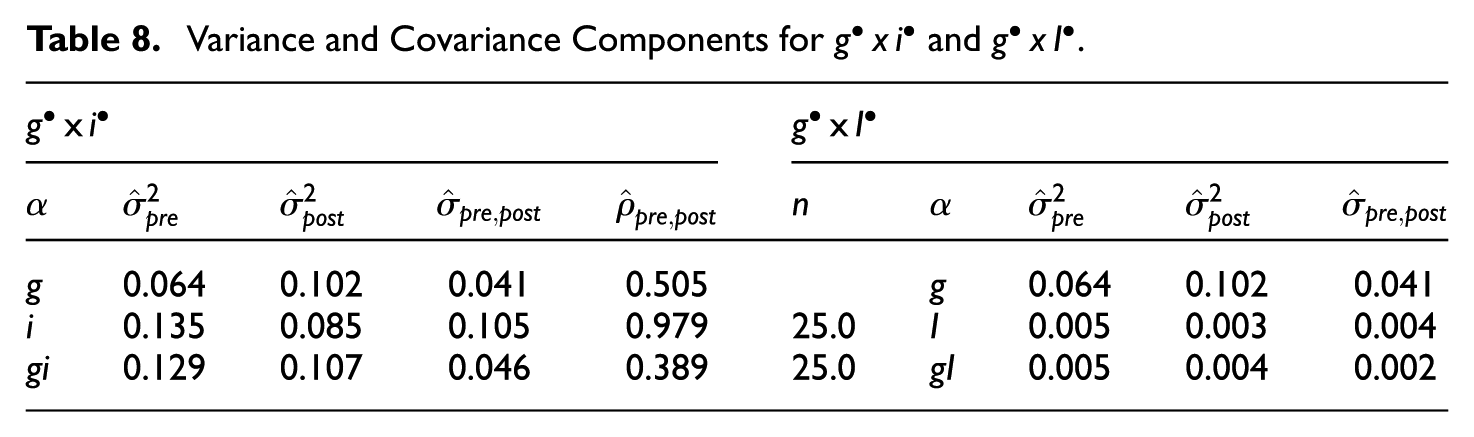
The D study random effects design, with groups as the object of measurement, was
D Study Results for
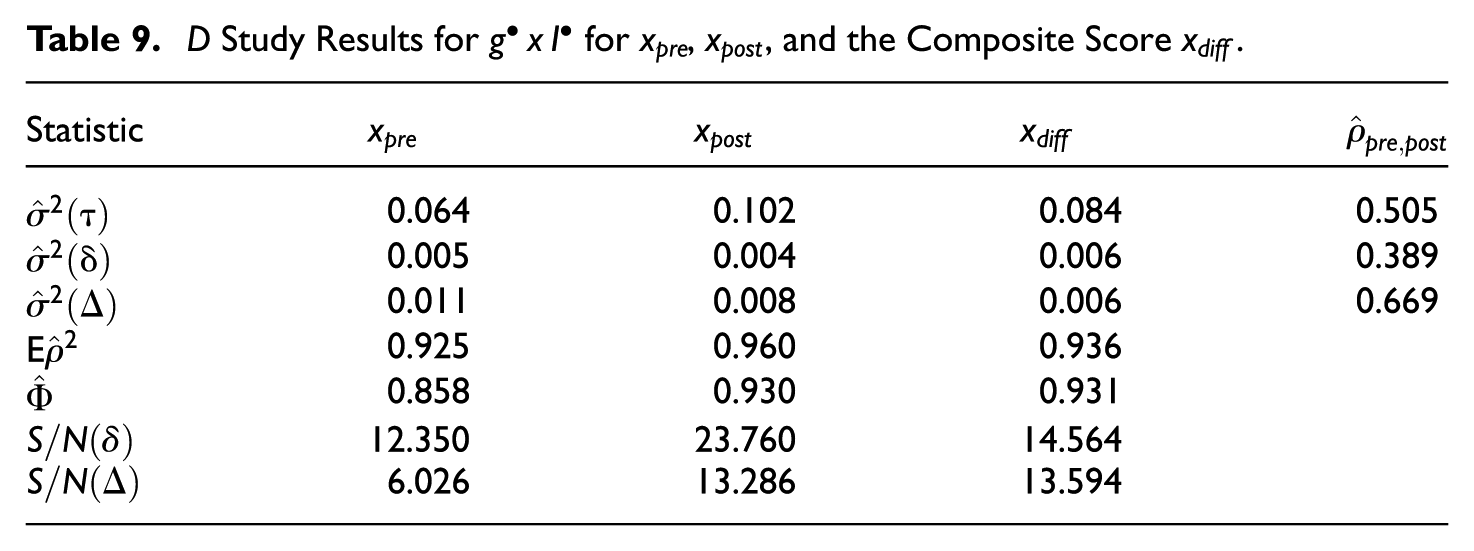
and
The last design to consider is
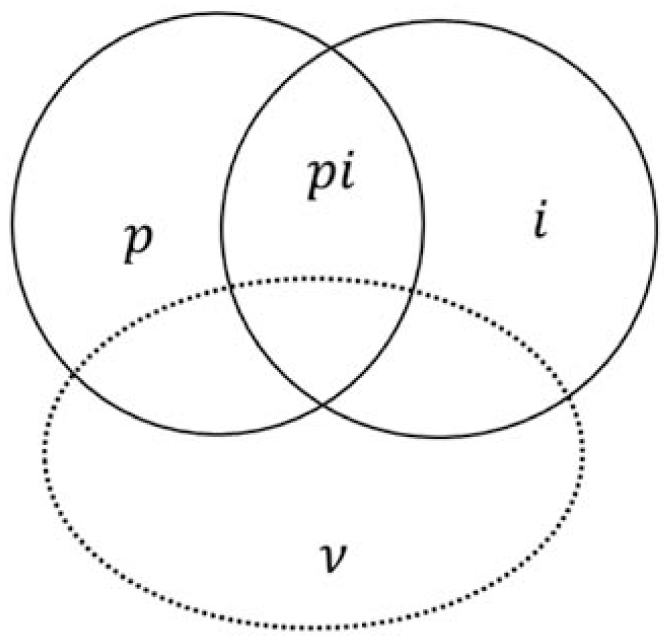
Venn diagram of
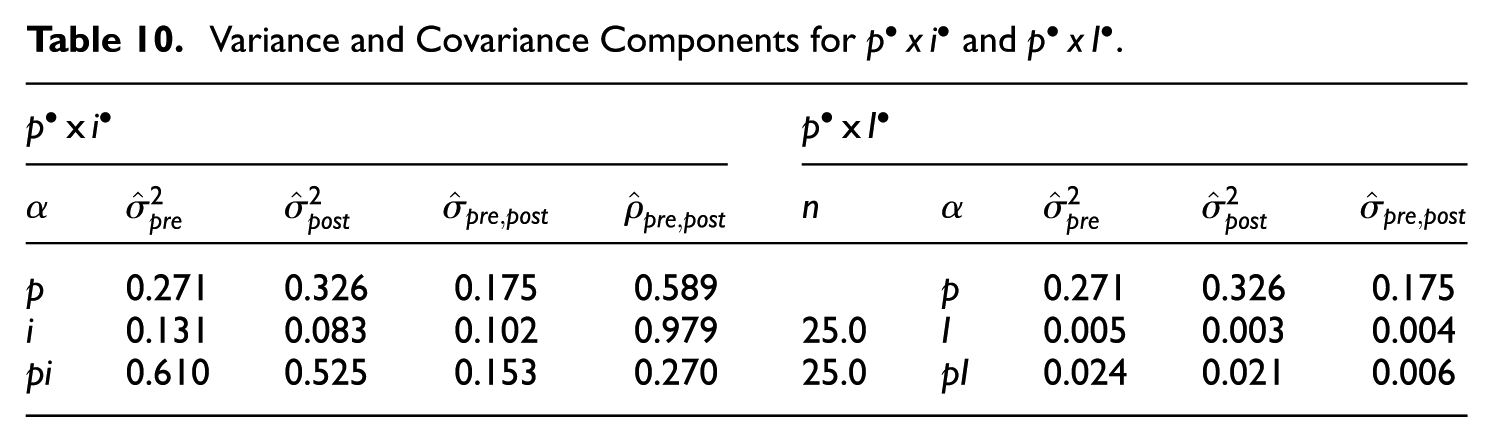
Table 10 presents the variance and covariance components for both
Variance and Covariance Components for
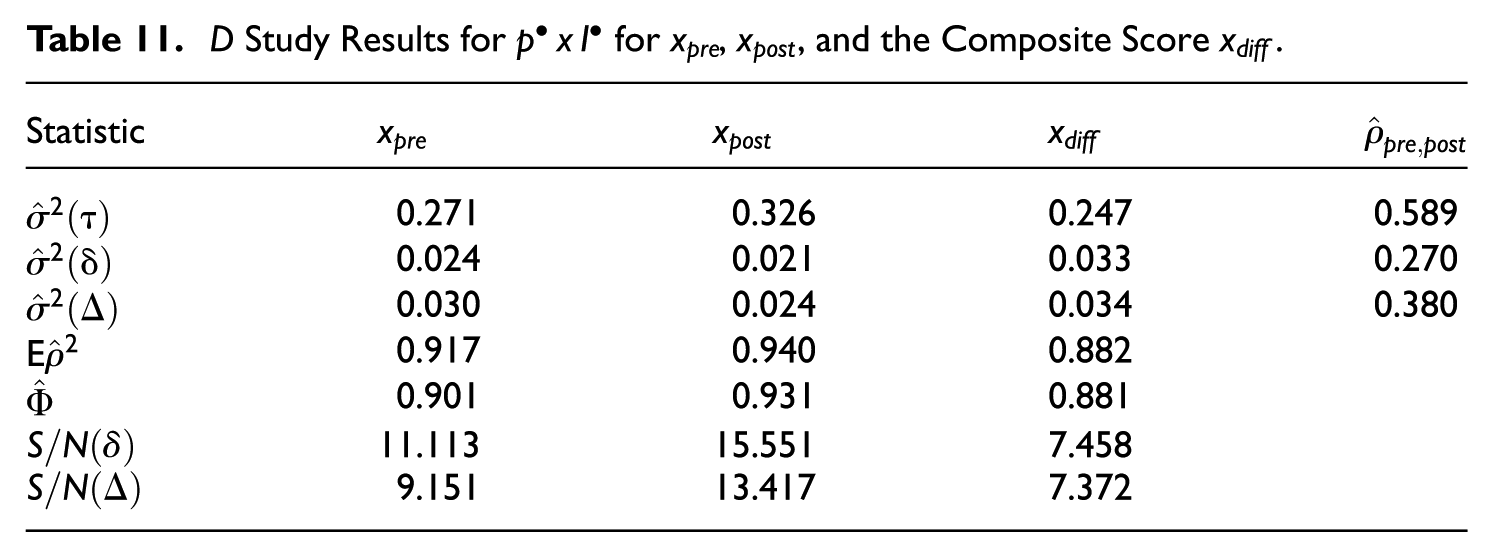
D Study Results for
Comparison Across Designs
There are three designs in which sites serve as the object of measurement:
Summary of D Study Results Across Designs for Site Mean Difference Scores Where
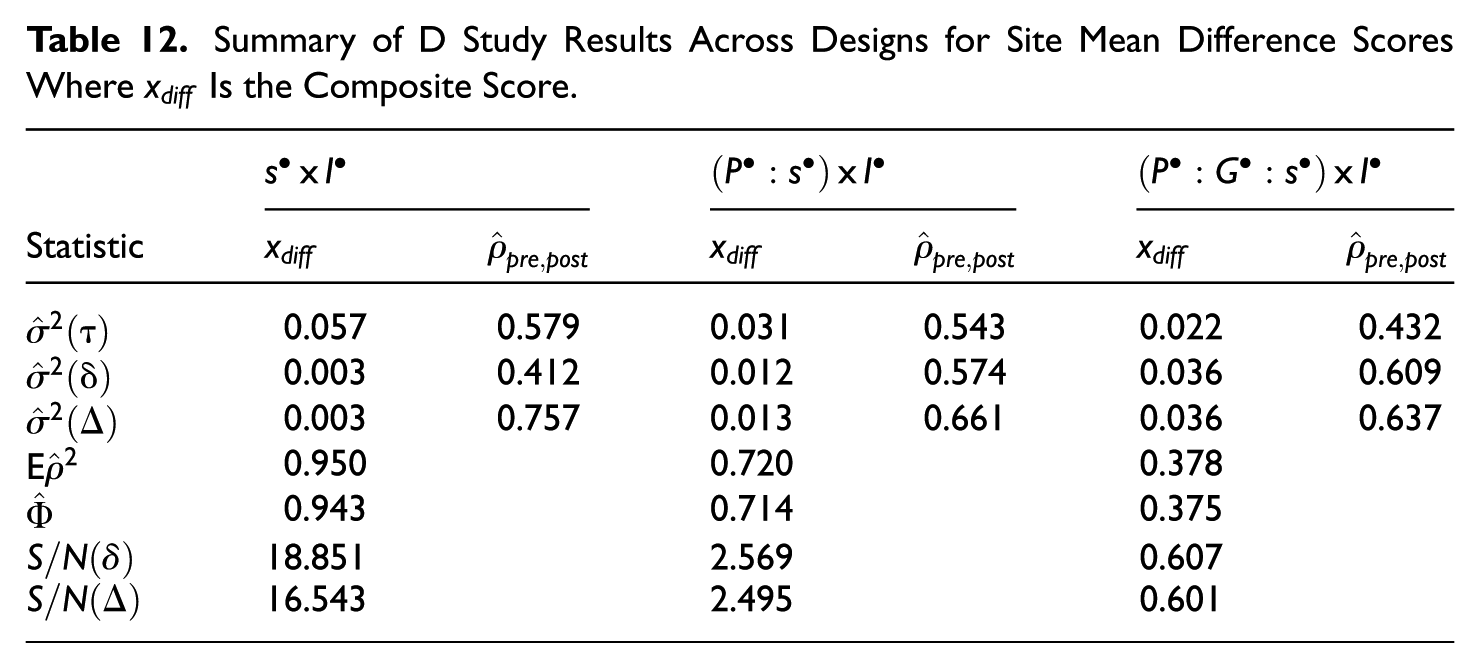
As the relative error variance increased across
In the
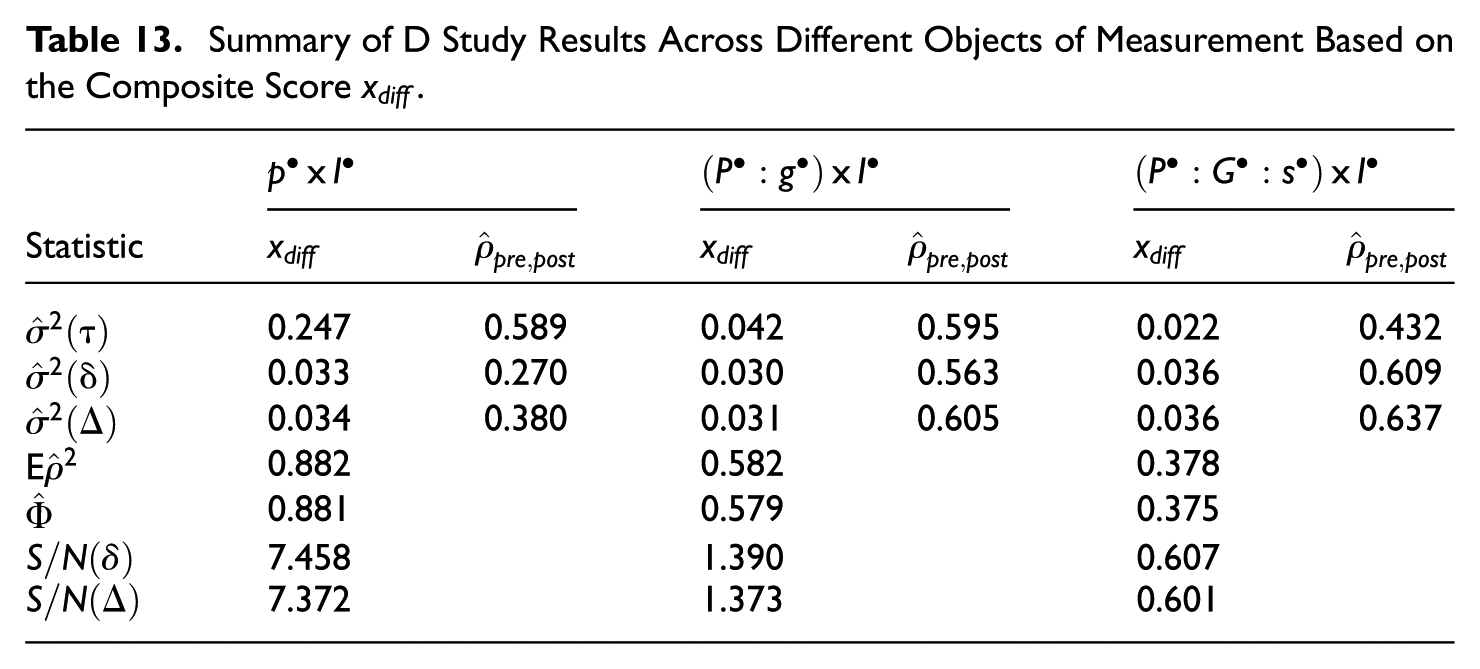
Table 13 illustrates how the coefficients vary when the object of measurement changes across persons, groups, and sites. Relative and absolute error correlations increased, and reliability-related coefficients decreased across
Summary of D Study Results Across Different Objects of Measurement Based on the Composite Score
Discussion
This study examines the reliability of difference scores obtained from multilevel pretest–posttest data. The nature of difference scores (i.e., composite scores), combined with the multilevel data structure, necessitates considering both variance and covariance components in reliability estimation. G theory, with its univariate, multivariate, and extended multivariate methodologies, provides a flexible and powerful framework for modeling reliability in such complex contexts (Brennan, 2001a; Brennan et al., 2022; Jiang et al., 2024). In this study, the following G study designs were investigated:
When the focus is on decision-making regarding the relative standing of the unit of analysis, the generalizability coefficient,
Both
When the object of measurement is sites, both groups and persons should be treated as facets in the universe of generalization. Sites often differ in terms of culture, background, and learning conditions. In this study, the number of groups within sites and the number of persons within groups varied substantially. Moreover, when these facets are not explicitly included in the estimation, only the site means remain, which can be used for reliability estimation. This means that the variance of the persons within groups within sites and of the groups within sites could not be completely included in the reliability estimation. In other words, the information provided by the persons and groups is lost to some extent, resulting in inflated reliability coefficients. This underscores the importance of incorporating the nested structure of the sampling design into reliability estimation. Specifically, when making decisions at the group level, person-level variance should not be ignored. Similarly, when making decisions at the site-level, group-level and person-level variance must be accounted for to avoid misleading reliability estimates.
This study decomposed the reliability of site mean difference scores and error correlations into its constituting facets via multivariate G theory. By comparing different designs with the same object of measurement, we observed that the trend in correlated errors could differ. Across
When difference scores are used to assess the impact of an instructional design in K-12 or learning gains in international large-scale assessments (e.g., TIMSS 2023 Longitudinal Study, Fishbein et al., 2026), or to evaluate instructional quality in higher education institutions (e.g., Buchanan et al., 2025; Rubach et al., 2025), the data have multiple levels, and the computation of difference scores should explicitly model these levels. If generalization is aimed at making decisions over sites or any unit with two levels of nesting, then the design should be
Supplemental Material
sj-pdf-1-epm-10.1177_00131644261451746 – Supplemental material for Reliability of Difference Scores Obtained From Nested Data Within a Multivariate Generalizability Theory Framework
Supplemental material, sj-pdf-1-epm-10.1177_00131644261451746 for Reliability of Difference Scores Obtained From Nested Data Within a Multivariate Generalizability Theory Framework by Rabia Karatoprak Ersen, Won-Chan Lee and Donald B. Yarbrough in Educational and Psychological Measurement
Supplemental Material
sj-pdf-2-epm-10.1177_00131644261451746 – Supplemental material for Reliability of Difference Scores Obtained From Nested Data Within a Multivariate Generalizability Theory Framework
Supplemental material, sj-pdf-2-epm-10.1177_00131644261451746 for Reliability of Difference Scores Obtained From Nested Data Within a Multivariate Generalizability Theory Framework by Rabia Karatoprak Ersen, Won-Chan Lee and Donald B. Yarbrough in Educational and Psychological Measurement
Footnotes
Acknowledgements
The authors thank the anonymous reviewers for their constructive feedback and thoughtful comments. An earlier version of this manuscript was developed while the first author was affiliated with Kastamonu University.

Funding
The authors received no financial support for the research, authorship, and/or publication of this article.
Declaration of Conflicting Interests
The authors declared no potential conflicts of interest with respect to the research, authorship, and/or publication of this article.
Supplemental Material
Supplemental material for this article is available online.
References
Supplementary Material
Please find the following supplemental material available below.
For Open Access articles published under a Creative Commons License, all supplemental material carries the same license as the article it is associated with.
For non-Open Access articles published, all supplemental material carries a non-exclusive license, and permission requests for re-use of supplemental material or any part of supplemental material shall be sent directly to the copyright owner as specified in the copyright notice associated with the article.
