
Abstract
Few controlled evaluations of Safe Routes to School (SRTS) initiatives have been conducted. The Texas Childhood Obesity Prevention Policy Evaluation (T-COPPE) study included three conditions: schools awarded infrastructure (I) projects (n = 23), schools awarded noninfrastructure (NI) projects (n = 21), and matched comparison (C) schools (n = 34). Fourth-grade children completed tallies to determine transport to/from schools. Serial cross-sectional surveys were collected from students and parents at baseline (2009) and follow-up (2012). Data were analyzed using mixed linear regression and growth curve models. Morning percent active commuting to school (ACS) in I and NI schools were higher than C schools (p = .024, p = .013, respectively). Afternoon percent ACS in NI schools decreased more over time compared with C schools (p = .009). I and NI school students had higher ACS self-efficacy; similar results were noted for parents in I schools. Policies that provide cost-reimbursement funding for SRTS achieve modest short-term ACS outcomes, with few differences between types of funding allocations.
Introduction
The 2005 U.S. Transportation Bill funded each state to offer Safe Routes to School (SRTS) initiatives to increase active commuting to school (ACS; SAFETEA-LU, 2005). SRTS programs have been found to offer many benefits, including increased physical activity (PA) levels in school children (Bassett et al., 2013; Davison, Werder, & Lawson, 2008; Faulkner, Stone, Buliung, Wong, & Mitra, 2013; Sirard, Alhassan, Spencer, & Robinson, 2008), cost-effectiveness for prevention of pedestrian injuries and associated medical costs (Muennig, Epstein, Li, & DiMaggio, 2014), and potential overall benefits to the community (Henderson et al., 2013; Hubsmith & Mennesson, 2014). Despite these advantages and the widespread implementation of this program, few controlled, robust evaluations have been conducted, especially on a statewide basis. The studies that evaluate SRTS policies or programs tend to focus on determinants of ACS (Chriqui et al., 2012; McDonald, Deakin, & Aalborg, 2010), include small samples (McDonald, Yang, Abbott, & Bullock, 2013), or use uncontrolled designs (Mammen et al., 2014; Stewart, Moudon, & Claybrooke, 2014).
As a part of the 2006 call for programs, the Texas Transportation Commission approved over US$28 million for 250 projects in communities through individual or districtwide grants on a cost-reimbursement basis in 2007. The majority of projects (78%, n = 194) were awarded noninfrastructure projects, which included (a) local program and plan development or (b) local implementation. The remainder of the projects (22%, n = 56) were awarded as infrastructure grants, which included engineering project(s) to allow ACS, such as sidewalks, crosswalks, and so forth. Of the noninfrastructure projects, 170 (68% of the total awards) were funded for development of an SRTS plan, while 24 were funded for local implementation, which included educational, encouragement, enforcement, and evaluation activities (Texas Department of Transportation [TxDOT], 2013).
This allocation of resources allowed for a natural experiment and evaluation of the SRTS policy and programs in Texas. Because the SRTS resources were awarded through a grant mechanism that was limited to only 250 of the roughly 4,400 elementary schools in Texas at that time (Texas Education Agency, 2008), evaluation of the effects of different funding allocation policies (infrastructure vs. noninfrastructure), as well as the use of comparison schools, was possible.
The goals of this study were to determine the effects of differing funding allocation methods (infrastructure vs. noninfrastructure) on student ACS, student physical activity and psychosocial antecedents, and parent ACS-related psychosocial constructs and behaviors. The primary study hypotheses were (a) schools with SRTS infrastructure funding would have a significantly greater percentage of children engaged in ACS compared with schools with SRTS noninfrastructure funding and schools with no SRTS funding, and (b) schools with SRTS noninfrastructure funding would have a significantly greater percentage of children engaged in ACS compared with students in schools with no SRTS funding. Changes in ACS-related parent and student psychosocial constructs, knowledge, and behaviors were expected to follow similar patterns.
Method
Study Design
The study was quasi-experimental using a serial cross-sectional sample, with three conditions: (a) schools with awarded infrastructure (I) projects (n = 23), (b) schools with awarded noninfrastructure (NI) projects (n = 21), and (c) matched comparison/control (C) schools (n = 34). Although funding awards were allocated to either municipalities or school districts, for the purposes of this study, schools that were listed in the application were selected for evaluation. Elementary schools that received funding awards were randomly selected based on funding type, location (urban/rural across Texas), race/ethnicity, and socioeconomic status (SES); comparison schools were matched demographically and regionally to infrastructure and noninfrastructure schools but received no SRTS funding. Noninfrastructure schools had to submit an SRTS plan by 2008, although implementation of the plan was not required. Infrastructure schools were required to have an SRTS plan in place prior to any structural changes and had several years to complete the planned environmental changes. Baseline data were collected in 2009, when SRTS plans were in the process of being developed, submitted, or were in the process of being implemented; follow-up data were collected in 2012, 3 years after baseline, when it was estimated that most infrastructure projects would be underway or completed.
Our evaluation design was based on a child obesity research framework (Perry, Hoelscher, & Kohl, 2015) that incorporates conceptual underpinnings from both the social ecological model (McLeroy, Bibeau, Steckler, & Glanz, 1988) and social cognitive theory (Bandura, 1986). This framework posits that child behaviors (e.g., ACS) are influenced by parent and peer factors, personal factors, the physical and social environment, as well as governmental policies (e.g., Moving Ahead for Progress in the 21st Century Act [MAP-21]; U.S. Department of Transportation, 2015). In the Texas Childhood Obesity Prevention Policy Evaluation (T-COPPE) study, physical environment is operationalized by school infrastructure or built environment changes, while social environment was operationalized as SRTS programmatic changes in schools. The primary outcome for the study was student ACS; secondary outcomes included psychosocial antecedents of ACS, including self-efficacy, perceptions, and social support, as well as student physical activity.
Study Participants
Schools were recruited through districts; within schools, fourth-grade students and their parents were recruited to obtain a final sample of at least 50 students/school. Fourth-grade children were selected as previous data show that children in this grade usually have high rates of ACS relative to other grade levels (National Center for Safe Routes to School, 2010) and would therefore be an appropriate grade to target to see potential changes as a result of the SRTS policies. Active informed consent was obtained from all participating parents; students completed an assent form. All study protocols were approved by the institutional review board at The University of Texas Health Science Center at Houston (UTHealth, HSC-SPH-08-0335) and participating school districts.
Measures and Data Collection
ACS counts were obtained by student self-report at baseline (2009), interim (2010, 2011), and follow-up (2012) time periods for before school (morning) and after school (afternoon) commutes. Morning and after school ACS were averaged to obtain total (day) ACS for each school. Children completed a written tally sheet in class adapted from previous work (Mendoza, Watson, Baranowski, Nicklas, Uscanga, & Hafling, 2010), which included eight categories for transport to school in the morning and afternoon, walk with an adult, walk without an adult, bike, metro bus, school bus, carpool, car, and other. Student–parent convergent validity for written tallies versus parent report was high, and ranged from 100% for same day records to 92% for 3-day recall. Weather data were obtained from meteorological reports for specific locations and dates of data collection.
Serial cross-sectional survey data were collected from fourth-grade students and their parents at baseline (2009) and follow-up (2012) measurement periods, using computer-scanned questionnaires with demonstrated validity and reliability (Hoelscher et al., Submitted). Questionnaires for the students were administered during a class period. Parent surveys were sent home with students and returned to the teacher; parents were instructed to complete their questionnaires using information for their fourth-grade child. All questionnaires were available in both English and Spanish, and approximately 11% of parent surveys were administered in Spanish.
Student surveys
Student questionnaires were adapted from other survey tools with acceptable psychometric properties (Mendoza, Watson, Baranowski, Nicklas, Uscanga, & Hafling, 2010; Mendoza, Watson, Baranowski, Nicklas, Uscanga, Nguyen, & Hafling, 2010; Penkilo, George, & Hoelscher, 2008; Thiagarajah et al., 2008).
Parent surveys
Parent survey items were adapted from the National SRTS Survey (http://www.saferoutesinfo.org/program-tools/evaluation-parent-survey), as well as other questionnaires with demonstrated validity and reliability (Brownson et al., 2004; Cerin, Saelens, Sallis, & Frank, 2006; Hoelscher, Day, Kelder, & Ward, 2003; Mendoza, Watson, Baranowski, Nicklas, Uscanga, & Hafling, 2010; Saelens & Glanz, 2009; Sallis, Taylor, Dowda, Freedson, & Pate, 2002).
Data Management
Scales for psychosocial measures and knowledge were derived from earlier work as previously described (Hoelscher et al., Submitted).
Data Analysis
Descriptive statistics were calculated for all variables. As the study had a pretreatment/posttreatment design, the pre- to post-changes of variables of interest were tested using dependent samples t tests for each school type. Data were further analyzed using mixed linear regression and controlled for random and fixed effects, and other independent variables. Growth curve models were fit to represent the repeated measures of percentage of fourth-grade students using ACS as a function of time and school type, controlling for weather.
Results
Surveys were collected from 78 schools at baseline and 73 schools at follow-up, with approximately 10,000 ACS tallies per measurement time period (Table 1). The study sample of children was approximately half boys; distribution of race/ethnicity was similar at both baseline and follow-up, with a majority of the students Hispanic/Latino (range = 63.5% to 70.3%) and approximately 7% African American (Table 2). There were no statistically significant differences between child gender or race/ethnicity between baseline and follow-up measurement periods. Compared with Texas public school enrollment data from 2010 to 2011 (13% African American, 51% Hispanic, 31% White), the T-COPPE population had more Hispanic and fewer African American and White students. (Texas Education Agency, 2015).
Sample Size for Surveys and ACS Counts by Study Time Period.
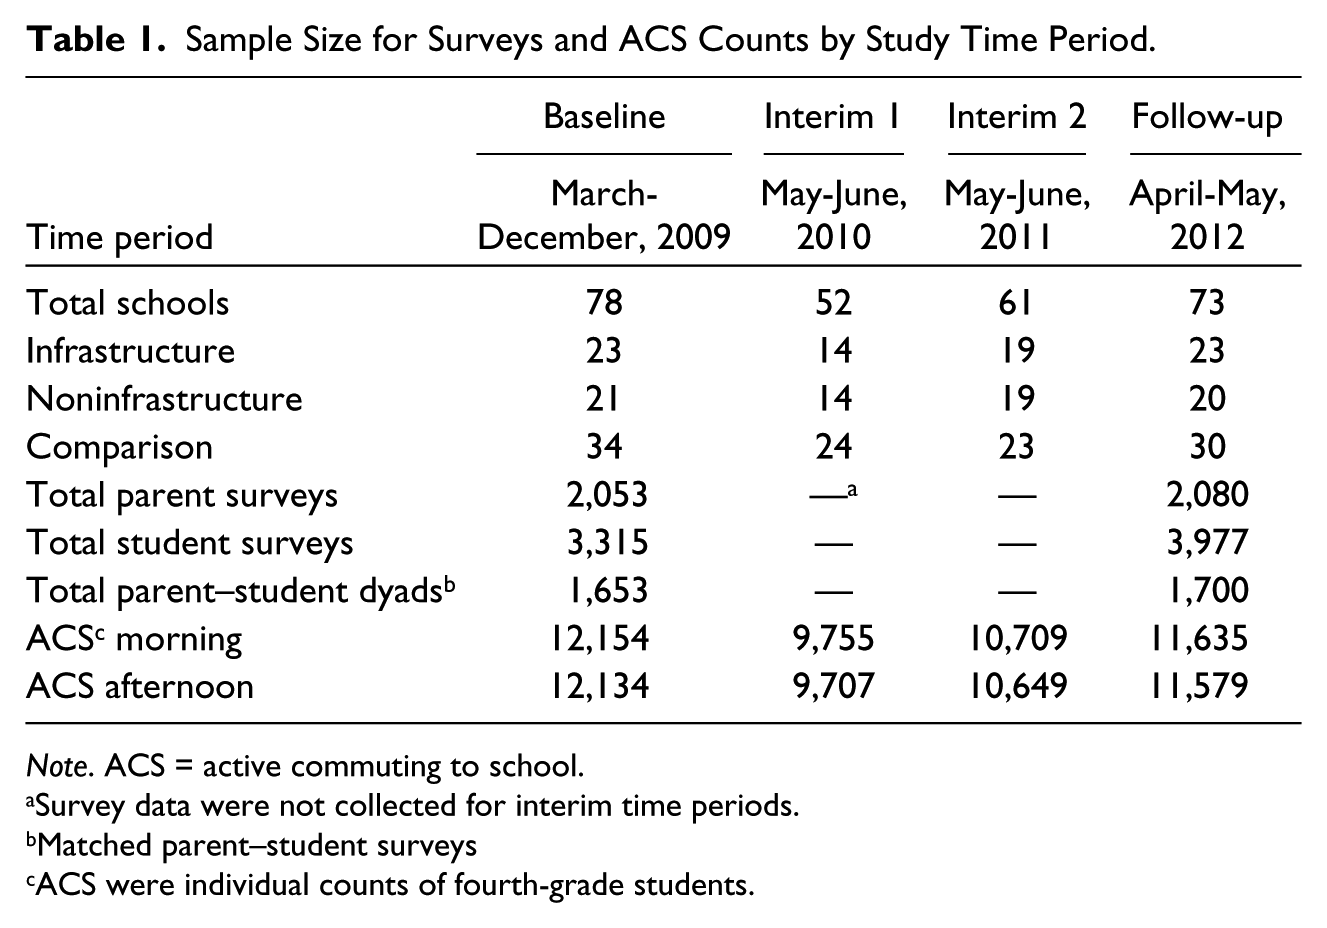
Note. ACS = active commuting to school.
Survey data were not collected for interim time periods.
Matched parent–student surveys
ACS were individual counts of fourth-grade students.
Demographics of Parent Survey Respondents at Baseline and Follow-Up by School Category.
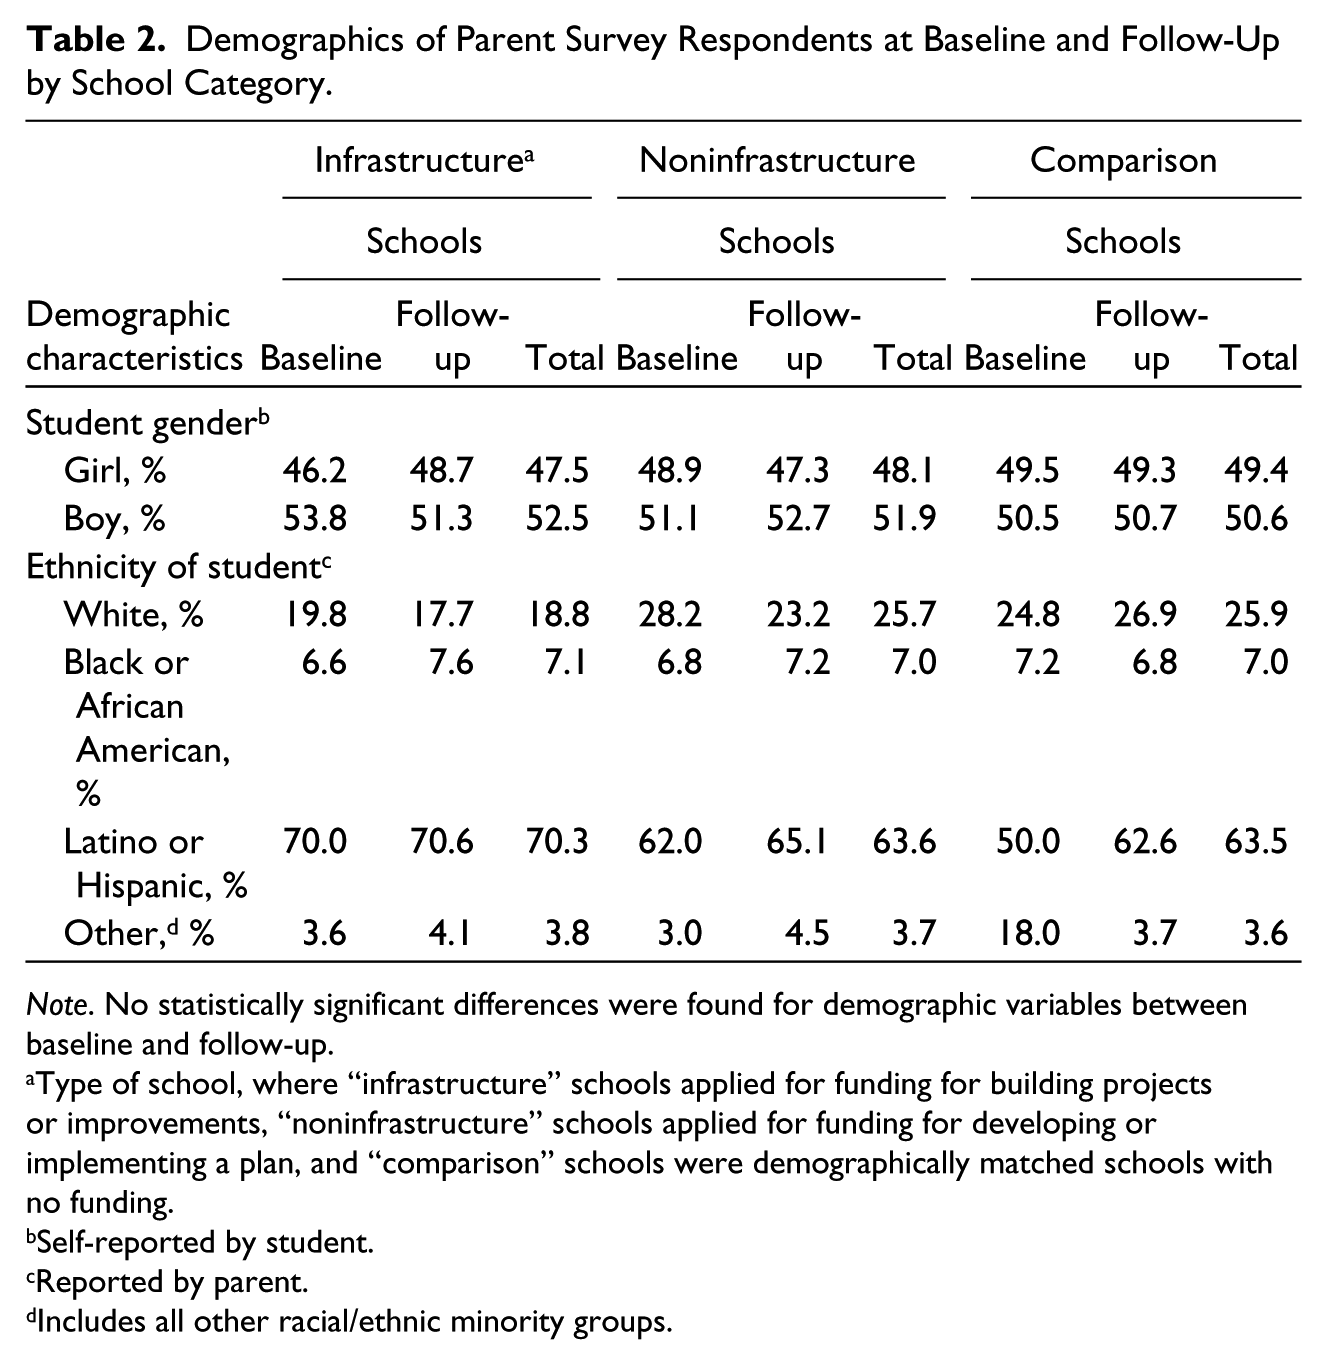
Note. No statistically significant differences were found for demographic variables between baseline and follow-up.
Type of school, where “infrastructure” schools applied for funding for building projects or improvements, “noninfrastructure” schools applied for funding for developing or implementing a plan, and “comparison” schools were demographically matched schools with no funding.
Self-reported by student.
Reported by parent.
Includes all other racial/ethnic minority groups.
Student ACS
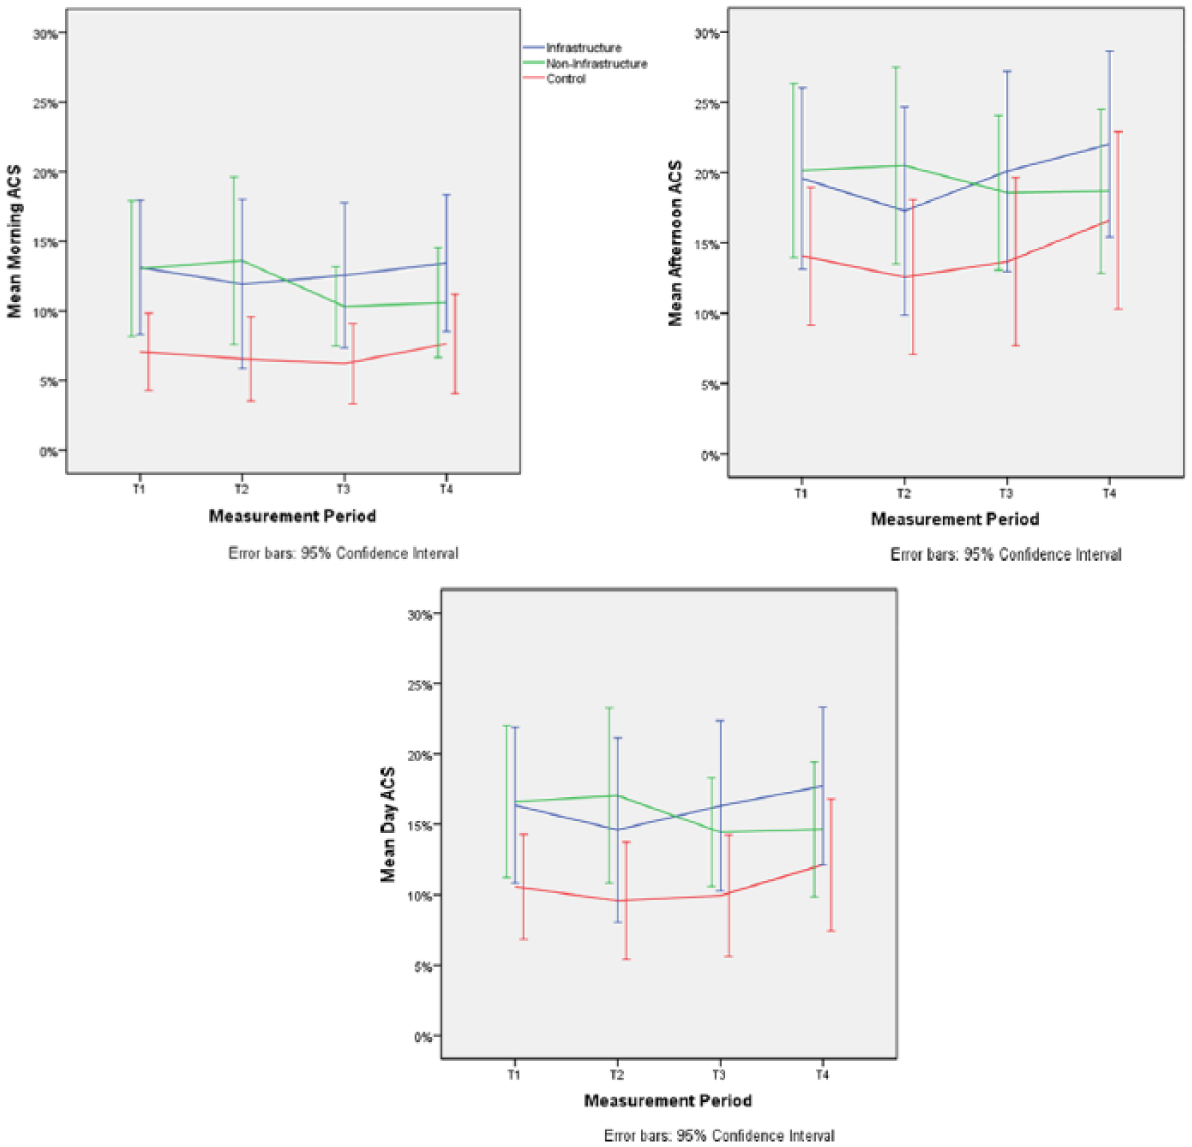
Morning percentages of ACS in infrastructure and noninfrastructure schools were significantly higher than in comparison schools across time (p = .024, p = .013, respectively; Figure 1). Noninfrastructure schools had decreased percent ACS group by time interaction compared with control schools (p = .014). Across all types of schools, no significant overall linear trend was noted for morning percent ACS (p = .746).
Changes in ACS by group, time, and ACS period.a, b
Afternoon percent ACS in noninfrastructure schools decreased more over time compared with control schools (p = .009), although overall, noninfrastructure schools had marginally higher afternoon ACS compared with control schools (p = .084). For afternoon percent ACS, there was an overall increasing trend across all types of schools (p = .015).
Infrastructure schools had marginally higher (p = .078) and noninfrastructure schools had higher total day ACS (0.036) compared with control schools. Total day percent ACS in noninfrastructure schools showed a decreased trend over time compared with control schools (p = .002; Figure 1). Adverse weather decreased total day ACS (p = .017).
Student-Reported Outcomes
Students from all three types of schools reported more days spent taking lessons or practicing sports during the last week (p < .001; Table 3). In addition, students from all school groups reported changes in the total number of days they attended recess during the past week, although the number of days decreased in students from infrastructure schools (p < .05) and increased in students from both noninfrastructure and comparison schools (p < .001). Students from noninfrastructure and comparison schools reported more days with 30 min or more of daily outdoor physical activity (p < .05), which was consistent with overall trends in ACS.
Changes in Student Behaviors and Psychosocial Constructs Over Time by Type of School.
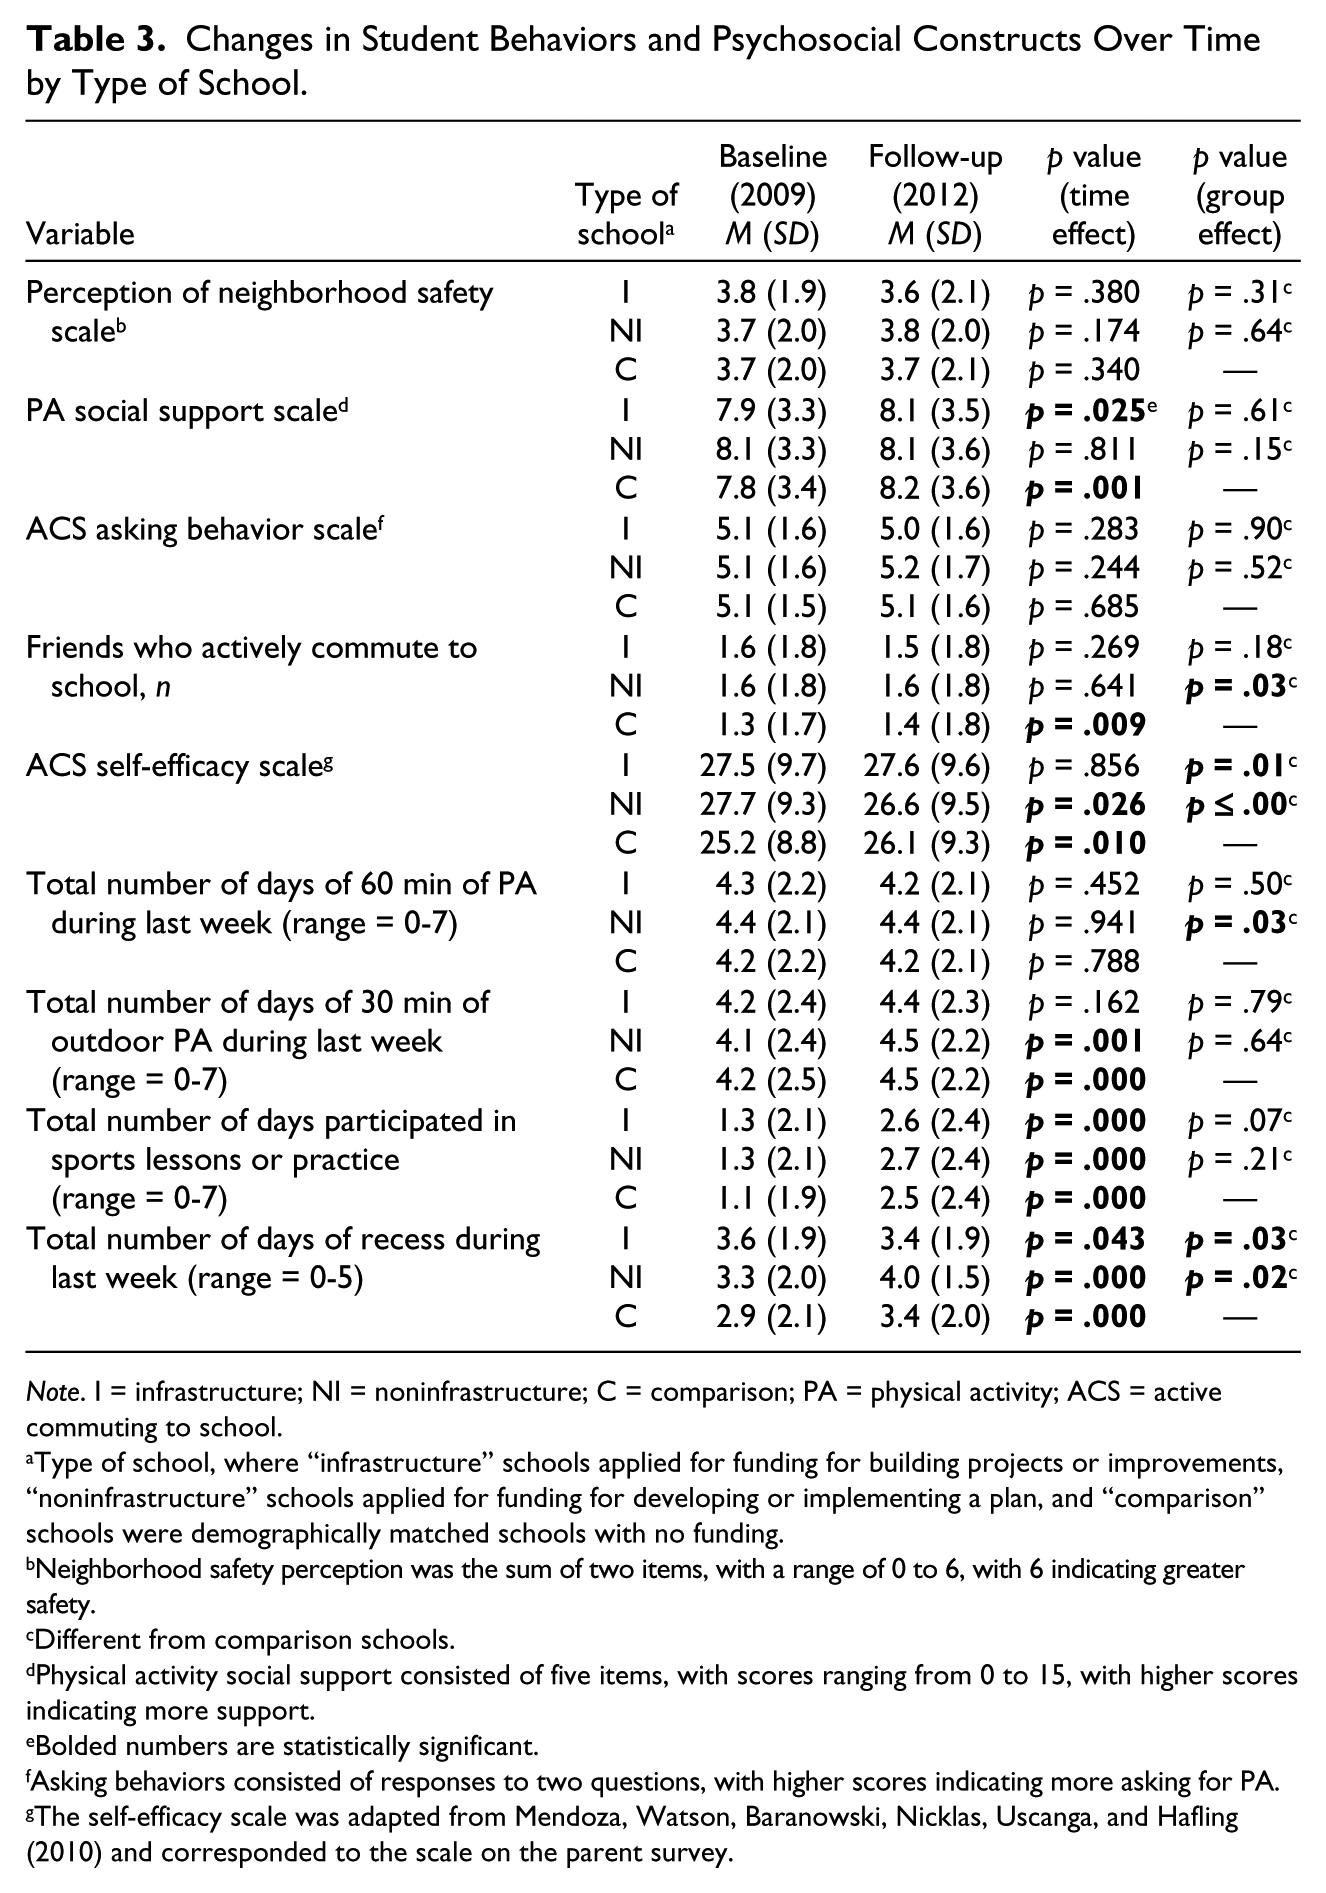
Note. I = infrastructure; NI = noninfrastructure; C = comparison; PA = physical activity; ACS = active commuting to school.
Type of school, where “infrastructure” schools applied for funding for building projects or improvements, “noninfrastructure” schools applied for funding for developing or implementing a plan, and “comparison” schools were demographically matched schools with no funding.
Neighborhood safety perception was the sum of two items, with a range of 0 to 6, with 6 indicating greater safety.
Different from comparison schools.
Physical activity social support consisted of five items, with scores ranging from 0 to 15, with higher scores indicating more support.
Bolded numbers are statistically significant.
Asking behaviors consisted of responses to two questions, with higher scores indicating more asking for PA.
The self-efficacy scale was adapted from Mendoza, Watson, Baranowski, Nicklas, Uscanga, and Hafling (2010) and corresponded to the scale on the parent survey.
In comparison schools, students reported greater perception of parent-supported physical activity (p < .01) and an increased number of friends who walked or rode bikes to school (p < .01); students from infrastructure schools also reported an increase in their perception of parent-supported physical activity (p < .05). Self-efficacy for ACS increased over time for students in the noninfrastructure and comparison schools (p < .05 and p < .01, respectively).
Students from both infrastructure and noninfrastructure schools reported significantly higher self-efficacy scores for ACS (p < .01) and more days of recess during the last week (p < .05) compared with students in the comparison schools. A similar increase in self-efficacy for ACS was seen in the parent self-efficacy score for ACS. Students from noninfrastructure schools reported more days of 60 min or more of physical activity during the last week than students in the comparison schools (p = .03).
Parent-Reported Outcomes
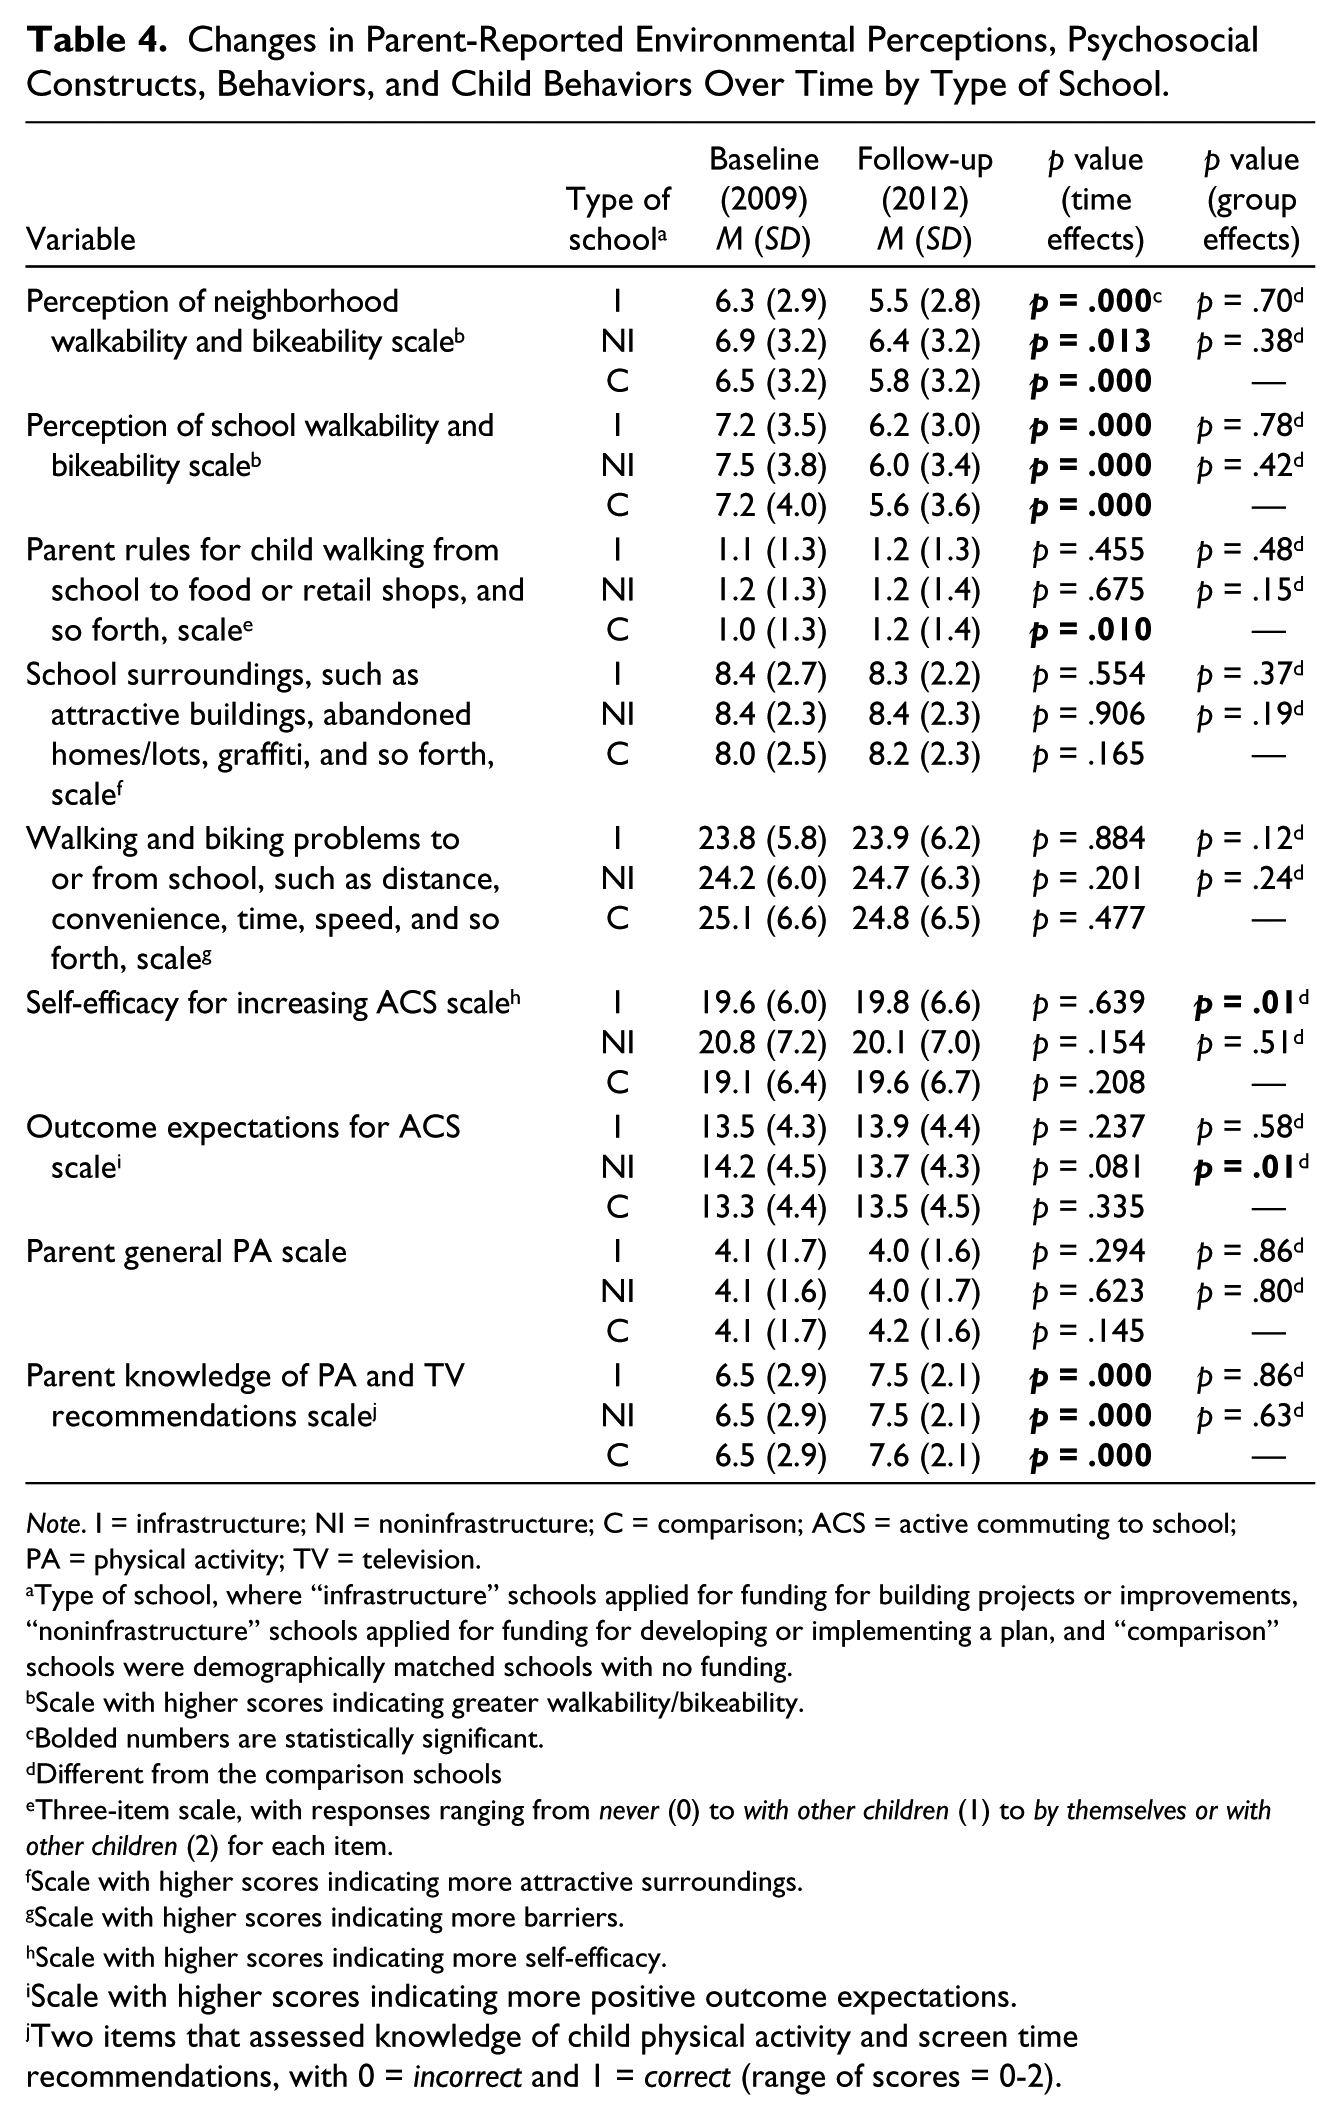
As with the student-reported data, there were fewer group effect differences compared with time effect differences. Parents from all schools, regardless of funding status, reported significantly worse neighborhood bikeability and walkability (p < .05) and significantly worse school walkability and bikeability from baseline to follow-up (p < .001; Table 4). In contrast, parent knowledge of physical activity guidelines increased over time for all types of schools (p < .001).
Changes in Parent-Reported Environmental Perceptions, Psychosocial Constructs, Behaviors, and Child Behaviors Over Time by Type of School.
Note. I = infrastructure; NI = noninfrastructure; C = comparison; ACS = active commuting to school; PA = physical activity; TV = television.
Type of school, where “infrastructure” schools applied for funding for building projects or improvements, “noninfrastructure” schools applied for funding for developing or implementing a plan, and “comparison” schools were demographically matched schools with no funding.
Scale with higher scores indicating greater walkability/bikeability.
Bolded numbers are statistically significant.
Different from the comparison schools
Three-item scale, with responses ranging from never (0) to with other children (1) to by themselves or with other children (2) for each item.
Scale with higher scores indicating more attractive surroundings.
Scale with higher scores indicating more barriers.
Scale with higher scores indicating more self-efficacy.
Scale with higher scores indicating more positive outcome expectations.
Two items that assessed knowledge of child physical activity and screen time recommendations, with 0 = incorrect and 1 = correct (range of scores = 0-2).
Parents from infrastructure schools reported more self-efficacy for increasing ACS than parents from comparison schools (p < .01), while parents from noninfrastructure schools reported higher outcome expectations for ACS than parents from comparison schools (p < .01).
Discussion
Overall, policies that fund SRTS infrastructure and noninfrastructure projects, as implemented in Texas, have modest effects on ACS when evaluated 3 years later. While infrastructure and noninfrastructure schools had higher morning ACS, and infrastructure schools had higher day ACS than comparison schools, over time the differences were attenuated, and noninfrastructure funding appears to have slightly negative effects on ACS over time compared to matched schools without funding. Students from both infrastructure and noninfrastructure schools had higher ACS-related self-efficacy, and a similar finding was noted in infrastructure schools for parents. Students in noninfrastructure schools reported more days of physical activity than students from comparison schools. Parents from all types of schools perceived worse walkability and bikeability in their neighborhoods and schools over time.
Other evaluations of implementation of the SRTS program have found significant changes in ACS over time (Boarnet, Anderson, Day, McMillan, & Alfonzo, 2005; Hinckson, Garrett, & Duncan, 2011; McDonald et al., 2013; Staunton, Hubsmith, & Kallins, 2003; Stewart et al., 2014); however, these studies either did not include a control or comparison group (Boarnet et al., 2005; Hinckson et al., 2011; Staunton et al., 2003; Stewart et al., 2014) or were a small sample (McDonald et al., 2013). Consistent with our findings, a recent systematic review found that most SRTS interventions that were evaluated were quasi-experimental and most reported a small effect size on ACS (Chillón, Evenson, Vaughn, & Ward, 2011) Another study with data from 53 schools participating in a School Travel Planning (STP) program showed no change in ACS after 1 year, although certain areas had localized success (Mammen et al., 2014).
Secular trends for schools to implement SRTS programs or similar initiatives might have explained some of the more robust positive findings. Indeed, we found that more of our outcomes (e.g., perceptions of walkability and bikeability, afternoon ACS, number of days engaged in lessons) significantly changed over time in all groups compared with outcomes that changed between groups. Given that many of the current child obesity efforts emphasize increased PA efforts and changes in the built environment (Institute of Medicine, 2012), it is not surprising that schools without specifically targeted SRTS funding might show program-related changes over time. Parents seem to recognize the emphasis on increased PA (and decreased screen time) as well: parents reported increased knowledge of physical activity and television (TV) watching guidelines across all three groups. Students also reported more days of engaging in physical activity, specifically through lessons or days of recess.
Our evaluation of SRTS funding took a more conservative approach compared with previous studies in that schools that were awarded SRTS grants were evaluated. Many of the SRTS applications were from municipalities, and it might have been that communication between the schools and the municipalities was not adequate. In addition, our qualitative data showed significant turnover in SRTS grantees over the years, and it was difficult to find partners involved in the original grant (Atteberry et al., 2016). The number of community groups involved, funding, and years of participation have been shown to be associated with implementation of SRTS programs (Ward et al., 2007). Thus, stronger ties between community and school partners, as well as multiple years of SRTS program participation could potentially improve outcomes.
The implementation of SRTS policies and funding allocations vary by state (Chriqui et al., 2012; Cradock, Fields, Barrett, & Melly, 2012). Although noninfrastructure funding for programs, events, and crossing guards seems to be as effective as infrastructure changes (Chriqui et al., 2012; Larouche et al., 2014; Rothman, To, Buliung, Macarthur, & Howard, 2014), most states still allocate the majority of their funding to infrastructure projects (McDonald et al., 2013).
In Texas, 61% of all funded projects were noninfrastructure, including four that were statewide implementation services; however, 88% of the funds were allocated to infrastructure projects (TxDOT, 2013). Texas SRTS funds were allocated by a cost-reimbursement procedure where schools and/or communities were required to expend funds to conduct an educational program, develop a plan for implementation, or incorporate structures, such as sidewalks, crosswalks, and so forth, into the school setting (TxDOT, 2013). Data from our community interviews (Atteberry et al., 2016) indicate that many school districts and communities did not have these funds readily available, especially for the infrastructure-type projects, and several ended up not pursuing funding due to difficulties in getting the resources up front. Thus, it appears that methods for allocating funding should include at least partial disbursement of funds when the grant is awarded.
The noninfrastructure schools showed decreased percent ACS over time compared with control schools. This might be because these schools were in the process of gathering data or implementing programs at the time of baseline data collection, and so, the ACS counts might have been higher than normal. In contrast, other studies have shown that support for special SRTS events and designated days can increase child motivation to walk to school (Buckley, Lowry, Brown, & Barton, 2013), but factors influencing long-term maintenance of these programs and policies and the resulting ACS behaviors are not well elucidated.
Parent perceptions showed decreased walkability and bikeability in neighborhoods and at schools across all groups over time. A decrease in ACS is associated with parent perceptions of the neighborhood being unpleasant, so these perceptions can negatively affect ACS (Deweese, Yedidia, Tulloch, & Ohri-Vachaspati, 2013). It has been found that parent perceptions of safety, especially those of the mother (Hsu & Saphores, 2014), are significantly related to ACS, and some parents still feel anxious about ACS (Chaufan, Yeh, & Fox, 2012). Data show that SRTS programs can actually help decrease pedestrian accidents and be cost-effective (Muennig et al., 2014). It is unclear why parents in the T-COPPE study had decreased perceptions of walkability and bikeability, especially because there were no significant changes reported by parents about the school surroundings or barriers to walking and biking (Table 3). Anecdotal data from qualitative interviews (data not shown) suggest that increased traffic in Texas, as well as decreased road maintenance may be partially to blame; quantitative data from the Texas Legislative Budget Board (2015) substantiate this observation. A recent report card by the American Society of Civil Engineers (2012) corroborates some of these findings, by giving Texas a “D” grade for road infrastructure.
Student and parent self-efficacy for ACS was significantly greater in infrastructure schools relative to comparison schools. In a similar study by our research group using baseline data (Lu et al., 2015), parental self-efficacy was positively correlated with student self-efficacy for ACS. As well, environmental constraints were found to be negatively correlated with student self-efficacy; thus, changes in the built environment could reduce environmental constraints and increase self-efficacy.
Study limitations included bias in selectivity of the school sample, timing of the measurement period, and measures of implementation of SRTS programs in the schools. Because study schools (infrastructure and noninfrastructure) had to apply for funding, there are likely to be inherent differences in these schools compared with those schools that did not apply, leading to potential biases, which undermines our ability to infer causation. A more appropriate design might be to use schools or communities that did apply for funding, but did not receive it, as comparison schools. Unfortunately, our study team did not have access to these unfunded schools or communities.
Baseline measures were collected in spring and fall, 2009. This timeline did not necessarily affect the baseline measures for the infrastructure schools as most of the improvements took a longer time to implement, and many of these changes were not yet made for the follow-up measurement period in 2012. For the noninfrastructure schools, plans were due in 2009, which meant that most of the schools or municipalities would have completed the plan development around the time of measurement. Part of the delay in measurement was due to a swine flu epidemic in Texas, which caused schools not to allow any measurements in spring, 2009, thus necessitating moving measurements to fall.
Serial cross-sectional surveys were used for this study, rather than a longitudinal design. Although a longitudinal design might have been more robust, it is documented that ACS rates change by grade level, mostly due to parental concern about letting children walk or bike to school before they are in fourth or fifth grade, and ACS rates can change when children transition to middle school. Both of these factors indicate that a cross-sectional design might in fact work better for this type of study. Many of the measures for physical activity were self-reported, although many of these measures were used previously and have established validity and reliability (Mendoza, Watson, Baranowski, Nicklas, Uscanga, & Hafling, 2010; Mendoza, Watson, Baranowski, Nicklas, Uscanga, Nguyen, & Hafling, 2010; Penkilo et al., 2008; Thiagarajah et al., 2008).
Although measures of implementation of SRTS programs in the schools were not included in this article, qualitative data collected by the research team indicated that infrastructure projects were not always completed by the time of the follow-up survey (data not shown). More long-term follow-up and measurement of program/policy implementation may be necessary to determine outcomes of SRTS infrastructure projects.
Study strengths included a study design that consists of a comparison or control group, standardized measures, community variability, and the use of state-of-the-art statistical techniques. We attempted to match demographics of the comparison school to the infrastructure/noninfrastructure schools as much as possible, but it was not a one-to-one match; however, the demographics were not statistically different between the groups. Most measures for this study were based on previous work and have established validity and reliability. As previously described, the schools in this study had significant variability, in terms of state location, populations, and school districts (Hoelscher et al., Submitted). Finally, the use of growth curve modeling is innovative in the assessment of percent ACS and enabled us to detect modest differences in changes in child ACS over time.
Implications for Practice and Policy
Policies that provide cost-reimbursement funding for SRTS initiatives are able to achieve modest outcomes in the short term, but few differences are seen between providing larger amounts of funding for infrastructure projects compared with smaller amounts of funding for SRTS programs. In particular, noninfrastructure activities need mechanisms for continued support or maintenance over time. Interventions also need to focus on parent perceptions of walkability and bikeability of the neighborhood and schools, regardless of funding allocation.
Research materials related to the T-COPPE study can be found at http://go.uth.edu/TCOPPE.
Footnotes
Declaration of Conflicting Interests
The author(s) declared no potential conflicts of interest with respect to the research, authorship, and/or publication of this article.
Funding
The author(s) disclosed receipt of the following financial support for the research, authorship, and/or publication of this article: This study was funded by the Robert Wood Johnson Foundation, with partial funding from the Michael & Susan Dell Foundation to the Michael & Susan Dell Center for Healthy Living, and contributions from The University of Texas School of Public Health, Texas A&M Health Science Center School of Public Health, Texas Health Institute, Live Smart Texas, and the Texas Department of State Health Services.