






Abstract
Objective
To use eye tracking to understand the effects of interruptions in different workload conditions as part of a monitoring and change detection task.
Background
Interruptions are detrimental to performance in complex, multitasking domains. There is a need for better display design techniques that help users overcome interruptions regardless of their workload level. This requires understanding a user’s attentional state immediately after an interruption in order to determine what type of display adjustments are most suitable.
Method
An emergency dispatching simulator was developed with a visual primary task and auditory interruptive task. Two levels of workload were induced by varying the number of emergency vehicles to monitor for changes and the rate of changes to monitor. Eye tracking, performance, and subjective measures (NASA-Task Load Index) were collected and analyzed for 41 participants.
Results
As expected, high workload interacted with interruptions to further degrade primary task performance and alter participants’ attention allocation immediately after the interruption. Participants in the high workload condition had more narrowed, slower scan patterns immediately after the interruption as compared to before the interruption, as evidenced by lower scanpath length per second and mean saccade amplitude. However, this change was not observed in low workload.
Conclusion
High workload modulates the effects of interruptions on performance and eye movements. Users in the high workload condition struggle to quickly scan the display in the seconds following an interruption.
Application
The results can provide insight into the type of display adjustments needed right after an interruption in a high-workload environment.
Introduction
Interruptions are common features of modern workplaces and can cause anxiety, frustration, and decrements in performance (González & Mark, 2004). An interruption is defined as any time one line of work (the primary task) is stopped before it is finished by a secondary or interruptive task, with the intention of resuming the primary task at a later time (Boehm-Davis & Remington, 2009). In some cases, the secondary task suspends all work on the primary task, whereas in other cases, attention is divided between the primary and secondary task.
The effects of interruptions and multitasking in general can be particularly detrimental in safety-critical domains such as aviation, healthcare, and emergency response, where task disruptions can have major costs (Loft et al., 2015). These costs include an increase in the amount of time needed to complete one’s primary task and an inability to resume the primary task (Trafton & Monk, 2007). The problem of interruptions may also be compounded by the presence of high workload, which is another feature of complex domains that is known to degrade performance (Staal, 2004). Workload has been defined as the relationship between the amount of cognitive effort needed to accomplish a certain task and the available mental capacity (Hart & Wickens, 1990). While some studies have looked at how workload levels are affected by interruptions (Bailey & Iqbal, 2008), and others have found varying effects of interruptions on performance in different levels of task demand (Speier et al., 1999), the goal of this study was to understand how workload modulates the effects of interruptions, both in terms of performance, and, more importantly, visual attention allocation immediately after the interruption. Gaining detailed insights on how interruptions affect people’s eye scanning strategies can inform the design of tailored interventions that support interruption recovery in different workload levels.
Several solutions have been developed in an effort to aid interruption recovery, particularly in complex, data-driven, multitasking domains where interruptions are common. Typical solutions involve presenting users with an event timeline or log of changes (Hodgetts et al., 2015), an “instant replay” of events (e.g., St. John et al., 2005), or an indicator next to the changed values (van der Kleij et al., 2018) to support operators in their resumption of the primary task after an interruption. The theoretical underpinning for such tools is the Memory for Goals theory (MfG; Altmann & Trafton, 2002), which suggests that goal activation levels decay with time, with the current goal having the highest activation level. Interruption recovery tools can then support the reactivation of pre-interruption goals to support the resumption of the primary task. However, not all of these proposed interruption recovery tools have led to improved performance. For example, Hodgetts et al. (2015) investigated the use of a change history display in comparison to a display of a timeline of events, but found that both displays were worse than providing no support. This was attributed to the limited availability of attentional resources, which meant that participants were unable to shift their attention to the side of the screen and acquire information from the decision support tools.
What is lacking in the abovementioned approaches is an ability to provide display modifications that are based on the user’s attentional state after the interruption, which may depend on contextual factors such as the workload imposed by the primary task. It could be that someone who is experiencing attentional narrowing or tunneling would require a signal placed in the field of vision. On the other hand, someone who is confused and randomly looking all over the display would likely need a different type of support tool. In such a case, it could be that an alert in a different modality, such as an auditory alert, would work better.
The Benefits of Eye Tracking
One way to determine which support tool works best in different contexts is to use an eye tracker to trace visual attention allocation and trigger appropriate display adjustments. The building blocks of eye tracking data are fixations and saccades. Fixations are localized gaze points that last for a certain duration, during which visual processing takes place (Findlay, 2004). Saccades are rapid eye movements between consecutive fixations, at which time no visual processing occurs (Yarbus et al., 1967). A sequence of fixations and saccades is called a scanpath (Noton & Stark, 1971).
Eye tracking has been used to a relatively good extent in interruption research (e.g., Bailey & Iqbal, 2008; Cauchard et al., 2012; Chamberland et al., 2018; Ratwani & Trafton, 2011). Hodgetts et al. (2014, 2015) showed, for example, that fixation number tends to increase and fixation duration tends to decrease in the 20 s after an interruption as compared to before. Similarly, Gartenberg et al. (2014) reported more frequent and shorter fixations after interruptions to an unmanned vehicle supervisory control task, as well as more fixations to objects that had been previously looked at. This also indicated that participants were trying to regain their awareness of the state of the task, and was interpreted by Gartenberg et al. (2014) in light of the MfG theory (Altmann & Trafton, 2002) as a reactivation of pre-interruption goals.
Most studies that have investigated the effects of interruptions on eye movements have used metrics such as the number of transitions between areas of the screen, the location of the first fixation after the interruption (Hodgetts et al., 2015) and number of fixations on relevant versus irrelevant areas (Ratwani & Trafton, 2011), which are valid and informative, but not area-independent. An area-independent metric is one that can be calculated for any display without the need to define an area of interest, meaning that it can be more easily generalized across displays. Eye tracking metrics can then be used to inform the design of intelligent displays that can change based on the operator’s attention allocation and support in interruption management and recovery. Although some solutions have been developed, their applications have been limited to simpler tasks, such as reading, that involve static displays (Jo et al., 2015; Kern et al., 2010). In more complex domains, area-independent metrics have rarely been used. A notable exception is a study by İşbilir et al. (2019), but the sample size was limited, and they explored the response to an error message after the interruption, rather than the effects of an interruption on an ongoing task.
The Present Study
Thus, the overall goal of this study was to use eye tracking—namely, area-independent metrics calculated over a short window of time immediately after an interruption—to understand the effects of interruptions in different workload conditions as part of a monitoring and change detection task. Primary task demand was manipulated to induce different workload conditions. Auditory interruption alerts (with visual tasks) were the focus since they are the conventional means of conveying warning, urgent, and emergency information in safety-critical domains (Wickens et al., 2005).
More specifically, our aims were to determine (1) how different workload levels affect interruption recovery performance as part of a complex task, and (2) how workload interacts with interruptions to affect attention allocation immediately after an interruption, as compared to before. To these ends, a simulator study was carried out using emergency dispatching as the chosen domain, given that it involves interruptions and monitoring as part of a complex, high-workload environment (Blandford & William Wong, 2004). Table 1 shows the three area-independent metrics that were selected for this experiment. Scanpath length per second and mean saccade amplitude were selected because they provide insight on a person’s scanning strategy; in other words, they indicate how a person is scanning a display, without any regard to location. Scanpath length per second would indicate whether they are scanning quickly or slowly, whereas mean saccade amplitude would indicate whether they are jumping between far-reaching areas of the screen in a more haphazard fashion or focusing on more systematically scanning close areas. Mean fixation duration was included as a third metric given its ability to indicate the speed and difficulty of processing information at each fixation (Hodgetts et al., 2014).
Overview of the Eye Tracking Metrics Used in This Study

The eye tracking metrics used in this study were calculated over a 3 s interval immediately before and after the interruption since the shorter the interval, the sooner any display adjustments can be provided to support the user. This can then prevent further performance breakdowns from occurring. A 3 s interval was used since (a) it would be a significantly lower duration than other time intervals that have been used to date in interruption research, and (b) this interval has been successfully used in the past with these eye tracking metrics, albeit in the context of research on data overload (Moacdieh & Sarter, 2017). The rationale is that the interval would be used as a starting point, given that it has been trialed before, with the expectation that the interval could then be shortened in future studies.
In line with our two objectives, we expected that workload would interact with the presence of interruptions to lead to worse performance after an interruption in the case of high workload, and that this interaction would be reflected in altered eye movements that would help explain the performance decrements. In other words, we expected that high workload would further accentuate the effects of interruptions. We hypothesized that (1) worse performance would manifest itself in terms of higher error rates and longer response time, and (2) attention allocation would become faster (i.e., higher scanpath length per second and lower mean fixation duration) and more far-reaching (higher mean saccade amplitude) as participants make more of an effort to try and recover from the interruption and scan the display for changes in high workload. While no previous studies have directly compared low- and high-workload situations within the same context, our expectations for the performance results are based on the findings of Speier et al. (1999), who observed performance decrements after an interruption for complex primary tasks but not simple ones. For the eye tracking metrics, our expectations are based on the results that have been obtained in similar complex, high-workload environments (e.g.,Hodgetts et al., 2014).
Methods
Participants
The participants in this study were 41 students (28 men and 13 women, mean age (M) = 21.7 years, standard deviation (SD) = 3.7) from the American University of Beirut (AUB) with normal or corrected-to-normal color vision. Each participant was compensated with a $10 restaurant voucher, and the top three participants in terms of performance received an additional $30, $20, and $10, respectively. This research complied with the tenets of the Declaration of Helsinki and was approved by the AUB Institutional Review Board. Informed consent was obtained from each participant.
Experimental Setup
A Tobii X3-120, desktop-mounted, infrared-based eye tracker was used to collect eye tracking data. This eye tracker uses binocular tracking and samples at 120 Hz. The gaze accuracy during binocular tracking is .4 degrees visual angle. The eye tracker was placed beneath a 24-inch, 1920 × 1200 pixel monitor at around 60 cm from each participant (68.2 degrees visual angle).
Experiment Simulator
The task that participants had to perform for this study required them to take on the role of an emergency dispatcher (Figure 1). The simulator was developed specifically for this study and was first described in Kanaan and Moacdieh (2018). Participants’ primary task was monitoring moving emergency aid vehicles on a map for changes in their two characteristics: the vehicle’s level of resources and estimated time of arrival (ETA). In addition to a primary task, participants had to deal with an interruptive task. The interruptive task was triggered by participants pressing on certain randomly designated vehicles. In other words, participants would only get an interruption while they were addressing a change in resource level or ETA.
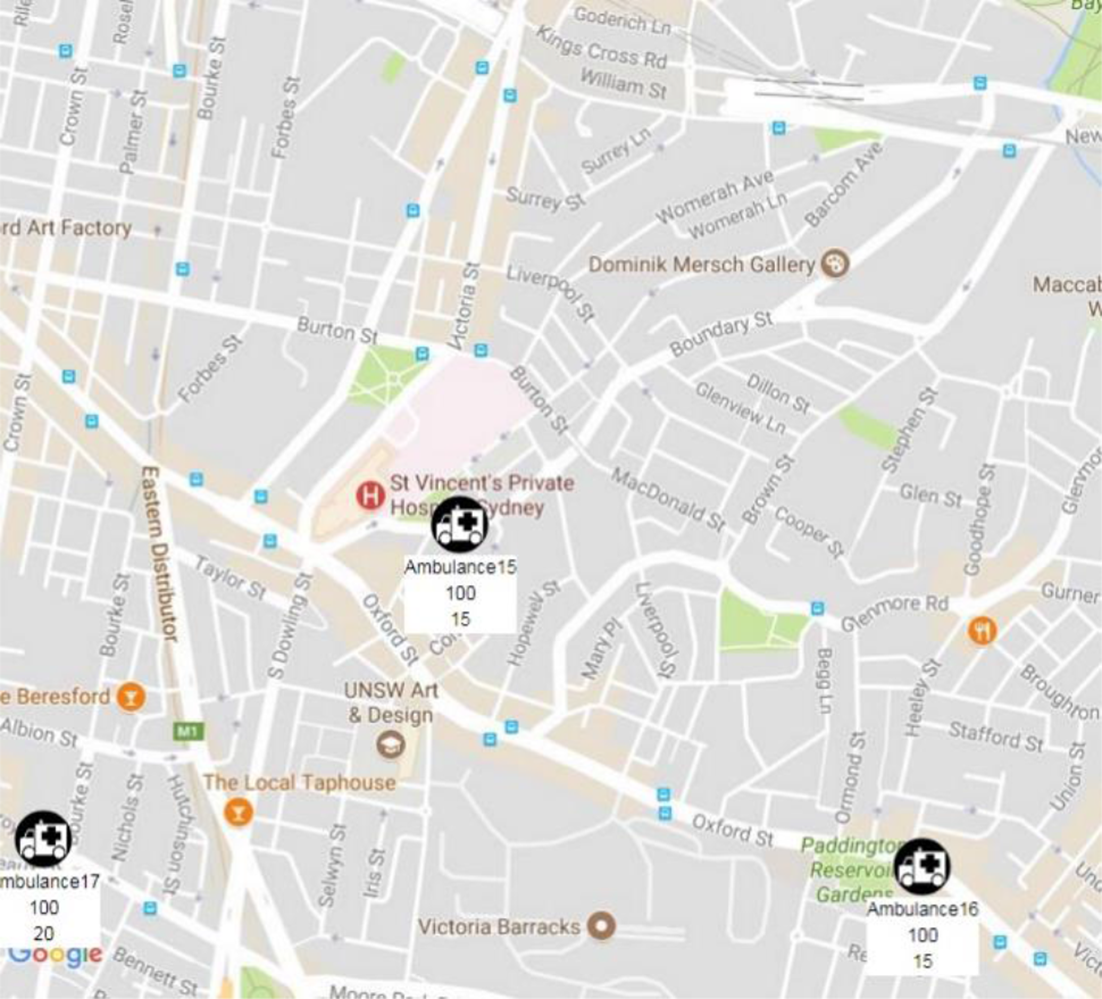
General view of one part of the simulator screen
The primary and interruptive tasks were carried out by participants as part of twelve 90 s trials. There were always several primary subtasks in each trial but exactly one interruption. Once participants triggered the interruption, no other vehicles could trigger an interruption. There was always at least 15 s left in the trial after the interruption ended. The location of the interruption incident that appeared on the display was counterbalanced by placing the interruption event icon in different quadrants of the screen in different trials.
Experiment Design
Independent variables
Two independent variables were manipulated in this experiment:
Workload (low workload, high workload): task demand was manipulated within-subjects in order to induce low-workload and high-workload trials. This was done by varying the number of vehicles that appeared on the map, in addition to the rate of changes (in resource levels and ETA) that participants had to detect. Low-workload trials had between 3 and 6 vehicles on average. During its time on the screen, each vehicle would have at most two changes. On the other hand, in high workload trials, there were 16–19 vehicles on average and four resource/ETA changes per vehicle. The number of vehicles for each workload condition and the number of changes per vehicle were determined using pilot studies. There were six trials in each of the low and high workload conditions, for a total of 12 trials in the experiment. The dispersion and movement of the vehicles on the screen were randomly assigned. The changes in resource and ETA levels were also randomly dispersed throughout the trial. The workload variable was counterbalanced by dividing participants into two groups, one starting with the six low-workload trials and the other starting with the six high-workload trials.
Interruption phase (before interruption, after interruption): this independent variable was also varied within-subjects, based on the different phases of the experiment presented in Figure 2. “Before interruption” consisted of the primary task performance (monitoring vehicles and detecting changes in resource or ETA values) before the interruption. “After interruption” consisted of the period of time after the interruptive task ended, during which the user is back to performing the primary task only. Recall that there was only ever one interruption per trial, so there was never any overlap between interruptions. For the purposes of performance assessment, the “before interruption” and “after interruption” phases were considered to be 10 s in order to assess a full primary task in each phase. On the other hand, for the eye tracking metrics, these were compared in the last 3 s before the interruption and the first 3 s after the interruption, in order to capture participants’ scanning strategies over a small window of time.
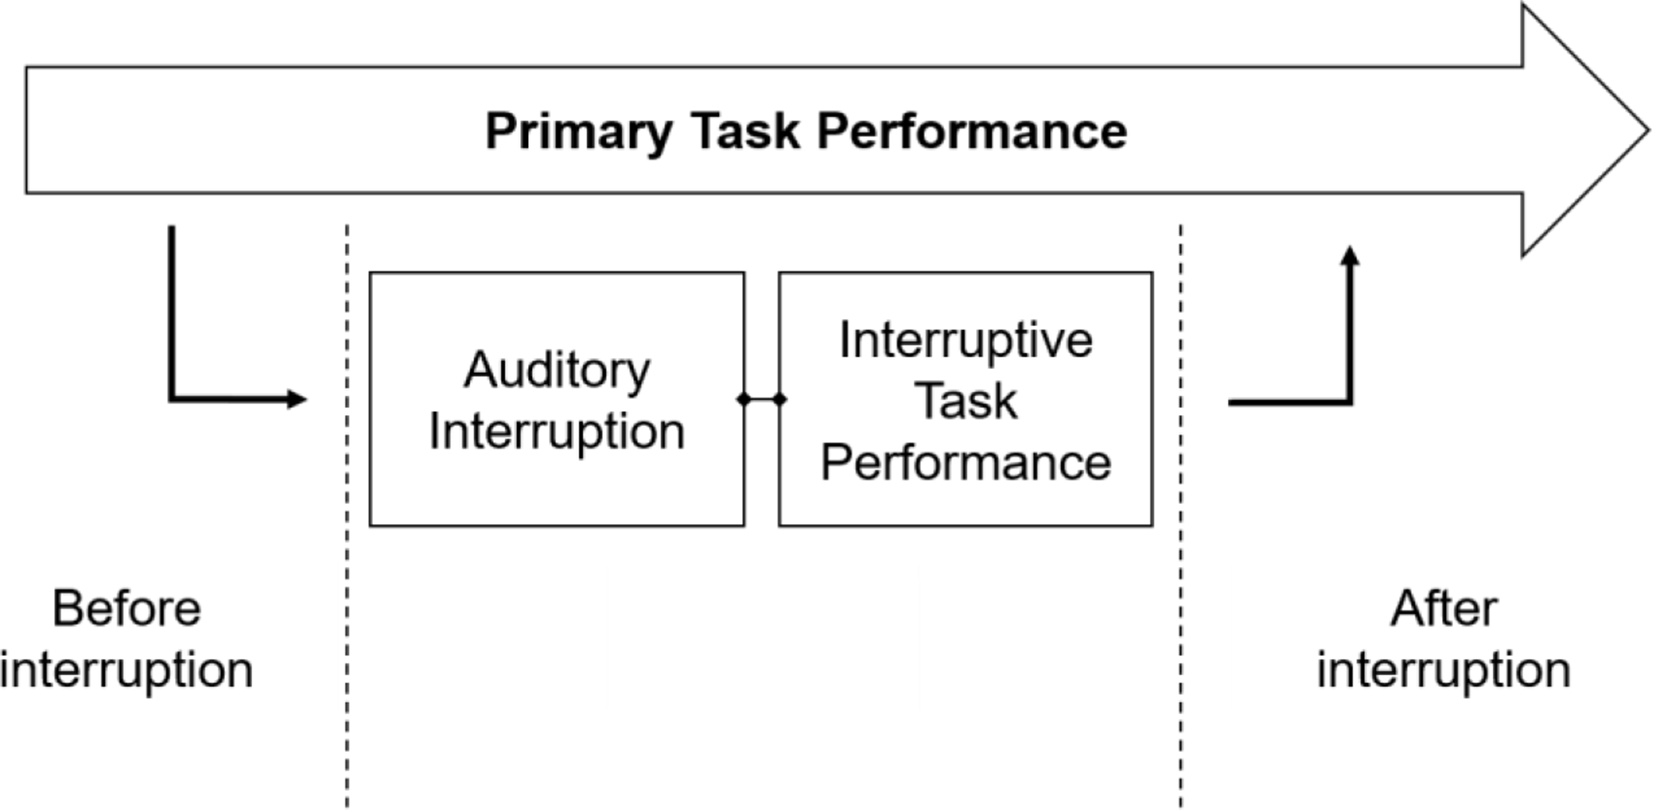
Timeline of different phases in this study, in relation to the primary task and the interruption
Among the 12 trials, two of those were “dummy” trials (one low and one high workload trial) where no interruptive task was presented; the data for these trials was not collected. These dummy trials were used so that participants would not realize that there would always be an interruption. The remaining 10 trials all contained exactly one interruption each.
Dependent variables
Subjective, performance, and eye tracking data were collected for the study. A NASA-TLX questionnaire (Hart & Staveland, 1988) was used as a manipulation check for workload. From the questionnaire, we obtained subjective ratings of mental demand, physical demand, temporal demand, effort, frustration, and performance on a scale from 1 (least effort/demand or worst performance) to 10 (most effort/demand or best performance). The questionnaire was filled twice: once after the completion of the high workload trials and once after low workload trials.
Several performance measures (Table 2) were calculated in order to understand how interruptions affected performance and, in turn, to be able to interpret the eye tracking metrics. Our main focus, however, was on the first two metrics: detection miss rate and response time. As for the eye tracking data, this consisted of the three metrics described in Table 1. The gaze points from the eye tracker were used to calculate fixations and saccades (the eye tracker automatically filters out blinks and fixations outside the screen were discarded). The fixation algorithm of Goldberg and Kotval (1999) was used. A cluster of gaze points was considered a fixation if the points in the cluster were within 75 pixels of each other, and there was a minimum number of six gaze points within this fixation cluster. At a sampling rate of 60 Hz, requiring a minimum of six gaze points meant that the minimum fixation duration was 100 ms. The first gaze point outside the 75-pixel limit was considered to not be part of the fixation; the gaze point just before would be the endpoint of the fixation. Any gaze points that were not part of fixations were assumed to be saccades. The eye tracking metrics were calculated using Matlab.
Summary of Performance Metrics; with the Exception of the Detection Miss Rate and Response Time, All Other Metrics Were to Be Compared Across Workload Levels Only

Experiment Procedure
Participants first gave written informed consent. Then they were given a training session about the experiment and performed two training trials: one with low workload and one with high workload. Headphones were used to deliver the auditory interruptive task to participants.
The primary and interruptive tasks were then explained to participants, who were told to give them give equal priority. For the primary task, the normal values were 100% for the resource level and 15 min for the ETA. A change in resource level would be a drop to a random number below 100, whereas a change in the ETA would be an increase to a random number above 15. The two characteristics were always displayed in order (resource level followed by ETA) below the moving vehicle. Upon detecting any change in either of those numbers, participants were required to click on the affected vehicle and perform a subtraction task to “correct” the changed value. For example, if the resource level dropped to 93, participants had to perform the subtraction operation “100–93” (Figure 3a). Participants had 15 s to respond to the primary task.
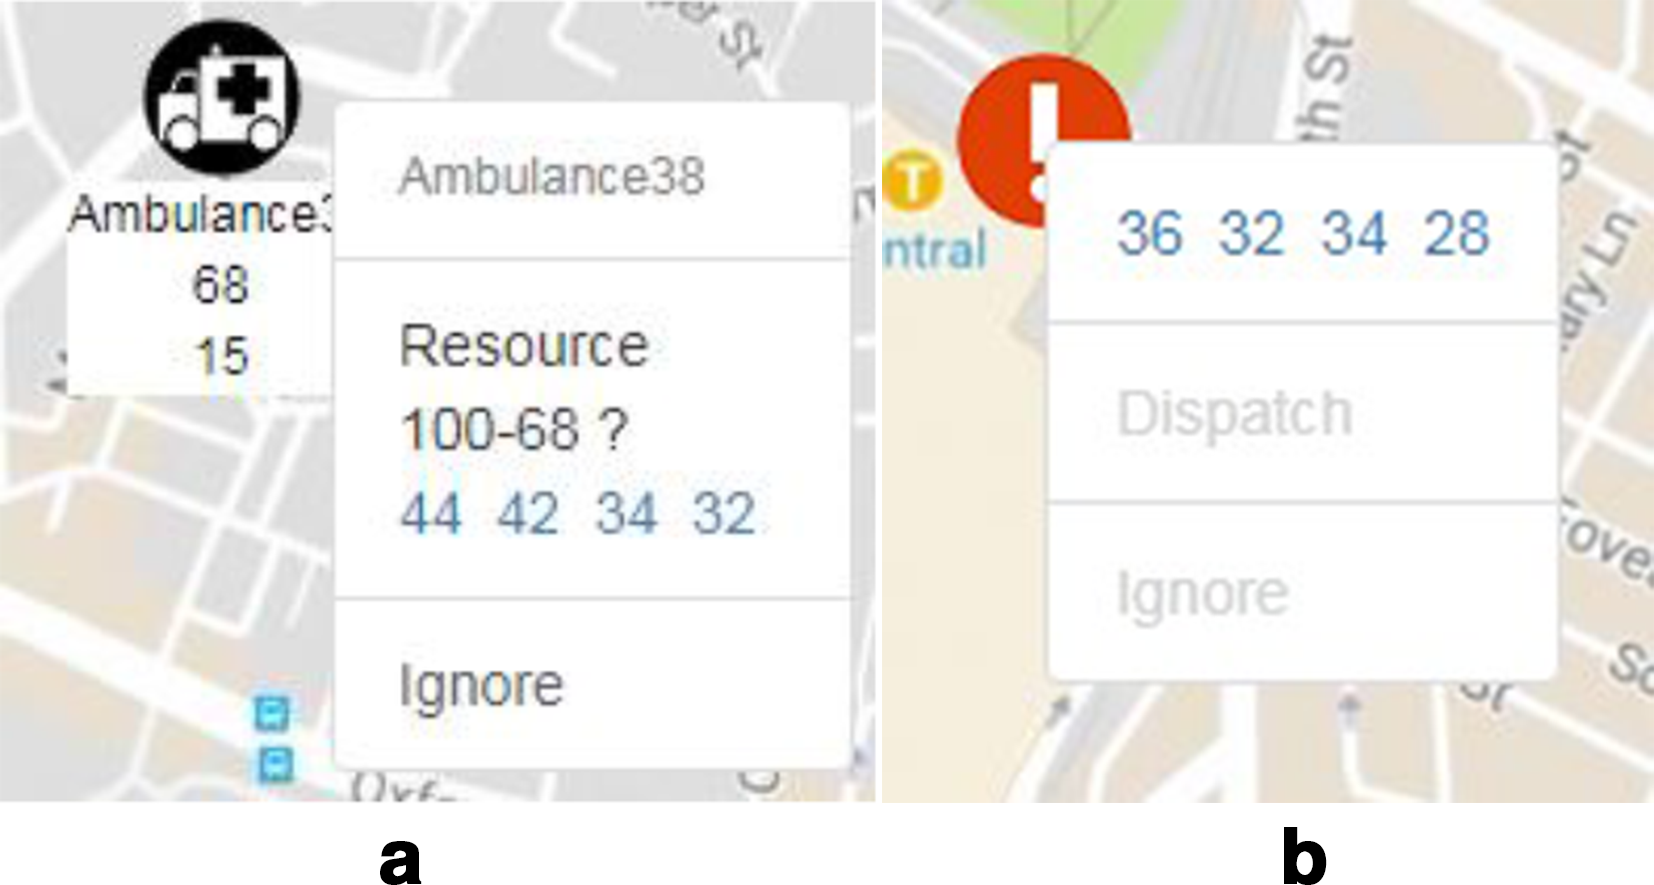
(a) primary arithmetic task showing a decrease in the resource level from 100 to 68; the correct response would then be 32, and (b) event icon and menu presented after the auditory interruptive arithmetic task.
On the other hand, the interruption task consisted of an automated voice giving participants an arithmetic task. It could be addition, subtraction, multiplication, or division with at least one single-digit number in each operation. The duration of the instructions was two to 7 s (M = 3.65, SD = .89). After the recording ended, a “new emergency” icon appeared on the map (Figure 3b). The participant had to click on that icon to reveal a menu and select the answer to the arithmetic task. The participant then chose either to click “dispatch” (if the result of the auditory task was above or equal to 30) or “ignore” (if the result was less than 30). The options were greyed out (i.e., visible but not clickable) until after the answer to the arithmetic task was clicked. The options became visible whether the correct answer was selected or not. After pressing dispatch or ignore, the auditory interruptive task disappeared. Participants had 15 s (starting from when the auditory notification ended) to respond to the interrupting task before the task disappeared. While performing the interrupting task, the participant could still address the primary tasks.
After the training session, the eye tracker was calibrated. Next, participants went through twelve 90 s experiment trials, the first six either low or high workload and the other six the opposite level of workload. Participants filled out a NASA-TLX questionnaire after each set of low or high workload trials. There was a 5 min break in between each set of 6 trials after the NASA-TLX scores were completed. The total time for an experiment session was around 40 min.
Analysis Strategy
Table 3 summarizes the analysis strategy adopted in this study for each dependent measure. All of the analysis was conducted using IBM SPSS Statistics.
Analysis Strategy for Each of the Dependent Measures

Results
All bars on the graphs indicate the standard error of the mean. Greenhouse-Geisser approximations were used in case the assumption of sphericity was not met according to Mauchly’s test, and Bonferroni corrections were used for multiple comparisons. One high workload trial had to be discarded for all participants due to a software problem discovered after the experiment. The final count of experiment trials (excluding dummy trials) was thus 5 low-workload and 4 high-workload trials. Preliminary results were reported in Kanaan and Moacdieh (2018).
As a manipulation check, the NASA-TLX results were analyzed using the Wilcoxon signed-rank test for ordinal data (Table 4). All NASA-TLX metrics showed significant differences between the low and high workload conditions, suggesting that the workload condition was successfully manipulated (note that the Performance subscale relates to how well participants thought they performed; participants thus thought they had performed better in the low workload condition).
Summary of NASA-TLX Results

Performance Results
Before the interruption, the detection miss rate was 25.85 % (SD = 11.86) and 62.19 % (SD = 8.54) in the low- and high-workload conditions, respectively (Figure 4a). After the interruption, it was 14.16 % (SD = 13.22) and 55.82 % (SD = 8.30) in the low- and high-workload conditions, respectively. There was no significant interaction effect, but there was a significant main effect of phase (F(1, 40) = 38.955, p < .001,
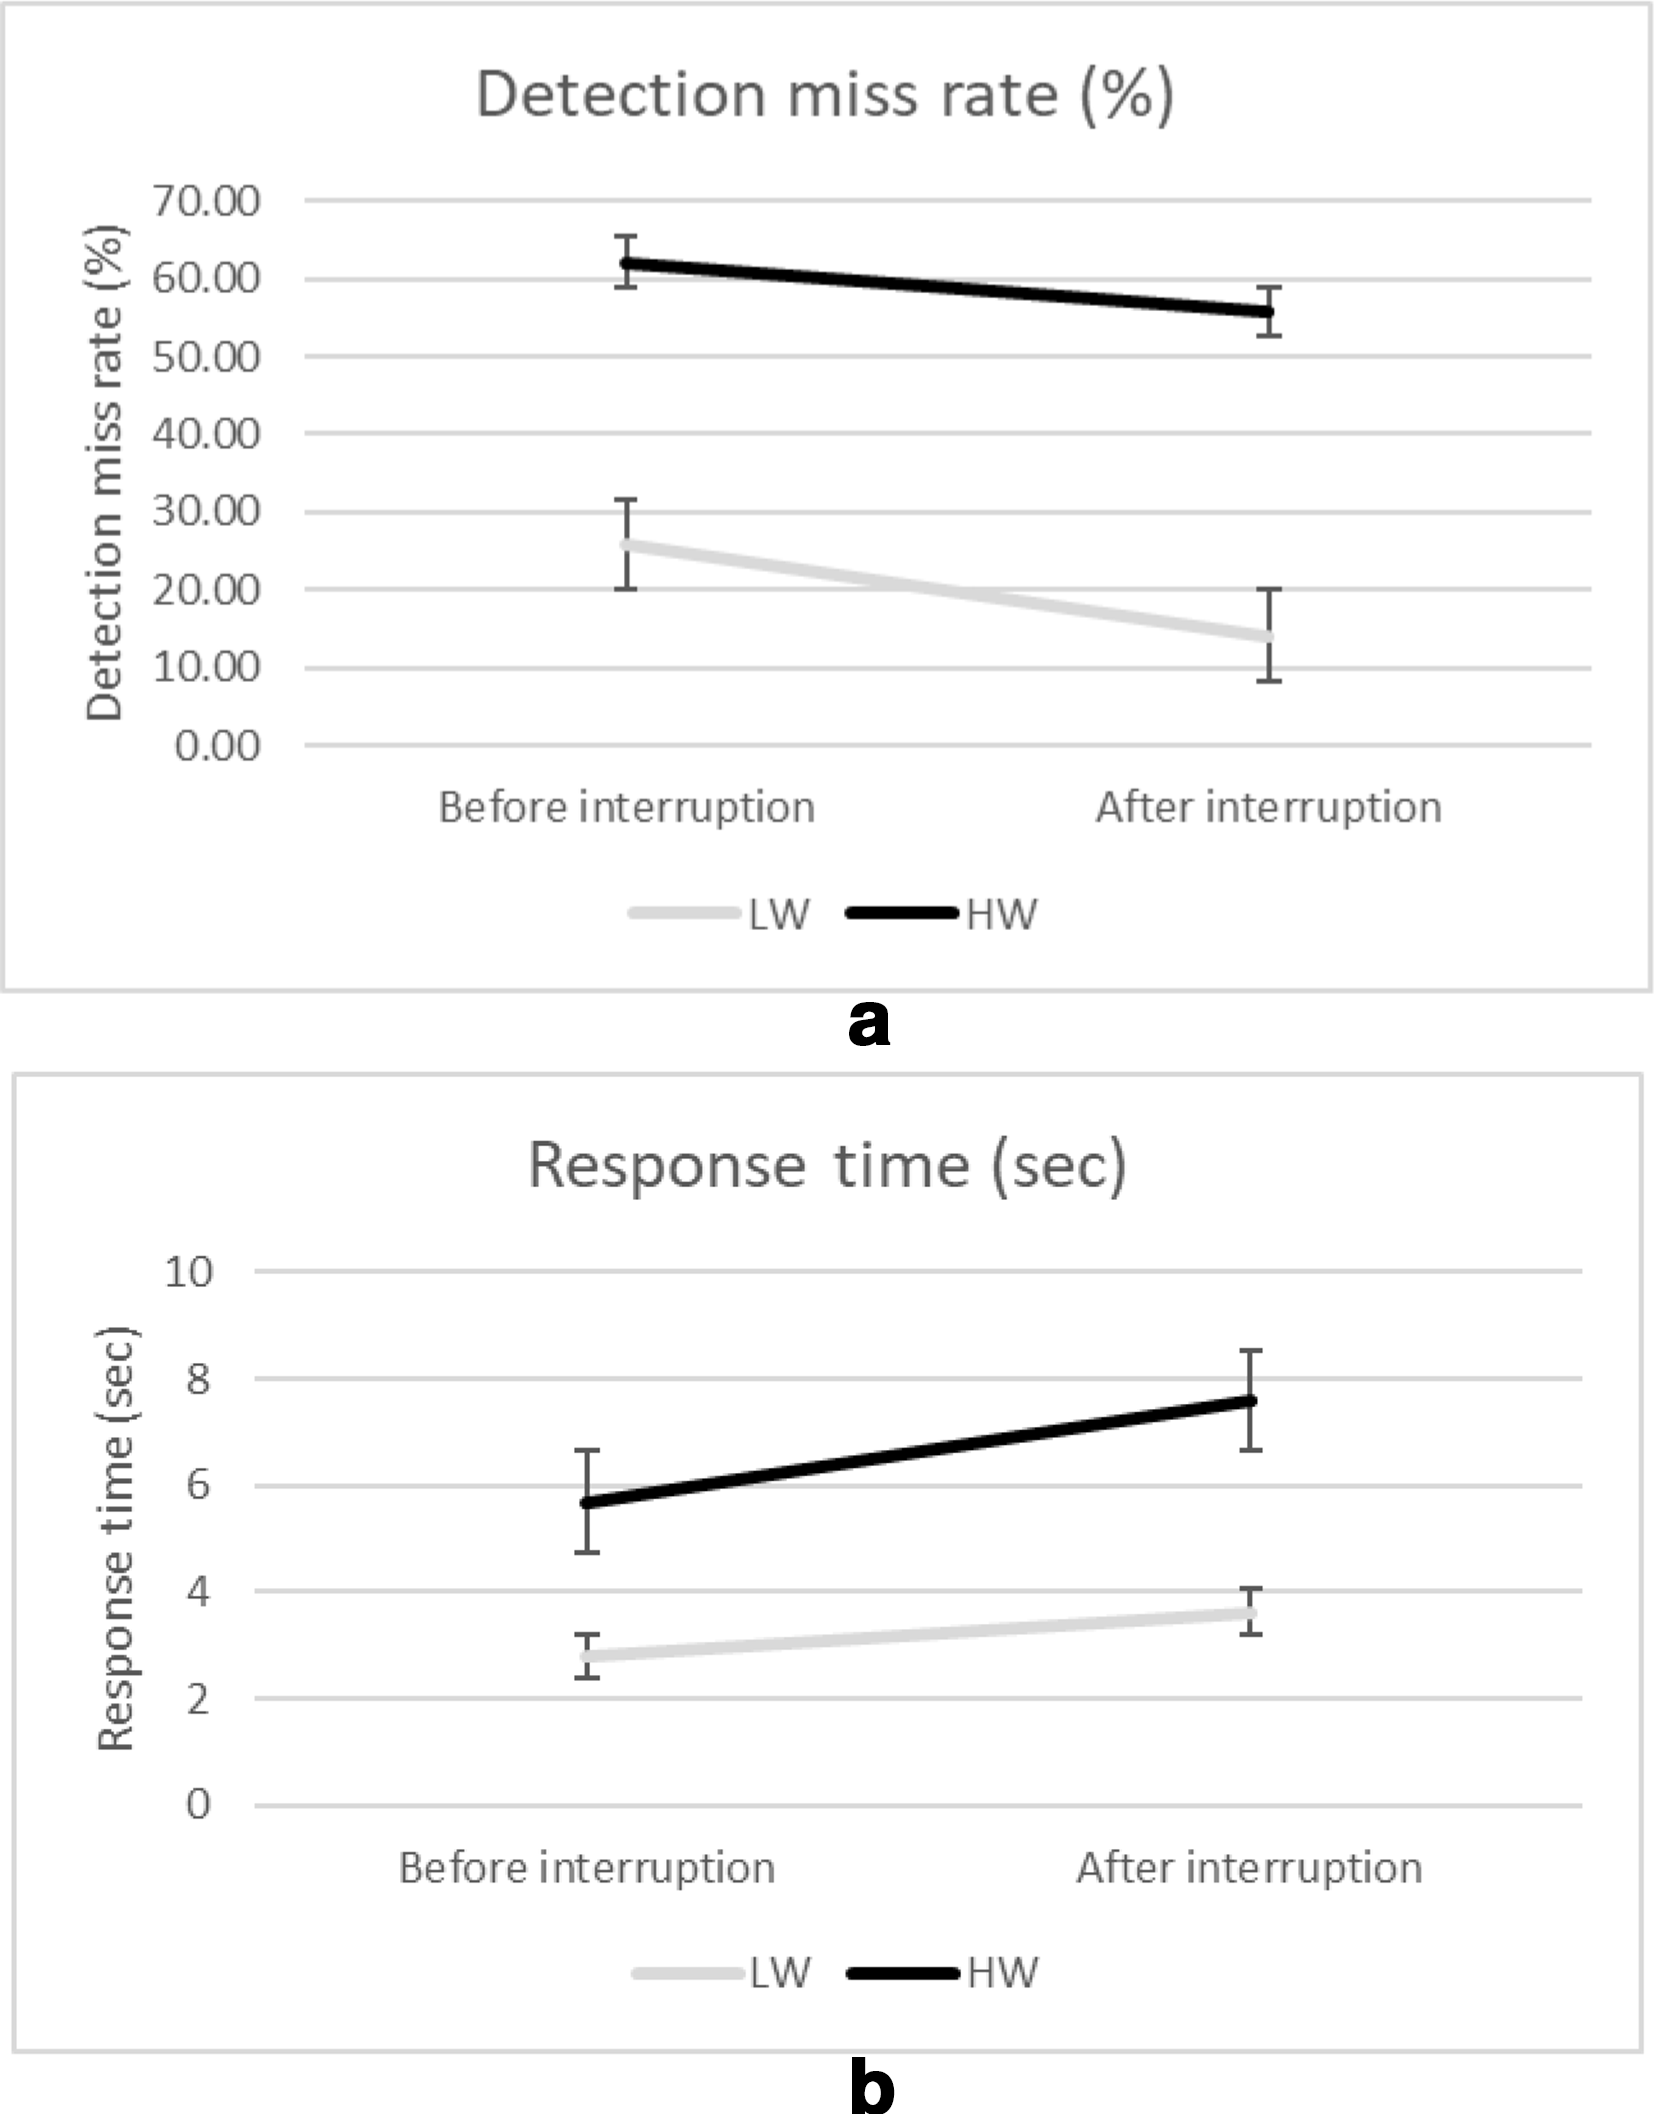
Detection (a) miss rate and (b) response time.
For the response time, the values before the interruption were 2.79 (SD = .57) and 5.29 (SD = .59) seconds in the low- and high-workload conditions, respectively, and the values after the interruption were 3.62 (SD = .30) and 7.47 (SD = .15) in the low- and high-workload conditions, respectively (Figure 4b). There was a significant interaction effect between phase and workload (F(1, 40) = 83.32, p < .001,
The results of the interruptive task performance measures were also calculated. The interruption miss rate was 3.41 (SD = 7.52) and 6.09 (SD = 9.40), the interruption arithmetic task error rate was 33.17 (SD = 22.78) and 34.14 (SD = 23.91)%, the interruption dispatch decision error rate was 45.36 (SD = 17.68) and 54.26 (SD = 20.58)%, the interruption decision time-out rate was 6.82 (SD = 16.88) and 4.26 (SD = 9.40) %, and the interruption task response time was 7.76 (SD = 2.30) and 8.51 (SD = 2.57) seconds in the low-and high-workload conditions, respectively. There was a significant difference between conditions for the interruption dispatch decision error rate (z = 3, p = .003).
Eye Tracking Results
Figure 5a, b and c show the results for the eye tracking metrics. For scanpath length per second, the values before the interruption were 527.23 (SD = 281.31) and 414.93 (SD = 154.75) pixels per second in the low- and high-workload conditions, respectively. The values after the interruption were 627.54 (SD = 239.00) and 244.90 (SD = 100.56) pixels per second in the low- and high-workload conditions, respectively. There was a significant interaction effect between phase and workload (F(1, 40) = 21.15, p < .001,
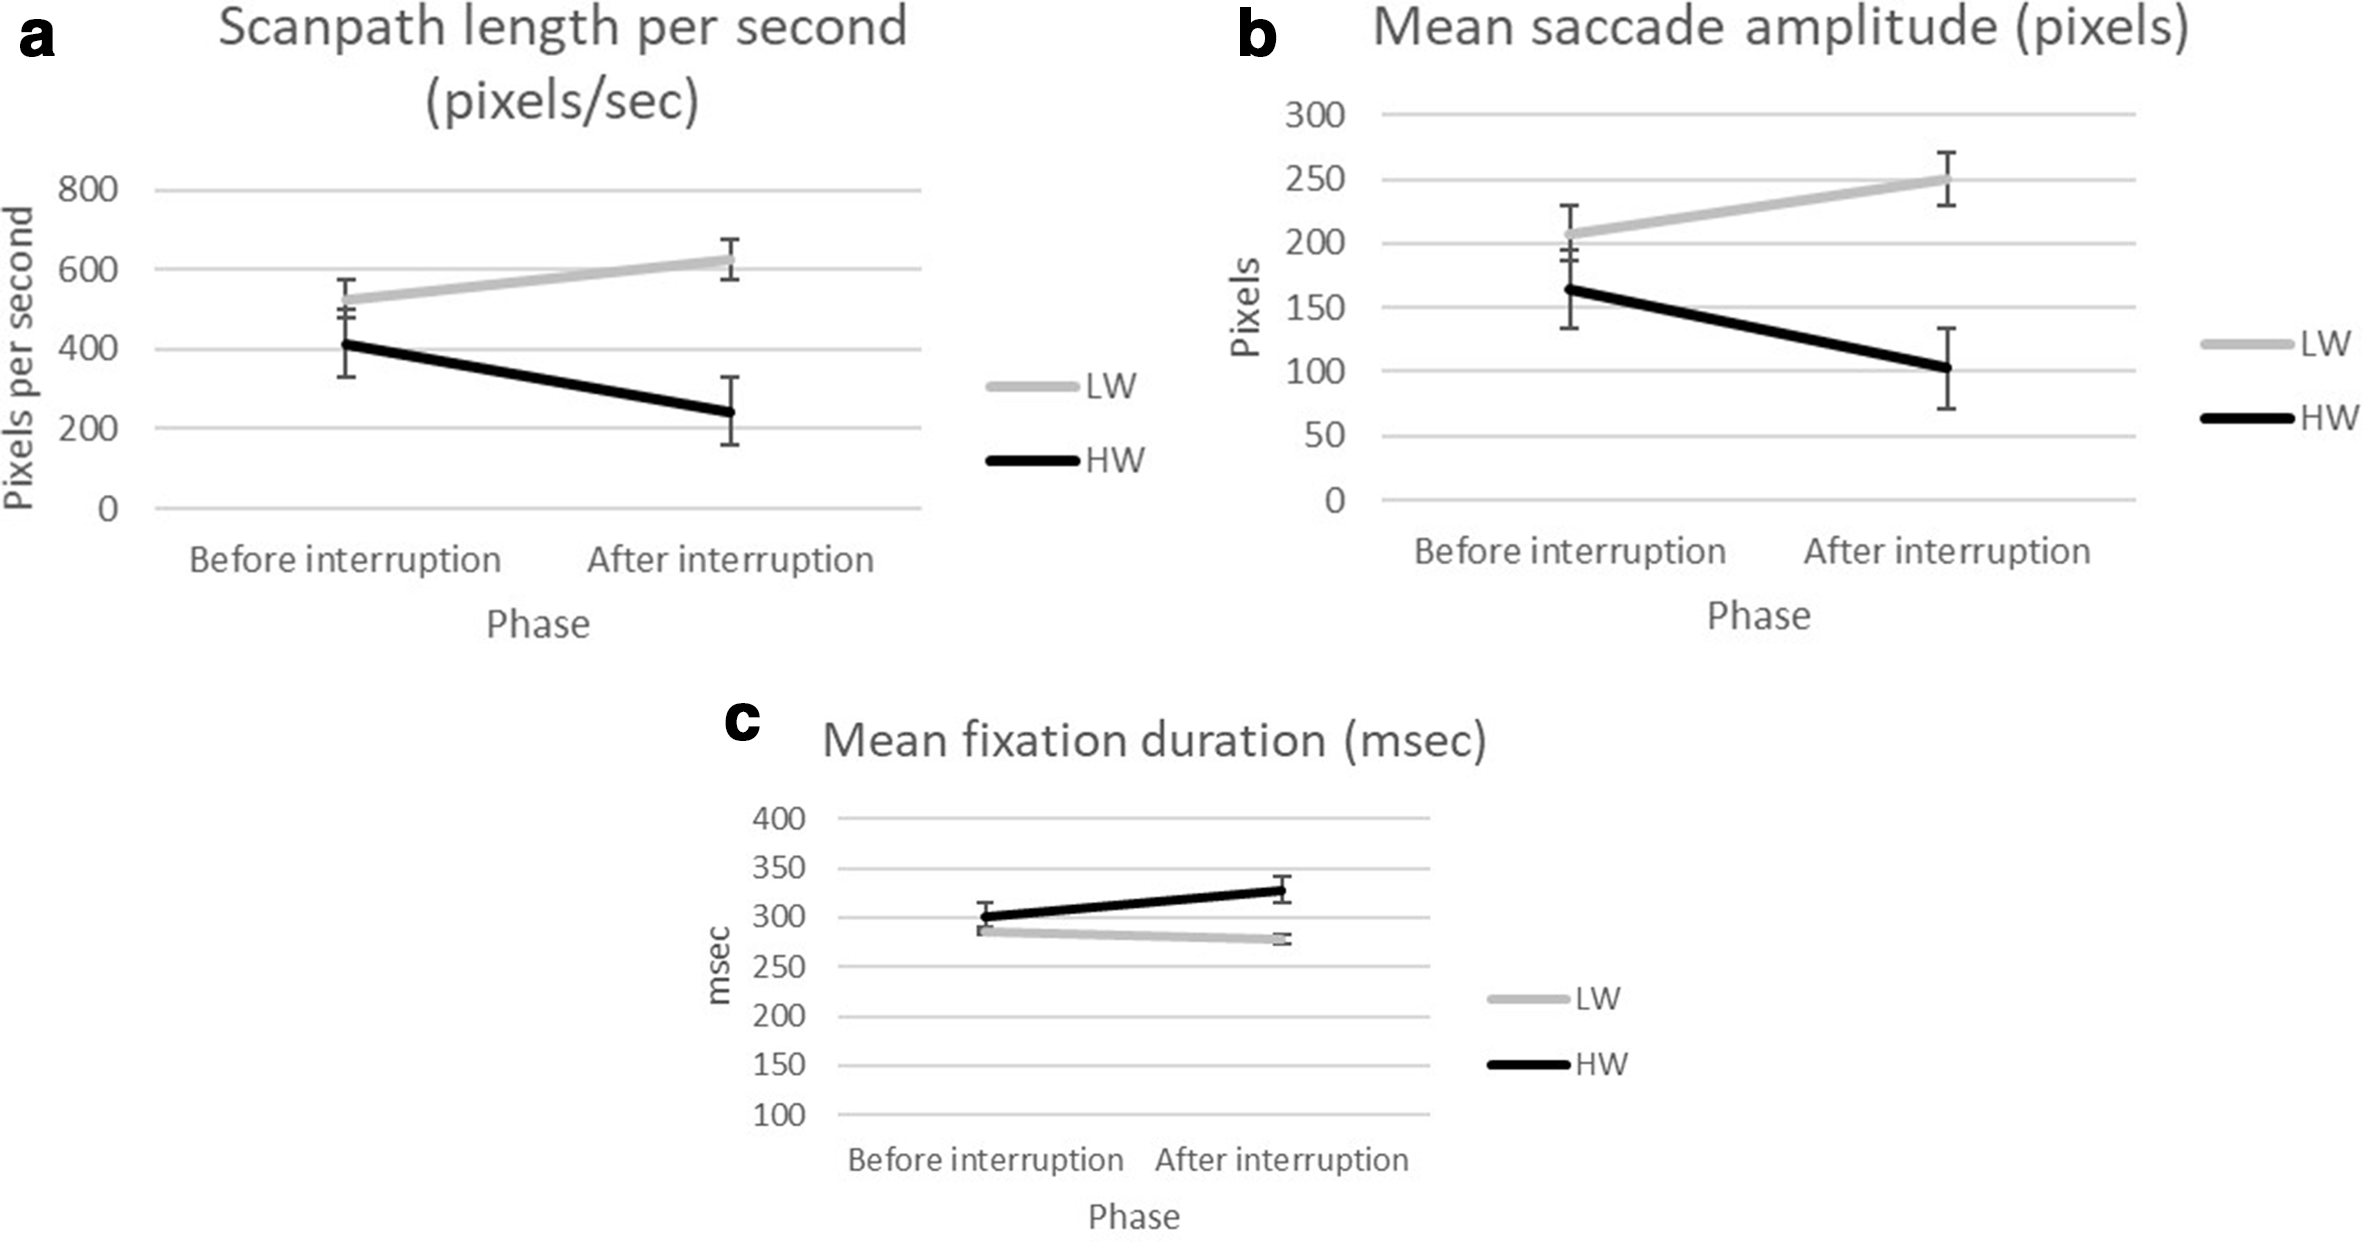
(a) scanpath length per second, (b) mean saccade amplitude, and (c) mean fixation duration.
For mean saccade amplitude, the values before the interruption were 207.65 (SD = 85.80) and 164.02 (SD = 50.03) pixels in the low- and high-workload conditions, respectively. The values after the interruption were 249.96 (SD = 78.30) and 102.51 (SD = 35.50) pixels in the low- and high-workload conditions, respectively. There was a significant interaction effect between phase and workload (F(1, 40) = 26.20, p < .001,
Finally, for mean fixation duration, the values before the interruption were 286.295 (SD = 76.56) and 300.79 (SD = 84.89) milliseconds in the low- and high-workload conditions, respectively. The values after the interruption were 277.85 (SD = 78.76) and 327.53 (SD = 112.31) milliseconds in the low- and high-workload conditions, respectively. There was no significant interaction effect between phase and workload (F(1, 40) = 4.06, p = .051,
Finally, we analyzed the Pearson correlations between each of the eye tracking metrics and the performance metrics of detection miss rate and response time. Detection miss rate was not significantly correlated with any eye tracking metrics and there were no significant correlations between any of the eye tracking metrics and response time in the low workload condition. However, there was a significant correlation between response time and mean saccade amplitude in high workload (r = −.563, p < .001), as well as between response time and scanpath length per second (r = −.483, p < .001). Mean fixation duration was not significantly correlated with response time.
Discussion and Conclusion
The overall goal of this study was to better understand how workload modulates the effects of interruptions, both in terms of performance, and, more importantly, attention allocation immediately after the interruption. To that end, we wanted to determine (1) how different workload levels affect interruption recovery performance as part of a complex task, and (2) how workload interacts with interruptions to affect attention allocation immediately after an interruption, as compared to before.
With regards to the first objective, we expected that workload would interact with the presence of interruptions to lead to worse performance after an interruption in the case of high workload. We expected that this would be evidenced through longer response time and higher error rate. Contrary to our expectations, this effect was only observed for response time, whereas error rate only showed a main effect of phase and workload. The response time decrements are consistent with prior research on interruptions (Trafton & Monk, 2007) and workload (Evans & Fendley, 2017) separately. However, while error rate was indeed higher in high workload in this study, the error rate was lower after the interruption in both low and high workload. This suggests that participants may have been more aroused and alert after the interruption, focusing on detecting the changes in the primary task at all times, but needing more time and effort to do so in high workload. Overall, the results suggest that workload did interact with interruptions to make performance worse, with participants prioritizing accuracy over speed in a speed-accuracy trade-off. In addition, the interruption task results showed that high workload led to a worse interruption dispatch decision error rate for the interruptive task, although this was not our main focus.
Our second and more important aim was to determine how workload interacts with interruptions to affect attention allocation immediately after an interruption as compared to before. We had expected that the eye tracking measures would help explain the performance results and show faster and more far-reaching attention allocation after an interruption as compared to before (similar to Hodgetts et al., 2014) and that this would be worse in high workload. While we did observe an interaction effect (albeit a marginal one in the case of fixation duration), the expected direction of the change in high and low workload was the opposite of what we expected. Instead of high workload leading to faster and more far-reaching scanning, participants became slower, more narrowed, and more deliberate in their search in high workload. On the other hand, participants in the low-workload condition were able to quickly scan many areas of the display immediately after the interruption and re-encode the situation as per the MfG model (Altmann & Trafton, 2002). These results are consistent with—and help explain—the performance results. Namely, the eye tracking results mirror the interaction effect for response time, showing that participants in high workload tended to focus longer on each task and took their time to answer each question correctly. Moreover, these results are further bolstered by the significant correlations found between response time and each of the mean saccade amplitude and scanpath length per second. Even over a period of 3 s, these metrics were able to reflect the overall performance decrements that occurred after an interruption in a high-workload condition. What these results suggest is that participants in the high workload condition did not compensate for the interruption by scanning and monitoring as quickly as possible; instead, it seemed that their narrower and more deliberate search reflected the longer response time and lower error rate that were observed.
The differences between the eye tracking results in this study and previous studies could be explained in two ways. First, it could be that earlier experiments in ostensibly complex environments may not have generated high enough workload (e.g., Hodgetts et al., 2015). However, the second explanation could be that the observed effects are only apparent in the first seconds after the interruption; given more time, such as the 20 s interval adopted by Hodgetts et al. (2015), we might then observe more similar results, as we had expected. The implications for system design are that in the few seconds right after the interruption, operators in high-workload situations could require a different type of support than they would need later on or that they would need in a low-workload situation. If the domain is one that is highly time-sensitive and critical, such as in air traffic control, military environments, or emergency dispatching, providing early support could make a difference to the accuracy of the system. This support could be provided by tracking the metrics proposed here; in particular, scanpath length per second and mean saccade amplitude. For example, if it is detected that participants are moving quickly across the display, as seems to be the case in low workload, placing a notification or summary table in the periphery to help users recover from interruptions might be a good idea. In cases of high workload, if attention is slow and narrowed, an auditory notification might be more appropriate. The critical advantage of such display adjustments would be that users who are not struggling—perhaps more advanced and experienced users—would not be subjected to any possibly distracting adjustments. This idea of adjusting when and if needed is the cornerstone of adaptive displays in general (Feigh et al., 2012; Rouse, 1988), although a lot more research is needed before this can become a reality.
Although we have demonstrated that different contexts may require different types of display adjustments to support interruption recovery, future work should focus on identifying and developing the most appropriate adjustments. Further work could involve the analysis of more eye tracking metrics over even smaller or overlapping windows of time to gain more detailed insights into designing adaptive displays for interruption recovery. Subsequent research could also involve designing and evaluating different types of real-time display adjustments in support of interruption recovery in emergency dispatching and other complex domains such as aviation, healthcare, and process monitoring.
Finally, future work could address the main limitation of this study—that it was limited to visual search and monitoring tasks together with auditory interruptions, with the cognitive processing involved stemming from arithmetic tasks. Even though the performance and eye tracking measures during the interruption were ignored, investigating other types of tasks would improve the external validity of the study and help more firmly establish whether the patterns observed immediately after the interruption generalize across conditions.
Key Points
High workload exacerbates the effects of interruptions on performance by making response time slower in a complex monitoring and change detection context.
Workload interacts with interruptions to lead to slower and more narrowed search immediately after an interruption in high workload as compared to low workload, as reflected through scanpath length per second and mean saccade amplitude in particular.
The fact that these metrics showed significant differences within only 3 s supports the idea that they can be used as the basis for an adaptive display.
Footnotes
Acknowledgments
This study was supported by a grant from the American University of Beirut (AUB) University Research Board (URB). The authors would like to thank Philippe Saade for developing the simulator for this study, Hussein Jundi for his assistance in the data collection and metrics calculations, and Tracy Haoui and Dina Khoury for their help in running experiments.

Author Biographies
Dina Kanaan is a PhD candidate at the University of Toronto. She obtained her M.E. in Engineering Management from the American University of Beirut in 2018.
Nadine Marie Moacdieh is an Assistant Professor at the American University of Beirut in Beirut, Lebanon. She obtained her PhD in Industrial and Operations Engineering from the University of Michigan, Ann Arbor in 2015.