
Abstract
Teamwork and collaboration form the cornerstones of organizational performance and success. It is important to understand how the attention allocation of team members is linked to performance. One approach to studying attention allocation in a team context is to compare the scanpath similarity of two people working in teams and to explore the link between scanpath similarity and team performance. In this study, participants were recruited to work in pairs on an unmanned aerial vehicle (UAV) task that included low and high workload conditions. An eye tracker was used to collect the eye movements of both participants in each team. The scanpaths of two teammates were compared in low and high workload conditions using MultiMatch, an established scanpath comparison algorithm. The obtained scanpath similarity values were correlated with performance measures of response time and accuracy. Several MultiMatch measures showed significant strong correlations across multiple dimensions, providing insight into team behavior and attention allocation. The results suggested that the more similar each team member’s scanpath is, the better their performance. Additional research and consideration of experimental variables will be necessary to further understand how best to use MultiMatch for scanpath similarity assessment in complex domains.
Introduction
Teams are the foundation of many organizations and corporations, where a team is formally defined as two or more people who have precise roles and rely on one another to accomplish a common objective (Salas et al., 1992). From the ancient Greeks’ army formations (Goldsworthy, 1997) to flight crews coordinating a 9,537-mile flight for nearly 19 hours (Pallini, 2020), teamwork and collaboration are at the core of various work environments. Researchers have studied team performance in different setups, including aviation (McNeese et al., 2018), military operations (Gorman et al., 2020; Meslec et al., 2020), and healthcare (Gorman et al., 2020).
A properly trained team can often achieve better results than one person alone and lead to a safer and more efficient system (Salas et al., 2008). However, working in teams in data-rich domains can also amplify the already-present complexity of operations, especially where human-machine interaction is involved (McNeese et al., 2018). In one instance, an unmanned aerial vehicle (UAV) crashed into the ground, with the accident later attributed to a lack of coordination between the operators handling the UAV (Williams, 2006).
Therefore, understanding what factors affect teamwork, and how this can be supported through display design, is an important human factors topic. This is especially important in complex, data-rich, and data-driven domains, where high mental workload can degrade team performance (Funke et al., 2012; Urban et al., 1995). Cognitive workload is defined as the gap between one’s attentional resources and the cognitive demands placed on users (Wickens, 1992). Cognitive demands are typically varied by manipulating the user’s task load (Hancock et al., 1995) that is defined as the number of items that one has to attend to in order to successfully complete a task (Veltman & Gaillard, 1996).
However, it is still not clear how best to analyze the attention allocation of people working in teams (Atweh et al., 2022). There is a need for quantitative measures that can be used in real time and at a fine-grained level of analysis. This would allow for a better understanding of how people collaborate, which would, in turn, lead to better design principles for collaborative interfaces. Eye tracking is one approach that can be used in this regard, given that it can provide a trace of where a person is looking—the person’s scanpath—which, in turn, can help shed further light on team performance (Devlin et al., 2020; Faulhaber & Friedrich, 2019). Scanpath analysis has been used in the past to assess mental workload (Maggi et al., 2019), cognitive capacity (Hayes & Henderson, 2017), task demand (Boot et al., 2009), and breast screening reading strategies (Chen et al., 2018), but these methods have not been implemented to assess team performance.
Thus, the overall goal of this study is to explore whether and to what extent the scanpath similarity of two people working together on a task is linked to their performance in a complex, multitasking, environment across different workloads. Scanpath similarity was assessed using the well-known scanpath comparison algorithm, MultiMatch (Dewhurst et al., 2012). We hypothesized that (1) pairs with more similar scanpaths would also have better performance (e.g., Maurer et al., 2018; Siirtola et al., 2019) and (2) the aforementioned relation would be accentuated during high workload periods. Understanding the link between scanpath similarity and performance can inform display design solutions and training instructions that ensure that teammates are effectively directing their attention as a function of workload. To this end, a simulator study in the context of UAV operations was conducted in which participants collaborated, working in pairs to complete multiple tasks that are akin to multi-UAV operations.
Background
Team Performance and Attention Allocation
Given the importance of good teamwork, several types of measures have been used to analyze the performance, perceived workload, and/or awareness of team members. Subjective questionnaires are one popular approach to gain insight on how operators thought they performed. One example of well-known questionnaires that have been used is the NASA Task Load Index (NASA-TLX; Hart & Staveland, 1988) that calculates workload scores based on several scales, such as mental demand, physical demand, temporal demand, performance, effort, and frustration. Another commonly used questionnaire is the Distributed Assessment of Team Mutual Awareness (DATMA), which measures mental workload and teamwork awareness (Berggren et al., 2011). Berggren et al. (2011) used both NASA-TLX and DATMA in their study to compare individual and team workload measures. Different types of performance measures have also been used for assessment, namely the response time to complete a task and the accuracy of the task performance. For instance, Jobidon et al. (2006) used the mean response time to detect a fire as a measure of team performance. Villamor and Rodrigo (2018), on the other hand, calculated a debugging score to assess teamwork among programmers. However, none of these measures provide insight into the attention allocation strategies of each team member, which can play an important role in understanding overall team performance as visual attention allocation is considered a multi-component cognitive resource that determines one’s ability to focus and process information (Archibald et al., 2015).
One way to gain insight into attention allocation is by using eye tracking, an infrared-based technology that provides a trace of people’s eye movements (Hess et al., 1998; Lin et al., 2004). Specifically, eye tracking provides output in terms of fixations and saccades. Fixations are spatially stable gaze points during which time visual processing takes place (Findlay, 2004). Saccades are the rapid eye movements in between fixations during which no visual processing occurs (Yarbus, 1967). The sequence of fixations and saccades form the scanpath of each user and the areas that users look at on the screen are defined as areas of interest (AOIs). In recent years, eye tracking has been gaining interest as a means to assess and improve team performance (e.g., Daggett et al., 2017; D’Angelo & Begel, 2017; Devlin et al., 2020). Eye tracking provides a detailed, objective window into visual attention allocation and can also be used in real time (Lin et al., 2004). Understanding what teammates are looking at and when can provide new, previously unknown insight into their collective performance, as surveys, questionnaires, or debriefing strategies cannot precisely measure scanpath trends and their similarity.
Several eye tracking metrics have been used in the context of team performance. For example, pupillometry metrics have been applied to assess cognitive workload of people working in teams (e.g., Daggett et al., 2017). Other metrics that have been utilized include gaze overlap, which measures the times that several users are viewing the same area simultaneously (Pietinen et al., 2010). This was used by Devlin et al. (2020) to study the link between visual attention and pair performance during changes in workload. The phi coefficient (Φ; Bakeman & Gottman, 1997), which quantifies the lag between two time series, was also utilized by Devlin et al. (2020) as a measure of the coordination between scanpaths. In addition, cross recurrence (or gaze coupling or overlap) analysis has been used to measure how closely matched teammates’ attention is, where cross recurrence occurs in general when two fixations from different people’s scanpaths are within a certain radius of each other (Cherubini et al., 2010; Devlin et al., 2020; Jermann et al., 2010; Villamor & Rodrigo, 2018). Another notable approach is analyzing eye movement transitions using entropy-based statistical analysis (Krejtz et al., 2014), which can be applied to detect individual differences in eye movement transitions between AOI (Alemdag & Cagiltay, 2018).
The proposed theoretical underpinning for why shared cognition can improve performance is that it improves coordination and collaboration, which allows for more resources to be assigned to the task being performed (Langan-Fox et al., 2004). We thus centered our first hypothesis to reflect the notion that shared gaze will lead to better performance. For example, Brennan et al. (2008) found that team members whose gaze locations were very similar were twice as efficient in their searching tasks as solitary members. They were even more efficient than members who were able to talk together, a finding consistent with Neider et al.’s study (2010). D’Angelo and Begel (2017) developed a system where programmers were shown what the other was looking at while they worked, and they found providing this shared gaze information aids in coordination and effective communication. GazeTorch, a shared gaze interface developed by Akkil et al. (2016), was also found to make collaboration more effortless. Several other studies found that shared gaze improved performance and remote collaboration in teleconferencing (Gupta et al., 2016), video conferencing systems (Lee et al., 2017), problem solving (Schneider & Pea, 2013), collaborative visual search (Siirtola et al., 2019), and competitive and cooperative online gaming (Maurer et al., 2018).
On the other hand, Villamor and Rodrigo (2018) concluded that gaze recurrence alone was not a good predictor of pair success. For example, Müller et al. (2013) found that shared gaze in a puzzle solving task can induce uncertainty and delay. Another study by Zhang et al. (2017) concluded that shared gaze can potentially boost collaboration but can be impeded by factors such as trust and privacy. This uncertainty suggests that it is still not clear how shared attention is linked to task performance in teams. There is a need to explore other eye tracking metrics that may be able to better capture shared attention allocation.
Scanpath Comparison
One such measure could be scanpath comparison, which has not been explored to date in the context of teams. Such metrics may be able to provide additional insights regarding the link between the attention allocation of teams and the performance of these teams. There are a number of algorithms that can provide a measure of scanpath similarity. ScanMatch is one notable example (Cristino et al., 2010). It has been used to compare the scanpaths of physics problem solvers (Madsen et al., 2012), discover the preferences of individuals with autism (Król & Król, 2020), and study complex visual search patterns (Frame et al., 2019). This method is based on the Needleman–Wunsch algorithm (Needleman & Wunsch, 1970) that was created to compare biological sequences. The ScanMatch algorithm includes two main steps: (1) creating sequences of letters that denote the sequence of AOIs fixated by the user and (2) calculating similarity scores between these sequences. The similarity score is a value ranging between 0 and 1. The higher the score, the more similar the scanpaths are; in other words, two identical sequences of AOIs would then result in a ScanMatch score of 1. ScanMatch thus provides a single quantitative measure of the similarity of two scanpaths. However, ScanMatch’s dependence on AOIs means that AOI’s size and order can greatly affect the output (Anderson et al., 2015). In addition, condensing scanpath similarity to just one measure does not paint a complete or detailed picture of what is going on; it neither provides insight into the duration of team member’s scanpaths and how they are related nor in what aspects the scanpaths are similar. This illustrates the need for a multi-dimensional measure.
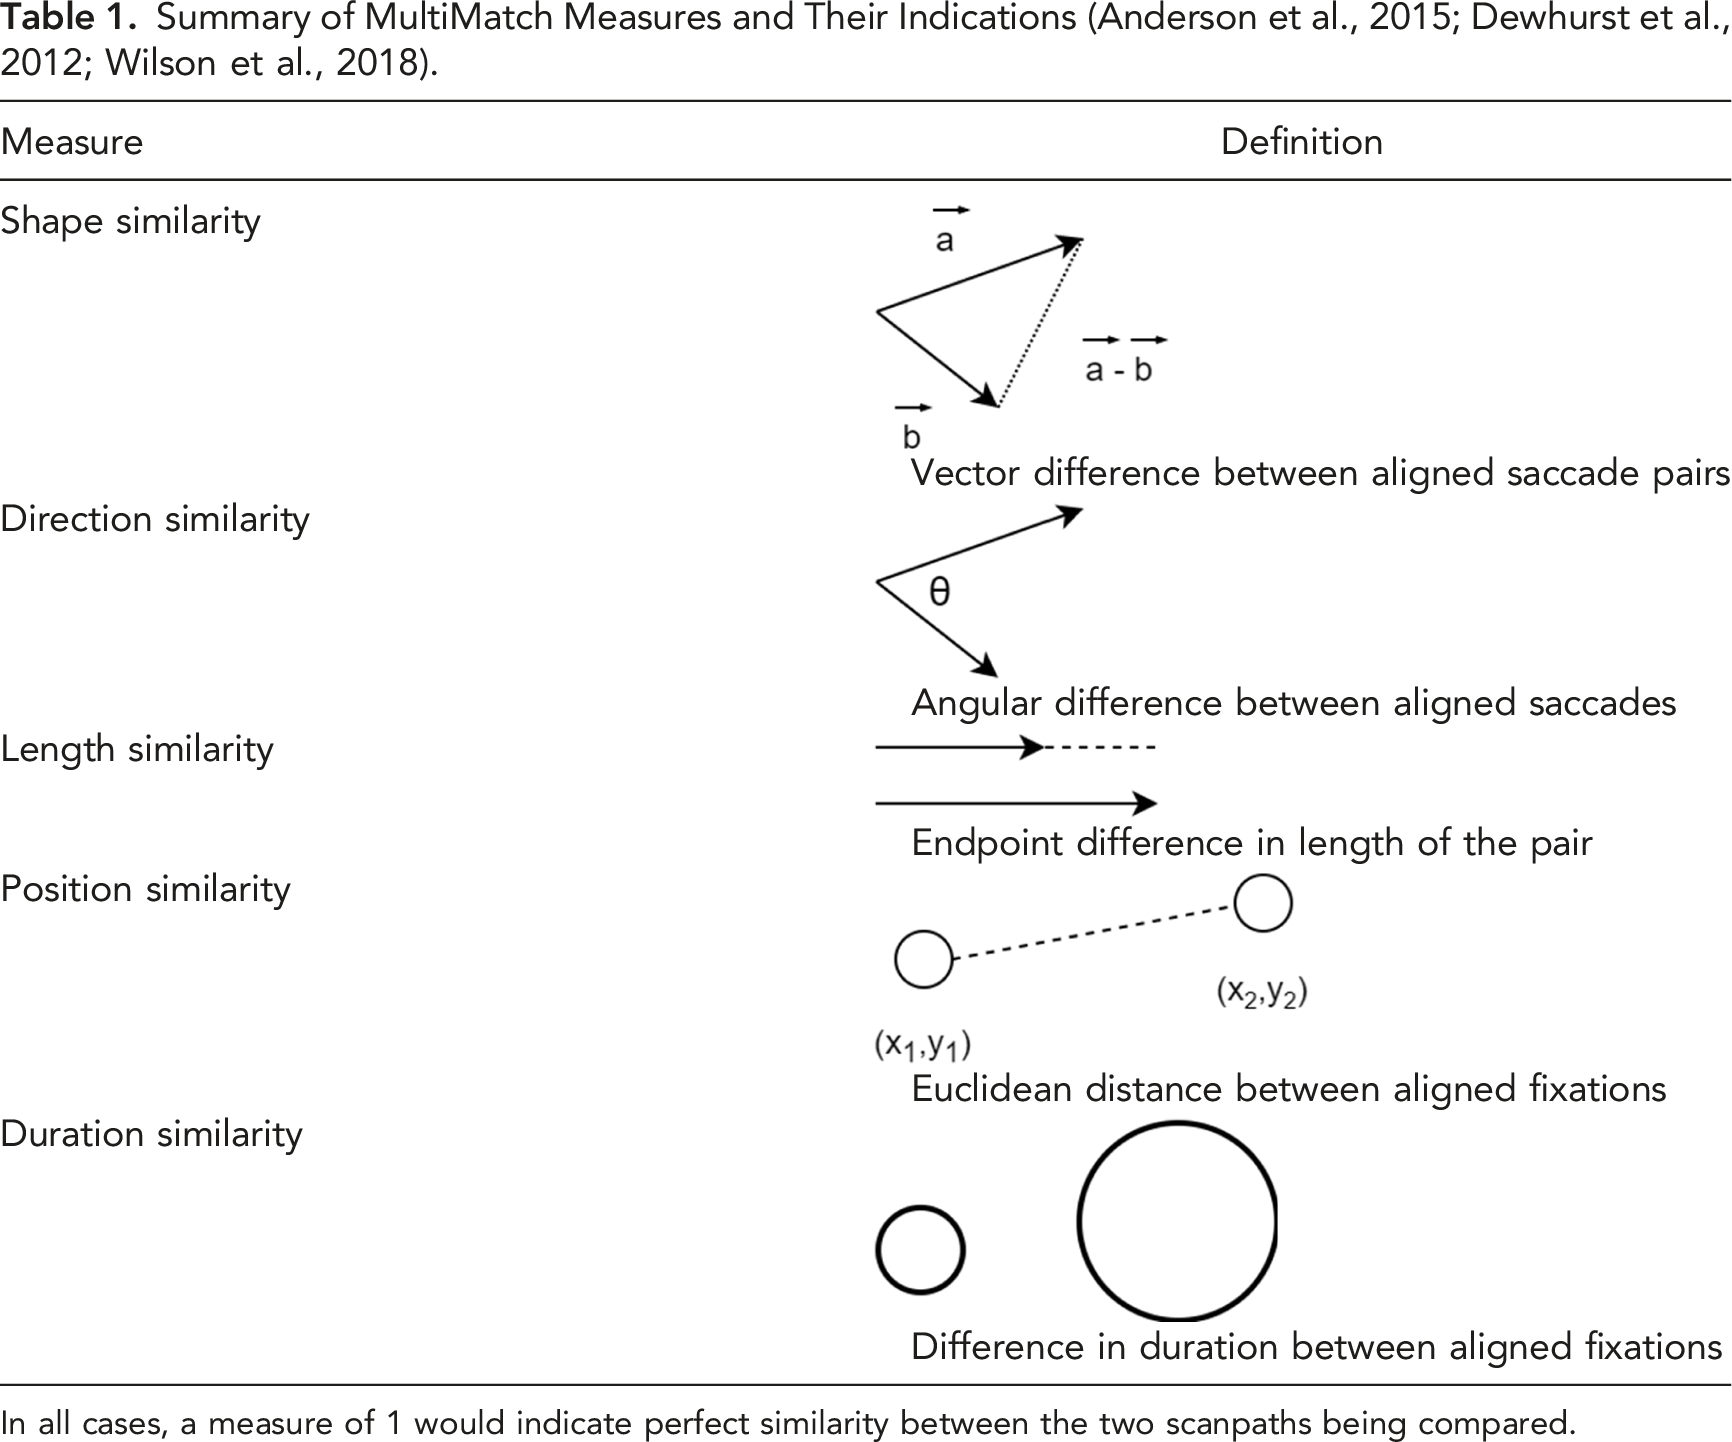
MultiMatch is one such scanpath comparison method that attempts to address some of the limitations of ScanMatch. It has been used in the literature in experiments to test memory performance (Foulsham et al., 2012), assess student cognitive processes (Stranc & Muldner, 2020), and study weather forecasters’ decision-making processes (Wilson et al., 2018). MultiMatch is also notable for its robustness, as it manages spatial noise and perturbed scanpaths well (Dewhurst et al., 2012). In addition, the code for calculating MultiMatch is freely available online (Dewhurst et al., 2012). The MultiMatch algorithm requires a number of steps. First, the scanpath is converted into a series of vectors, each one representing a saccade (Dewhurst et al., 2012). The scanpath undergoes several simplifications (Figure 1). The first simplification consists of combining vectors of similar directions into one. Another simplification is amplitude based, in which consecutive saccades that have amplitudes less than a preset threshold are clustered into a single vector. Next, the scanpaths are temporally aligned (Dewhurst et al., 2012). Next, the corresponding vectors are compared (Foulsham et al., 2012). Five separate comparisons are performed, resulting in five measures (shape, length, direction, position, and duration). The results are averaged across the number of vectors and normalized to yield a value ranging between 0 and 1, where 1 represents perfect similarity. Each measure has its own significance and represents a certain spatial or temporal aspect of similarity as seen in Table 1 (Anderson et al., 2015). MultiMatch’s different measures allow for assessing scanpath similarity at a more fine-grained level than ScanMatch, and it also allows for the comparison of scanpaths that have different lengths (Dewhurst et al., 2012). It is important to note that absolute scores of each MultiMatch measure cannot be compared against each other as each measure is calculated and normalized differently (Dewhurst et al., 2012; Wilson et al., 2018). Even though one downside of MultiMatch is that the threshold needs to be carefully selected, its present advantages were the reason it was selected for this study. Illustration of the simplification steps. Summary of MultiMatch Measures and Their Indications (Anderson et al., 2015; Dewhurst et al., 2012; Wilson et al., 2018). In all cases, a measure of 1 would indicate perfect similarity between the two scanpaths being compared.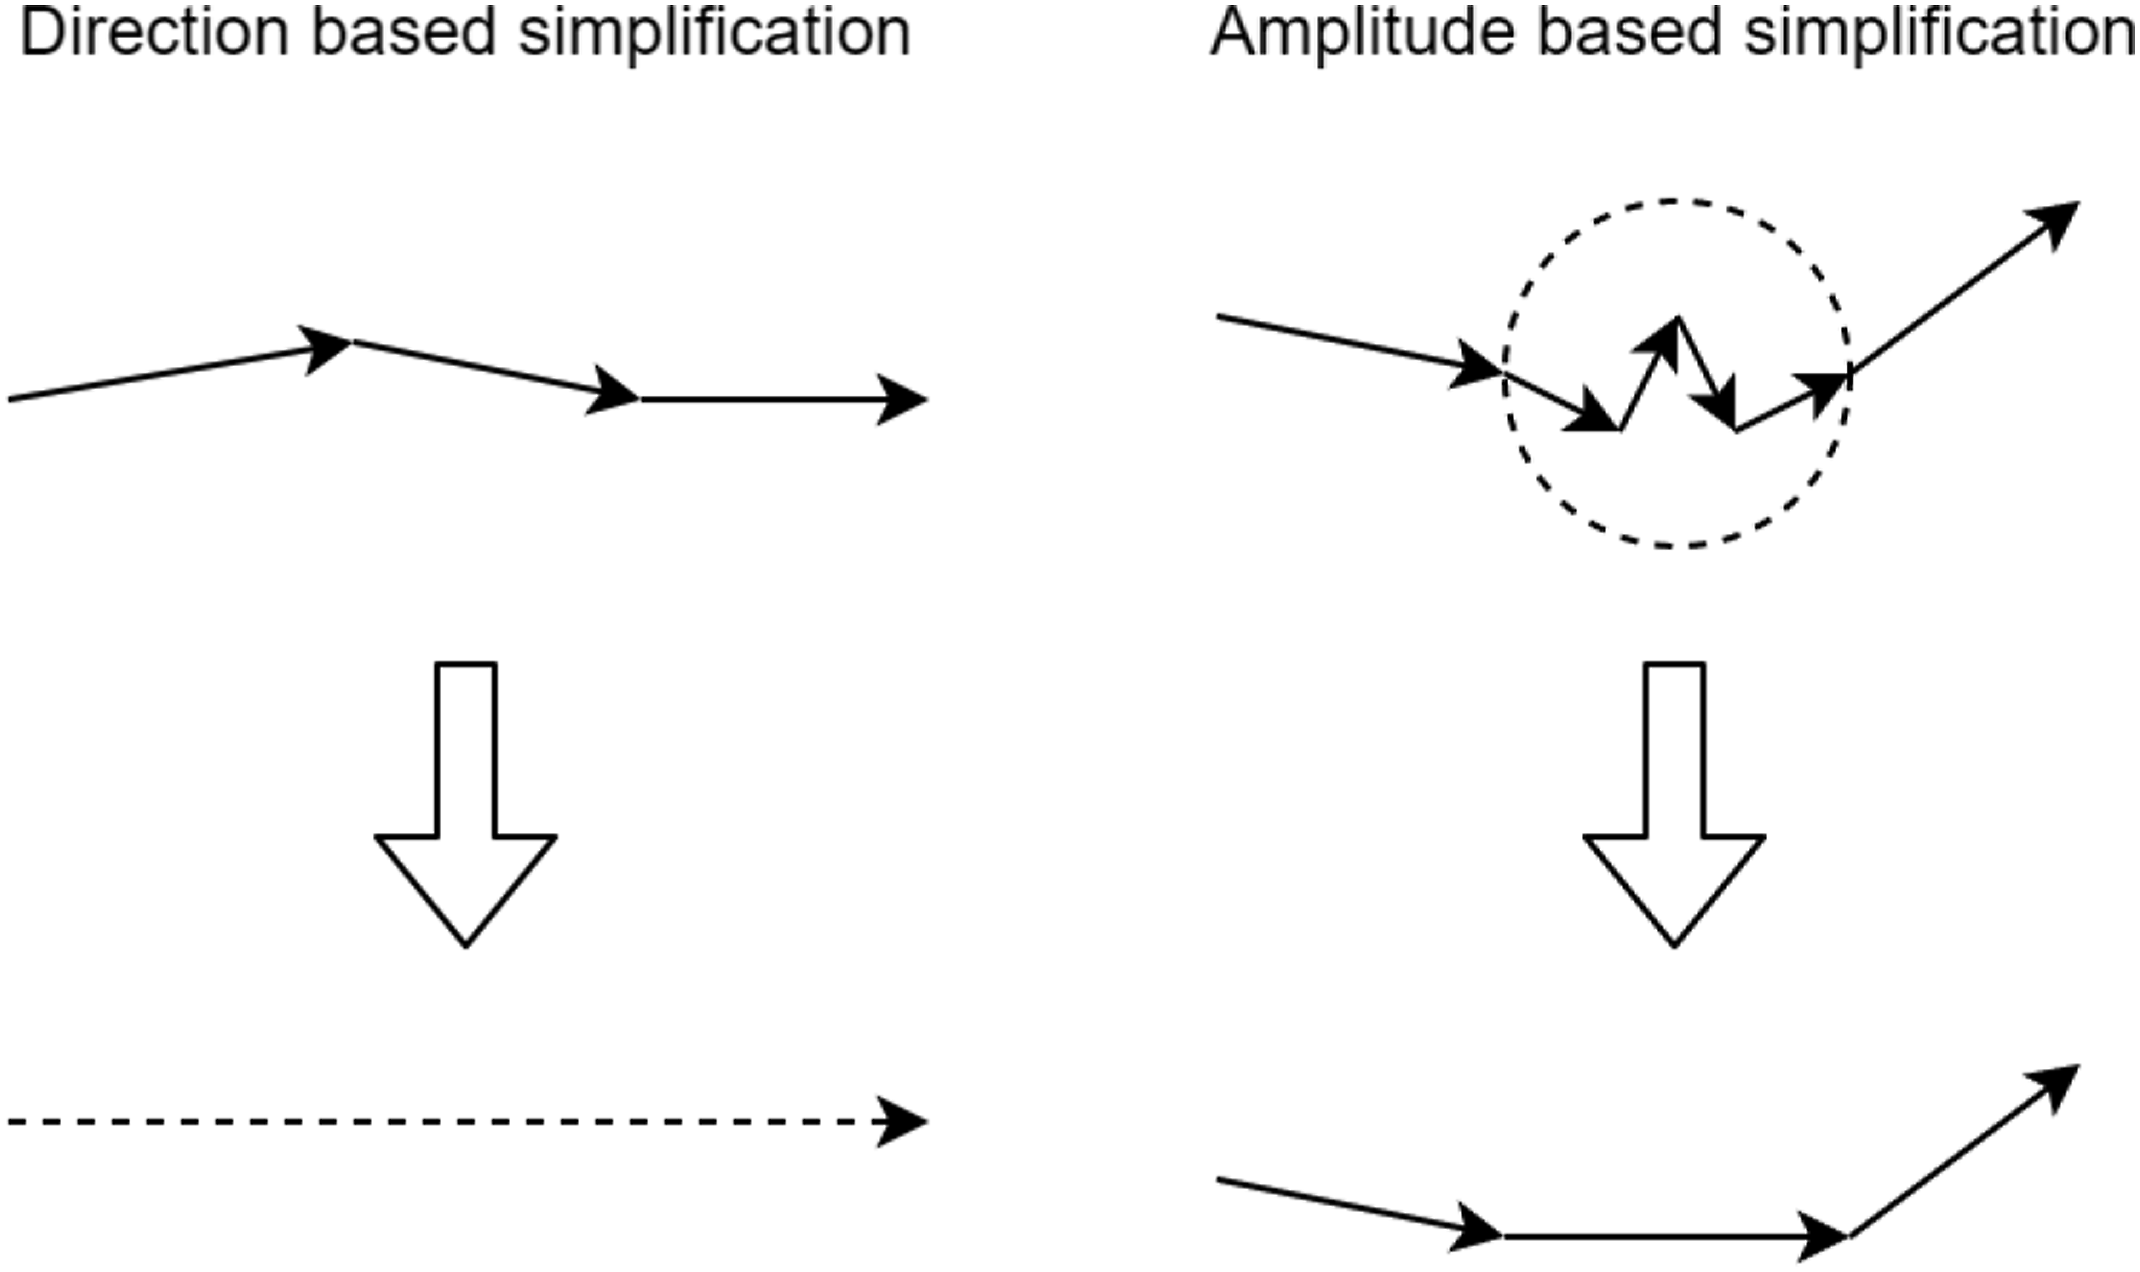
Method
Participants
Ten pairs of undergraduate students at the University of Virginia (20 students total) were recruited for the study (M = 21.3 years, SE = 0.24 years). Each pair consisted of one male and one female who did not previously know each other. The experiment lasted between 75 and 90 minutes and took place in a single session. Participants were compensated $10/hour for their time. This study was approved by the University of Virginia Institutional Review Board (protocol number 3480).
Experimental Design
There were two workload conditions, low and high, that were manipulated by varying the number of active UAVs for the primary (target detection) task. For the low workload condition, 3–5 UAVs were active at all times, while 13–16 UAVs were active at all times for the high workload condition. These numbers were validated using NASA-TLX and performance measurements (see Devlin et al. (2020) for the full details). In each experimental condition, pairs completed two 15-minute trials, one with each of the two workload conditions. Pairs always completed the low workload condition before the high workload condition. The design of the simulation was based on the ‘Vigilant Spirit Control Station’ the Air Force uses to develop interfaces to control multiple UAVs (Feitshans et al., 2008). The simulation was developed using the Unity gaming engine and ran on a desktop computer (28” monitor, 2560 × 1440 screen resolution; Figure 2). Participants sat 26–28 inches from the monitor and used a standard mouse to input responses. Pairs were collocated, but each participant viewed separate monitors and used separate mice to input responses. The simulation was networked so participants could see inputs from their partner in real time (e.g., when Participant 1 responded to a chat message, Participant 2 could see his/her response in real time). Experimental setup with the simulation shown on two networked computers.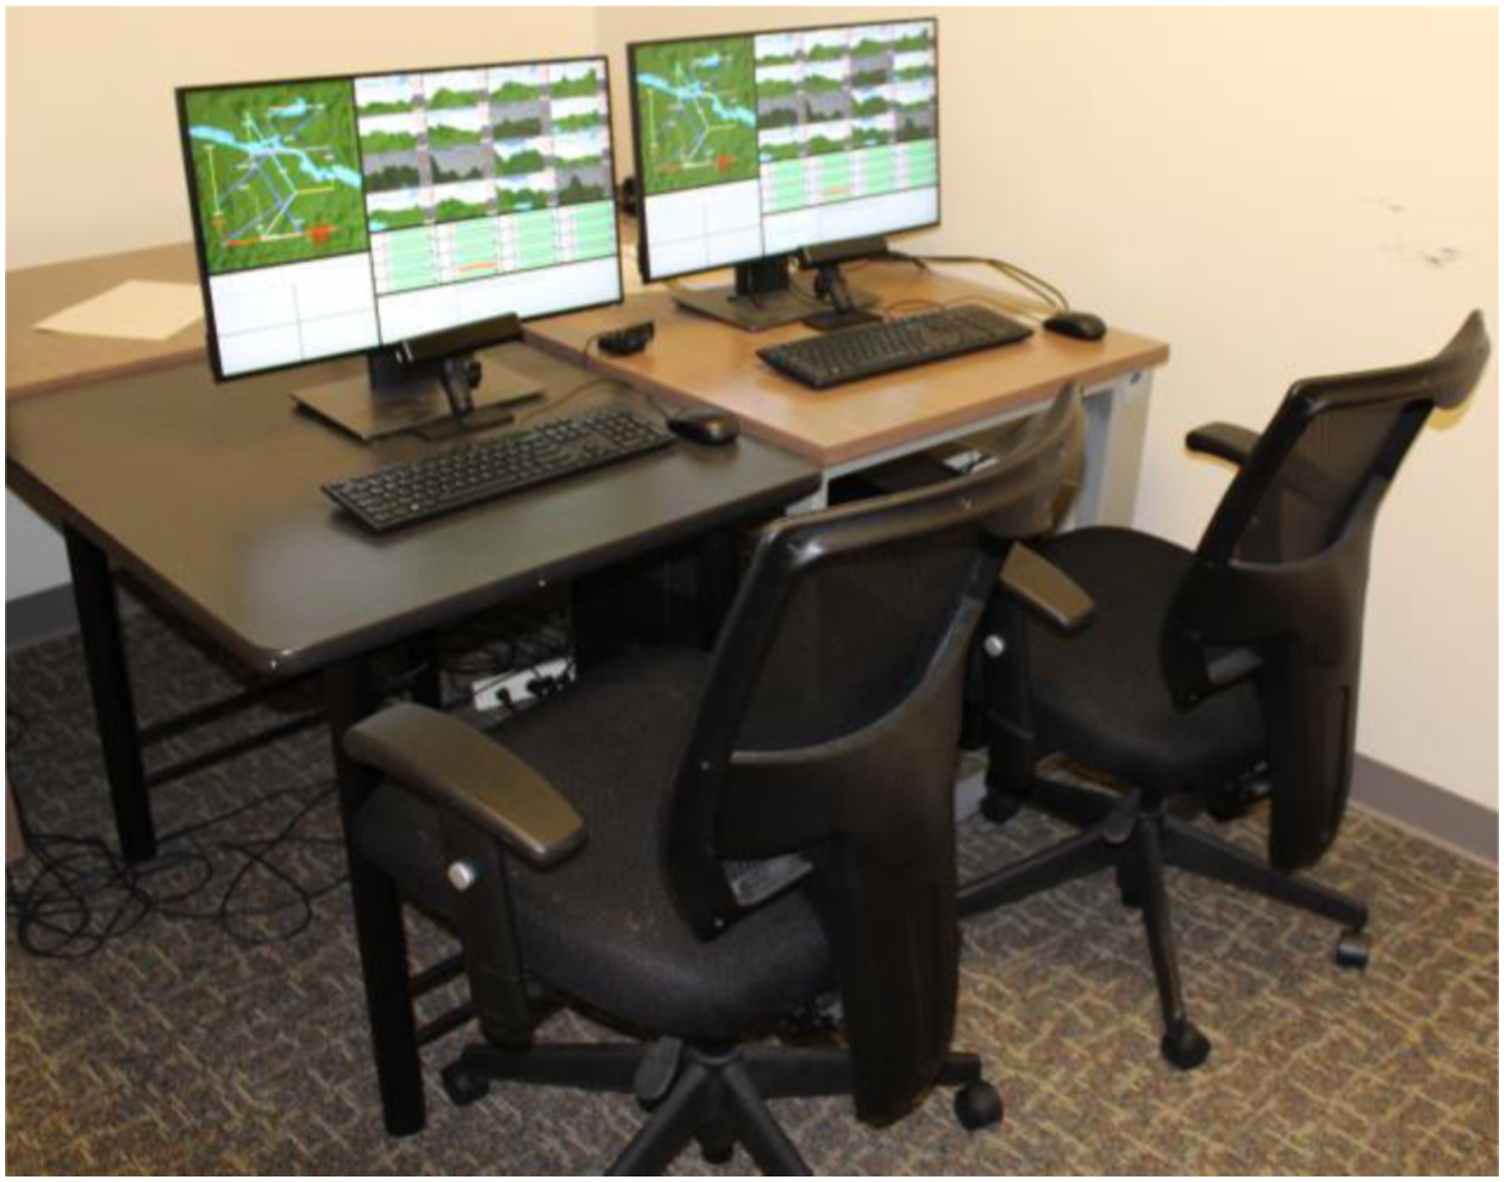
Two desktop-mounted FOVIO eye trackers with a sampling rate of 60 Hz were used to collect point of gaze data. The average degree of error for this eye tracker is 0.78° (SD = 0.59°). An external microphone was also used to record all verbal communication.
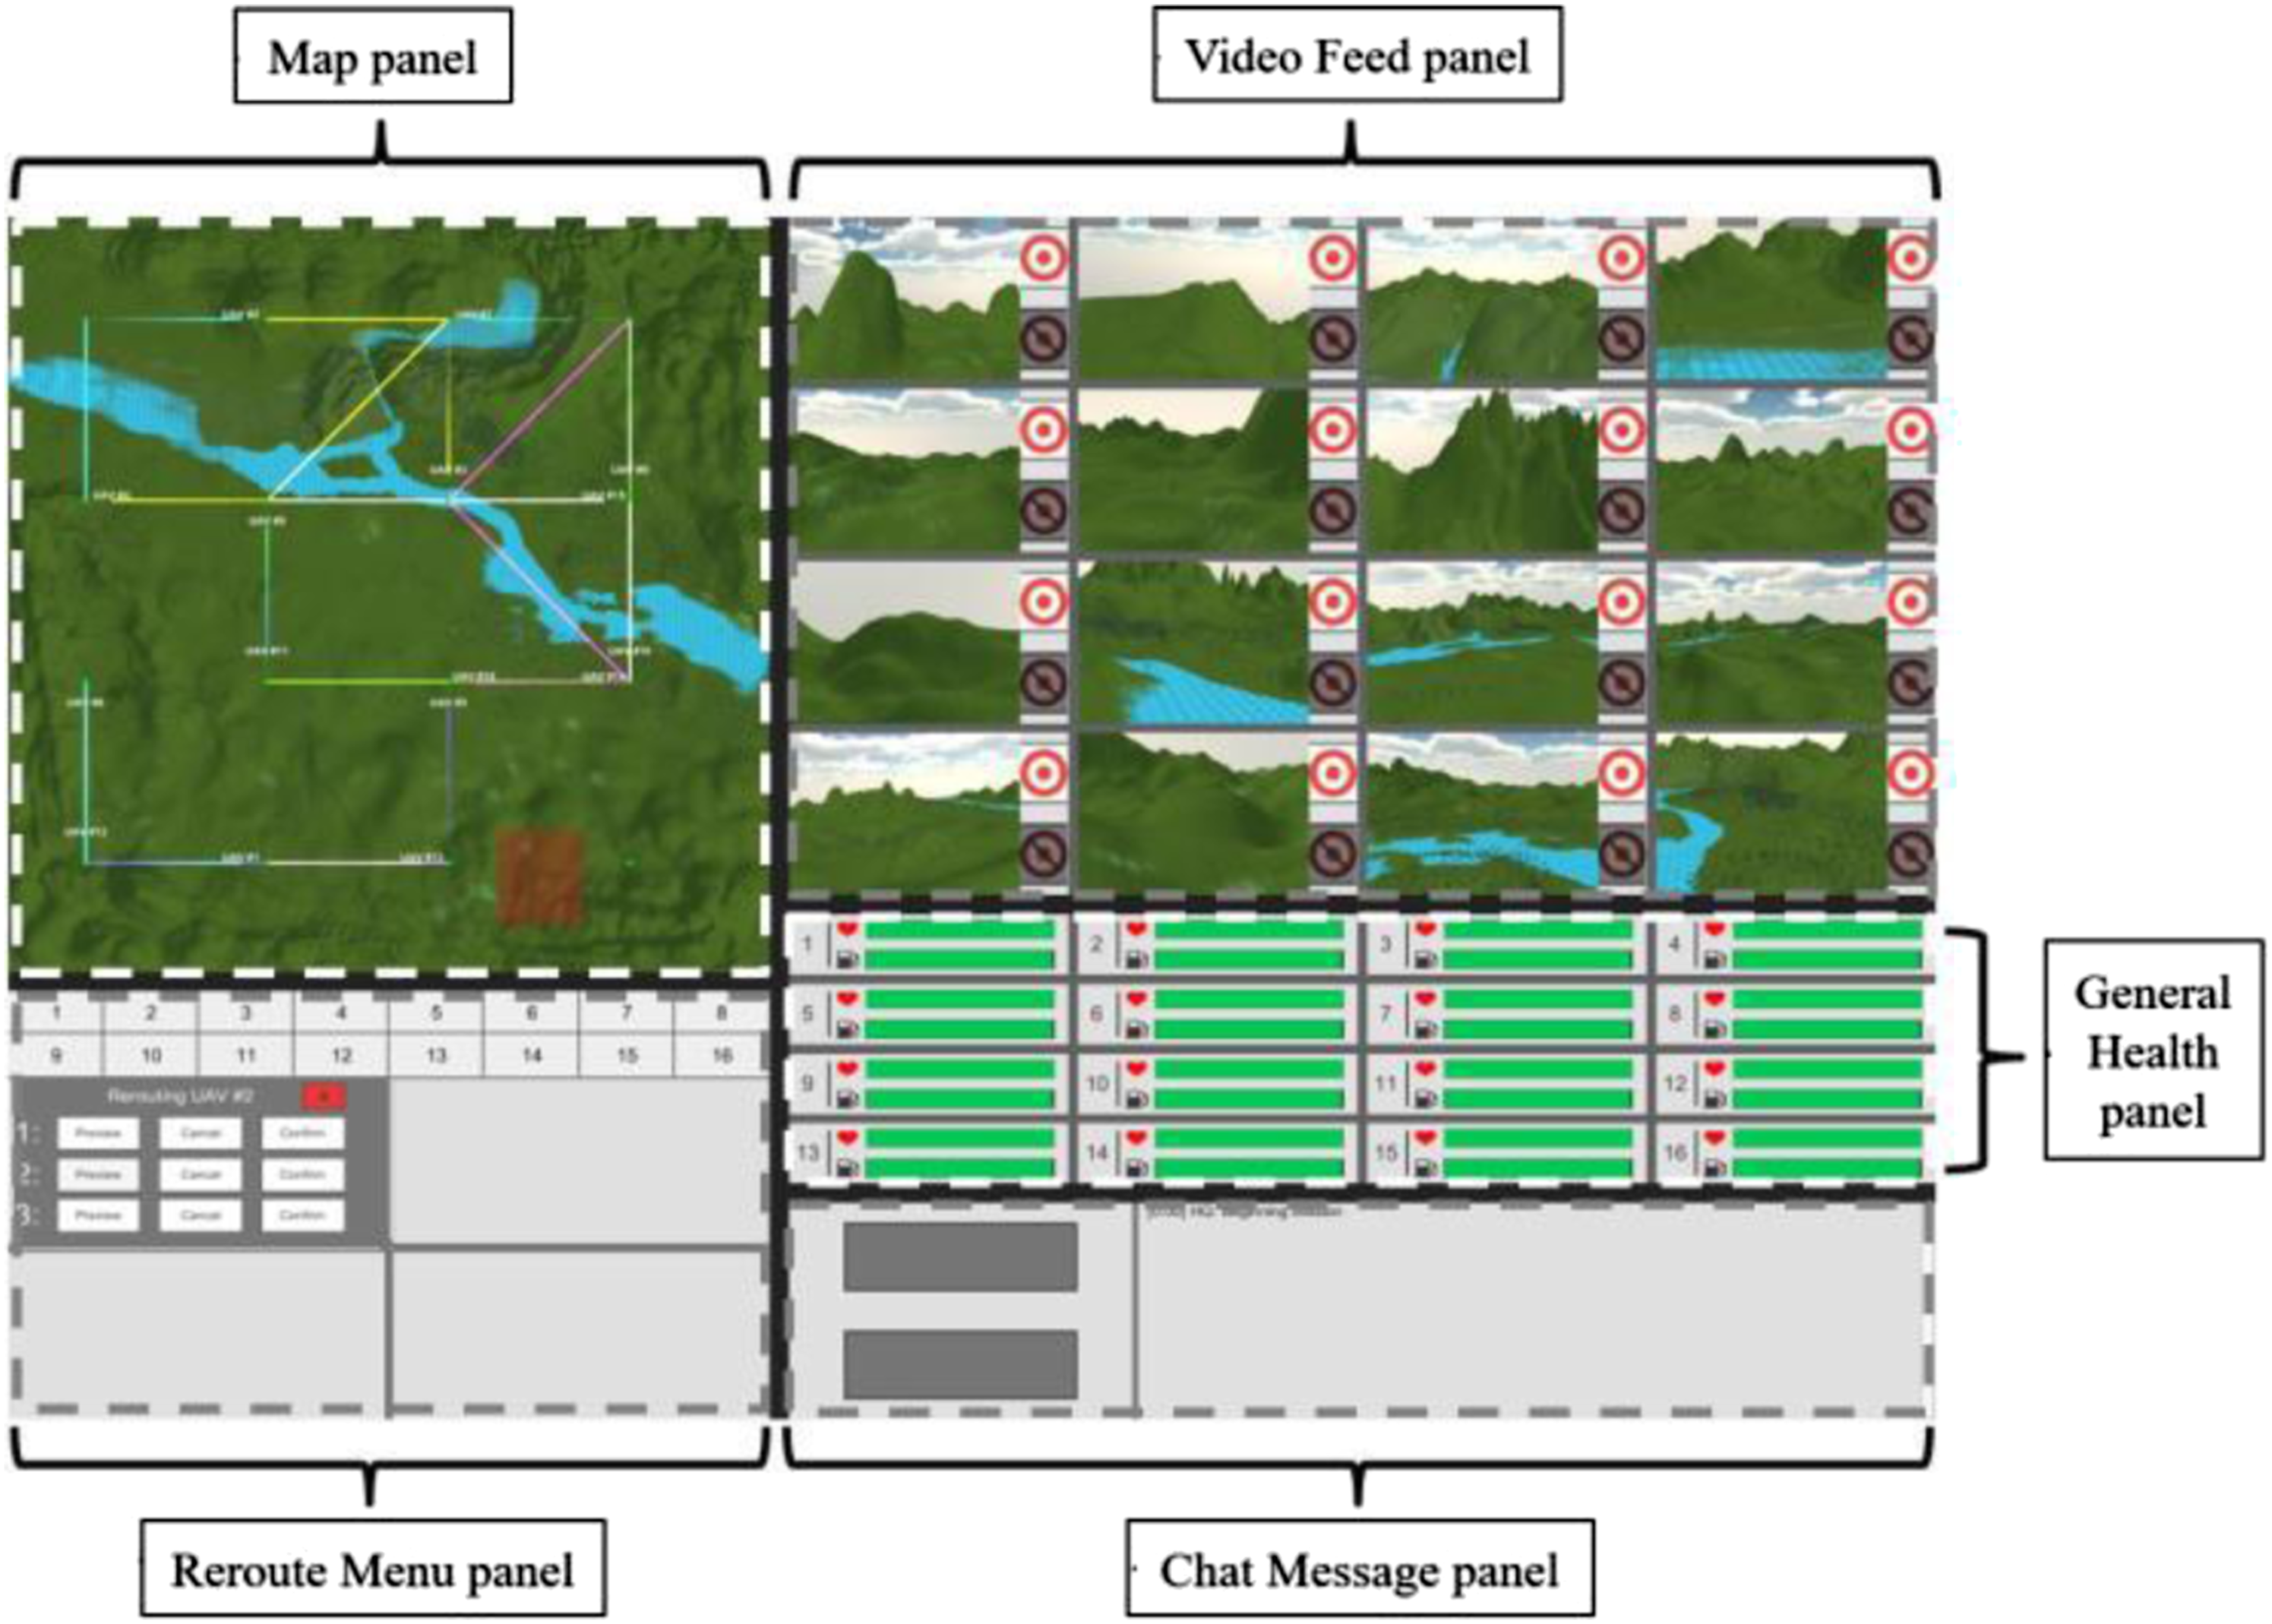
UAV Tasks and Point Values
Each pair was responsible for completing a primary task and three secondary tasks—that is, four tasks total—for up to 16 UAVs. Although all tasks were the pair’s responsibility, only one participant from each pair had to complete each task. The four tasks were as follows: 1. Target detection task (primary task). Pairs monitored each UAV’s video feed and indicated whether a target—a semi-transparent cube—was present. When a UAV was approaching a waypoint (predetermined area of interest denoted on the Map panel), its video feed could become “active” (i.e., video feed became highlighted; Figure 3). If a semi-transparent cube appeared while the video feed was active, the pair was instructed to press the target button to indicate a target was present; if no target was present, then no response was necessary. UAV video feeds were active for 10 seconds and a target could appear with 4–7 seconds left in this time interval. Pairs were instructed that the target detection task had the highest priority among the four tasks. In the low workload condition, one target appeared on one of the active UAV video feeds every 10 seconds. For the high workload condition, three targets appeared on three different active UAV video feeds every 10 seconds. 2. Reroute task (secondary task). Pairs were tasked to reroute a UAV when it was projected to enter a no-fly-zone, denoted by a red square on the Map panel (Figure 3). To reroute a UAV, a participant clicked on a respective UAV’s numbered square in the Reroute Menu panel to activate the reroute menu that listed three alternative route options. Participants could click ‘Preview’ to see a specific alternative’s suggested route. When the UAV was not rerouted in time (i.e., entered a no-fly-zone), it would no longer be able to complete the remainder of the mission. The rerouting task occurred 17 times in each condition. 3. Fuel leak task (secondary task). Pairs were also tasked with monitoring and maintaining the overall health of each UAV. Participants used the General Health panel, that consisted of a health status bar and fuel level bar for each UAV (Figure 3). One instance where a UAV would need assistance is if it experienced a fuel leak, that consisted of the UAV’s fuel level bar rapidly decreasing in fuel, the color of its health status bar changing from green to yellow, and the message “FIX LEAK” appearing in the health status bar. To stop a fuel leak, the participant clicked on the health status bar. This would change it back to green and stop the fuel from decreasing as rapidly. If the leak was not stopped in time, the UAV would reach the “FATAL FUEL LEAK” condition and the task could no longer be completed. A fuel leak occurred a total of 14 times for each condition. 4. Chat message task (secondary task). Pairs were tasked with responding to messages from headquarters by selecting one of two options on the left-hand side of the chat message panel (Figure 3). They were told to respond to as quickly and accurately as possible. There were 19 messages in each condition. A Screenshot of the UAV simulation with panels labeled.
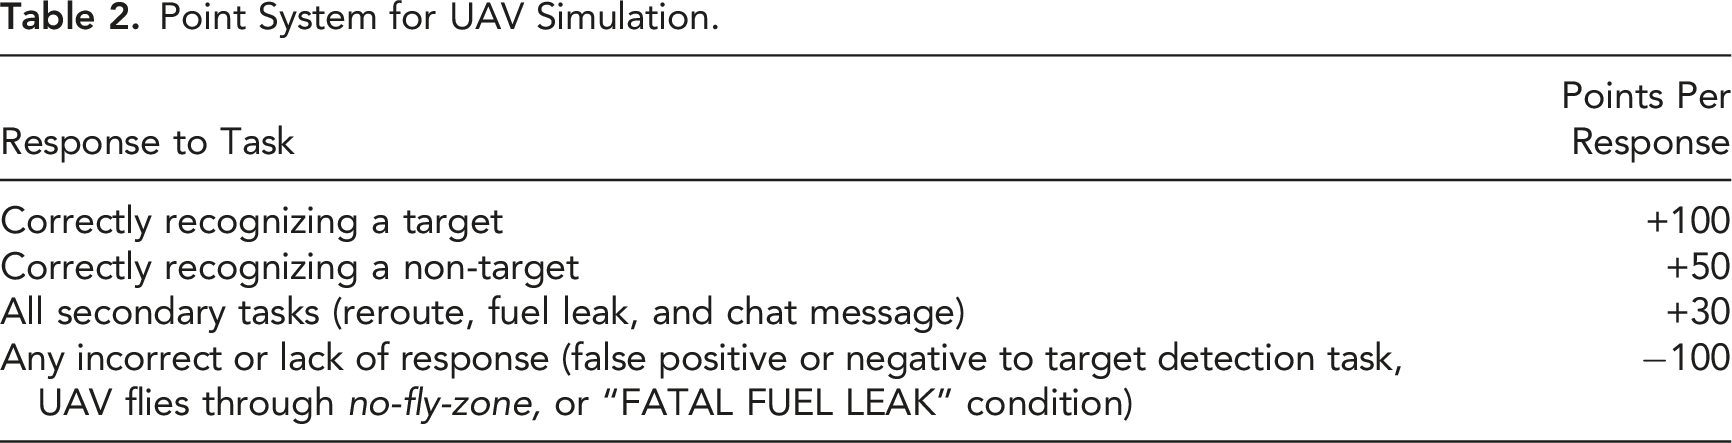
Point System for UAV Simulation.
Experiment Procedure
Participants read and signed the consent form and were then briefed about the experiment’s goals and task expectations as a pair. Participants then independently completed a five-minute training phase. By the end of training, participants had to demonstrate they could achieve 70% accuracy for all tasks. We then informed the pairs about how the simulation was networked and provided them 3 minutes to introduce themselves to one another and discuss anything they deemed necessary. There were no restrictions on how the participants could interact during these 3 minutes, that is, the experimenter gave no guidance on what should be discussed, so discussing team strategies before the experimental portion was completely participant-driven. Afterward, the audio recording started, and participants completed the low workload condition, were provided a short break, and then completed the high workload condition. Participants could communicate verbally with each other during the experiment. The same tasks appeared at both stations and the actions of each team member were reflected on both stations, but a participant could not see the cursor movements of their teammate. At the conclusion of the experiment, participants were compensated for their time.
Data Analysis
After we gathered the eye tracking data from the FOVIO eye tracker, we filtered the datasets and removed invalid entries. The data loss across all participants and trials was on average 11.9% (SD = 11.2%). We detected fixations and saccades using the code developed by Riggs Lab. This code is used to analyze eye tracking data collected from experimental studies with participants and it serves two main purposes: (1) filtering the eye tracking dataset and (2) detecting fixations and saccades based on Nyström and Holmqvist’s (2011) velocity-based and data-driven adaptive algorithm. The code, implemented in Python, first takes the raw eye tracking files as input, and filters out empty or invalid recordings. Then, it passes the data through a Butterworth smoothing filter and calculates the angular velocities in preparation for the data-driven iterative algorithm that keeps iterating until the absolute difference between the newly calculated velocity threshold and the previous one converges to less than 1°.
We then used MATLAB to calculate the MultiMatch similarity scores for each pair of participants (one set of scores for low workload and another for high workload). The five measurements were extracted for each condition using the doComparison function, the main algorithm of MultiMatch (Dewhurst et al., 2012). The eye tracking data were then divided into one-minute segments and the algorithm was run for each segment in turn. Each pair thus had between 10 and 14 segments to run, and additional code was written to perform the doComparison function in batches. This process had to be done due to the large size of the data files that exceeded the RAM limit available. Note that, for our experiment, the SimplifyExcel function in the toolbox that pre-processes the eye tracking data was not used, as all the necessary pre-processing had been done beforehand by the event detection software.
Finally, we calculated the Pearson correlation coefficients between each MultiMatch measure (i.e., shape, length, position, direction, and duration) and each of the performance measures (points and response time). This was done for low workload and high workload separately, resulting in six Pearson correlation coefficients (and their associated p-value) per each low or high workload condition. The assumptions of normality (assessed using Shapiro-Wilks tests) were met for all variables, and homoscedasticity was checked using plots. In addition, Welch paired t-tests were used to compare the performance results in low and high workload. These tests were used since the variances of the performance results at each workload condition were unequal. In all cases, significance was considered at p < .05.
Results
MultiMatch and Performance
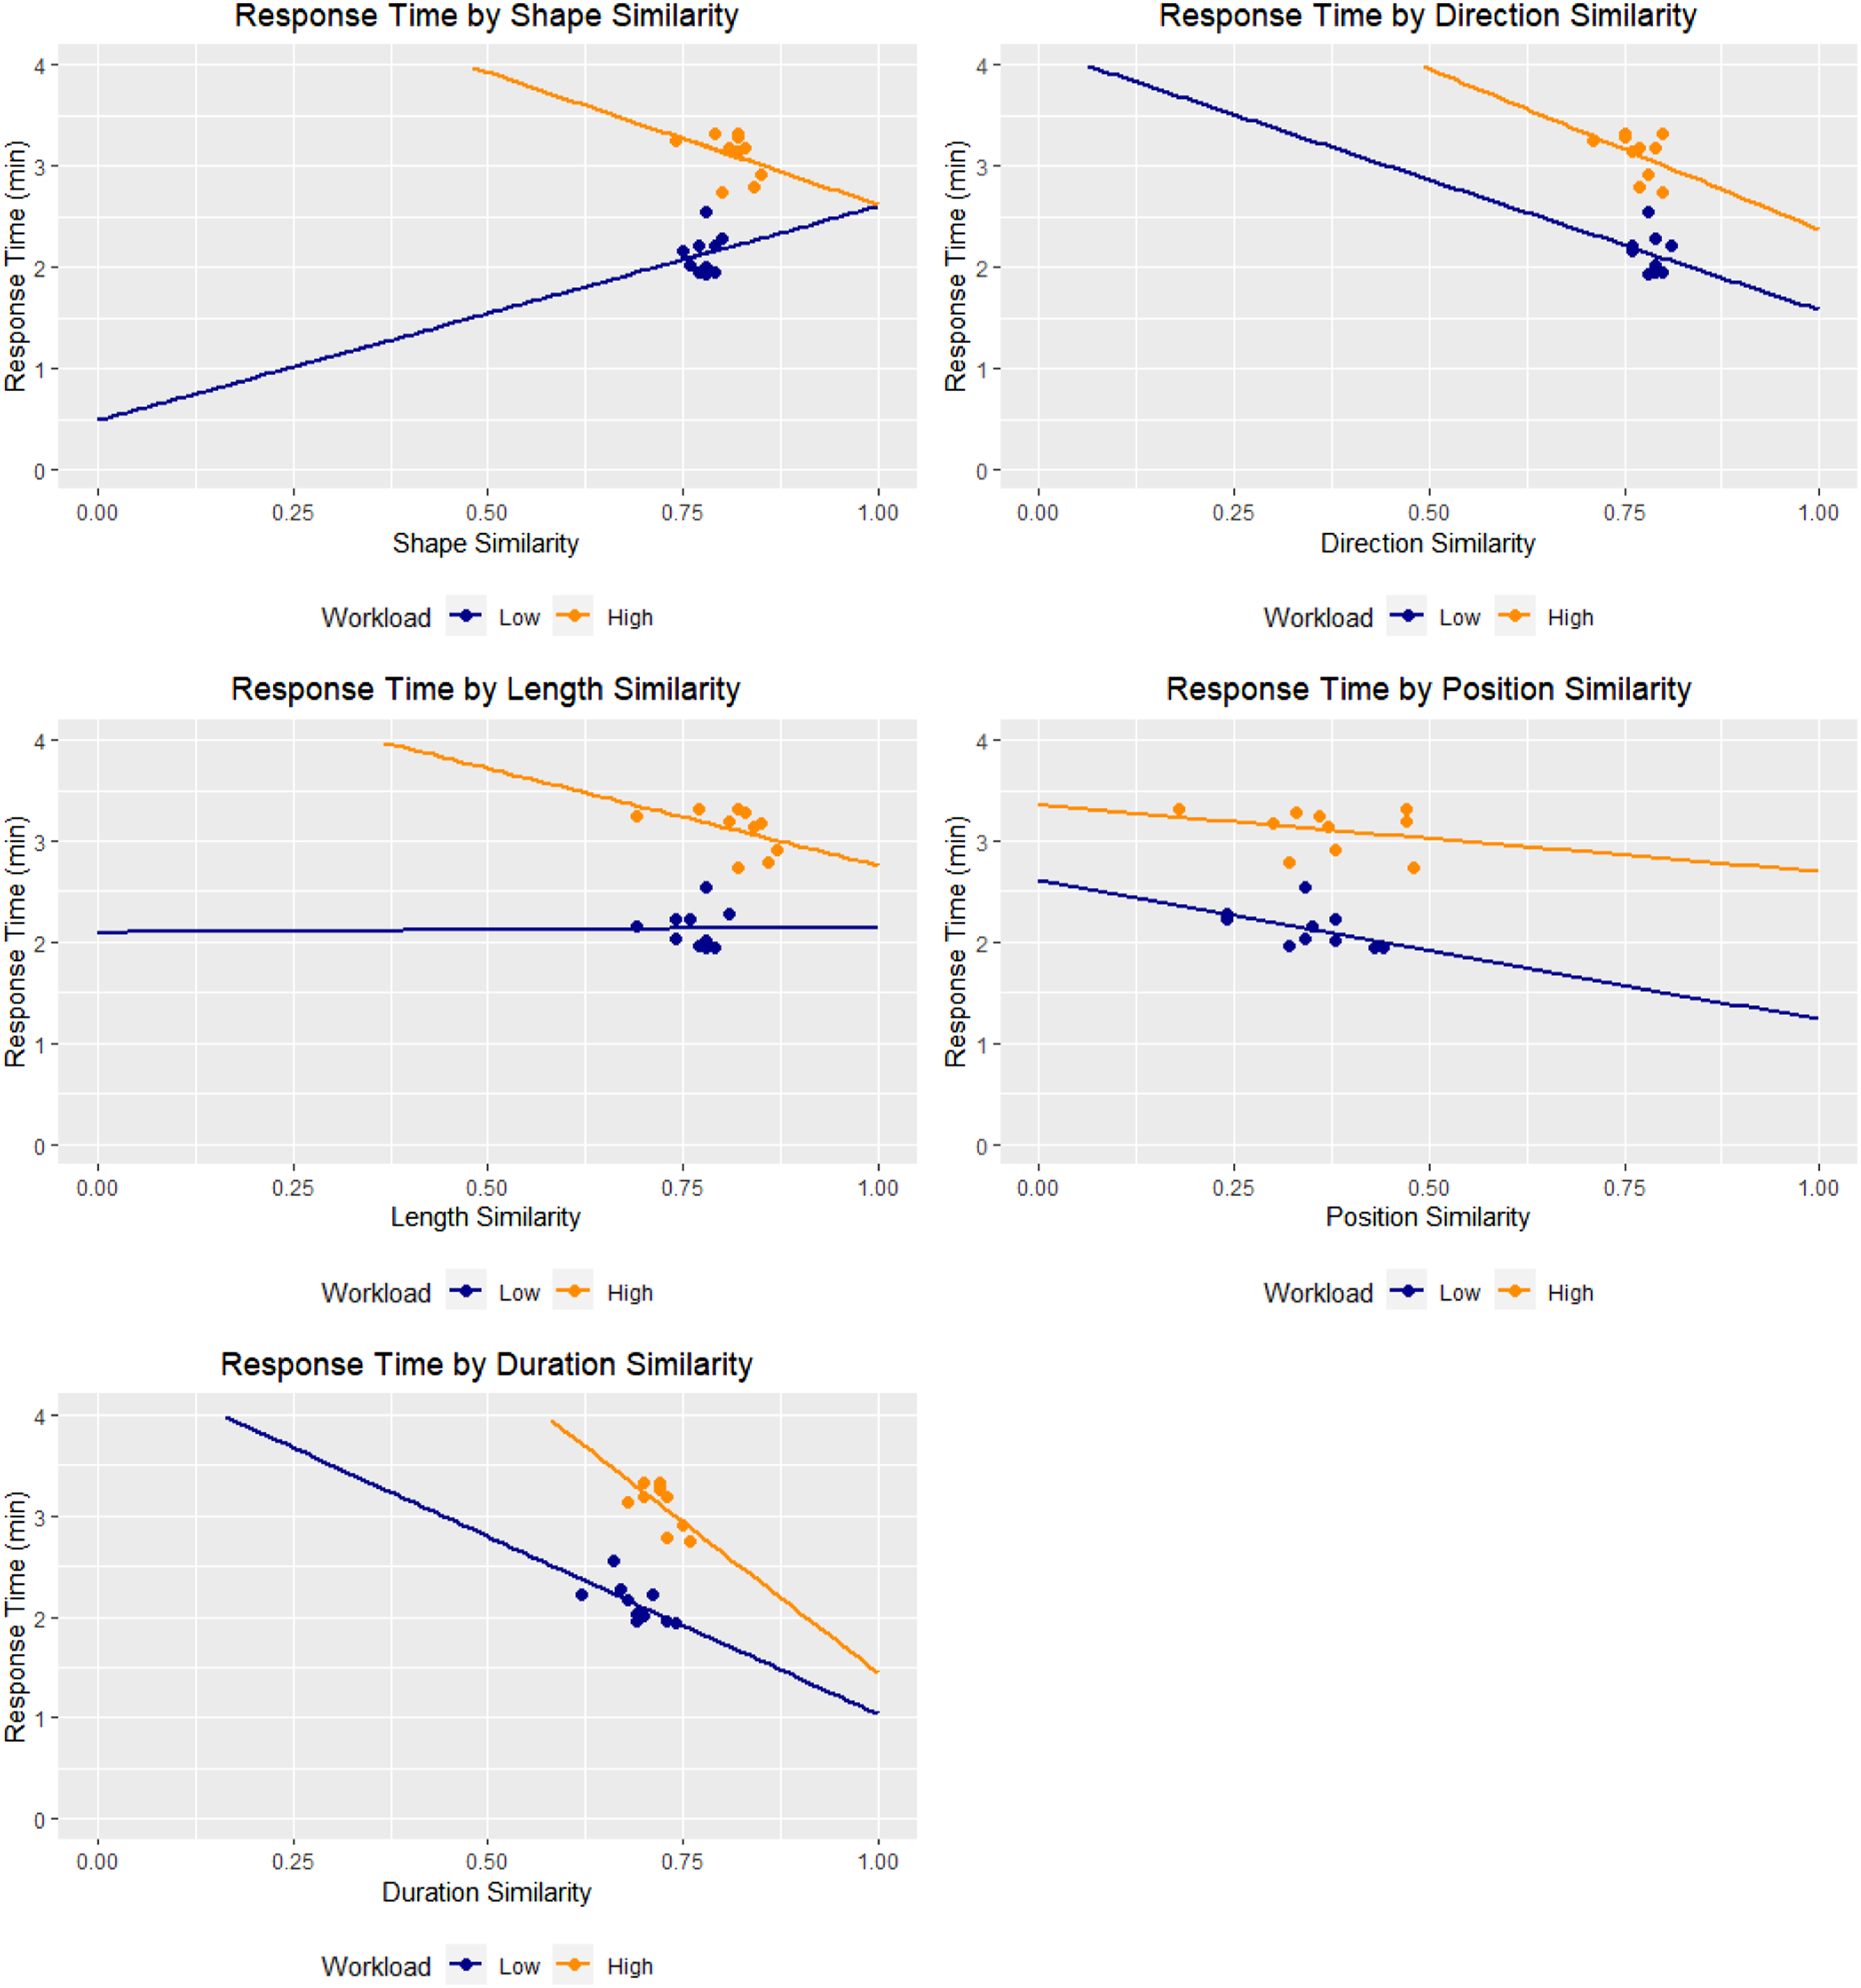
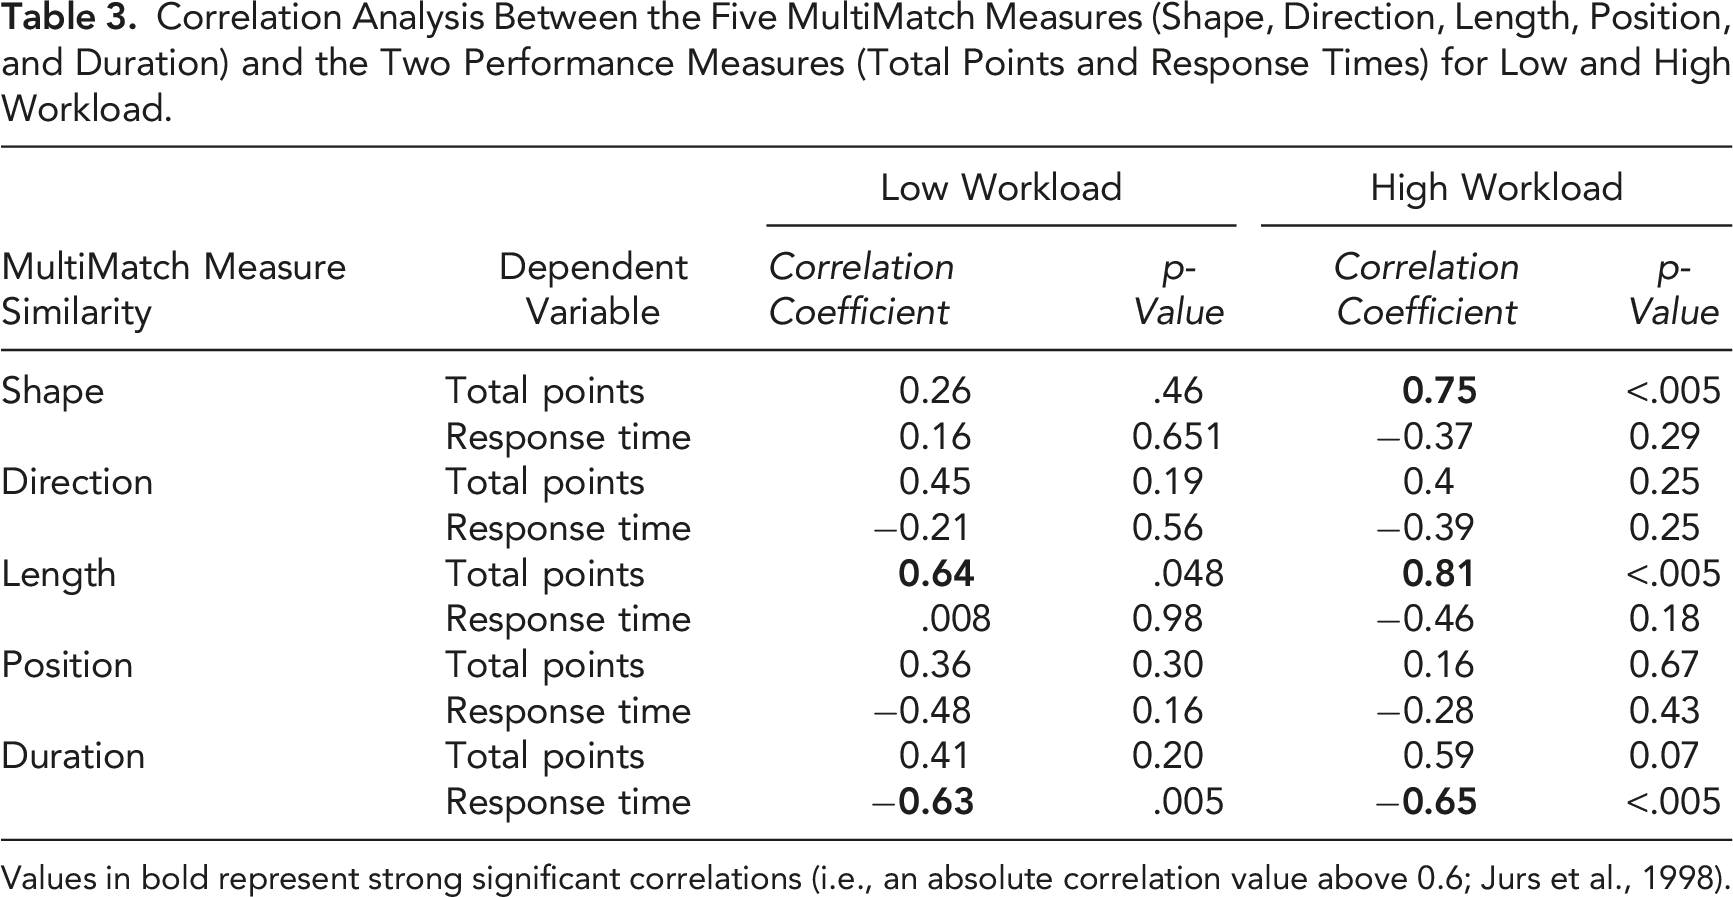
Figure 4 shows the total points as a function of each of the MultiMatch measures (shape, direction, length, position, and duration) in both low and high workload conditions, where each point represents a team. Figure 5 shows the response time as a function of each of the MultiMatch measures for both workload conditions. Both Figures 4 and 5 contain best fitted lines for each workload condition. Table 3 shows the correlation values between MultiMatch values and the two measures of performance (points and response time). Scatter plots displaying total points by shape similarity, length similarity, direction similarity, position similarity, and duration similarity with best fitted lines at both low and high workloads. Scatter plots displaying response time (min) by shape similarity, length similarity, direction similarity, position similarity, and duration similarity with best fitted lines at both low and high workloads. Correlation Analysis Between the Five MultiMatch Measures (Shape, Direction, Length, Position, and Duration) and the Two Performance Measures (Total Points and Response Times) for Low and High Workload. Values in bold represent strong significant correlations (i.e., an absolute correlation value above 0.6; Jurs et al., 1998).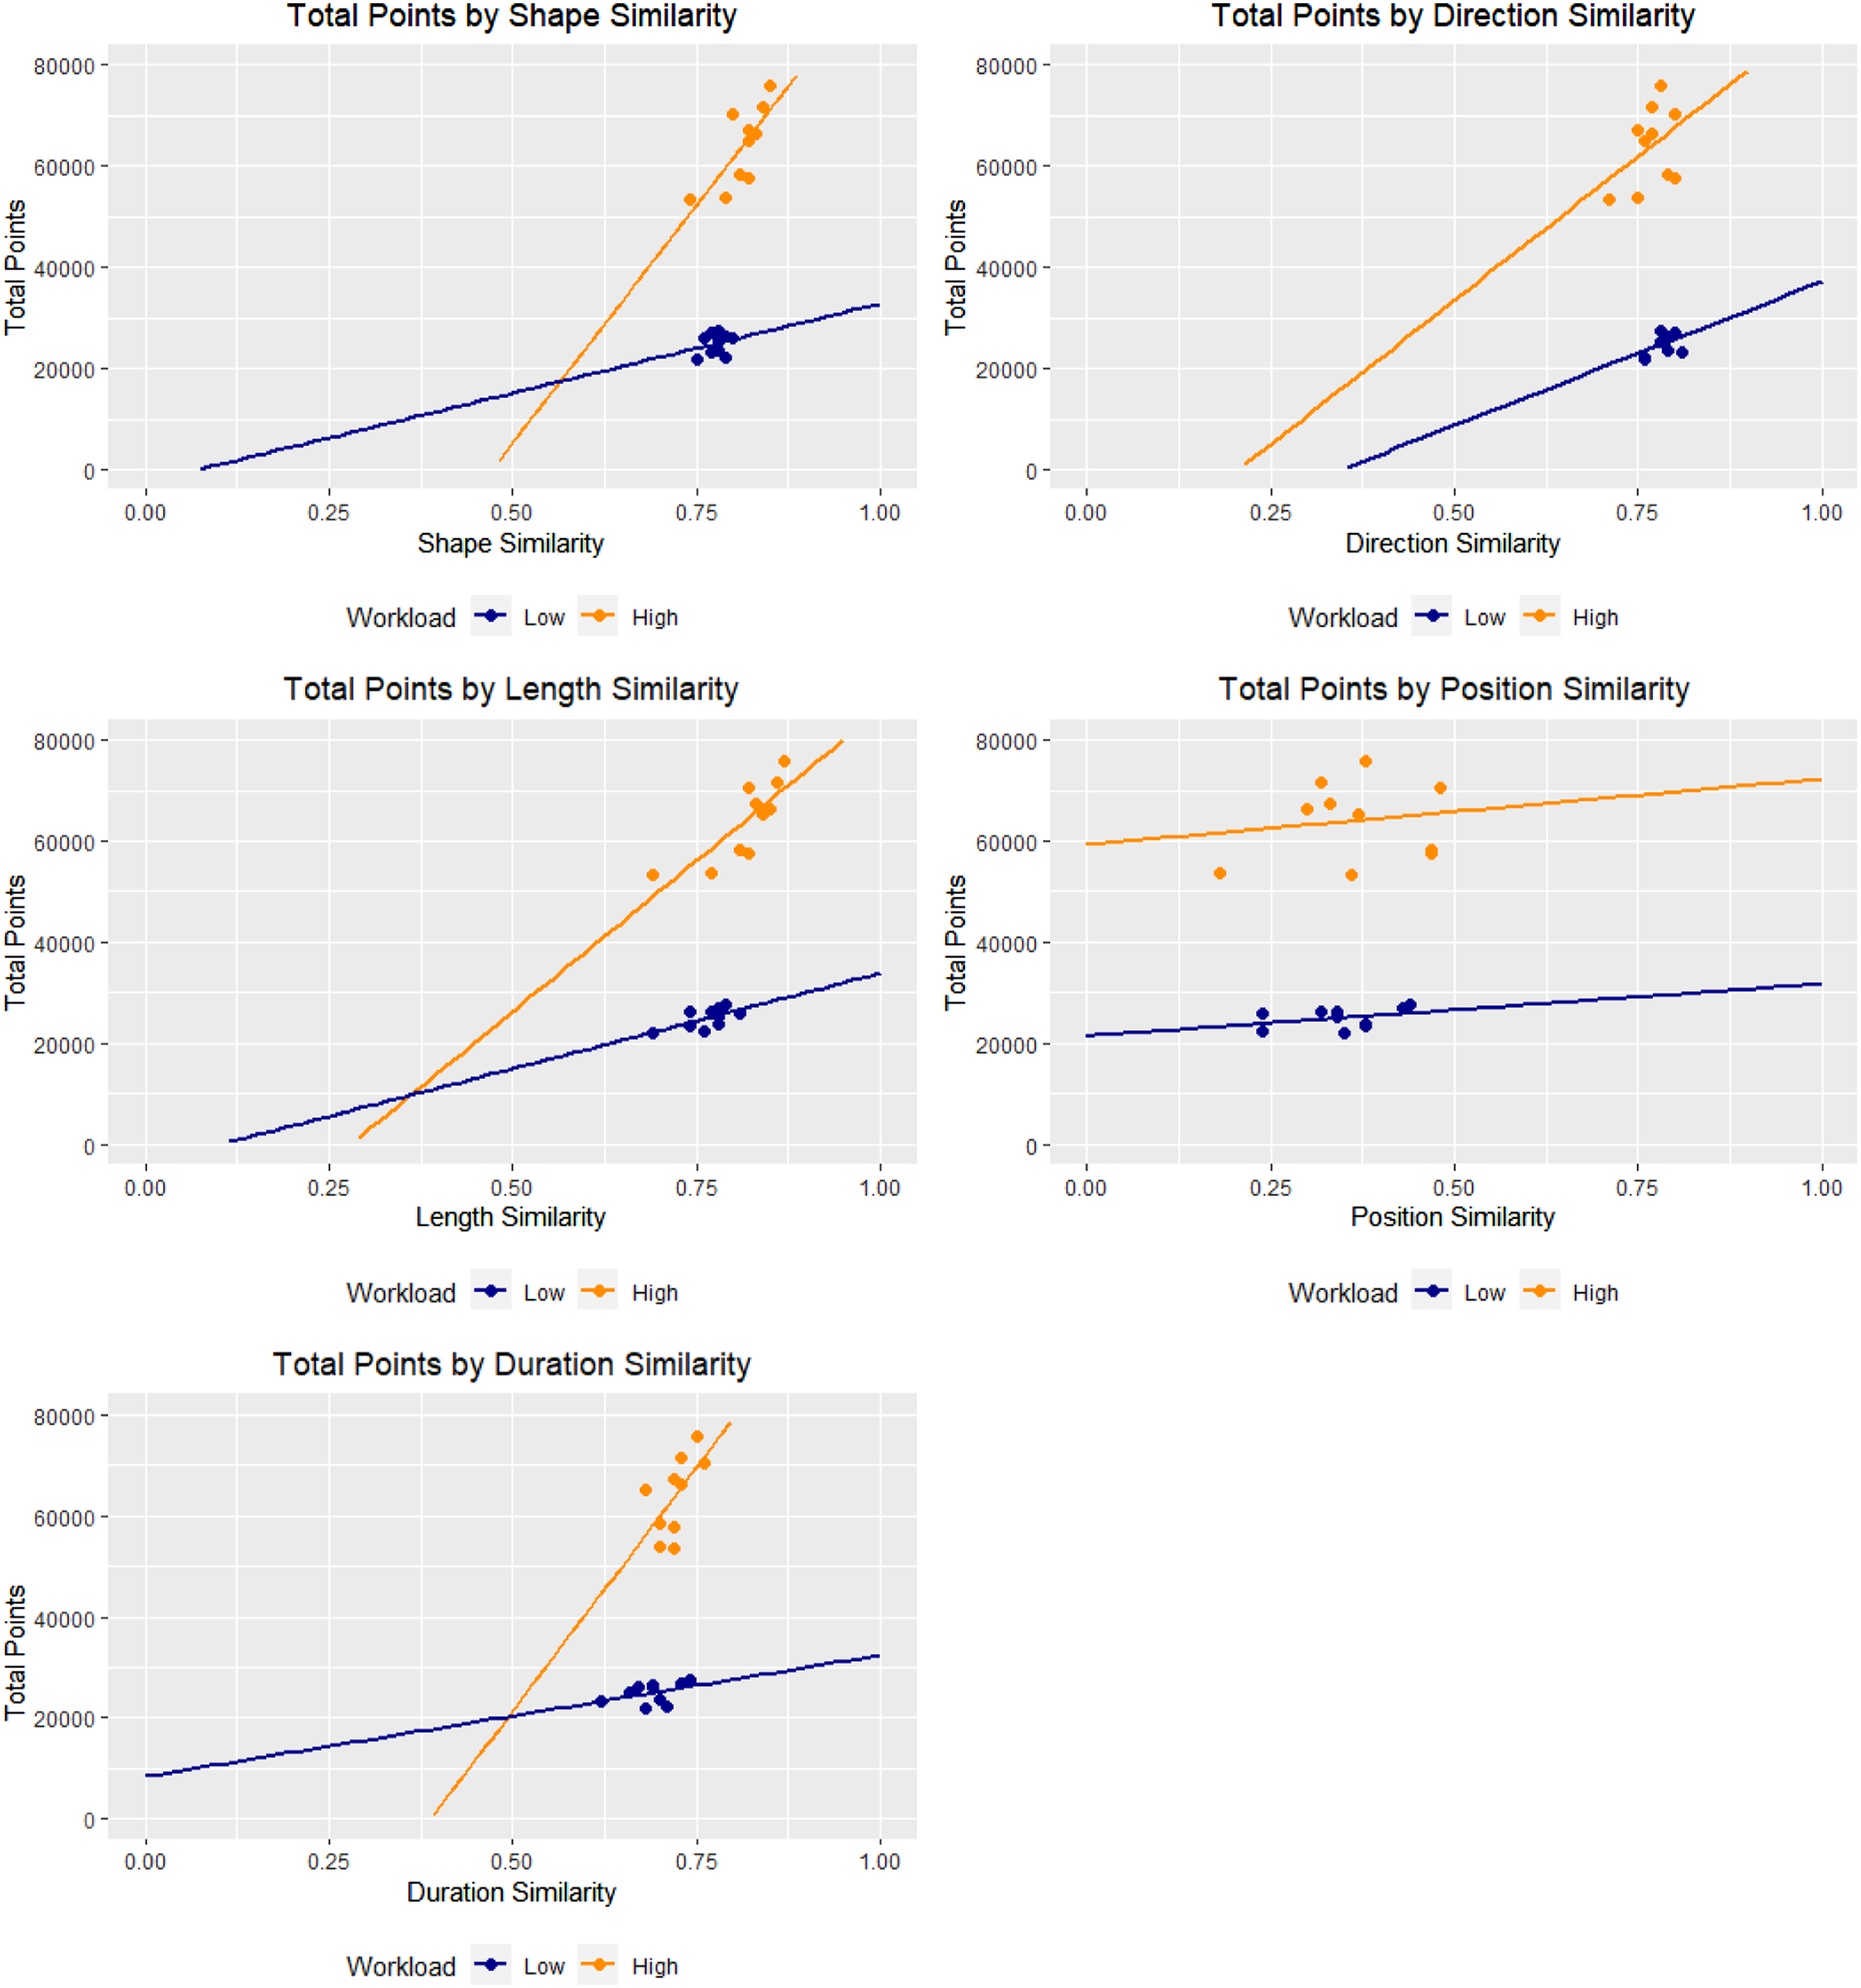
Workload Conditions
The mean of total points scored in the low workload condition was 24,942 (SD = 2,003) and for high workload it was 63,991 (SD = 7,772). The mean response time in the low workload condition was 2.13 (SD = 0.194) and for high workload it was 3.11 (SD = 0.22). Welch paired t-tests revealed significant differences in total points (t(9) = −19.24, p < .001) and response time (t(9) = −16.51, p < .001) means between low and high workload. In addition, the correlation coefficients of Table 3 that showed significance (i.e., MultiMatch measures of shape, length, and duration correlated with each of points and response time) during low workload were Fisher Z transformed (Fisher, 1915) and z-tested against the high workload condition. In the case of points, there was a significant difference in the means of the two samples (z = −2.26, p = .024), while for response time the difference was not significant (z = 1.2, p = 0.22).
Discussion
The overall goal of this experiment was to analyze whether and to what extent the scanpath similarity of two people working together on a complex task was indicative of team performance, and whether this differed during low and high workload. We had hypothesized that: (1) pairs with more similar scanpaths would have better performance and (2) these performance benefits will be accentuated during high workload.
Hypothesis 1: Pairs with more similar scanpaths have better performance
We had predicted that a higher similarity between participants’ scanpaths would result in better performance. In other words, if the participants’ attention allocation strategies were similar in terms of location, shape, sequence, etc., they would be assumed to be more synchronized and more aware of each other’s actions. This would, in turn, enable better team performance. This would then translate to a positive correlation between scanpath similarity and total points, and a negative correlation between scanpath similarity and response time (faster response times meant better performance). This would be in line with previous work that showed pairs with similar attention allocation performed better as a team (e.g., Cherubini et al., 2010; D’Angelo & Begel, 2017), albeit without the level of detail provided by MultiMatch. The findings here could also extend to build on the literature on gaze sharing, that is, allowing teams to view each other’s gaze points on their respective displays while simultaneously completing their tasks, which has been shown to improve performance (Lee et al., 2017).
Our hypothesis held true for two dimensions of the MultiMatch algorithm: length similarity and duration similarity. For length similarity, there was a strong (>0.6) and significant positive correlation with total points both in low and high workload, while for duration similarity there was a strong negative correlation with response time in both low and high workload. This suggests that similarities in teammates’ saccade lengths and fixation durations matter more than similarities in their fixation positions. It appears that how teammates scan makes more of an impact than where exactly the pair was looking, as evidenced by the low and non-significant correlation for position similarity. It is important to emphasize that what matters here is not necessarily the saccade length or fixation duration of each team member per se, but rather that these are similar for both teammates. Similarly, the high correlation coefficients for length similarity and total points suggest that similarity in saccade length indicates better team performance as well.
Hypothesis 2: Performance benefits are accentuated during high workload
The significant difference in performance measures between the low and high workload conditions confirms that performance decrements did occur due to the workload manipulation. We expected there would be a stronger link between scanpath similarity and performance during high workload, that is, more positive correlation coefficients with total points scored and more negative ones with response time. This was observed for three of the five measures: shape, length, and duration. These measures showed higher correlation coefficients (in absolute value) than their low workload counterpart. The effect of workload was also evident in the significant Fisher z-test results and the slopes of the best fitted lines, where the high workload slopes were greater than their low workload counterparts for all five MultiMatch measures (shape, direction, position, length, and duration similarity). We posit several explanations for these results. First, in the more challenging high workload condition, there is a stronger correlation between scanpath similarity and total points scored. This may be due to the teammates becoming more focused on the task that modulated workload and resulted in the team narrowing their attention allocation to the respective AOI (as evident in Devlin et al., 2019). This could explain why the teams had more similar scanpaths (Wickens & Alexander, 2009). This was true of the best performing pairs as they had a change in their attention allocation strategy, that is, having a more focused strategy that resulted in more similar scanpaths during high workload compared to a more open-ended/free-gaze strategy during low workload.
Second, a notably high correlation coefficient was between shape similarity and total points scored in the high workload condition that indicates that team members who had more similar scanpath shapes performed better. Dewhurst et al. (2012) noted that shape similarity has been found to be important in fields such as visual imagery research, where fixation order and position are not as crucial as in interfaces that have very clear-cut and well-structured AOIs, such as a website. For example, Gbadamosi and Zangemeister (2001) used scanpath shape to compare scanpaths when participants were viewing an image. Given the present testbed consisted of a complex interface with a lot of imagery (e.g., the video feeds), this may be the reason for the observed relation. It seems that shape similarity is capturing a unique and specific aspect of teammates’ scanpaths and therefore it may be a valid indicator of team performance in a visually data-rich environment.
Thus, it appears that shape, length, and duration similarity are the aspects of MultiMatch that are best suited to assess the performance of teams experiencing high workload in complex domains, much like this experiment’s simulation. It could be that position and direction similarity will be more strongly linked to performance in the context of a simpler/more directed task with fewer areas and targets that can be carefully defined using AOIs.
Overall, MultiMatch appears to be a useful and very promising tool for assessing team attention allocation strategies and how they related to performance especially during high workload periods. The strong correlation of performance with the three MultiMatch measures (shape, length, and duration) can help provide suggestions for interface design and teamwork strategies in complex, multitasking domains. The findings provide support for developing training programs that teach teammates how to coordinate their scanpaths as a means to optimize team performance. This could be done by showing novice teams the scanning approach of expert teams. For example, novices who were trained to mimic expert’s visual patterns while reading medical images of lungs (Dempere-Marco et al., 2002) or chest X-rays (Litchfield et al., 2010) showed improved performance. The findings also provide support for design solutions that encourage teammates to scan a display in a similar fashion. For example, the system could highlight what a team member is looking at/scanning (e.g., a box changes color to highlight the shared area if both users are looking at the same lines of code; D’Angelo & Begel, 2017). These developments would be especially beneficial in high workload and data-rich settings, such as emergency dispatching or process control.
Limitations and Future Work
Overall, our MultiMatch values were similar to those of Foulsham et al. (2012), with the exception of length similarity, where our values were generally lower. By definition, length similarity is the absolute amplitude difference of aligned saccades, so the nature of the task and the display layout may impact this measure. For example, a task that involves navigating rapidly between different sections of the screen like in our experiment might yield different length similarity values than a task of focusing on a static image or object. It is thus important not to use just one measure of MultiMatch when assessing team performance and to always consider a team’s context when generalizing results. Additional studies in different contexts are needed to improve the external validity of the experiment. Future studies could also control and/or analyze other aspects of team collaboration, such as the communication between team members. Another limitation of our experiment was the small sample size of 10 teams, whereas a larger sample size may have yielded more significant correlations (like the marginal correlation of duration with total points at high workload that has a value of 0.59 and a p-value of 0.07).
Future work can further explore MultiMatch as a scanpath comparison tool by implementing it across different types of domains and tasks, for example, the pair programming collaboration setup in Villamor and Rodrigo (2018). It would be interesting to see how many of the same conclusions hold true for different types of tasks, contexts, and performance measures. For example, system failures could be integrated to investigate how teams adapt to unexpected events and tasks. Also, the results of the current experiment can be used to inform the design of human-robot/artificial intelligence teams; for instance, it would be interesting to investigate the effect of variables like agent autonomy and team composition (O’Neill et al., 2022) on team performance and if the effect can be captured using scanpath similarity measures. Furthermore, an interesting future research direction would be to study the effect of pre-experiment communication on the scanpath similarity and performance of teams. In other words, if the teammates agree to a certain strategy, such as attending to mutually exclusive tasks on separate parts of the screen, it would be interesting to see if that would lead to better performance over time. There is also merit in analyzing how the team communication impacts scanpath similarity and team performance and whether the trends evolve over time. It would also be worth studying the role different personalities (e.g., De Raad, 2000) have in the currently observed relationship between scanpath similarity and task performance. Also, we could explore the effect the point system had on current results, motivating participants, and informing strategy. Conversely, we could explore whether removing any motivating factor would reduce the competitive edge and lead to “social loafing,” that is the decrease in efforts exerted by the individual when working in a group setting (Liden et al., 2004). If MultiMatch metrics could capture the latter, this would be very informative and impactful in complex, dynamic domains.
Footnotes
Acknowledgments
This study was supported in part by the National Science Foundation (NSF grant: #2008680; Program Manager: Dr. Dan Cosley). The authors would also like to thank Aakash Bhagat for the development of the simulator used in this study.
Declaration of Conflicting Interests
The author(s) declared no potential conflicts of interest with respect to the research, authorship, and/or publication of this article.