
Abstract
Objective
Sanding strategies were identified that correlated with better performance and less physical stress.
Background
Sanding requires manual skill because of the dexterity and perceptual needs to perform the job well, and it involves exposure to physical stresses.
Methods
Force and tool kinematics were measured using an instrumented platform and motion capture for 20 participants while performing a timed paint removal sanding task in the laboratory. Performance was based on the quantity and uniformity of the paint removed and measured using image processing. The ACGIH Threshold Limit Value (TLV) for Hand Activity Level Peak Force Index was used to evaluate physical stress.
Results
Linear regression and machine learning algorithms revealed that high performers (above the 75th percentile) moved the sander more, while they varied but applied greater force compared to the low performers (below the 25th percentile). Some high performers could maintain a TLV below the acceptable limit by pausing more and applying less force but performing more frequent exertions.
Conclusions
More force, greater variations of force, and speed were related to better sanding performance, while less force and more frequent exertions and pauses helped reduce physical stress.
Applications
Strategies identified in this study may be useful for training operators in sanding tasks for performance and safety.
Introduction
Manual surface finishing operations involve smoothing or removing material with an abrasive material and a power hand tool, such as sanding, polishing, deburring, and grinding (Baraati et al., 2022; Dickman, 2007; Liao et al., 2008). Various industries commonly utilize surface finishing processes, including furniture, automotive, aviation, construction, metal, and woodworking (Musgrave et al., 2019; U.S. Bureau of Labor Statistics, 2025a, 2025b). Previous research demonstrates that sanding involves exposure to physical stresses that include vibration and noise exposure, sustained shoulder and arm postures, repetitive motions, and pinching and gripping (Irwin & Streilein, 2015). These stresses can lead to operator strains, such as muscle fatigue, discomfort, musculoskeletal injuries, hearing impairments, and dust exposure (Irwin & Streilein, 2015; Young-Corbett et al., 2010).
Although automation can sometimes help reduce physical stress exposure, surface finishing is challenging to automate because of the required human skill. Skilled workers use tactile, visual, and auditory feedback to perform the task (Kalt et al., 2016). Tactile feedback is used to feel the roughness of the surface and to apply the correct amount of force. Visual feedback is used to identify areas that need more sanding. Additionally, auditory feedback is used to perceive the level of force that is applied, and sometimes smell is used to check the quality of the sandpaper. Consequently, humans often perform better than automated or semi-automated robotic systems (Hagenow et al., 2021a; Konstant et al., 2025).
Physical parameters, such as force, tool pitch, and tool movements, are essential to sanding (Kim et al., 2022). These parameters influence the final performance of the sanded workpiece, which is defined by surface roughness, sometimes measured by mechanical or optical means (Gurau and Irle, 2017). Automated sanding requires extensive programming, trial and error, and setting parameters specific to the structure and task (Kabir et al., 2018; Kalt et al., 2016). In some cases, humans are still required to rework the surface by sanding over areas the automation missed (Davidson, 2002).
One method to capture human knowledge is through learning from demonstrations (LfDs). In LfDs, experts and non-experts perform the task, and the important parameters are captured through sensors and tools (Argall et al., 2009). Movement patterns, forces, electrocardiograms, muscle activity, and performance are all examples of data collected through these sensor tools (Hagenow et al., 2021b; Ng et al., 2017; Phan et al., 2020). Ng et al. (2017) captured the tacit knowledge of a worker by measuring surface contact force, tool path, and speed while performing belt grinding. The data captured in the LfD demonstrations are then transferred to a robotic program. Inadvertently, the quality produced by humans may be lost when transferred to the program (Kalt et al., 2016). Further, the reported results were limited to a small sample size or specific worker and well-defined tasks (Argall et al., 2009).
Since human skill remains an important requirement for sanding, there is a need for humans to understand what strategies humans use to obtain better performance while minimizing physical stress. In the current study, force and tool kinematics data were measured, and their features were extracted to identify strategies related to human performance. Two types of features were measured: (1) descriptive features, which summarize force and motion statistics and (2) spatial features, which capture how force and time were distributed across finer locations. Single predictor linear regression, as well as both linear and non-linear machine learning algorithms, were employed to identify the influence of sanding parameters on task performance and physical stress. The goal of the current study was to identify strategies that result in the best performance and the least physical stress.
Methods
Participants
The data used in the current study were simultaneously collected during a previous sanding experiment reported in Konstant et al. (2025). The study recruited 20 university population volunteers (11 female and 9 male), with informed consent and IRB approval. All were at least 18 years of age (M = 21.15 years, SD = 4.09 years). All, except one were right-hand dominant. Exclusion criteria included participants with previous or current upper body injuries or participants with an implanted pacemaker, as described in Konstant et al. (2025).
Procedures
The study required participants to sand paint from a 0.3 m × 0.6 m polycarbonate plastic panel using a Dynabrade pneumatic random orbital sander. A new sheet was provided for each participant. The plastic sheets were spray painted using water-based spray paint and set to dry for an hour. The polycarbonate plastic was chosen because of the material uniformity in texture and color, therefore creating a more consistent surface between participants. Participants were instructed to uniformly remove as much paint as they can from the spray-painted workpiece of plastic in 10-minutes. The piece was divided into eight regions. Then, a four-hole template was used to add additional layers of spray paint in four random regions. The regions with extra paint were considered defects that require extra work. One hour of training was provided prior to the study and participants were instructed to hold the sander in the dominant hand and move slowly across the panel to uniformly remove the paint. Protective coats, gloves, goggles, hearing protection, and an N95 mask were provided. The task is completely described in Konstant et al. (2025).
Equipment
An LED motion capture marker was placed in the center of the back of the hand near the fourth metacarpal joint. An additional marker was placed on the tool above the on/off switch of the tool. These markers were used to record the trajectory of the tool while sanding. A Northern Digital Inc (NDI) Optotrack motion capture system recorded the subject’s hand motions while sanding. LED sensors were placed on the dominant hand glove and on the center of the tool. The data was measured at a sample rate of 125 Hz. The bottom of the workpiece was located 0.11 m above the vertical height of the shoulder. Before the start of the experiment, an LED sensor was used to record the 3D coordinates (x, y, and z) at three standard points in the bottom left, top left, and top right corners of the sanded workpiece for 10 seconds. These locations were the same for each subject but relative to the subject’s standing shoulder height. The 3D coordinates from the three standard points were used in a homogeneous transformation to translate the Optotrack coordinates to the coordinates of the working piece. The x and y coordinates represent the horizontal and vertical positions on the 2D plane of the workpiece, while the z coordinate represents the distance to the plane.
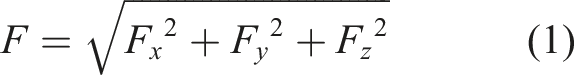
A three-axis load cell platform was placed behind the plastic workpiece to record forces applied to the surface. An Interface Force Measurement Solution 3A Series 3-Axis Load Cell was mounted in the center of an aluminum plate behind the sanded workpiece and used to measure the applied forces in the x, y, and z directions. A BSC4 Amplifier digitized the signals, and the data was sampled at 125 Hz. We utilized all three directions to calculate the magnitude of the force, as shown in equation (1). The sensor was tested for linearity throughout the x and y range to verify that the force measures were constant.
Task Performance Measurements
Images of the unpainted panels and painted panels were captured using a digital camera (Nikon D3200 DSLR with an AF-S DX-NIKKOR 18-55 mm lens), and again after participants sanded the surface. The images were processed using software in Matlab. Performance was quantified as a percent by the ratio of corresponding pixels of the sanded piece from blue (unsanded) to white (fully sanded). The colors within the image were represented in RGB color space. We measured the quantity of paint removed and the uniformity of the sanded workpiece.
The panel was divided into eight equal regions to calculate sanding performance for each location, as shown in Figure 1. Quantity (amount removed) and uniformity (evenness of the surface) were measured as detailed in Konstant et al. (2025). A composite score was the average score of the quantity and uniformity. Participants were grouped as high performers or low performers based on their composite performance score. High performers were considered as the top 75th percentile of the composite performance score and low performers were the lower 25th percentile composite performance score. Participants were grouped into these categories to understand differences in sanding strategies and physical stress based on the performance. The image shows a sanded panel with eight equal regions dividing the piece. These division lines were not visible to the participants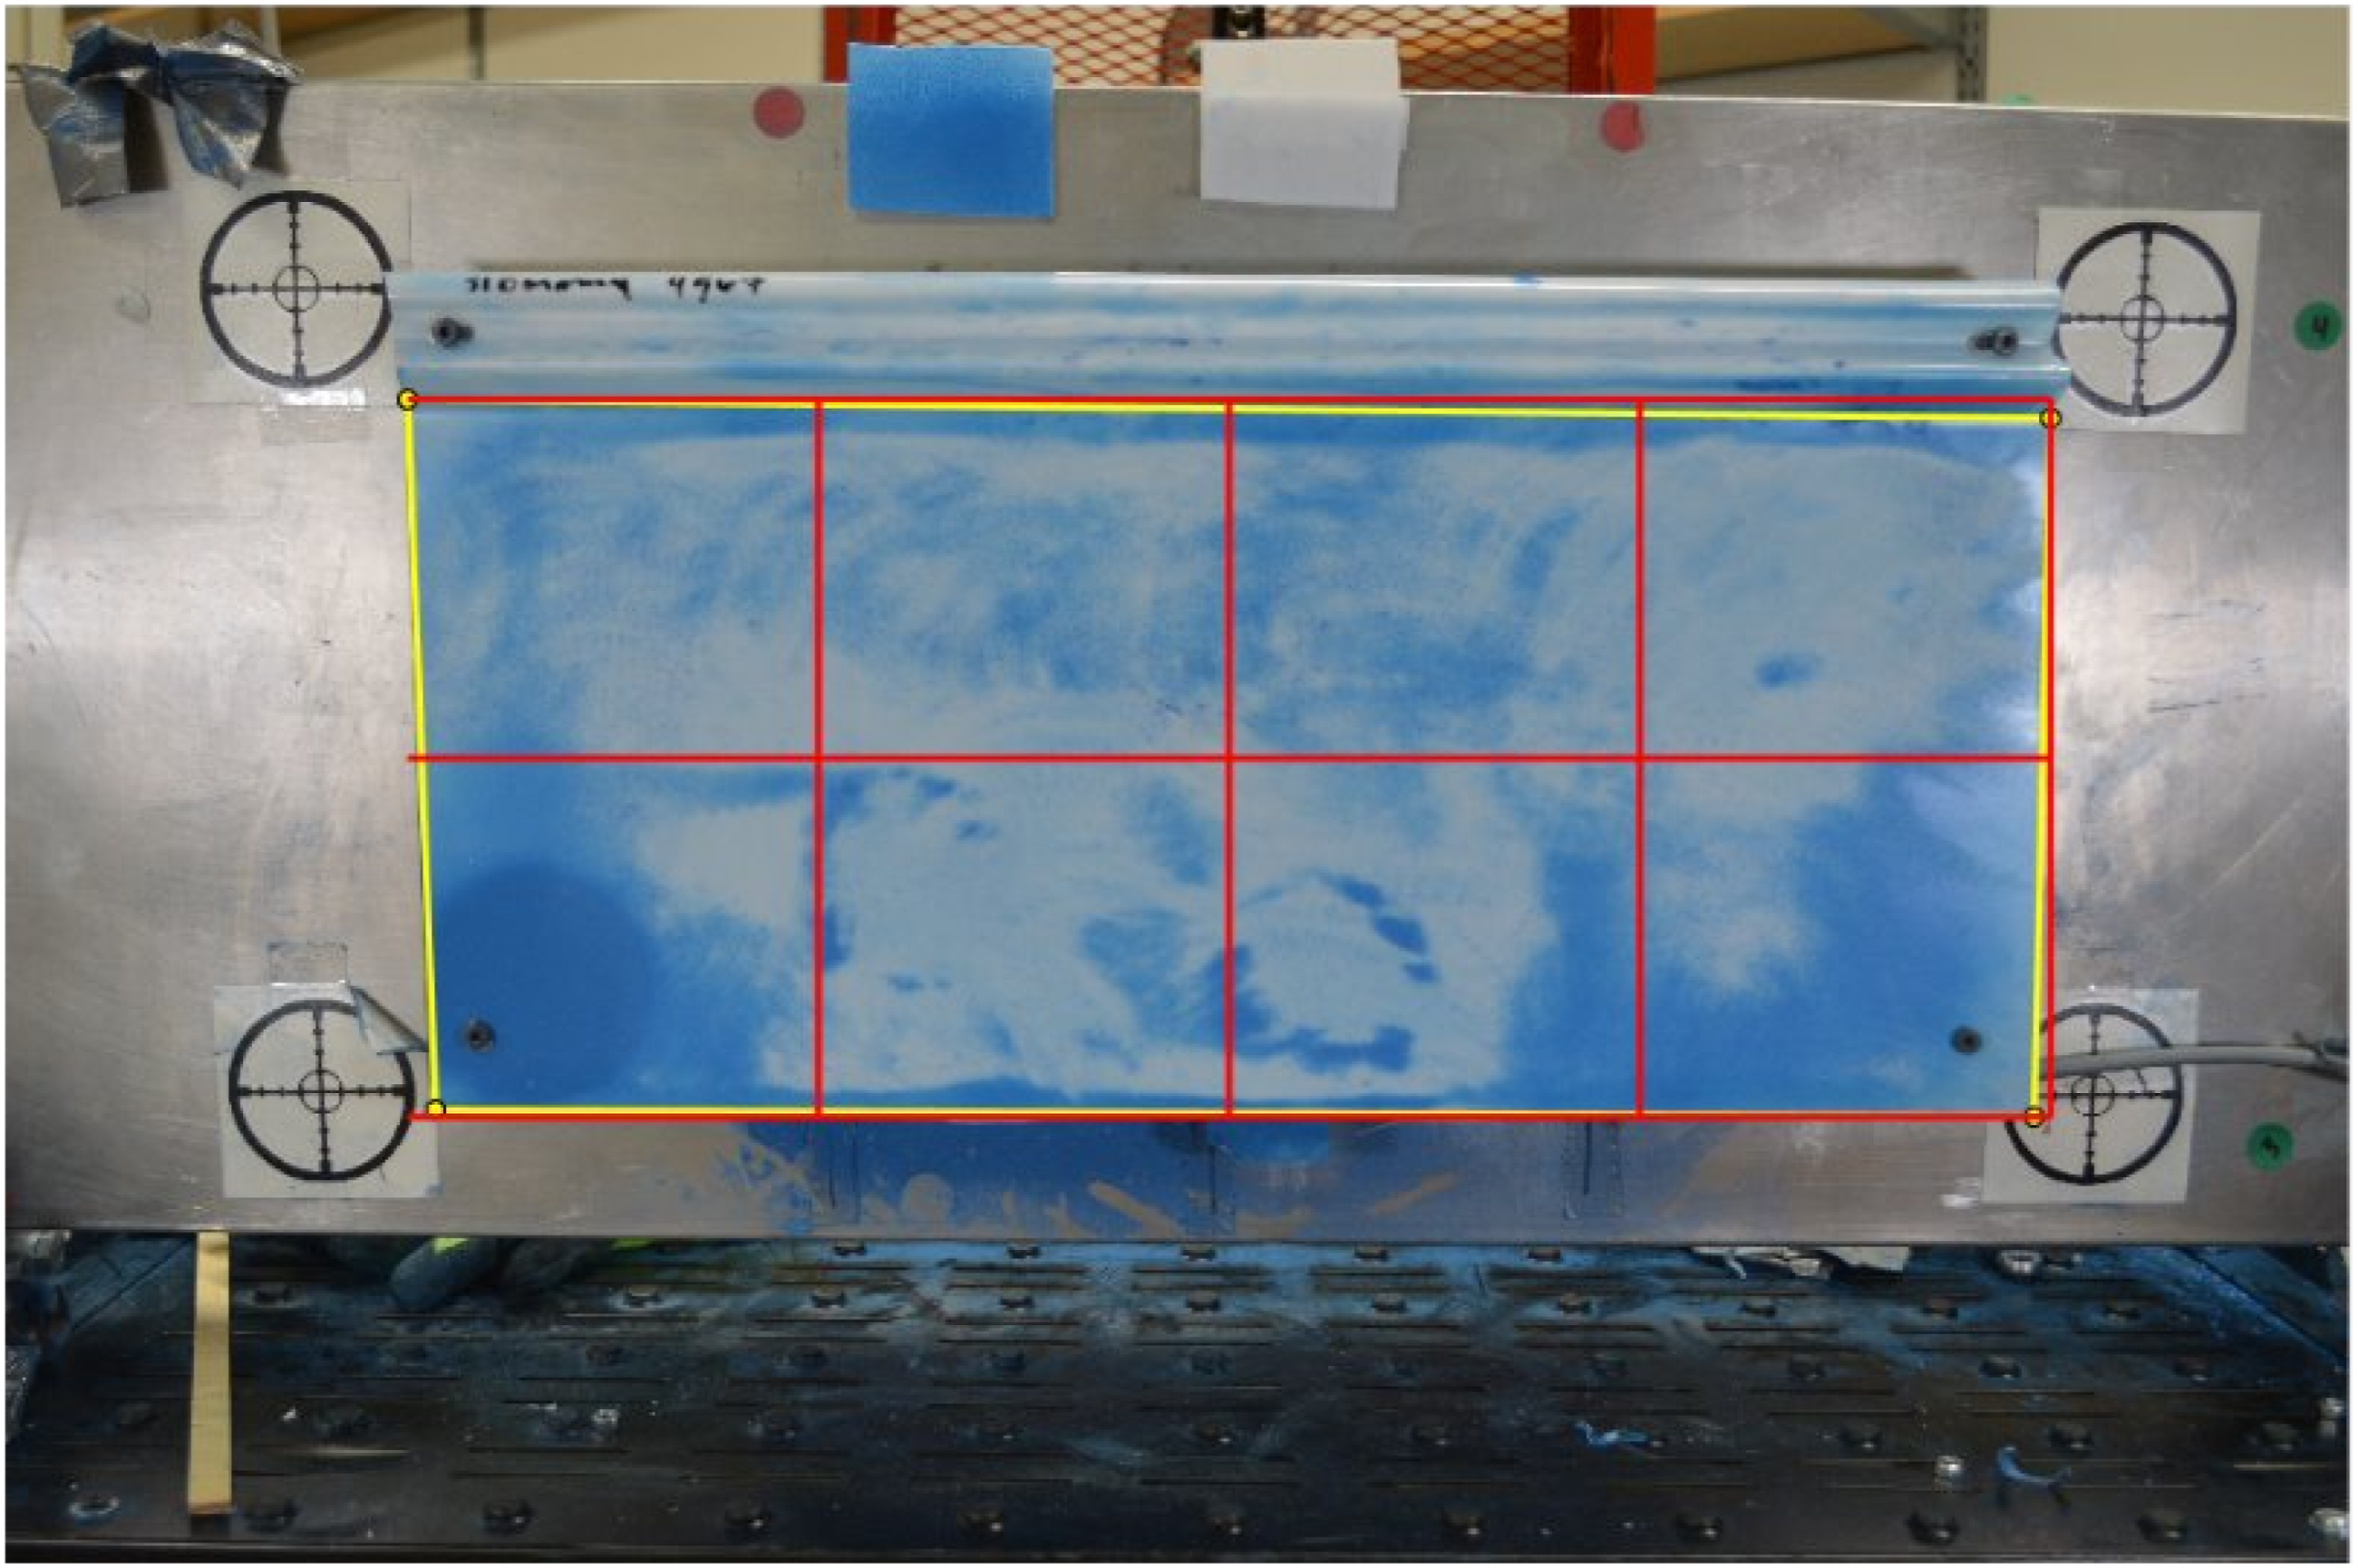
Subjective Discomfort
Data was collected using a body map with 26 different areas of the body. Discomfort was measured on a scale from 0 (no discomfort) to 10 (extreme discomfort). Areas with positive discomfort were included in the present work, which included the hand, upper arm, lower arm, and the front and the back of the shoulder. One measurement per subject, 20 in total, were made at the completion of the task. Subjective discomfort measurements are fully described in Konstant et al. (2025).
Data Preprocessing and Feature Extraction
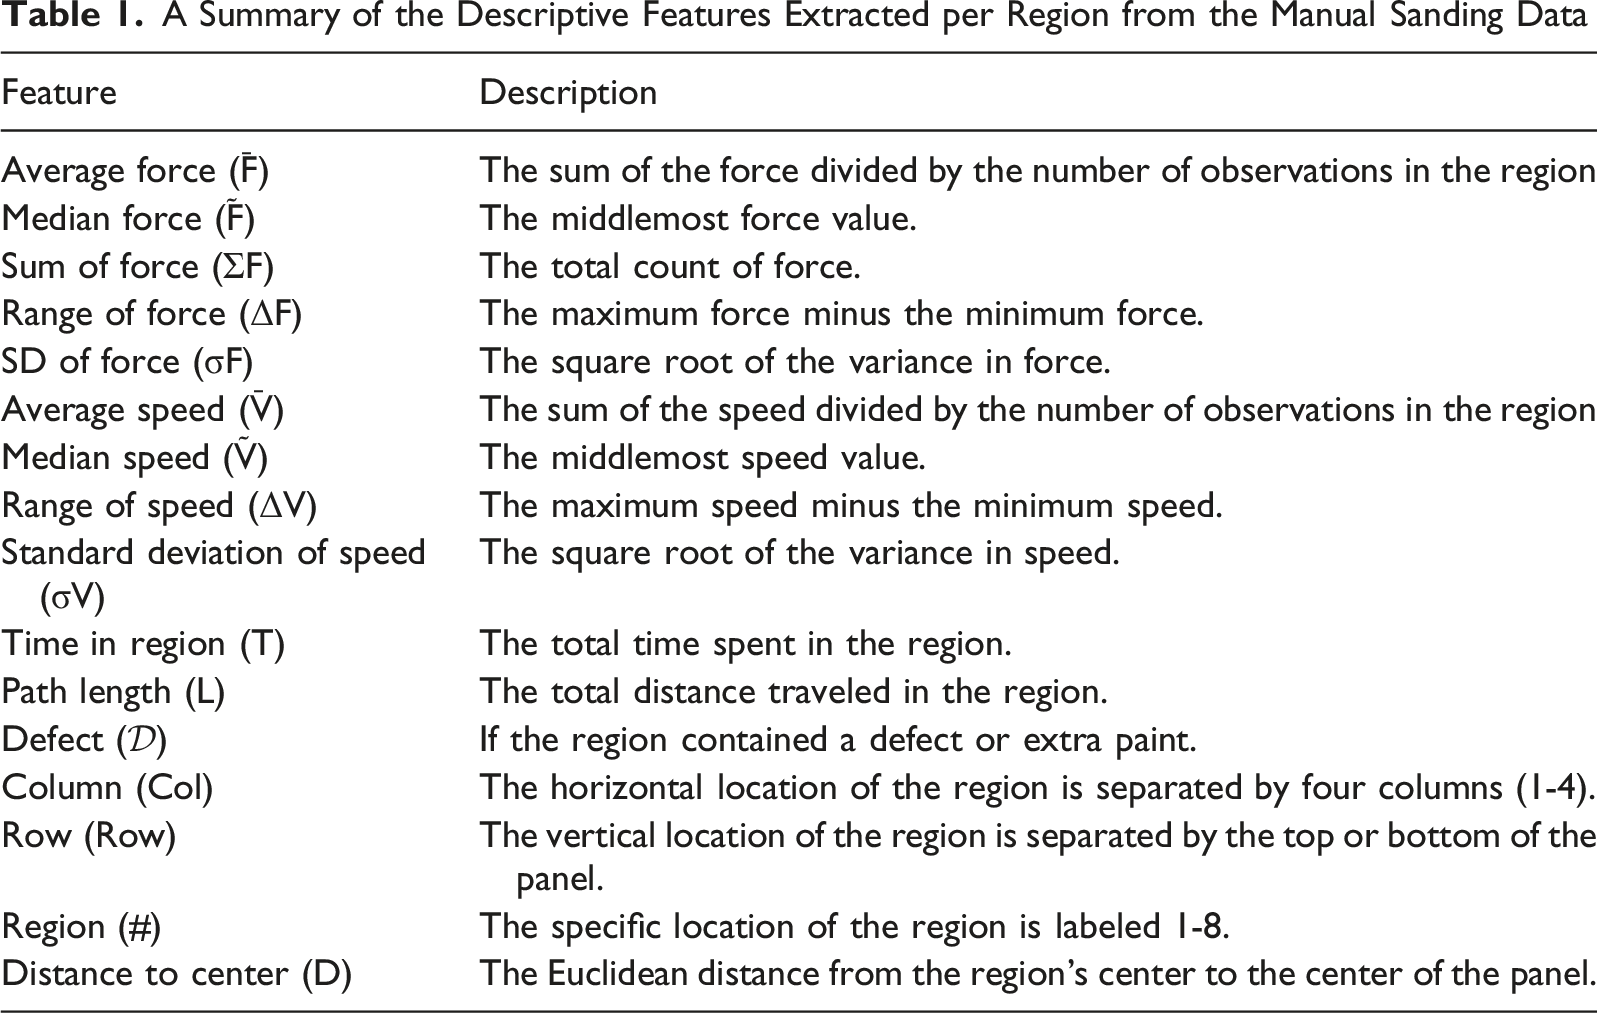
A Summary of the Descriptive Features Extracted per Region from the Manual Sanding Data
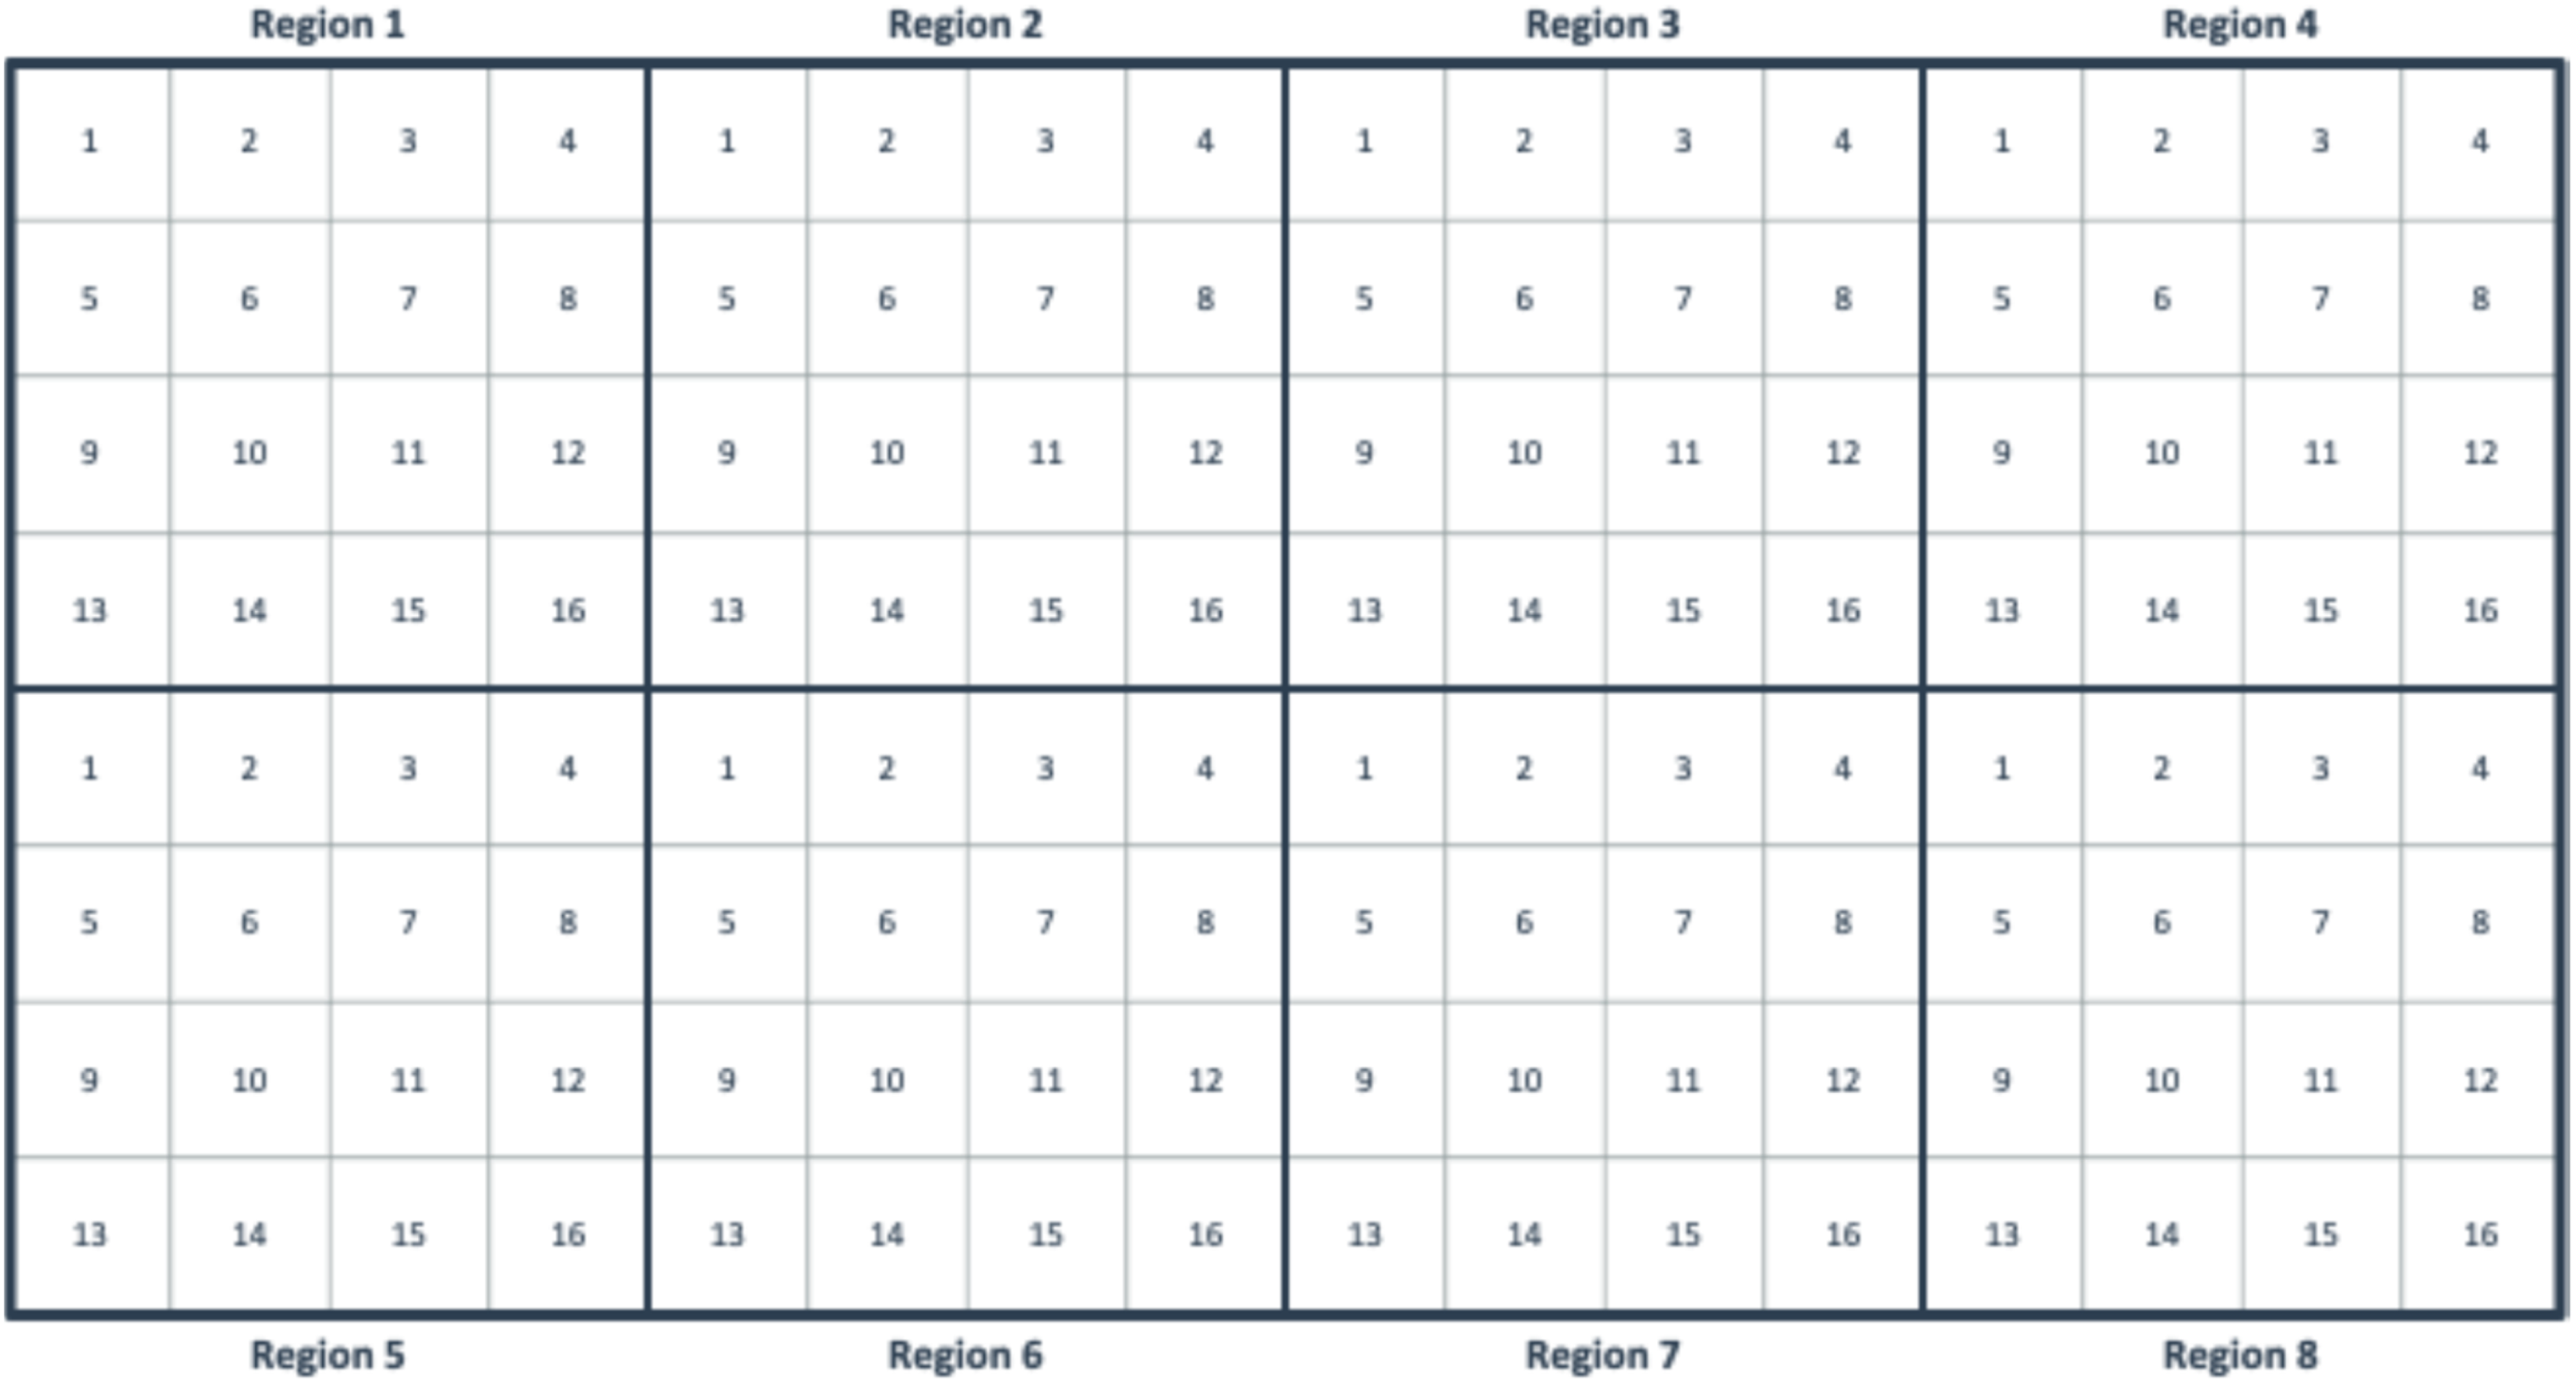
The sanded panel broken up into 8 regions labeled 1 through 8, a graphical representation of a region with 16 bins within each larger region for the spatial feature extraction
To obtain a higher-resolution view of sanding behavior, each region was further subdivided into a 4 × 4 grid of 16 bins (see Figure 2 for the bin layout and numbering). While the descriptive features (Table 1) summarize force and motion for an entire region, the force exerted and time spent sanding in each bin captures finer spatial patterns of sanding behavior. Specifically, force and time in each bin were normalized across all 20 participants, producing 16 normalized force values and 16 normalized time values per region. Each spatial feature was labeled by its bin number: Fk for normalized force and Tk for normalized time at bin k (e.g., F11 is the normalized force at bin 11). The bin number indicates the spatial position within the region, as shown in Figure 2. Because the same 4 × 4 grid was applied to every region, a given bin number represents the same relative spatial position across all eight regions.
Data Analysis and Model Development
The goal of the modeling analysis was to predict sanding performance—measured as uniformity and quantity scores—for each of the eight regions per participant. Each observation corresponded to one sanding region (one of eight regions) from one subject, yielding 160 total observations. A flowchart outlining the modeling analysis is shown in Figure 3. Two types of input features were used: descriptive features and spatial features. Single predictor mixed linear effect models were used to study the feature effects on sanding quantity and uniformity. Statistical significance was achieved with p < .05. No obvious violations of the assumptions of the linear regression models were discovered from visually assessing the residuals of the Q-Q plot, as discussed in Brauer & Curtin (2018) and Loy & Hofmann (2014). Model overview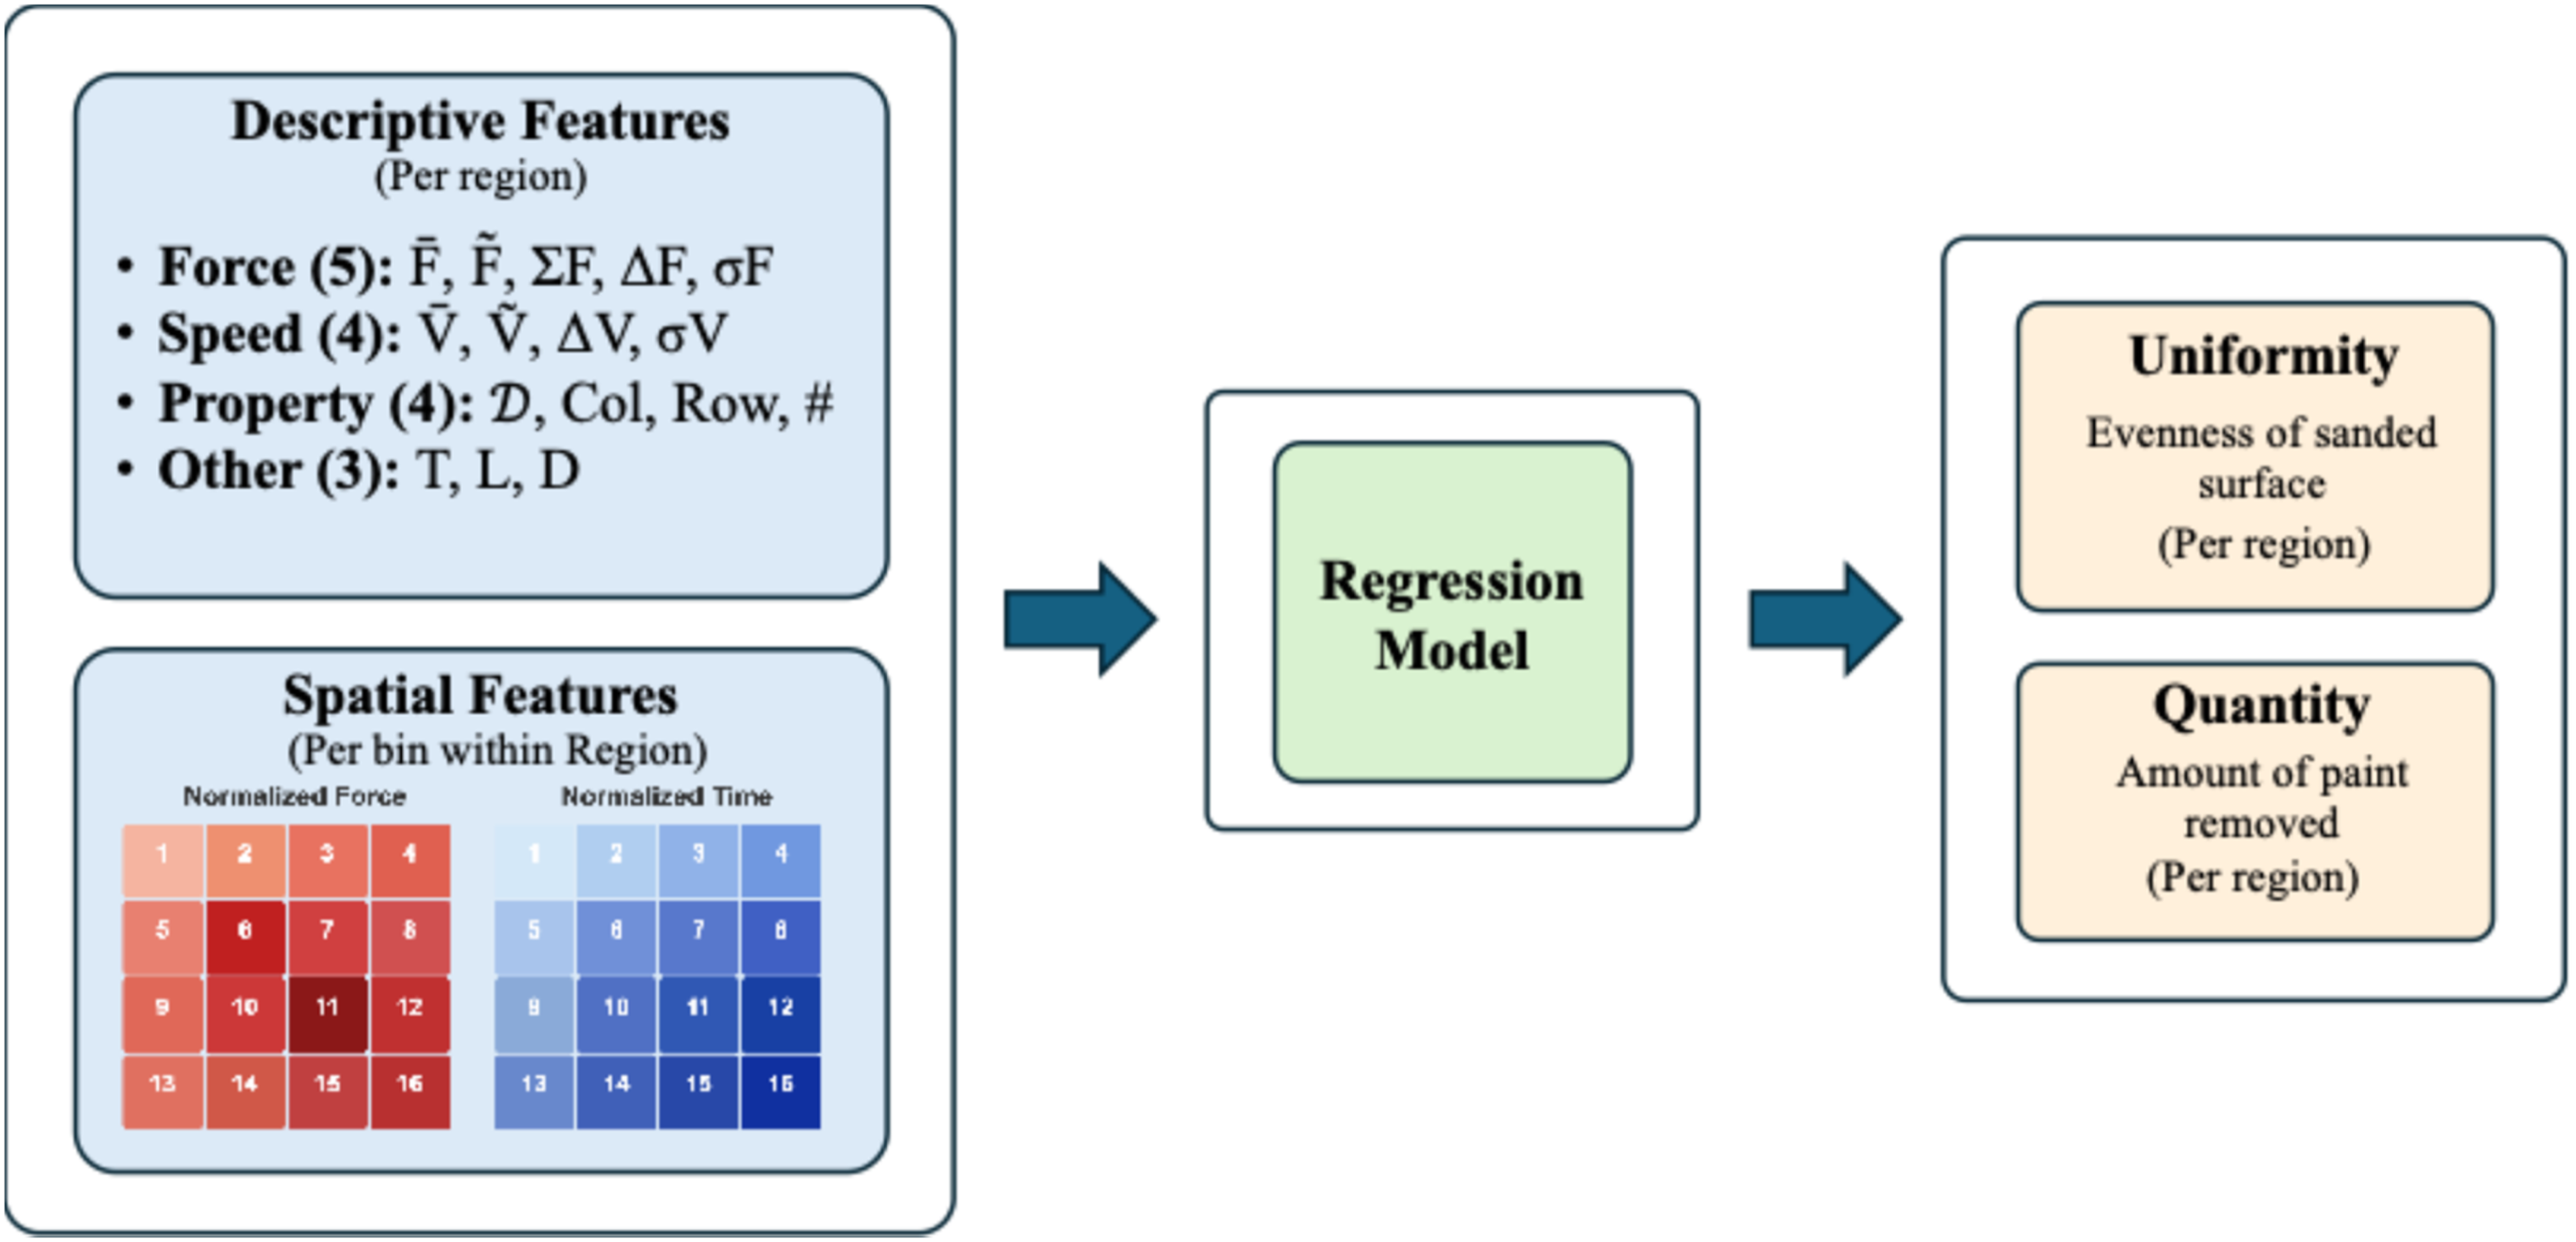
Using the dataset and performance metrics, we applied linear and non-linear machine learning algorithms to predict participant performance. For the linear model, we chose Lasso regression to interpret the influence of a feature by the value of the feature’s coefficients. The Lasso model input was normalized so that the scales of the coefficients were in the same range. For the non-linear model, we selected XGBoost (eXtreme Gradient Boosting), a decision tree-based algorithm that has been validated across benchmarks in many machine learning analyses (Shafiei et al., 2024; Yang et al., 2024). XGBoost is highly optimized for speed and memory and includes regularization techniques to generalize on a wide range of applications. Normalization was not applied to XGboost, as each node in this tree-based model splits the data without needing normalization.
Due to the limited sample size (160 observations), we performed leave-one-subject-out cross validation for a fair evaluation of machine learning algorithms. Specifically, the dataset was split into 20 folds, in which each fold we trained the model on 19 subjects out of 20 and left out one subject for testing. We chose the loss function MSE (Mean Squared Error) for training and RMSE (Rooted Mean Squared Error) for evaluation. We implemented a grid search for both the linear and non-linear models over the specified range of hyperparameters to identify the optimal model configuration, including the number of estimators, maximum tree depth, subsampling ratio, column sampling ratio, gamma, L1 regularization, and L2 regularization. The grid search employed a threefold cross-validation approach to ensure robust evaluation of each hyperparameter combination and to mitigate overfitting and derive the best configuration for the sanding performance prediction tasks.
ACGIH TLV for HAL Peak Force Index
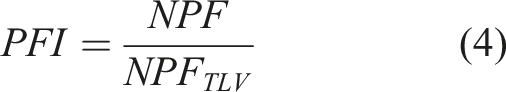
Exertion force was measured based on the load cell surface forces. Peak Force Index (PFI) is defined by the American Conference of Governmental Industrial Hygienists (ACGIH) Threshold Limit Value for Hand Activity Level (HAL) (ACGIH, 2025). The PFI is a ratio between the exerted normalized peak force (NPF) and the TLV predicted normalized peak force (NPFTLV). The NPF is the ratio between peak force in the region and the posture specific strength. In this task, the strength used was based on the participant’s gender and an average one-handed push force defined in Mital & Kumar (1998). The NPFTLV was calculated using the HAL, the frequency of exertions, and the duty cycle. Frequency (F) is the total number of exertions exceeding 10% of the NPF and duty cycle (D) is the ratio of the exertion time and total task time. The frequency and duty cycle were calculated from each participant’s data. The frequency was a count of the exertions that exceeded 10% of the NPF only considering the number of times the exertion exceeded 10% of the NPF. Duty cycle was the proportion of time a participant was performing an exertion above 10% of the NPF, with lower force and zero exertions treated as a pause. These calculations are described in equation (2) (Radwin et al., 2015) through 4 (ACGIH 2025).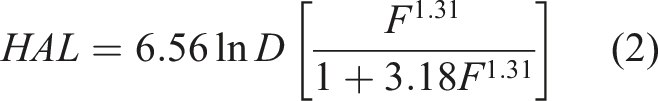

The purpose of the PFI analysis was to identify exertion strategies where participants performed well but maintained a PFI less than one. A PFI greater than one means the task exceeds the recommended safe exposure limit for the combined force and hand activity level. A PFI less than one means the task is below the recommended safe exposure limit. The PFI was calculated by participant and region. A linear mixed effects model with participant as a random intercept was used to test the relationship between PFI and uniformity and quantity performance. Then, the observations were filtered by high performers and grouped by above and below a PFI of one. There was a total of 65 cases for high performers for uniformity and 49 cases for quantity.
Results
Features Correlated to Sanding Uniformity
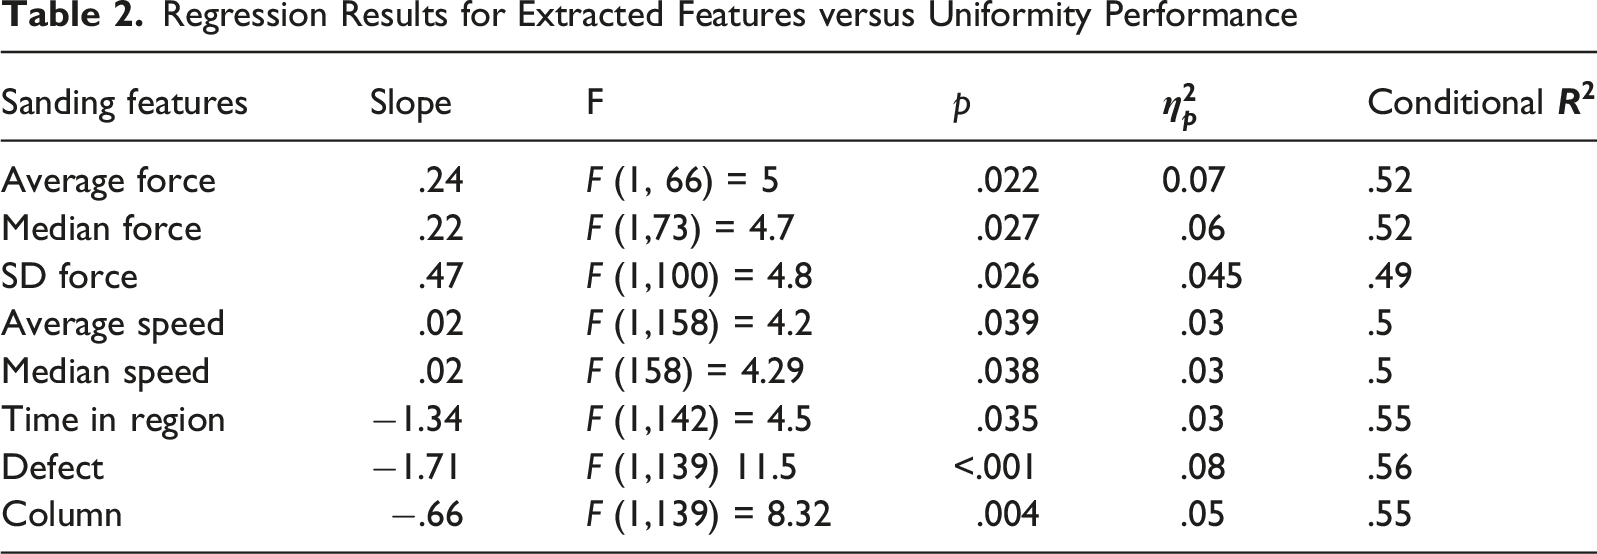
Regression Results for Extracted Features versus Uniformity Performance
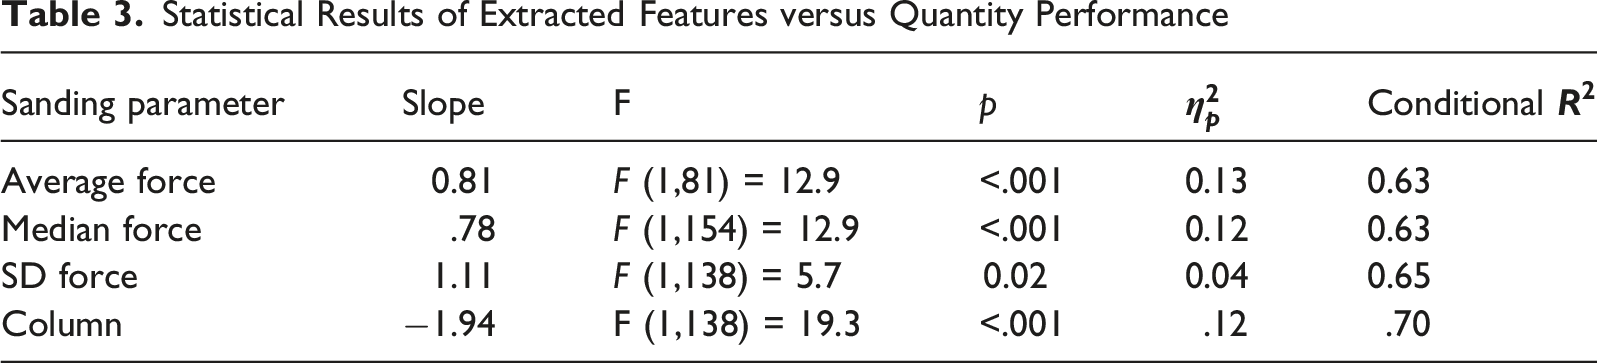
Features Correlated to Sanding Quantity
Statistical Results of Extracted Features versus Quantity Performance
Features Correlated to Subjective Discomfort
Average force affected subjective discomfort of the hand (F (1,18) = 4.21, p = .05,
Prediction Results With Linear and Non-Linear Machine Learning Algorithms
The linear model was trained to predict quantity and uniformity performance simultaneously. The performance of the best model from the grid search resulted in an average RMSE of 6.8% for subject predictions, as shown in Figure 4. The model used both output metrics quantity and uniformity in its prediction. Predicted performance versus ground truth for uniformity (blue) and quantity (red) for the linear model (left) and for the non-linear model (right)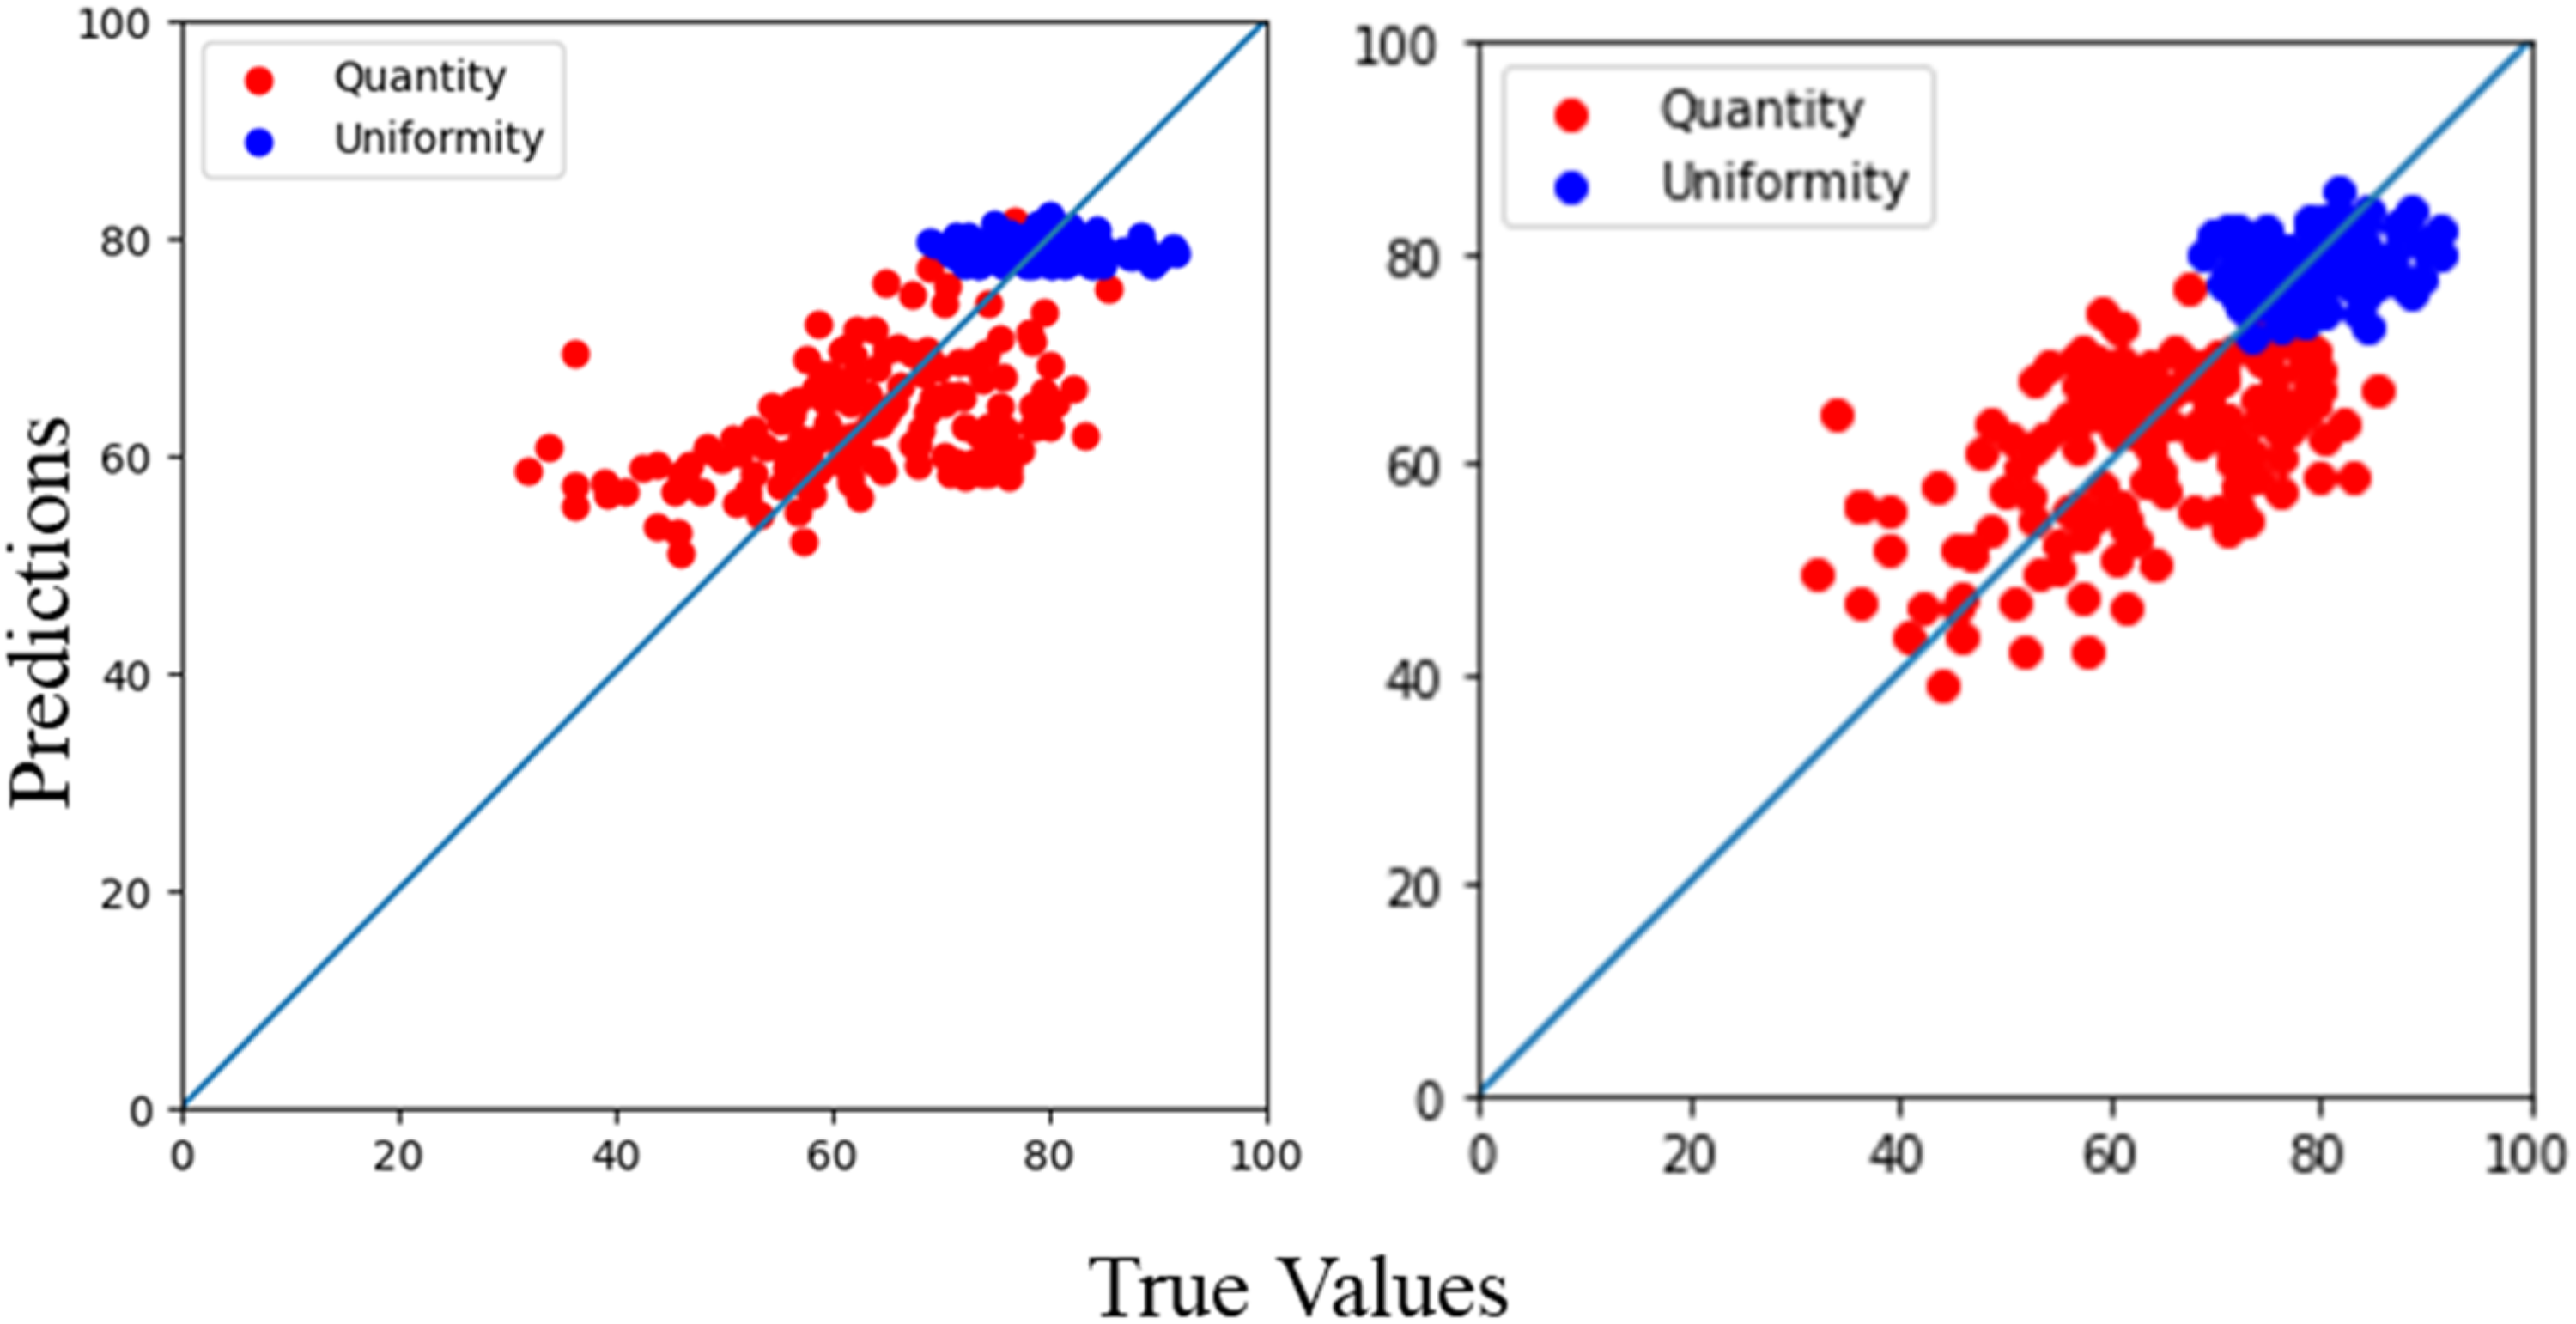
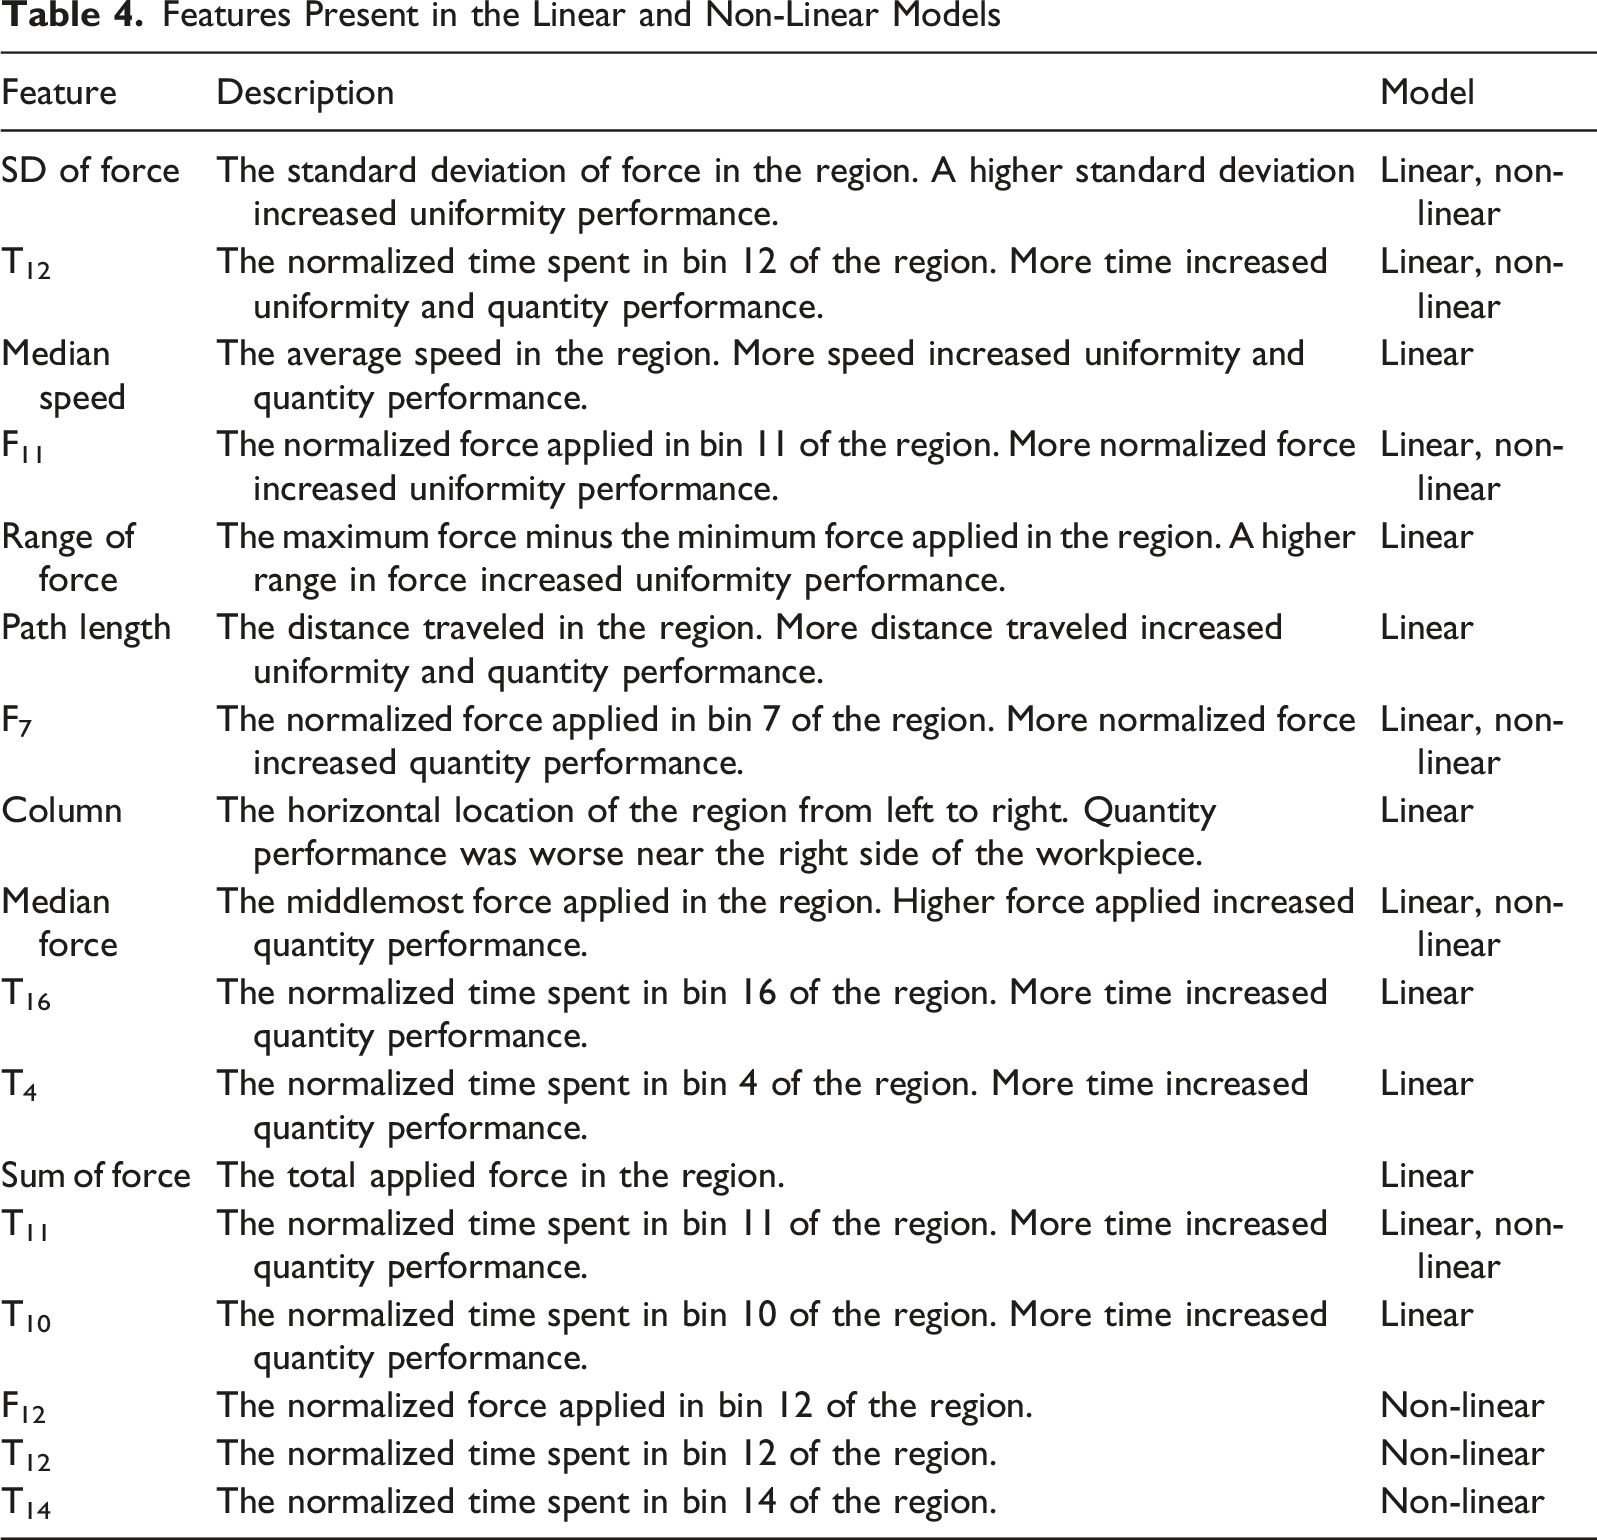
An average and standard error for the feature weights were calculated using the weights from the each of the 20 subject models. This procedure was done for both uniformity and quantity performance. Features included in the uniformity and quantity model are shown in Figure 5. Descriptions of the features are listed in Table 4. The average absolute value of feature weights in the Lasso model for quantity (left) and uniformity (right) performance. A higher average weight means the feature has higher importance for model prediction. Weights were averaged across folds during cross validation. All but two features had a positive relationship with quantity performance. The features with the negative relationship are marked with an asterisk (*). The error bars represent the standard deviation of weights Features Present in the Linear and Non-Linear Models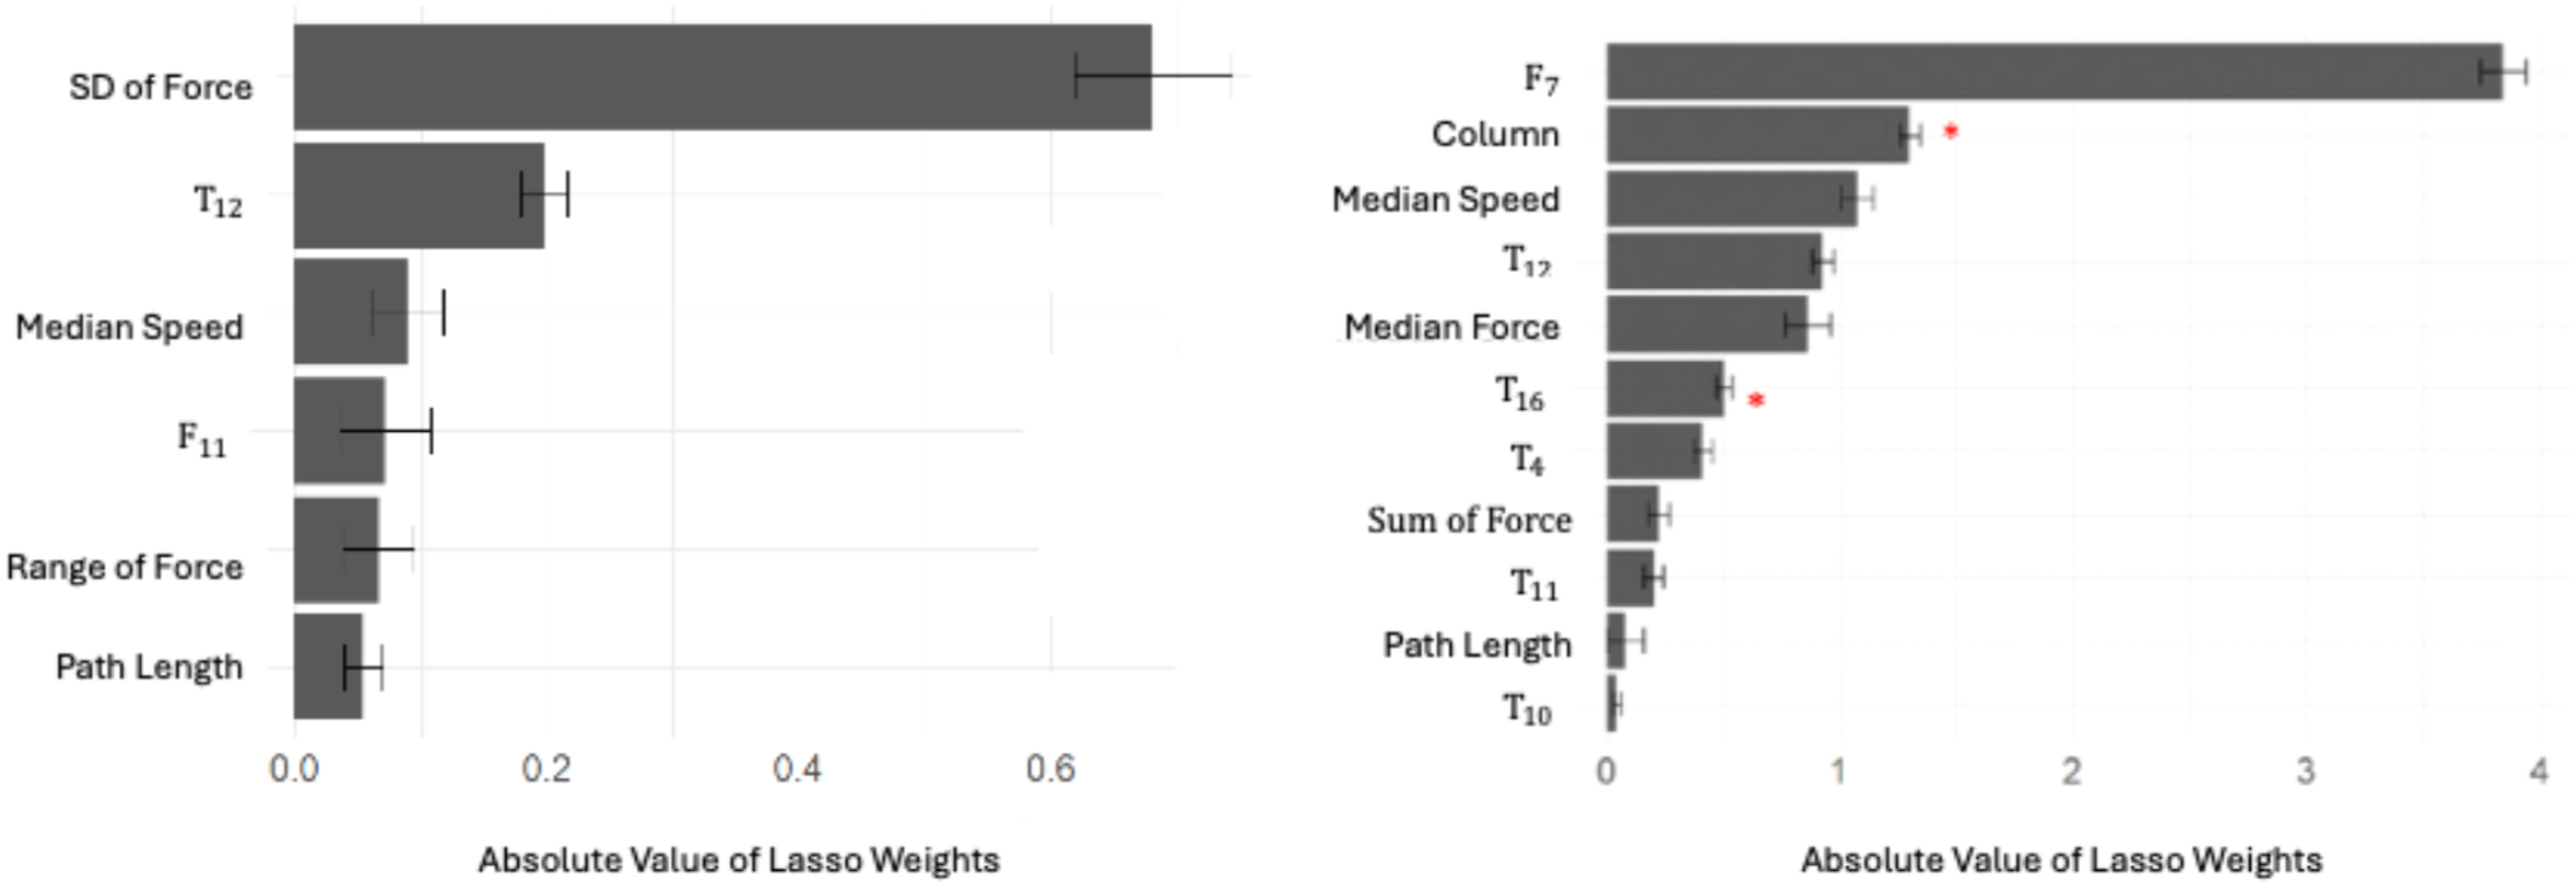
For the non-linear model, the performance of the best model from the grid search resulted in an average RMSE of 6.9%. The model used both output metrics quantity and uniformity in its prediction. The predicted performance values versus the measured (ground truth) values are shown in Figure 4. We plot the feature importance by the gain shown in Figure 6. Gain measures the average improvement in the loss reduction brought by a feature when it is used for splitting nodes in the decision trees, which reflects the contribution of a feature to the model’s predictive performance. The top features in the non-linear model included many of the spatial features (normalized force and time per bin) and median, SD, and sum of the force, which are described in Table 4. The average gain for the top 10 features in the tree-based model. A higher average gain means the feature has higher importance for model prediction. Gains were averaged across folds during cross validation. The error bars represent the standard deviation of the gains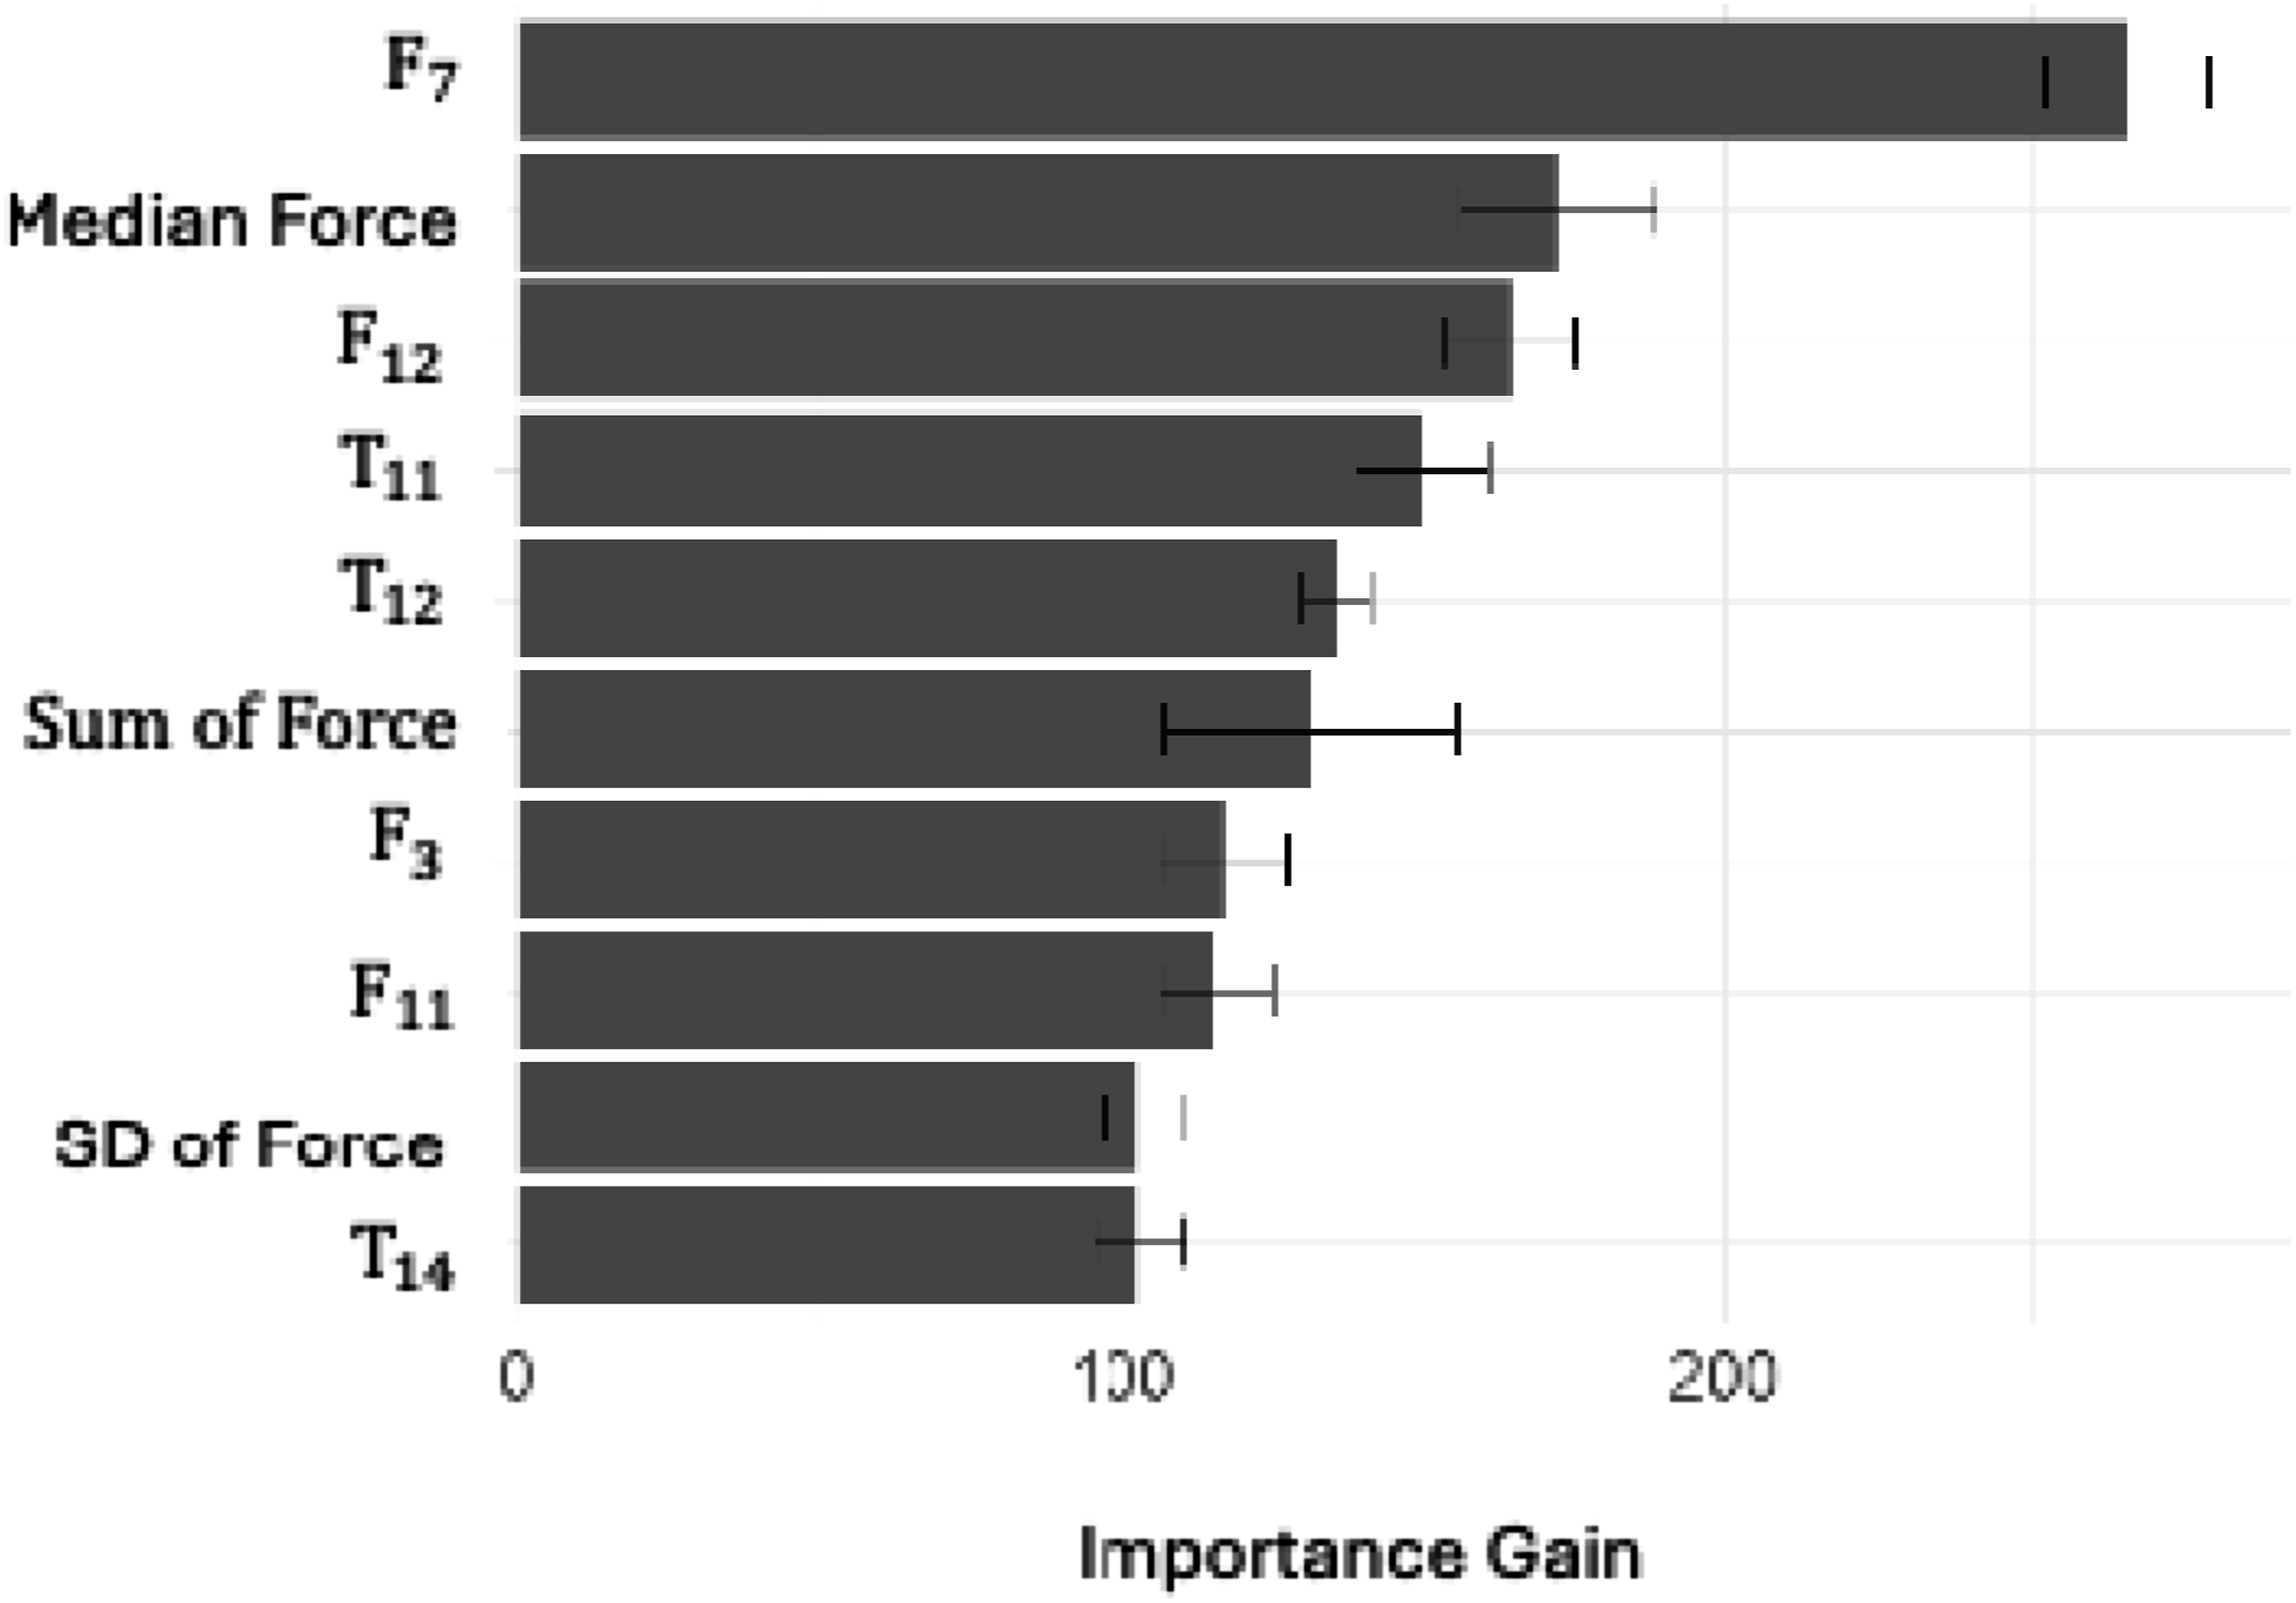
ACGIH TLV for HAL Peak Force Index (PFI)
The PFI had a significant positive relationship with both uniformity and quantity performance. As the PFI increased, uniformity increased, p = .037, F (1,159) = 2.63, p-eta = .035, as shown in Figure 7. Further, as the PFI increased, quantity increased, p = .008, F (1,140) = 7.0, p-eta = .05, as shown in Figure 7. The significant relationship between PFI and uniformity (left) and quantity (right) performance. As PFI increased, performance increased. The blue line is the linear regression model, and the shaded regions are the standard error of the model. The vertical line at PFI = 1, represents the threshold limit value (TLV)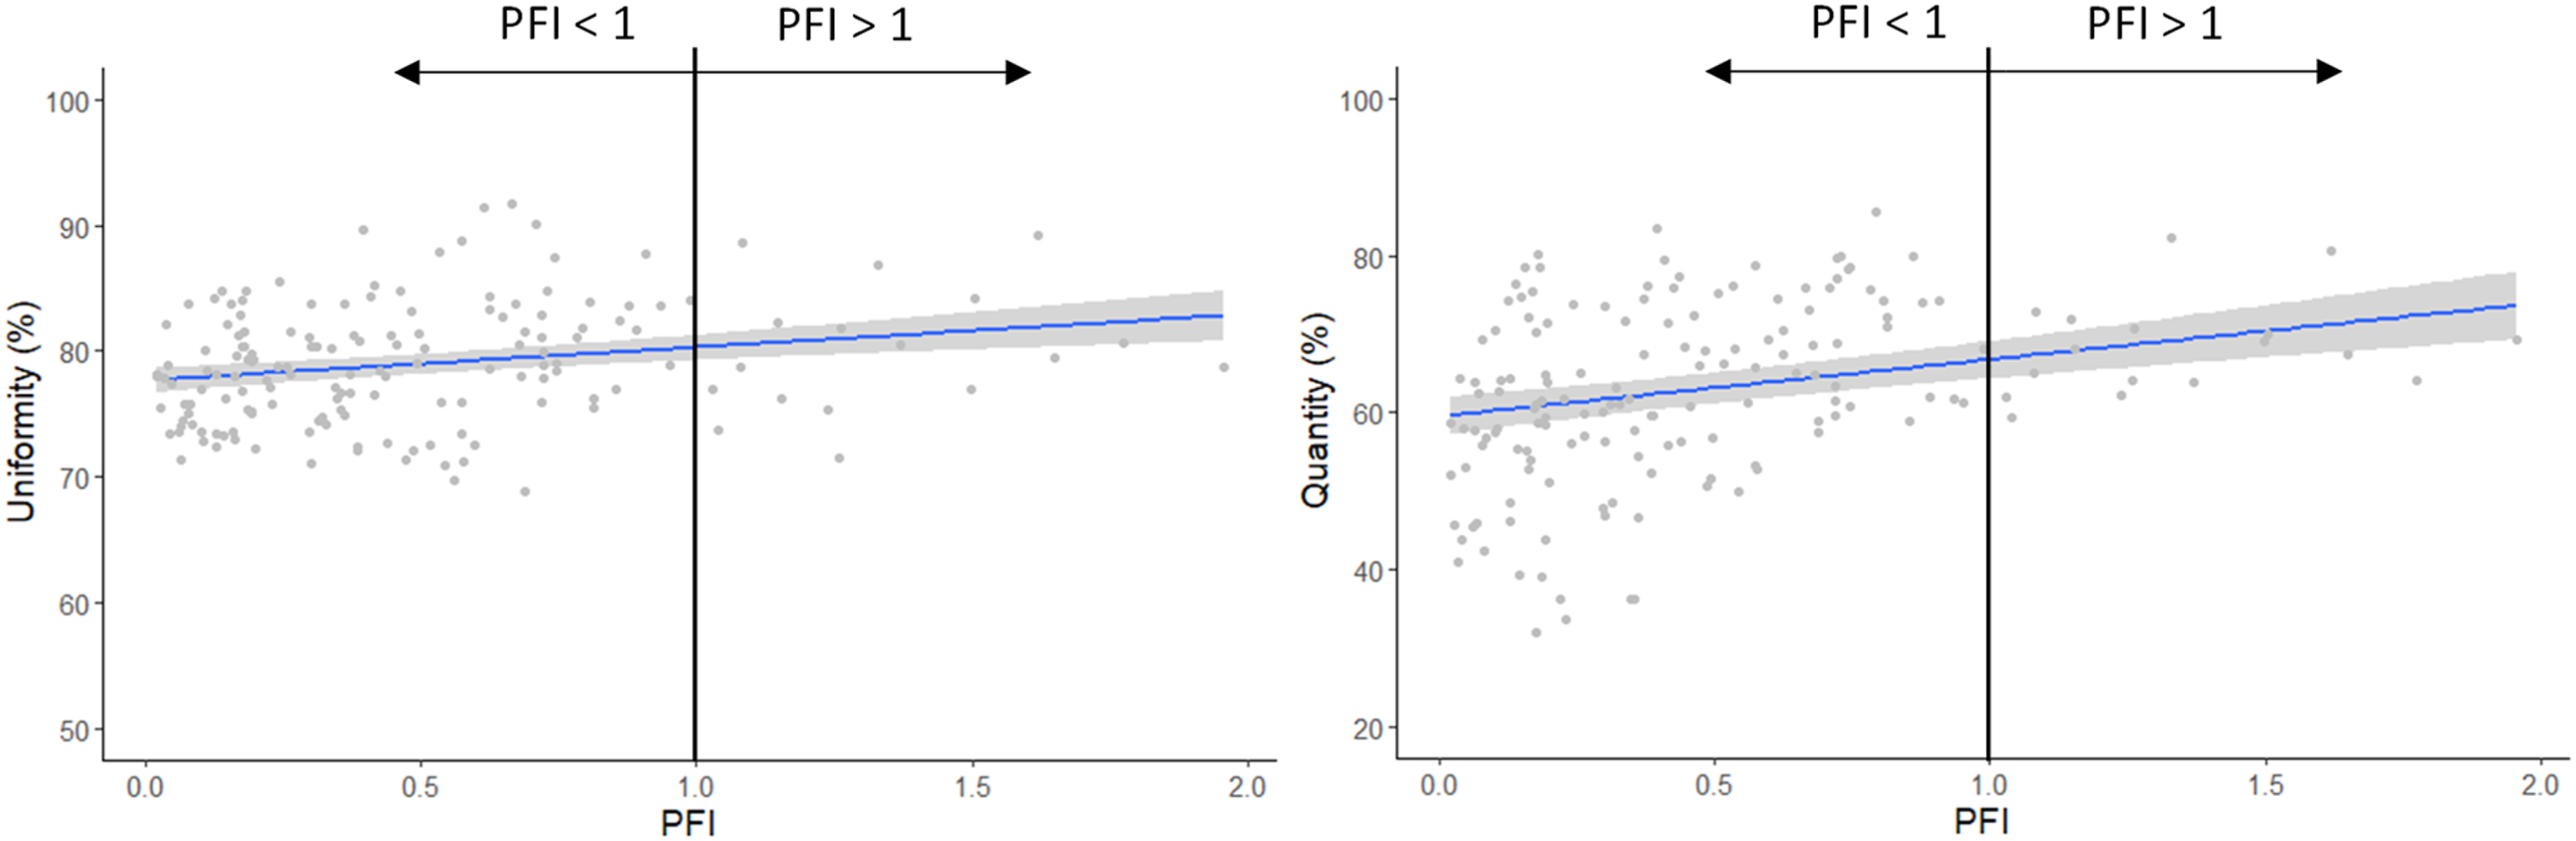
The differences between high performers under the TLV (PFI < 1) and over the TLV (PFI > 1) were analyzed to understand their differences in strategy. For both uniformity and quantity performance, the average peak force and average duty cycle were less in the group below the TLV. However, the frequency of exertions was greater for the group below the TLV, as shown in Figure 8. The bar plots represent average peak force, frequency, and duty cycle for high uniformity and quantity performers. Dark grey bars represent high performers who maintained a PFI less than one, and light grey bars represent high performers who maintained a PFI greater than one. The ideal performers are the dark grey bars because they achieved a high performance, while staying below the TLV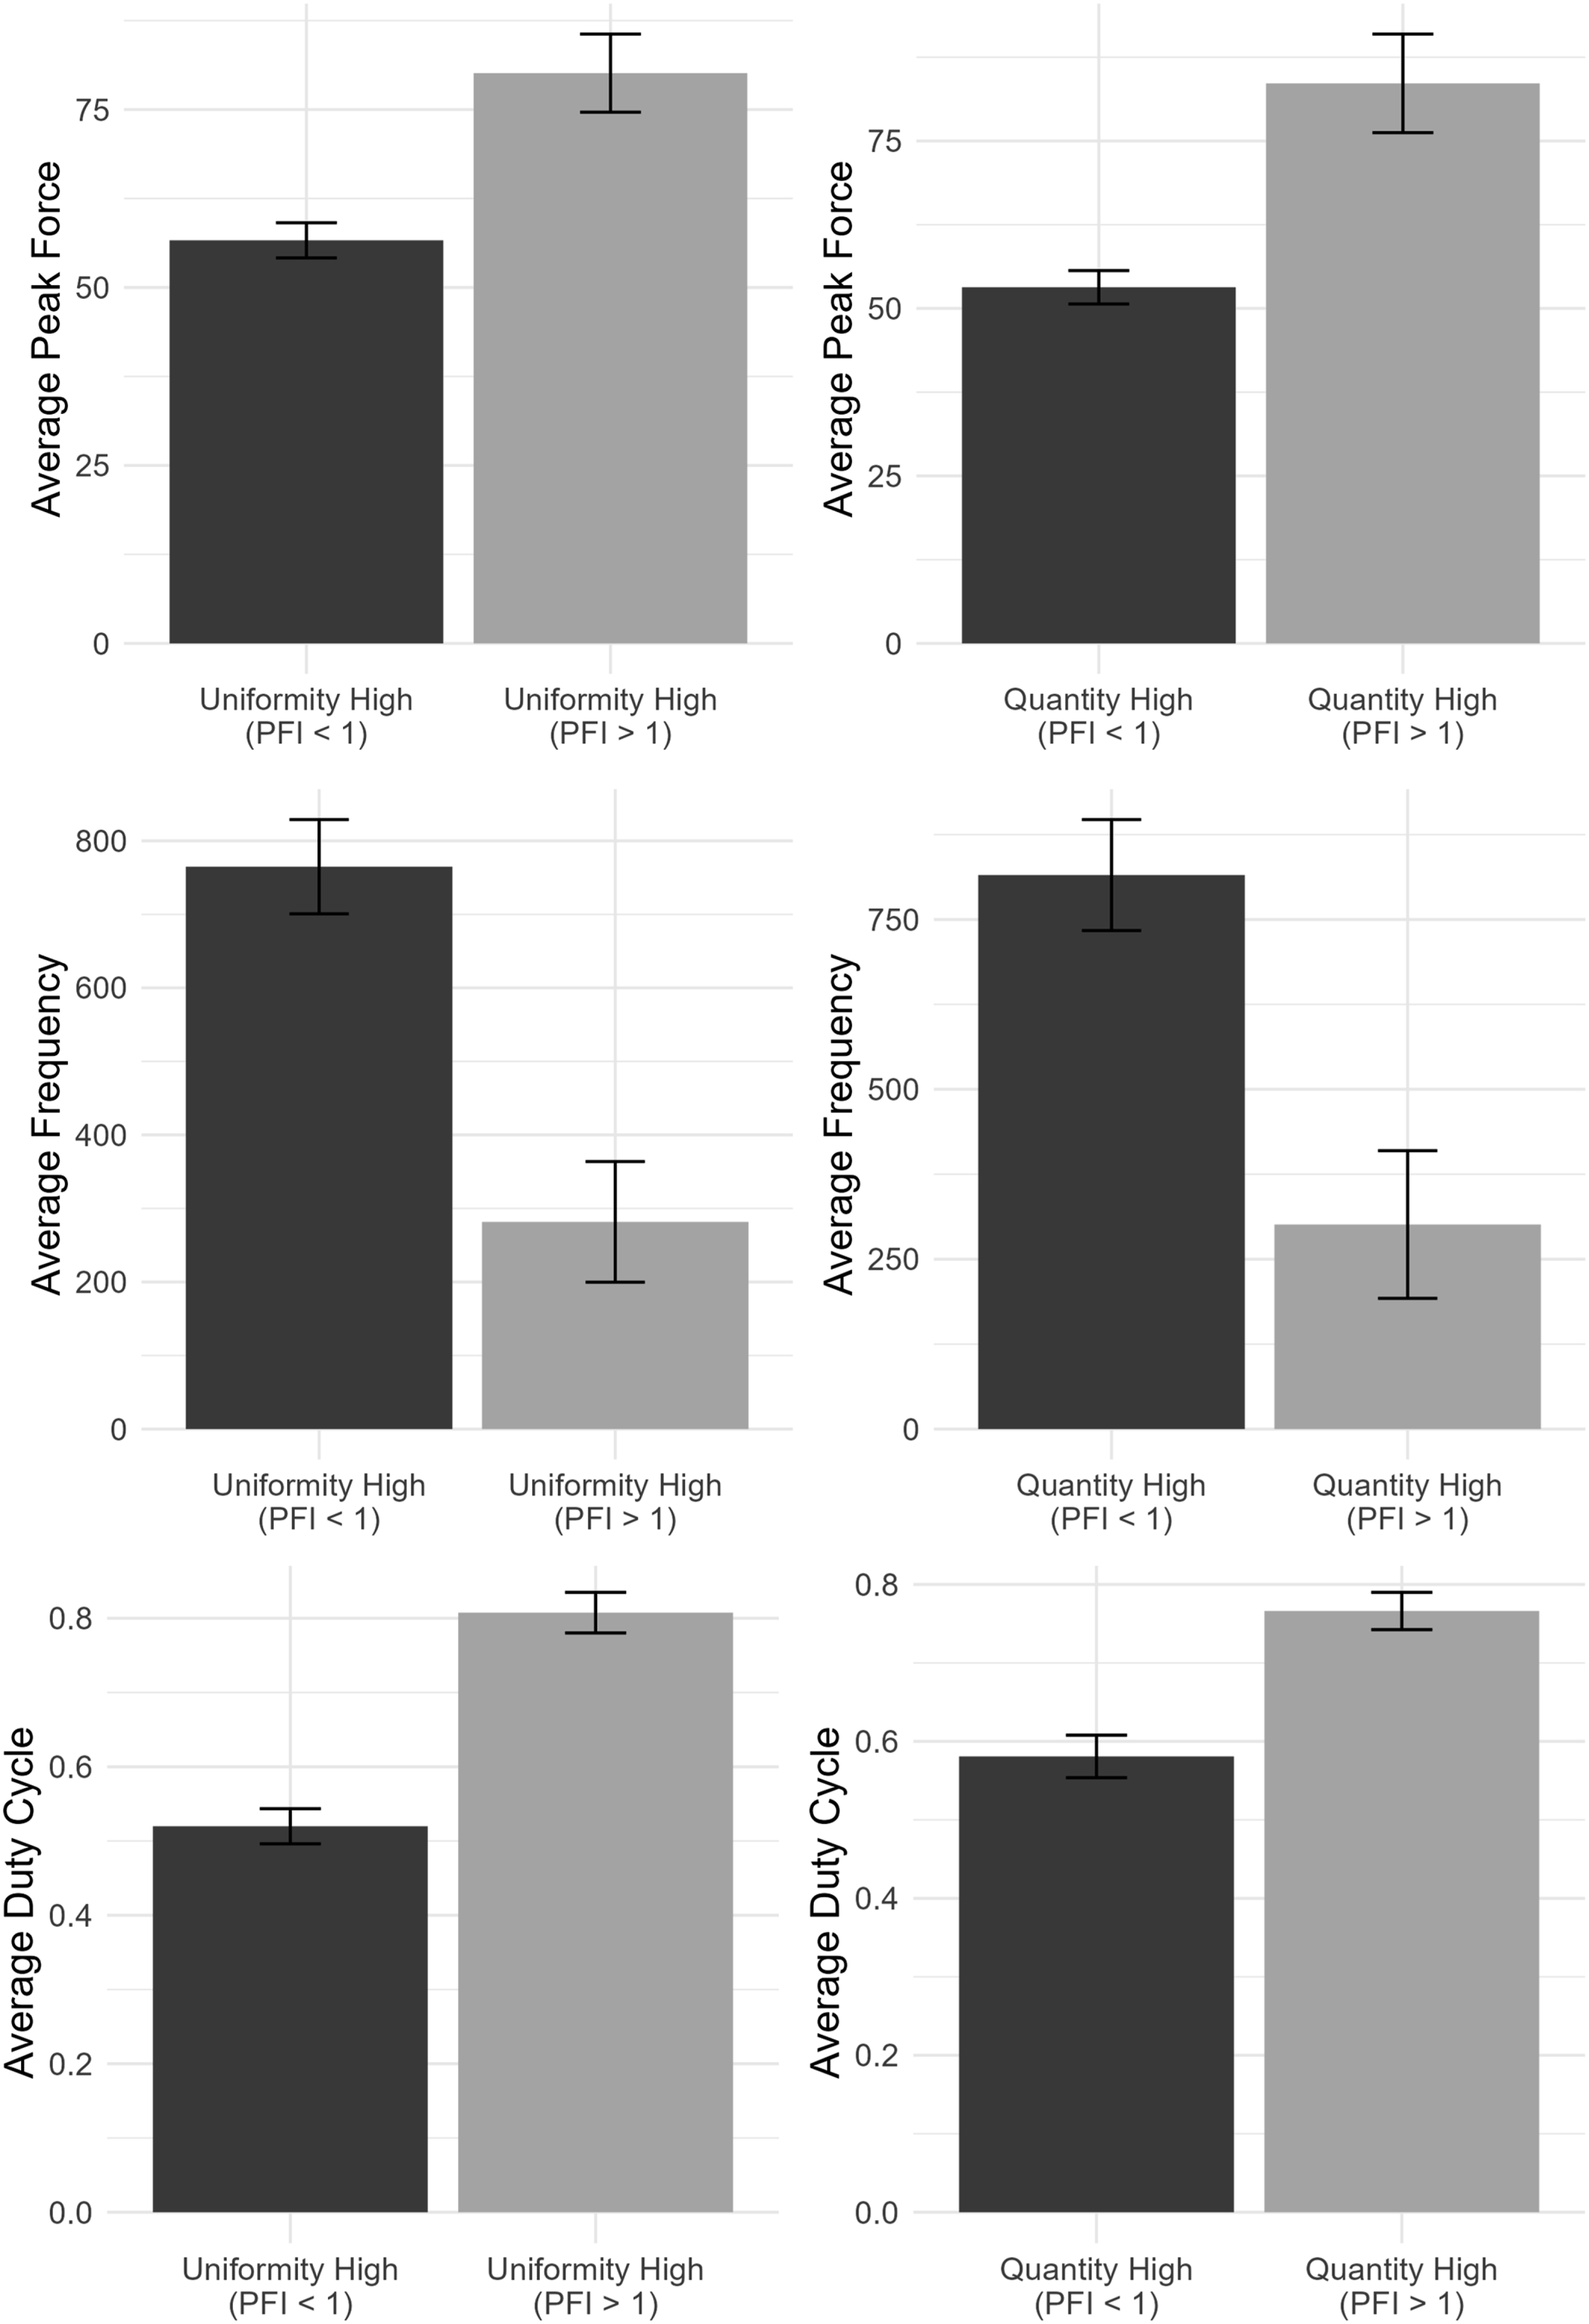
Discussion and Conclusions
Sanding involves the senses and manual dexterity to meet the task objectives. For example, sanding requires vision to understand what areas need more sanding, proprioception to judge how hard to press on a surface, sound to listen to the tool pitch, and sometimes smell to sense when the surface is over-sanded. Previous literature has consistently identified humans as more efficient (time, productivity, speed) and effective (quality, accuracy), performers in manual tasks compared to automated or semi-automated robotic systems (Chen et al., 2020; Hagenow et al., 2021a; Konstant et al., 2025). Humans are often the best performers because of their sensing and decision-making abilities (Johnson et al., 2019; Smith, 2001). In Konstant et al. (2025), participants performed better in the manual sanding task. Therefore, the present work aimed to capture parameters important to the manual sanding task, extract features related to their strategies and model the parameters. The results can lead us to understand how to make a surface finishing task more efficient and less stressful.
Single Predictor Linear Regression Analysis
Average force was not a significant predictor for subjective hand discomfort (p = .05). However, the link between average force and hand discomfort was the only relationship with an effect close to significance. Force and repetition are typically related to upper extremity disorders (Armstrong et al., 1987; Bernard, 1997). Typically, greater forces for longer durations cause greater physical stress. We did not find any other significant relationships, in the present work, between the sanding parameters and subjective discomfort; however, this could be due to a lack of data. We suspect there would also be a relationship between time and speed, but our limited sample did not show a relationship. We only collected subjective discomfort at the end of the trial, which meant we only had one discomfort data point per participant. Since the results indicated the right-side regions were not as uniform in sanding, this may be related to the majority of participants using the right-hand dominant side for sanding.
For performance uniformity, the analysis showed significant positive relationships between average and median force, average and median speed, and the SD of force. Force and speed could have improved performance because the high performers worked faster and pressed harder, to make the surface more uniform. Interestingly, a greater SD of force also improved sanding performance. A greater SD of force could indicate greater forces and variation of high and low forces, possibly providing more frequent recovery breaks from exertions. This also means that the higher performers moved the sander around more than the lower performers. Further, there was a significant negative relationship between time spent in the region, column number, and defect for uniformity performance. More time in a region could imply subjects removed more paint; however, if the paint was not removed enough from the surface, this could still produce a low uniformity score. Uniformity scores were high for completely unsanded painted regions and completely sanded regions. Moreover, defects of additional paint were placed on the surface in a randomized order. We suspect uniformity performance was worse with a defect because there was more paint to remove from these areas and it was more difficult to completely remove the paint. Column number, the horizontal location of the region, also decreased uniformity performance. Regions placed on the right side of the panel resulted in worse performance. An explanation for this relationship is participants spent more time on the left-side of the workpiece or worked from left to right, therefore spending less time on the right-side.
The average, median, and the standard deviation of force had significant positive relationships with quantity performance. This indicates that participants needed to press harder to achieve higher performance. In addition, column number had a negative relationship with quantity performance. Regions on the right had worse performance, which could be due to less time or effort spent on this area, like the finding for uniformity performance. Future work could analyze both time and average force specifically to the right side of the panel to further confirm this relationship.
Algorithm Fulfillment
Descriptive and spatial features were modeled in linear and non-linear algorithms. The spatial features represent allowed force and time measurements to be extracted at specific location in a region to understand how these measurements varied across the region. This section discusses the execution and features in these algorithms. In the linear model for uniformity performance, descriptive features include SD of force, median speed, range of force, and path length. Like the analysis with the single predictors, more force, speed, and a higher range of force increased sanding performance. Therefore, high performers moved faster and addressed more areas of the workpiece. The path length also supports this finding because a higher path length indicates participants addressed more areas of the workpiece. The spatial features important for uniformity performance included F11 and T12, which correspond to the right side of the region (see Figure 2 for bin location). These bins were associated with the right side of the workpiece.
In the linear model for quantity performance, descriptive features included the column number, median speed, median force, sum of the force, and path length. Compared to uniformity performance, the speed and force features were most important to the amount of paint removed. Higher performers applied more force and worked faster than lower performers. Additionally, higher performers spent more time traveling on the workpiece to maximize the amount of paint removed. Finally, the column was also an important feature, which indicates regions on the right were more difficult to sand or participants did not spend enough time in these areas. The spatial features important to quantity performance included bin
In the tree-based model, the descriptive features important to predicting sanding performance included median force, the sum of force, and the standard deviation of force. Like the linear model, more force, and a higher variation of low and high forces increased resulted in better performance. Additionally, the normalized time spatial features important to quantity performance included bins
Comparison of the Analyses
The single predictor linear regression, linear, and non-linear models extracted descriptive and spatial features related to the applied force, the variation of force, time, and speed. In general, higher performers applied more force at a faster rate to increase both uniformity and quantity performance. In addition, higher performances had higher variations of low and high forces, which could mean they addressed more areas of the surface. This claim is supported by significant features of path length, range of force, and speed, which also indicate high performers moved faster, to address more areas.
Spatial features of normalized time and force were also indicative of sanding performance. The features with the highest predictive power include spatial features of force and time on the center and right side of the region, indicating that force and time applied in the center of the region are good indicators of performance. Right-side spatial features were more important for the linear model predicting quantity performance, which is also supported by the significant descriptive feature, column, being present in the model. Regions on the right side of the workpiece resulted in worse performance, as indicated by the negative slope of the independent variable column in the single predictor linear model. This could mean these areas were difficult to sand or participants did not distribute their time evenly across the workpiece.
ACGIH TLV for HAL Peak Force Index (PFI)
The analysis uncovered significant positive relationships between PFI and performance, indicating higher performers worked harder than lower performers. Despite this relationship, there were some high performers who achieved a PFI less than the TLV, meaning they worked at an acceptable limit, which could reduce risks to their upper body injuries. The analysis indicated high performers below the TLV, used less force and duty cycle. However, these participants also had a higher frequency at which they were performing exertions. Consequently, to perform well in this sanding task, but to maintain an acceptable level, workers should pause more, limit their force, but perform exertions more frequently. Additionally, this finding indicates that force values can be valuable measurements to collect because they are a good indicator of performance but also influence risk. Force is a factor in fatigue, risk of injury, and physical stress (Garg et al., 2017; Harris-Adamson et al., 2015; Potvin, 2012).
The present work found that more force, greater variations of force, and speed were significantly related to sanding performance. Participants were able to move quickly and address many areas of the workpiece. High variations of force and speed can also increase the physical stress and strain in a manual task (Akkas et al., 2016; Garg et al., 2017; Harris-Adamson et al., 2015; Potvin, 2012; Rohmert, 1973). There was a significant relationship between the average applied force and hand discomfort. Due to a limited number of observations for discomfort, results show little to no relationships with force, speed, and discomfort. Konstant et al. (2025) measured significant fatigue and discomfort in a sanding task, which motivates the need for practitioners to implement solutions to reduce the physical stress and strain in sanding tasks (Kadir et al., 2019).
These strategies may help develop worker training instructions for maintaining the best performance while reducing physical stress. Similar to manufacturing, surgical research also examines and models human strategy in surgical tasks (Azari et al., 2019, 2020, D’Angelo et al., 2015; Miller et al., 2020; Watson, 2014). The surgical research aims to quantify and model surgeon performance based on various parameters that are important to surgery performance, including idle and working time, hand kinematics, and applied pressure (Azari et al., 2019, 2020, 2021). These models aim to classify the surgeon as expert or novice based on the extracted features. This is relevant to sanding and manual tasks because expert sanders often train new workers. Their skills are difficult to translate, and workers only become experts with more experience and trial and error. However, if we can understand the important features, we could create better training protocols for manual sanding.
Further, the present work offers an alternative objective measure of performance. The uniformity and quantity measures were specific to the task, but we could extract strategies related to both metrics. In training, feedback could be given to apply different strategies specific to the type of performance. Additionally, a machine learning model could use expert data to understand the features necessary in a sanding task with different materials or defects. The training for the novice could include information on where more or less sanding or force is needed.
Limitations and Future Work
There were several limitations of the present work. A small number of participants in the study led to a small sample size in the prediction models. We may have discovered a stronger correlation between discomfort and the sanding parameters if we had more subjective discomfort ratings. Although the paint removal task was relatively simple, it was a laboratory simulation. While participants were trained, they were not professional sanders, and the task was not in a field setting that captured the complexity and variation found in sanding work. Although the ten-minute sanding task was fatiguing, performance for a full day of work were not observed. Despite these limitations, this study observed significant relationships between tradeoffs between sanding performance and safety. Furthermore, this study showed that by using certain strategies, high performance can be achieved with reduced physical stress.
Future studies should collect more physical stress observations to understand the relationship between the extracted features and physical stress. Training protocols could be developed to achieve satisfactory performance but reduce overall discomfort. Further, a small number of parameters were explored in this exploration. We focused on the parameters that would affect the sanding performance the most based on previous literature (Hagenow et al., 2021b; Ng et al., 2017). Other limitations include the simplicity and specificity of the task. The present study was a laboratory task that used a mock sanding test to study manual sanding. Therefore, the results of this analysis may be specific to the type of sanding and setup. Sanding in realistic environments involves more factors, such as intricate defects, different workstation setups, curvature in the surface, and different materials. However, similar procedures could be taken to study the important parameters of different types of sanding. Future studies could also isolate the sanding parameters, such as force and speed and understand how each parameter effects performance. Additionally, performance could be studied by experience level (e.g., novice and expert) and measure each worker’s performance.
Key Points
• Force and tool kinematics were measured using an instrumented platform and motion capture for 20 participants while performing a timed paint removal sanding task in the laboratory • Image processing measured the quantity and uniformity of the paint removed to evaluate performance • High performers moved the sander more, while they varied but applied greater force compared to the low performers. • Some high performers could maintain a TLV below the acceptable limit by pausing more and applying less force but performing more frequent exertions.
Footnotes
Authors’ Note
This article was edited under the auspices of Dr Patricia DeLucia.
Funding
The authors disclosed receipt of the following financial support for the research, authorship, and/or publication of this article: This work was supported by a NASA University Leadership Initiative (ULI) grant awarded to UW-Madison and The Boeing Company (Cooperative Agreement # 80NSSC19M0124).
Declaration of Conflicting Interests
The authors declared no potential conflicts of interest with respect to the research, authorship, and/or publication of this article.