






Abstract
Rural development is widely acclaimed as a tool for economic development of any region by the policy makers. Being a multi-level and multi-faceted process, the actual status of rural development is insuperable to assess through the individual scrutiny of either one or a few development indicators. Therefore, the present study endeavours to reckon district level rural development and its disparities in Punjab through the formulation of a composite rural development index (RDI) encompassing four dimensions, namely rural economy, rural social transformation, rural health and education and rural infrastructure at five points in time, that is, 1981, 1991, 2001, 2011 and 2018 based on 29 development indicators. The findings of the study revealed a lopsided picture of rural development with a concentration of frontrunner districts mainly in the Doaba belt, while mediocre and laggard categories are dominated by the districts of the Malwa belt. Further, reduction in the level of inter-district disparities in rural development has also been observed over the study period. It is suggested that mediocre as well as laggard districts should be prioritised in resource allocation to curtail the extent of rural development disparities in the state.
Keywords
Introduction
Rural development connotes ubiquitous development of rural areas with a view to ameliorate the quality of life of rural people (Singh, 2009). It is widely acclaimed as a tool for economic development by the policy makers in developing countries like India where a sizeable proportion of the population lives in rural regions (Government of India, 2011). Overarching objectives of inclusive development, eradication of poverty, enhancement in the nutritional standards and health status of the people, reduction in the incidence of illiteracy and amelioration of the quality of life can be accomplished through the multi-functional strategy of rural development (Mujumdar, 2002). However, with no comprehensive and universally acceptable definition of rural development, it is difficult to assess it in an effective manner. Many divergent theoretical perspectives regarding the concept of rural development can be traced in the existing literature. World Bank (1975) envisaged rural development as a strategy devised to enhance the socio-economic life of rural poor, involving the extension of development benefits to the poor people such as small-scale farmers, tenants and the landless who are seeking livelihood in rural regions. Rao (1983) viewed rural development as an economic process of interaction between two unequal entities—on the one hand, a large number of relatively small and dispersed villages and, on the other, the larger economy which is the dominant entity setting the direction and pace of the process. Kim and Yang (2016) elucidated rural development as the process of improving the quality of life of people living in rural areas and achieving sustainable development through addressing challenges being faced by the local communities in the domains of economy, education, health and environment, etc.
Rural development assumes greater significance in a predominantly agrarian economy of Punjab where 62.52% of total population resides in rural areas (Government of India, 2011) and more than one third of its workforce is engaged in the agriculture sector (Singh et al., 2021). For a long period of time, agricultural development and rural development have been interchangeably used for each other. It is imperative to point out that the emphasis of agricultural development is on capital development, whereas rural development focuses on human capital development (Lacroix, 1985). However, agricultural development has been considered as one of the means of economic revitalisation for active farmers and targeted rural dwellers (Diao et al., 2010). Moreover, concept of rural development is significantly associated with the choice of institutions (Kelsey, 1998) because the majority of rural development issues such as rural competitiveness, rationalisation of agrarian structure, investment in infrastructure, education and health, provision of safety nets for vulnerable groups and decentralised local governance are institutional in nature (Dhesi & Singh, 2008). In this regard, the state governments can play a key role in accelerating rural development. Over the years, the Government of Punjab has diverted large amount of financial resources to the rural development programmes covering education facilities, health services, rural sanitation, irrigation facilities, public works, promotion and strengthening of mahila mandals and grants to panchayats and local bodies for developmental works. In recent years, the expenditure by Punjab government on rural development programmes escalated from ₹150.83 million in 1980–1981 to ₹1,137.03 million in 2000–2001, which further increased to ₹13,855.31 million in 2019–2020 (Government of Punjab, various years). Moreover, in 2019, to improve rural infrastructure and provide essential amenities regarding health, education and environment in rural areas, the Punjab Cabinet allocated ₹3,840 million to the ‘Smart Village Campaign’.
The earlier discussion seems to present a significant endeavour to promote rural development on the part of the state government but without precise quantification of rural development across districts, any decisive comment on the issue may stand far removed from the actual state of affairs. However, on an aggregate level, Punjab has been considered as one of the advanced states in terms of development of rural areas in India (Ohlan, 2016; Shaban & Bhole, 2000). An in-depth scrutiny of the district level development scenario may present the striking ground reality of rural development variations in the state. During the post-independence era, the agriculture sector acted as a pivotal catalyst to spur the development in the state which was an outcome of the state government’s financial outlay directed towards the revival of rural economy (Dhesi, 2008). Further, the green revolution in the 1960s gave the much needed momentum to the growth of the agricultural sector in the state. However, since the early 1990s, the state economy is engulfed in a grave agrarian crisis as the yield of vital agricultural crops stagnated accompanied by rising marginal costs of additional production (Ghuman, 2008). Moreover, against the backdrop of a severe agrarian crisis and rural distress, there is an increasing tendency among Punjabi youth to leave for greener pastures abroad for better life opportunities. Farmers believe that the younger generation is no longer interested in agriculture and this disinterest prevails across the caste and class spectrum (Jodhka, 2012). All this really induced us to quantify the extent of rural development in the state. Therefore, the main aim of the present study is to reckon the district level rural development and its disparities in Punjab.
The article is organised into five broad sections. The first section is devoted to introduction, while review of literature is provided in the second section. The third section outlines the database and methodology, whereas the fourth section elaborates results and discussion. Finally, conclusion is presented in the fifth section.
Review of Literature
The analysis of rural development has garnered wide academic attention over the years. Different scholars measured rural development by associating it with diverse indicators such as rural electrification, irrigation facilities, cropping intensity, rural poverty, co-operative banking, transportation and communication, education facilities, health services, supply of drinking water and provision of infrastructure, etc. (Ghanghas, 1984; Ghosh, 2017; Goyal, 1990; Rao, 1983; Singh, 2001; Vanitha & Vezhaventhan, 2018). However, the assessment of regional disparities in terms of rural development received little consideration in the academic literature. A few studies can be quoted as: Shaban and Bhole (2000) evaluated the inter-state variations in rural development in India and found the existence of high level of inter-state disparities. Ohlan (2016) examined the disparities in the level of rural development across various states in India and observed that Punjab, Haryana and Kerala are the most advanced states in terms of development of rural areas, while rural backwardness is concentrated in the states, such as Odisha, Jharkhand, Madhya Pradesh and Bihar. However, inter-state differences in the level of rural development are narrowing down over time. Reddy et al. (2014) assessed the level of regional disparities in rural and agricultural development in Andhra Pradesh. It was found that Telangana is the most developed region, while Rayalaseema witnessed low level of rural development. Ghanghas (1984) examined the inter-sectoral and intra-sectoral disparities in rural development in Haryana. The study revealed that the agrarian economy of the state is marked by great disparities among large and medium farmers, small and marginal farmers and agricultural labourers, etc., mainly due to unequal distribution of land and high rates of poverty across all regions of the state. The study confirmed that inter- as well intra-sectoral disparities have increased in rural Haryana over the course of time.
Growing regional variations are a worldwide phenomenon but these disparities are more severe and evident in developing economies like India (Kumar & Rani, 2019). The free mobility of skilled labour and capital from peripheral regions to core regions has increased primarily due to the higher earnings, while the unskilled, illiterate workers and women are trapped in the less productive and less capital-intensive rural and agricultural sectors in the periphery regions (Reddy et al., 2014). However, rural regions do not represent the periphery regions. But they usually manifest the features of periphery regions such as low population density, fewer regional growth centres, smaller concentration of industrial activities and poor quality of infrastructure and so on. The progress achieved so far in terms of rural development in India is far from satisfactory and the task of uniform rural development is becoming difficult mainly due to paucity of financial resources, slow growing economy and politics of under-development (Singh, 2001). Ghosh (2017) investigated the relationship between rural infrastructure and rural development. It has been revealed that better physical and social infrastructure in rural areas positively affects rural development through improvement in rural literacy and life expectancy, reduction in rural poverty and increase in agricultural productivity and output. Provision of infrastructure facilities accompanied by institutional and organisational changes is imperative to promote the uniform spread of rural development (Rao, 1983). In addition to this, small-farm management focused on improving the productivity, profitability and sustainability in farming is critical to foster sustainable rural development (Francis, 2015). Vanitha and Vezhaventhan (2018) evaluated the development of rural areas in Tamil Nadu. The study detected that illiteracy, unemployment and infrastructural deficiency in schools and hospitals, etc., are the problems preventing the development of rural areas.
Further, a good deal of scholarly attention has been given to the evaluation of regional disparities in terms of economic development (Kaur & Dhillon, 2015), human development (Ghosh, 2006; Nayak & Ray, 2010), social development (Kumar & Rani, 2019) and infrastructure development (Ghosh & De, 1998; Kumar & Singh, 2020); still there is a dearth of studies related to the analysis of regional disparities in rural development. Ghosh and De (1998) explored the inter-state disparities in infrastructure endowments in India. They observed that inter-state variations in terms of physical, social and financial infrastructure are very high. Ghosh (2006) evaluated the regional disparity in human development across 15 major states of India between 1981 and 2001. He detected that regional inequality in human development has decreased over time. Nayak and Ray (2010) examined the magnitude of inter-district disparities in human development indicators in Meghalaya. They found widespread inter-district variations in human development. Kaur and Dhillon (2015) analysed the inter-state disparities in economic development in India between 1981 and 2011. The findings of the study revealed that poor states have failed to catch up with richer states on per capita income front. Kumar and Rani (2019) investigated the regional disparities in social development across various states and union territories of India. The study confirmed the presence of widespread regional disparities in social development in India. Kumar and Singh (2020) assessed the inter-district disparities in health infrastructure in Punjab between 1994 and 2018. The study identified the presence of huge inter-district disparities in health infrastructure in the state.
The studies mentioned earlier, however, were focused on exploring regional disparities across districts as well as states, but not even a single study assessing district level rural development and its disparities in Punjab could be detected in the existing set of literature. Further, it is evident from the above discussion that various researchers examining the issue of rural development considered either a single indicator or set of a few only. The quantification of rural development involving a broader set of indicative variables has received scant scholarly attention till date. Therefore, the present study has tried to reckon the extent of rural development and its inter-district disparities in Punjab through construction of a district level composite rural development index (RDI hereafter) using a set of 29 development indicators related to economy, social transformation, health and education and infrastructure dimensions of rural development.
Data and Methodology
Data
Rural development is a multi-dimensional process and cannot be measured by examining any single indicator on an individual basis. However, a composite index allows the data aggregation of various indicators into a numeric figure with minimal loss of information (OECD, 2008). Therefore, to assess the extent of district level rural development and its disparities, the RDI composed of four dimensions has been constructed, that too at five points of time, that is, 1981, 1991, 2001, 2011 and 2018 so that a comprehensive picture can be obtained. The data used for the study period are collected from the various issues of Statistical Abstract of Punjab. The structure of the RDI enveloping four sub-indices, namely rural economy index (REI hereafter), rural social transformation index (RSTI hereafter), rural health and education index (RHEI hereafter) and rural infrastructure index (RII hereafter) along with constituent indicators is presented in Table 1.
Structure of Rural Development Index.
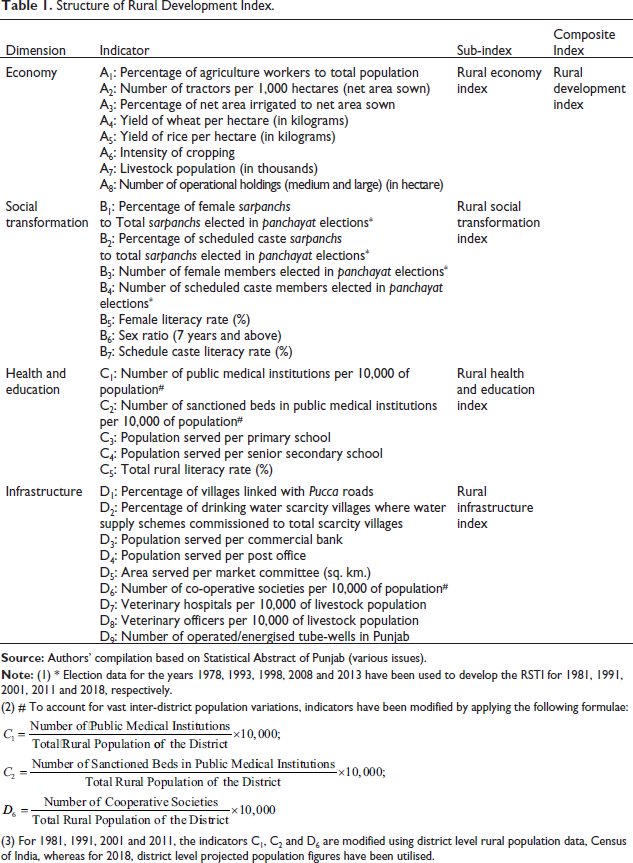
Structure of Rural Development Index.
(2) # To account for vast inter-district population variations, indicators have been modified by applying the following formulae:
(3) For 1981, 1991, 2001 and 2011, the indicators C1, C2 and D6 are modified using district level rural population data, Census of India, whereas for 2018, district level projected population figures have been utilised.
Methodology
In order to compute the RDI and its sub-indices, namely REI, RSTI, RHEI and RII, three steps, that is, normalisation of indicators, weight assignment and data aggregation have been adopted. In order to develop the sub-indices, the indicators have been normalised using min-max normalisation method. For construction of the RDI, the resulting sub-indices are again normalised applying the same procedure. The indicators positively associated with the level of rural development are normalised using Equation (1) (OECD, 2008), while negatively associated indicators are normalised employing Equation (2) (Svirydzenka, 2016):
Where,
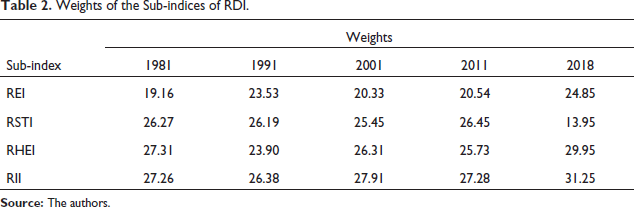
Further, principal component analysis (PCA) has been applied to determine the weights assigned to different indicators while formulating the sub-indices. Then, to construct the RDI, the normalised values of these sub-indices are considered as a new set of indicators to compute the weights by employing PCA. The rationale behind employing PCA is that it facilitates the aggregate representation of various individual indicators into a composite index with minimal loss of information and assigns objective weights to the indicators under consideration. The weights assigned to the sub-indices of RDI are reported in Table 2. To elicit the weights, Equation (3) (Kaur & Dhillon, 2015; Kumar & Singh, 2020) has been applied:
where,
Weights of the Sub-indices of RDI.
Then, weighted mean approach (Dhillon & Singh, 2012; Kumar & Singh, 2020) as given by Equation (4) has been applied to construct various indices:
where
To assess the extent of inter-district disparities in rural development, coefficient of variation (CV) has been computed as per Equation (5) (Nayak & Ray, 2010; Ohlan, 2016):
where,
Further, the relative position of districts in terms of rural development has been ascertained by assigning ranks to the districts. Higher index value indicates high level of rural development, and vice-versa. Therefore, the district securing highest index value has been accredited with first rank (i.e. best performer) and the district scoring lowest index value has been assigned the lowest rank (i.e. worst performer). Moreover, district taxonomy (Narain et al., 2007) based upon the level of economy (REI), social transformation (RSTI), health and education (RHEI), infrastructure (RII) and overall rural development (RDI) has been prepared as:
The present study has some limitations too: (a) While constructing the RII, indicator D1 for the year 1981, indicator B7 for the year 2001 and indicators B5, B6, B7 and C5 for the year 2018, could not be incorporated due to non-availability of district level data (for indicator description refer Table 1), (b) Mansa and Fatehgarh Sahib for the year 1991 and Pathankot and Fazilka for the year 2018 could not be considered for the analysis due to non-availability of data pertaining to key indicators and (c) further, due to non-availability of some data for indicator A7, available data for the years 1977, 1990, 1997, 2007 and 2012 have been used for the years 1981, 1991, 2001, 2011 and 2018, respectively to construct the REI.
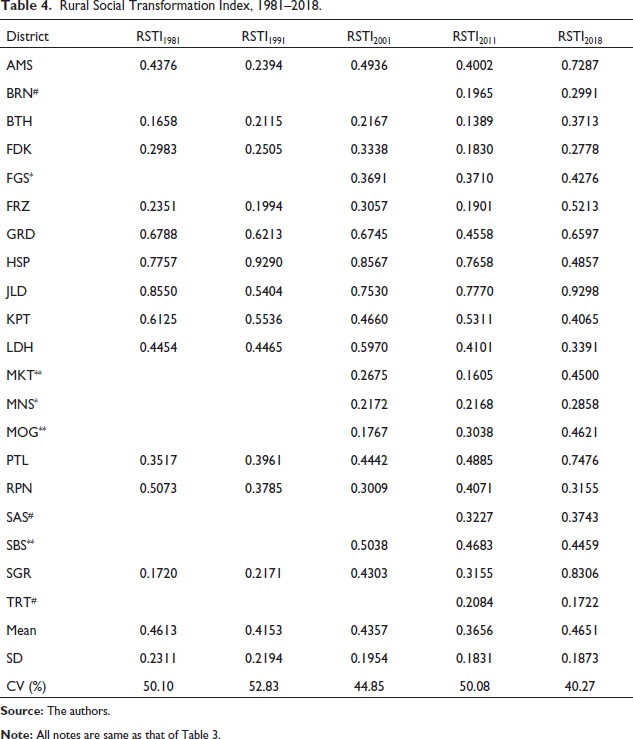
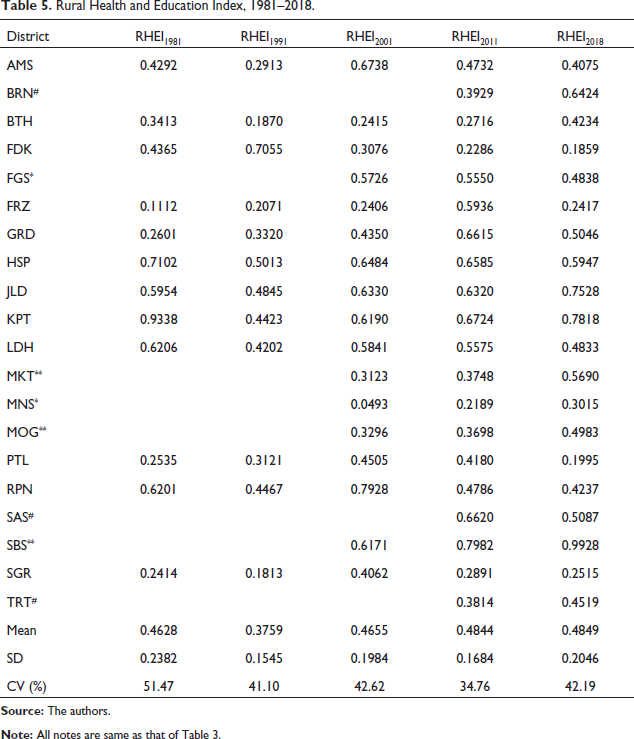
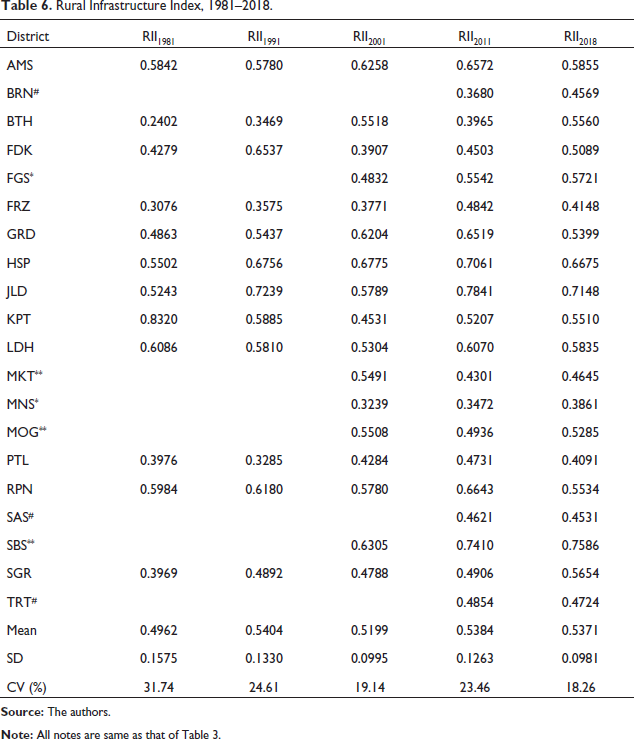
To assess the extent of district level rural development and its disparities in Punjab, a district level composite rural development index (RDI) composed of four sub-indices, namely REI, RSTI, RHEI and RII has been computed at five points of time, that is, 1981, 1991, 2001, 2011 and 2018. The district-wise values of REI, RSTI, RHEI and RII are presented in Tables 3, 4, 5 and 6, respectively expressing a self-explanatory picture of the state of economy, social transformation, health and education and infrastructure in Punjab but the inclusive inference drawn from Tables 3 to 6 can be seem in Table 7. As far as rural economy front is concerned, inter-district disparities in rural Punjab decreased over the study period as observed from the declining values of CV over the course of the last four decades (Table 3). In terms of both rural social transformation (Table 4) and rural health and education (Table 5), the picture of inter-district disparities is fluctuating as at one point of time under consideration, CV declines, while in next time period, it rises. However, inter-district disparities in social transformation and health and education have declined over the study period, that is, 1981–2018. Inter-district disparities in infrastructure development in rural Punjab also decreased over time as CV declined to 19.14 in 2001 from 31.74 in 1981, which further decreased to 18.26 in 2018 (Table 6). Further, the overall trend is visible from summated index values (1981–2018) for all four sub-indices with expression that on economy front, Sangrur is the top performer and Hoshiarpur is at the lowest ebb. Jalandhar performed remarkably in the sphere of social transformation (with first rank), while Tarn Taran depicted relatively worst performance with lowest rank (20th) among various districts of Punjab. On the rural health and education front, S.B.S. Nagar secured highest position (first) while Mansa is observed as the worst performing district by securing 20th rank. Mansa upholds its lowest evaluation with 20th rank even in the case of rural infrastructure development and, here too, S.B.S. Nagar secures top rank in parity with its rank in health and education domain (Table 7).
Rural Economy Index, 1981–2018.
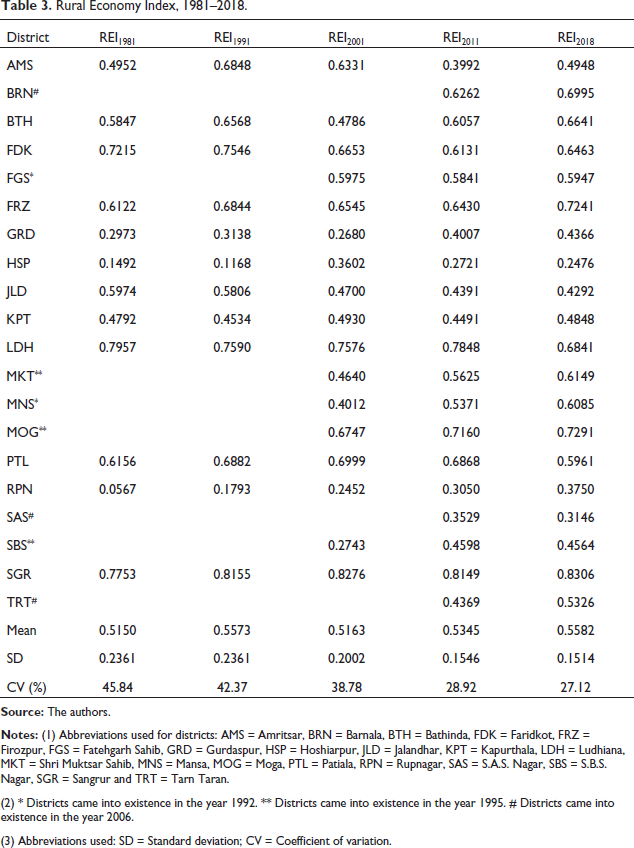
Rural Economy Index, 1981–2018.
(2) * Districts came into existence in the year 1992. ** Districts came into existence in the year 1995. # Districts came into existence in the year 2006.
(3) Abbreviations used: SD = Standard deviation; CV = Coefficient of variation.
Rural Social Transformation Index, 1981–2018.
Rural Health and Education Index, 1981–2018.
Rural Infrastructure Index, 1981–2018.
Inclusive Indices (1981–2018): REI, RSTI, RHEI and RII.
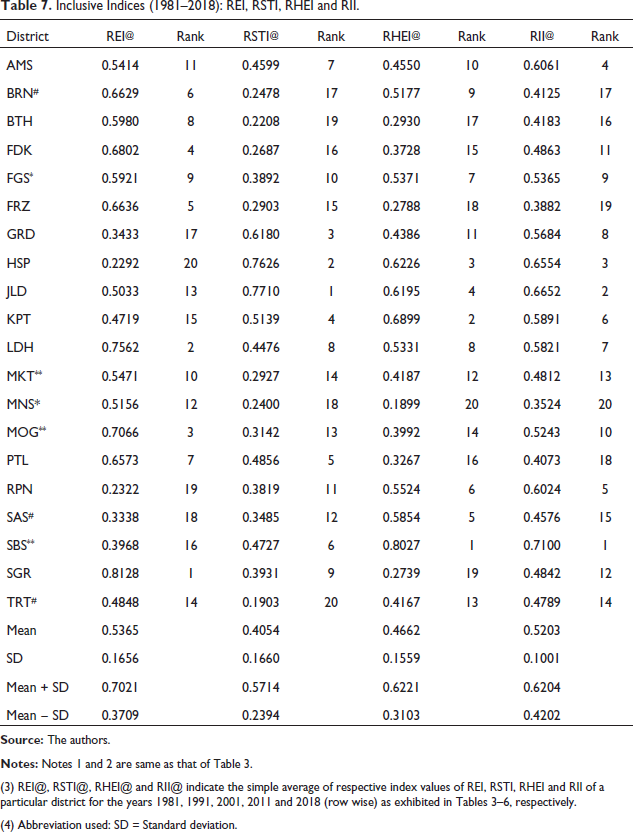
(3) REI@, RSTI@, RHEI@ and RII@ indicate the simple average of respective index values of REI, RSTI, RHEI and RII of a particular district for the years 1981, 1991, 2001, 2011 and 2018 (row wise) as exhibited in Tables 3–6, respectively.
(4) Abbreviation used: SD = Standard deviation.
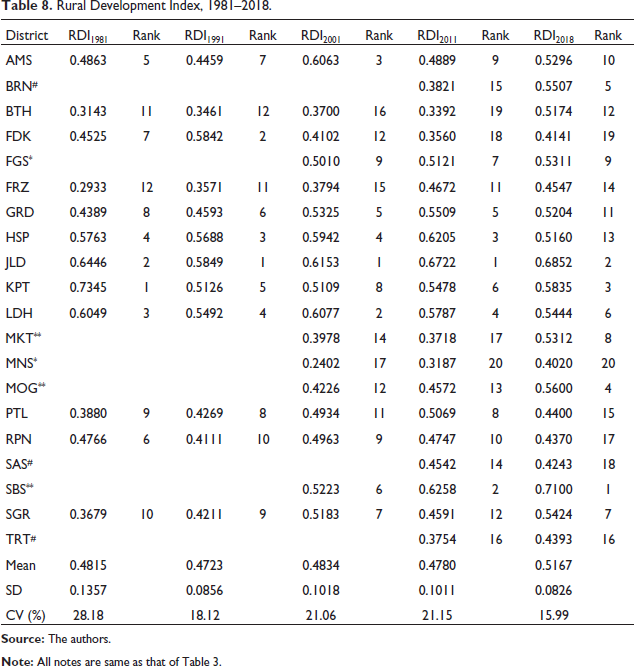
The results of RDI for the years 1981, 1991, 2001, 2011 and 2018 are presented in Table 8. In 1981, Kapurthala was the top performer in terms of rural development in the state but between 1981 and 2001, Kapurthala witnessed a decline in the level of rural development due to relatively slower infrastructure development and reduced degree of social transformation. After 2001, Kapurthala promoted the cause of development in rural areas and again emerged as one of the top three districts in 2018. However, Jalandhar has been identified as a best performing district on rural development front from 1991 to 2011. This feat of Jalandhar can be attributed to its tremendous progress in social transformation of rural areas and development achieved in health services, education sector and infrastructure facilities. In 2018, the top place on the RDI is captured by S.B.S. Nagar owning to the remarkable development experienced in health services, education sector and provision of infrastructure facilities in rural regions. Bathinda and Firozpur districts of the state depicted a gloomy picture of rural development during the study period. These districts failed to catch up with more developed districts in promoting rural development and showed very little progress over the years. Mansa district remained on the lowest ebb on the rural development front since 1991. Rural economy of Mansa witnessed development to some extent but the situation in terms of social transformation, development of health and education sector and provision of infrastructure facilities has remained poor. Barnala, Moga and Shri Muktsar Sahib improved the development of rural areas over the years. These districts gave attention to their economy, social transformation and health and education facilities. Amritsar, Hoshiarpur and Rupnagar, which were initially more developed, have provided less heed to the development of rural areas in the last few decades. Further, it is evident from Table 8 that there exist inter-district disparities in the level of rural development in the state, but these disparities have decreased over time as perceptible from declining value of CV from 28.18 in 1981 to 15.99 in 2018.
Rural Development Index, 1981–2018.
District-wise Rural Development Index of Punjab for Overall Period (1981–2018).

(3) RDI@ indicates the simple average of RDI values of a particular district for the years 1981, 1991, 2001, 2011 and 2018 (row wise) as exhibited in Table 8.
(4) Abbreviation used: SD = Standard deviation.
Inclusive RDI values (1981–2018) expressing summated picture for each district are presented in Table 9. Three districts of Punjab, namely Jalandhar, S.B.S. Nagar and Kapurthala have depicted remarkable performance in the development of rural areas since 1981. The main reason behind this phenomenon is their performance on each domain of rural development, that is, economy, social transformation, health and education and infrastructure development. Here, Mansa, Bathinda and Firozpur districts have emerged as relatively poor performers on the rural development front. These districts not only performed under the mark at each point of time but also registered very little progress over the years.
Before advancing further, we would also like to mention that agriculture sector can be treated as a driving force behind the development of Punjab. After India’s independence, in 1947, the state government made significant investment in the rural economy in order to modernise the agricultural sector. In addition to it, farmers voluntarily donated their land to build rural roads, schools and other vital infrastructure facilities (Dhesi, 2008). Rural areas also witnessed a surge in their prosperity as a result of various measures undertaken during the green revolution period (Gill, 2005). However, since the early 1990s, the economy of the state is facing grave agrarian crisis. The green revolution belt of India is witnessing suicides. Poor socio-economic conditions of the rural working class can also be attributed to the shortcomings of green revolution (Singh et al., 2021). Unviable agriculture, rural indebtedness, ineffective minimum support price mechanism, adverse terms of trade and inefficient value chain system, etc., have amplified the distress in rural areas. Moreover, the recent stand-off between the farmers and the government is not merely a reflection of conflicting views on agricultural reforms, rather it reflects a deeper concern on rural distress (Ghani, 2020).
Further, another trend observed among the young people of the state is the increasing tendency to leave for greener pastures abroad. A large proportion of rural youth is opting for the route of migration to developed countries in search of better employment opportunities due to disguised unemployment issues and stagnant income levels in agricultural sector. A diverse set of pull factors such as higher living standards in the advanced countries and push factors like lack of employment opportunities which suit the aspirations and qualifications of the youth has compelled them to search for greener pastures abroad instead of staying back (Government of Punjab, 2021). The inability of the rural economy to absorb the surplus labour from the agricultural sector has also encouraged the phenomenon of migration to the Western countries (Singh, 2015). Moreover, migration from rural areas is often viewed as a consequence of lack of development opportunities in rural regions (Goyal, 1990). All of these issues necessitate the demarking of rural regions where development has not adequately trickled down. Proper identification of lagging regions will really help to divert financial resources towards them. Therefore, an attempt has been made to devise a district taxonomy based upon REI, RSTI, RHEI, RII and overall RDI.
The district taxonomy prepared on the basis of REI is reported in Table 10. The Malwa belt dominates with frontrunners as well as emerging districts category by depicting tremendous performance on the rural economy front. The districts of Doaba and Majha belts transpired as mediocre and laggard districts. Amritsar, only one district from the Majha belt, has been detected as emerging on the rural economy front. However, S.A.S. Nagar and Rupnagar districts of the Malwa belt are identified as laggard. Further, the district taxonomy computed on the basis of RSTI is presented in Table 11. The districts of Doaba belt dominate frontrunners category in terms of social transformation as two out of three districts under this category belong to the Doaba belt. Gurdaspur and Amritsar districts of the Majha belt have appeared as frontrunners and emerging districts, respectively. However, Tarn Taran district of the Majha belt and Bathinda district from the Malwa belt have been classified as laggard owning to their poor performance in social transformation of rural areas. It is noticeable that all of the districts which appeared under mediocre category belong to the Malwa belt, while only two districts of this belt, namely Patiala and Ludhiana are found under emerging category.
District Taxonomy based on Rural Economy of Punjab.

(2) The mean and standard deviation values used for district taxonomy are given in column REI@ of Table 7.
District Taxonomy based on Rural Social Transformation in Punjab.

(2) The mean and standard deviation values used for district taxonomy are given in column RSTI@ of Table 7.
Table 12 provides the results of district taxonomy developed on the basis of RHEI. On health and education front, S.B.S. Nagar, Kapurthala and Hoshiarpur belonging to the Doaba belt appeared as frontrunners, while Jalandhar district of the Doaba belt have been identified under emerging category. All districts of the Majha belt transpired as mediocre districts in terms of development of health and education sector. The Malwa belt portrayed an ambivalent picture as its districts are scattered over emerging, mediocre and laggard categories. Further, the district taxonomy created using the RII is presented in Table 13. The Doaba belt leads the rural infrastructure front also with three of its districts appearing under frontrunners category and one district showing under emerging category. Four districts of the Malwa belt, namely Rupnagar, Ludhiana, Fatehgarh Sahib and Moga have been detected as emerging districts, while rest of the districts of the belt are found either under mediocre or laggard category. Gurdaspur and Amritsar belonging to the Majha belt are identified as emerging districts, whereas Tarn Taran has been termed as a mediocre district. Finally, the district taxonomy devised on the basis of overall rural development is presented in Table 14. All four districts of the Doaba belt are identified as frontrunners, while Amritsar and Gurdaspur districts of the Majha belt are emerging districts. Nine districts of the state (eight districts belonging to the Malwa belt and one district, namely Tarn Taran from the Doaba belt) transpired as mediocre districts. Firozpur, Bathinda and Mansa districts of the Malwa belt appeared under the laggard category.
District Taxonomy based on Rural Health and Education in Punjab.
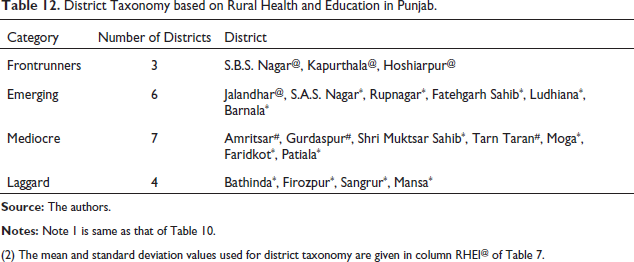
(2) The mean and standard deviation values used for district taxonomy are given in column RHEI@ of Table 7.
District Taxonomy based on Rural Infrastructure in Punjab.

(2) The mean and standard deviation values used for district taxonomy are given in column RII@ of Table 7.
District Taxonomy based on Overall Rural Development in Punjab.

(2) The mean and standard deviation values used for district taxonomy are given in RDI@ of Table 9.
In the present study, to assess the extent of district level rural development and its disparities in Punjab, a district level composite rural development index has been constructed at five points in time, that is, 1981, 1991, 2001, 2011 and 2018. The findings of the study revealed the presence of inter-district disparities in rural development in the state. All districts of the Doaba belt of the state have portrayed remarkable performance on the rural development front. Except Ludhiana and Fatehgarh Sahib, the rest of the districts belonging to the Malwa belt have presented a grim picture of rural development by making their presence in either mediocre or laggard category. As far as the districts of the Majha belt are concerned, Amritsar and Gurdaspur transpired as emerging districts, whereas Tarn Taran demonstrated mediocre performance. Further, the results of the study also expressed that the magnitude of inter-district disparities in rural development have reduced over the study period. The decline in the magnitude of variations in rural development across districts indicates the successful implementation of various rural development policies and programmes designed by the state government. It is worth mentioning that true development of rural areas cannot be warranted without ensuring distributed growth in the whole state. Therefore, the state government must prioritise social as well as economic development of rural dwellers of laggard as well as mediocre category districts. Further, the prevalence of inter-district disparities in rural development accentuates the need for identifying the factors responsible for these variations in the state. Instead of devising one-size-fits-all policy interventions, the more appropriate solution to eliminate development differences can be a region specific multi-dimensional approach.
Footnotes
Declaration of Conflicting Interests
The authors declared no potential conflicts of interest with respect to the research, authorship and/or publication of this article.
Funding
The authors received no financial support for the research, authorship and/or publication of this article.
