
Abstract
Hydrothermal method was used to convert graphene oxide to graphene in water. Polyvinylpyrrolidone was added to improve dispersion of graphene and form a stable graphene solution with a high concentration. This stable graphene solution was used to mix with waterborne polyurethane (WPU) to prepare WPU/graphene composites. The electrical conductivity of WPU was greatly improved with incorporation of graphene, and when the filling amount of graphene is 4.0 wt%, the conductivity of the composite reaches 8.30 × 10⁻⁴ S cm−1, which is a little higher than that of the composite prepared by in situ method.
Keywords
Introduction
Graphene is a monolayer of carbon arranged in a honeycomb network. Since graphene has exceptional properties such as big surface area of 2630–2965 m2 g−1, outstanding electrical conductivity of ∼10 S cm−1, high modulus of ∼10 GPa, and excellent thermal conductivity of ∼3000 W (m−1 K−1), 1 – 4 it has attracted much interest recently. All these exceptional properties make graphene to be used in many applications such assensors, nanocomposites, 5 supercapacitors, 6 and so on.
In the past few decades, the use of inorganic nanomaterials as fillers in the preparation of polymer/inorganic-conducting composites has attracted an increasing interest owing to their unique properties and numerous potential applications in electromagnetic shielding, antistatic coatings, and corrosion-resistant coatings. 7 – 10 Compared to the neat polymer, polymer/graphene composites show significant thermal, mechanical, electrical, gas barrier, and flame-retardant properties. 11 – 14
Waterborne polyurethane (WPU) contains small amount of organic solvent and thus, does very little harm to environment. 15 It is widely used in coating and adhesives. 16 When the materials are used for electronic equipments, conductivity is necessarily required. WPU/graphene composites were reported to be prepared by solution mixing method and the highest electrical conductivity of the composite reached 5.47 × 10⁻⁴ S cm−1 when 5.0 wt% of graphene was loaded. 17 While the highest electrical conductivity of WPU/graphene composite prepared by in situ method 18 was 7.87 × 10⁻⁴ S cm−1 with 4.0 wt% addition of graphene. Solution mixing method is simply relative to in situ intercalation method; however, the electrical conductivity of the composite prepared by solution mixing method is usually lower than that by in situ intercalation method.
In this study, to improve the dispersion and stability of the graphene solution and to increase the electrical conductivity of the WPU/graphene composites prepared by solution mixing, polyvinylpyrrolidone (PVP) was added and the measurement results indicate that the electrical conductivity of WPU/graphene composites is almost or even more higher than that prepared by in situ method.
Experimental details
Materials
Flaky graphite with an average particle size of 45 µm was purchased from Qingdao Huatai Lubricant Sealing S&T (China). Polytetramethylene glycol (PBG), dimethylolpropionic acid (DMPA), isophorone diisocyanate (IPDI), triethylamine (TEA), 1,2-ethylenediamine (EDA), dibutyltion dilaurate were used as catalyzer, H2SO4 (98%), fuming HNO3, KClO3, and all other chemicals were commercially available analytical grade reagents and used without further purification. Water used throughout this study was reagent grade produced by an ultra-pure water purification system.
Preparation of graphene solution
Graphene oxide (GO) was prepared using the Staudenmaier method. 19 First, a 210 mL mixture of concentrated H2SO4 (98%) and fuming HNO3 (2/1 v/v) was poured into a 500 mL round bottom flask and cooled below 20°C. Then, graphite powder (8 g) was added and agitated under nitrogen gas condition. Subsequently, KClO3 (100 g) was slowly added to the reaction mixture while the temperature remained below 20°C and was stirred for 48 h. Finally, the mixture was poured into deionized water. The GO was filtered and washed with distilled water many times until the pH reached 6.5. The resulting GO was dried at 60°C. To prepare graphene solution, GO and PVP (1/4 w/w) were added into deionized water to form an aqueous solution with GO concentration of 2.50 mg/mL, and ammonia solution added to adjust the pH of the solution. The mixture was transferred to an autoclave and heated to 160°C for 5 h to convert GO to graphene. Then, the autoclave was cooled to room temperature and the graphene solution was obtained.
Preparation of WPU/graphene composites
The WPU dispersion was prepared using PBG with some modifications as follows. PBG was charged into a three-necked flask, and then DMPA added and reacted with PBG at 80°C under stirring. After 20 min, IPDI was fed into the reactor and reacted for 2 h. Dibutyltion dilaurate was added in the mixture. Subsequently, about 50 mL acetone was poured into the flask, which is to reduce the viscosity of prepolymer. After cooling to 45°C, TEA was added to neutralize the DMPA unit of the prepolymer. After that, deionized water was poured into the reactor under vigorous stirring. After 20 min, EDA was fed to the emulsion for the final chain extension reaction for 40 min. The final solid concentration was 30%.
The graphene solution and the WPU emulsion were poured into a beaker to mix at 25°C for 30 min under stirring. The mixture was poured onto glass frames and dried at 50°C in air for 2 days to obtain the composite films.
Measurements
Fourier transform infrared (FTIR) spectroscopy spectra was recorded on a Nicolet Avatar 370 FTIR spectrometer. To confirm whether graphene had been produced from GO through hydrothermal reduction, 20 X-ray diffraction (XRD) and atomic force microscopy (AFM) measurements were used. The morphology of the WPU/graphene composites was examined with a transmission electron microscope (TEM, HitachiH-8100). The composite solution was deliquated with ethanol, dropped in copper online, and dried at room temperature. Before TEM measurement, gold film was coated on the surface. Scanning electron microscopy (SEM, Model JSM-6510) was used to observe the cross-section of the WPU/graphene composites films. The electrical conductivity was measured with Keithley 2400 and silver paste used as the electrode. The thermogravimetric analysis (TGA, Q500, TA Instrument) was performed from room temperature to 650°C at a heating rate of 10°C min−1 under nitrogen gas condition.
Results and discussion
Figure 1 shows the prepared graphene aqueous solutions with and without PVP. The graphene concentration is 2.0 mg/mL. Agglomeration and precipitation are found in the graphene solution without PVP, as shown in Figure 1(a), which is normal because the hydrophobic graphene has a strong trend to agglomerate irreversibly in aqueous solvents. However, there is just a small amount of sediment in graphene solution added with PVP after 2 months but never fully settle, as shown in Figure 1(b). It suggests that with addition of PVP, the dispersion and stability of graphene solution obviously improved. The reason is that PVP has a good solubility in water, and PVP has the molecular structure of N-methyl-pyrrolidone, which is considered as an efficient exfoliant for graphene.
21
Images of: (a) graphene solution and (b) graphene/PVP solution (graphene concentration is 2.0 mg/mL).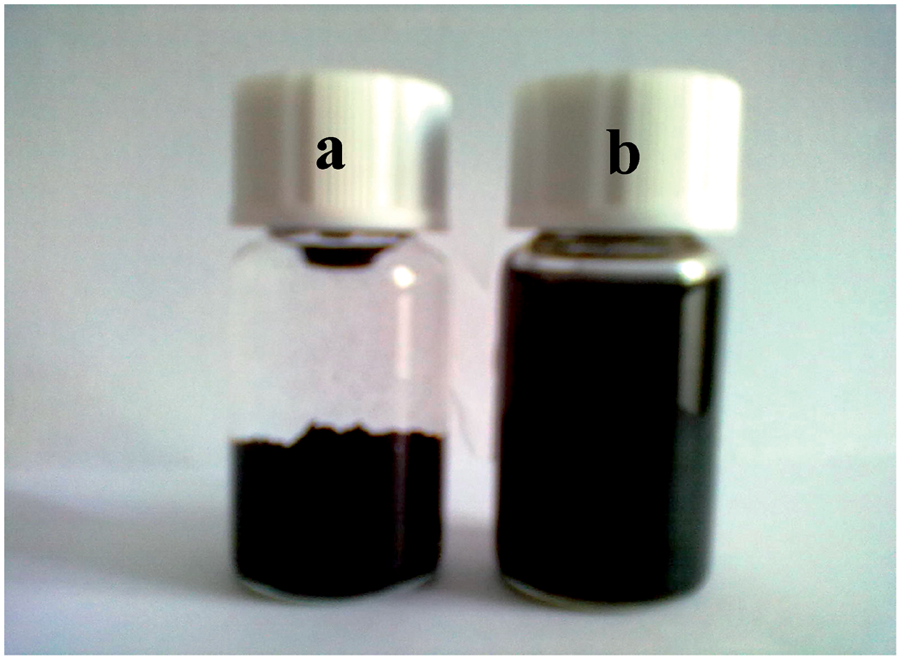
FTIR spectrum of WPU film is shown in Figure 2. The band at 3365 cm−1 is ascribed to the N–H stretching vibration of WPU and O–H. The bands at 2951 cm−1 may be, respectively, ascribed to the C–H symmetrical and asymmetrical stretching absorptions of the CH3 and CH2 groups. The bands at 1725 and 1528 cm−1 can be assigned to the stretch vibration of C = O groups and the bending vibration of N–H bond, respectively, which were formed by the interaction of the –NCO group of IPDI with –OH group of PBG, while the –NCO group absorption (at 2262 cm−1) completely disappeared in the spectrum of the composite.
FTIR spectra of WPU.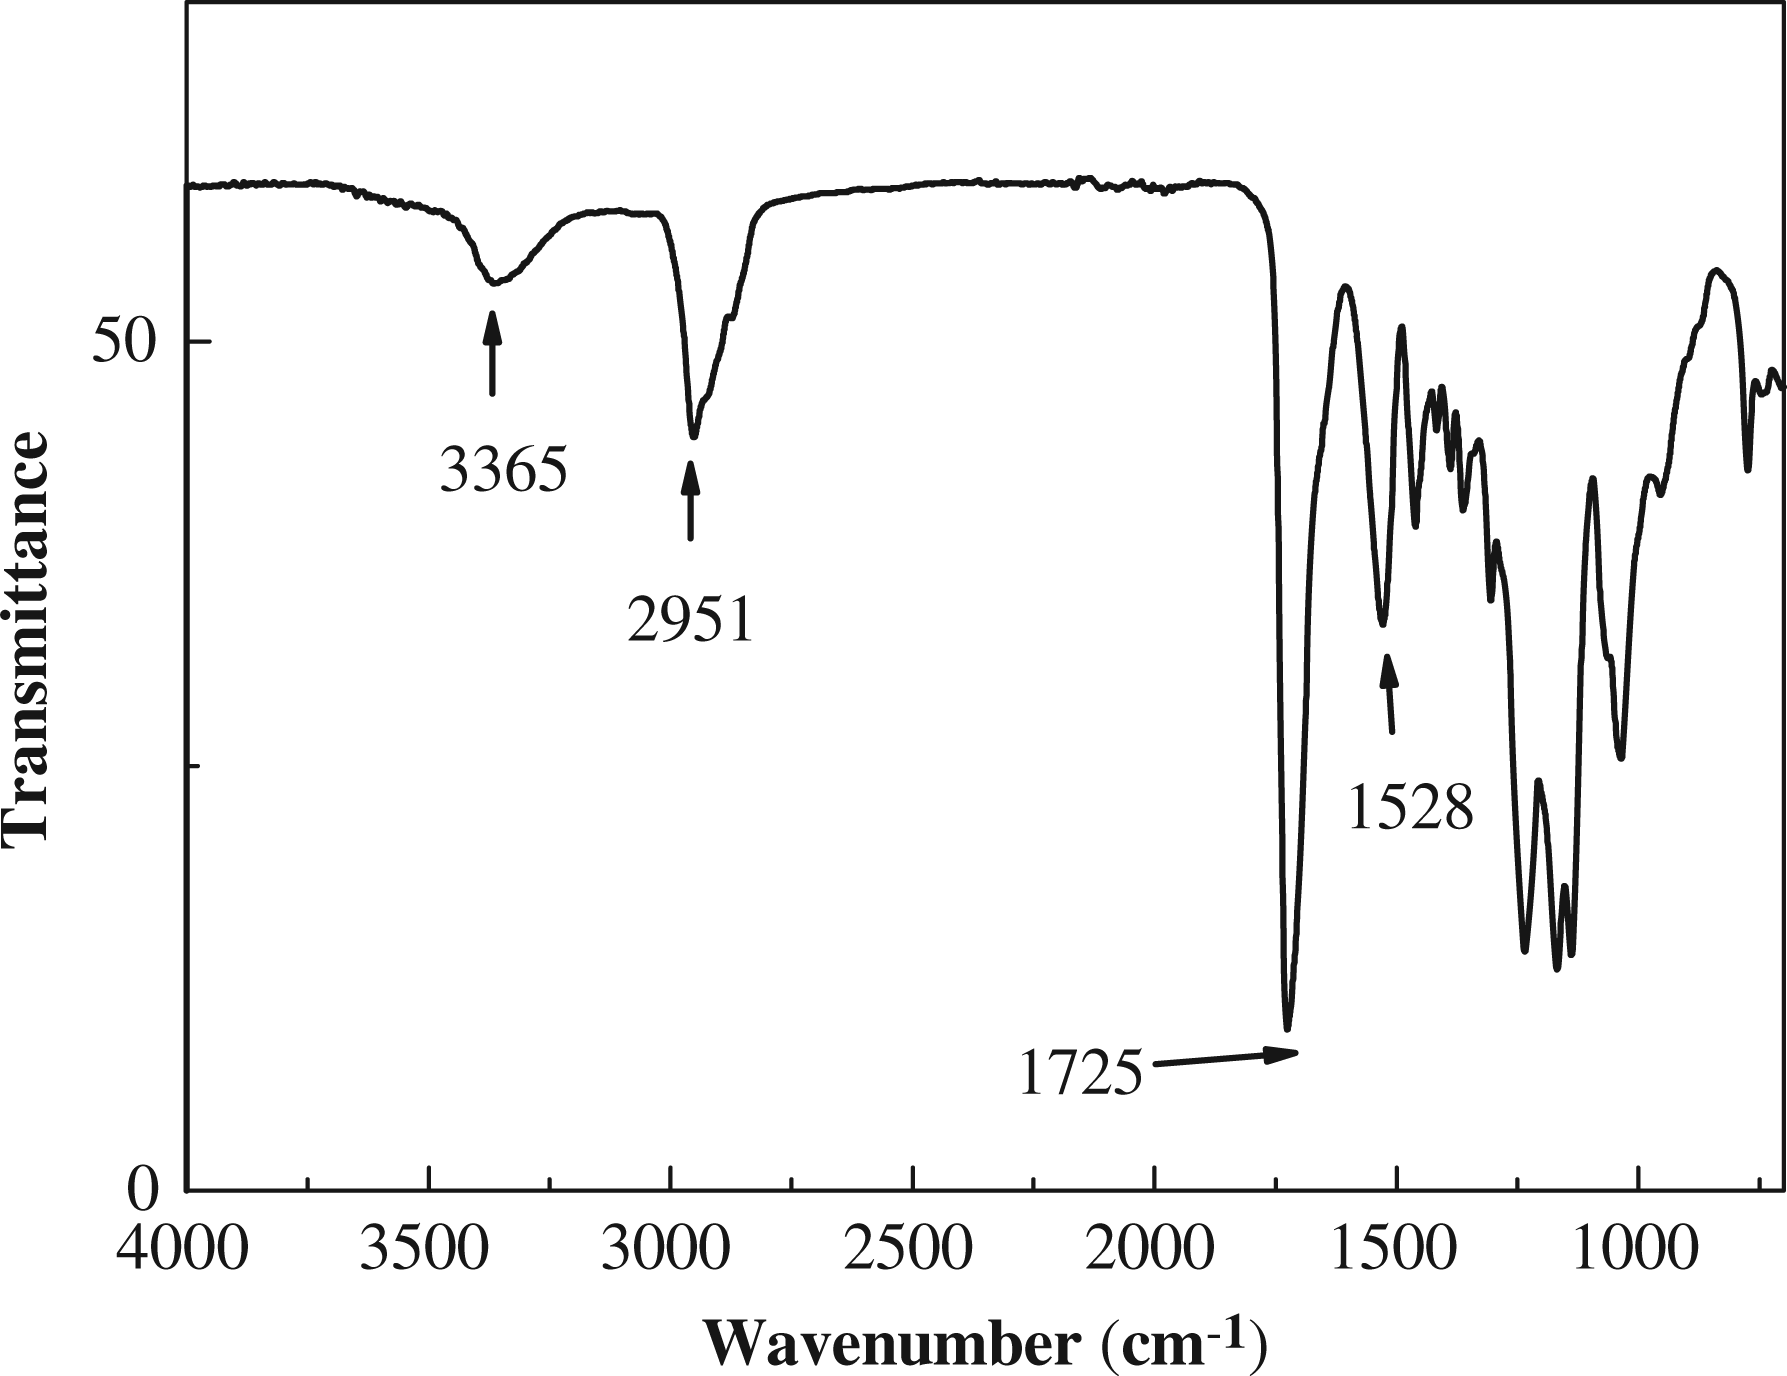
To confirm whether the graphene had been produced from GO through hydrothermal reduction, XRD and AFM measurements have been used. Figure 3 shows the XRD spectra of graphite, GO, and graphene. It can be seen that an intense, sharp peak at 2θ = 26.4° appears in the XRD pattern of graphite, while the diffraction peak at 2θ = 12.2° appears in that of GO and the layer-to-layer distance is of ∼0.72 nm. Compared to pristine graphite (∼0.34 nm), the layer-to-layer distance increases obviously, which is caused by the intercalation oxide functional groups. A coherent wide-angle XRD signal of graphene, as shown in Figure 3(c), suggests that graphene is of a monolayer or few layers. Figure 4 shows the AFM image of obtained graphenes through hydrothermal reduction. The sheet in AFM image (Figure 4) has lateral dimensions of several micrometers and a thickness of about 0.6 nm, which is a characteristic of a layer graphene.
22
XRD pattern of: (a) pristine graphite, (b) graphite oxide, and (c) graphene. AFM image of graphene.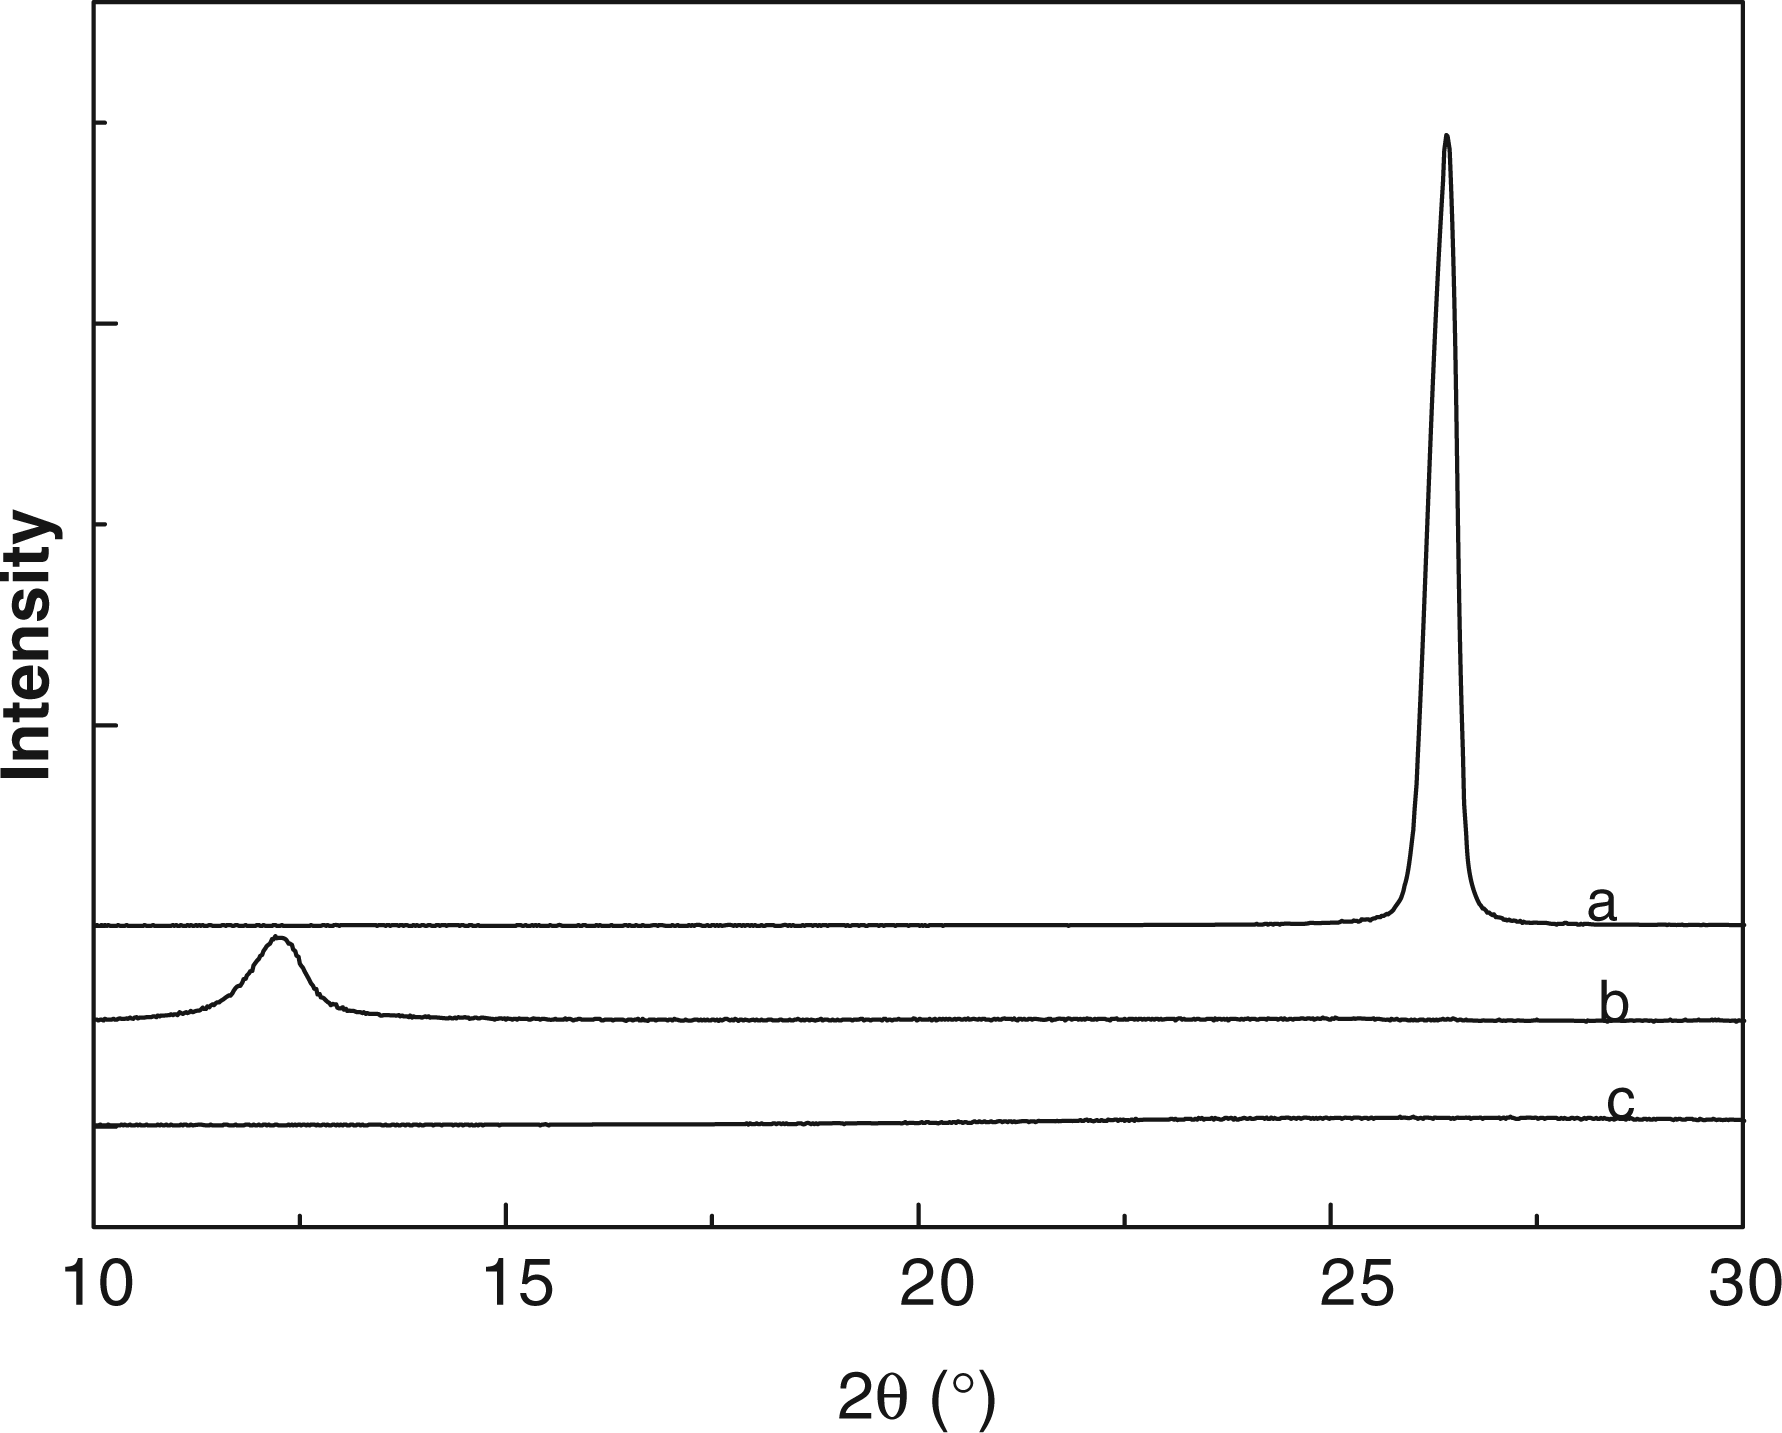
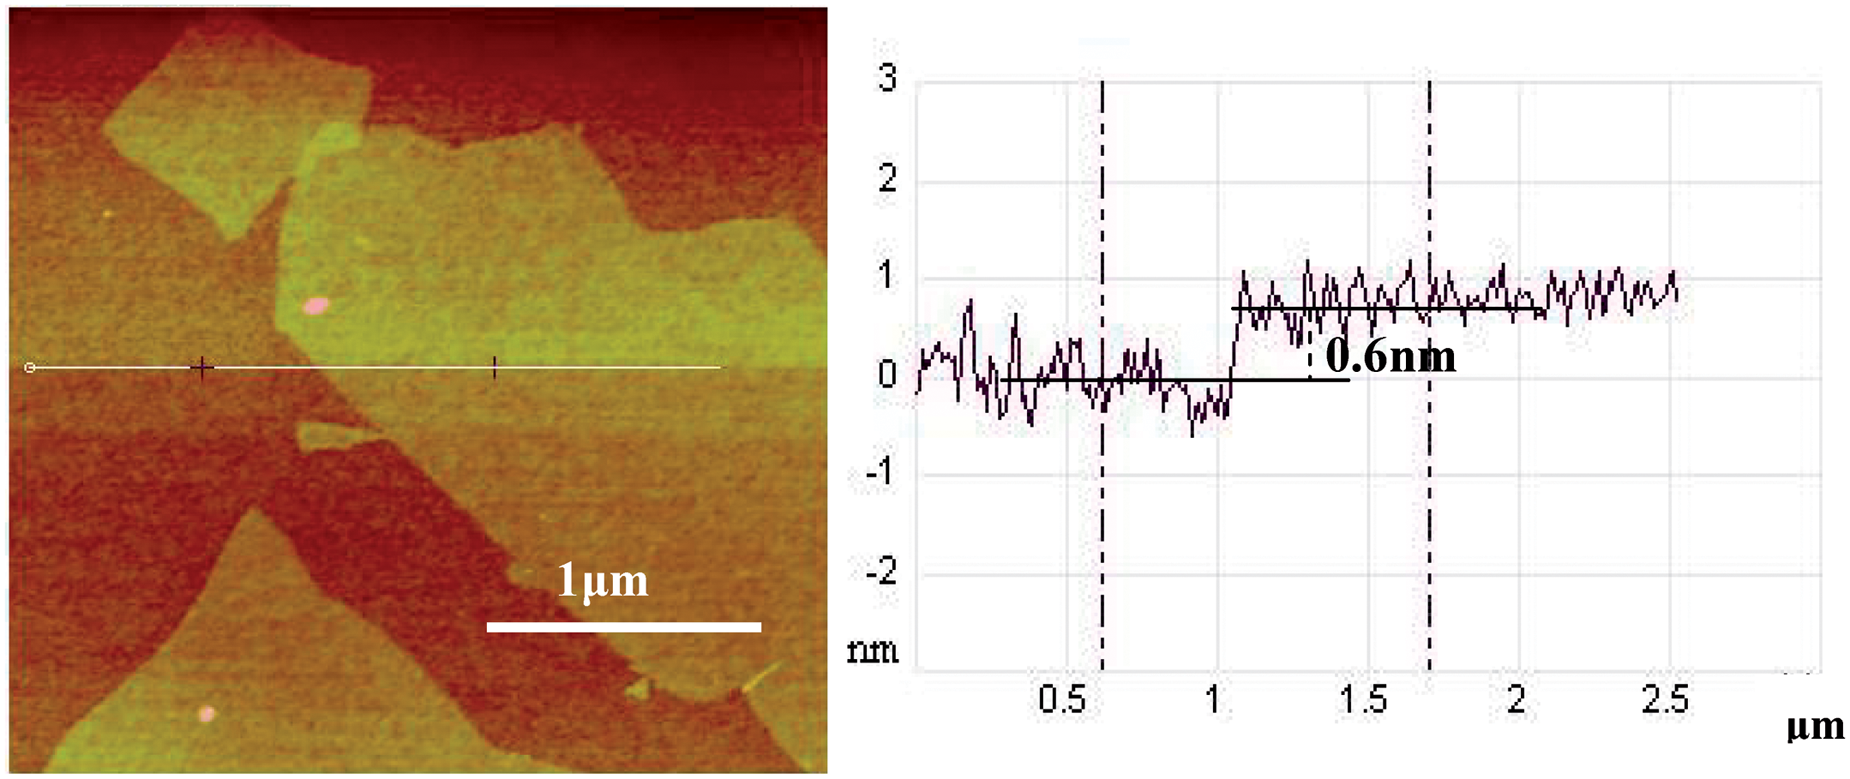
Figure 5 shows the TEM image of the WPU/graphene composite with addition of 1 wt% graphene, which shows that graphene sheet spreads well with a little stacks. Due to the filling of PVP, the compatibility of graphene and WPU is excellent. It is considered that PVP can provide active sites for the post-immobilization of other molecular species.
23
TEM image of WPU/graphene with addition of 1.0wt% graphene.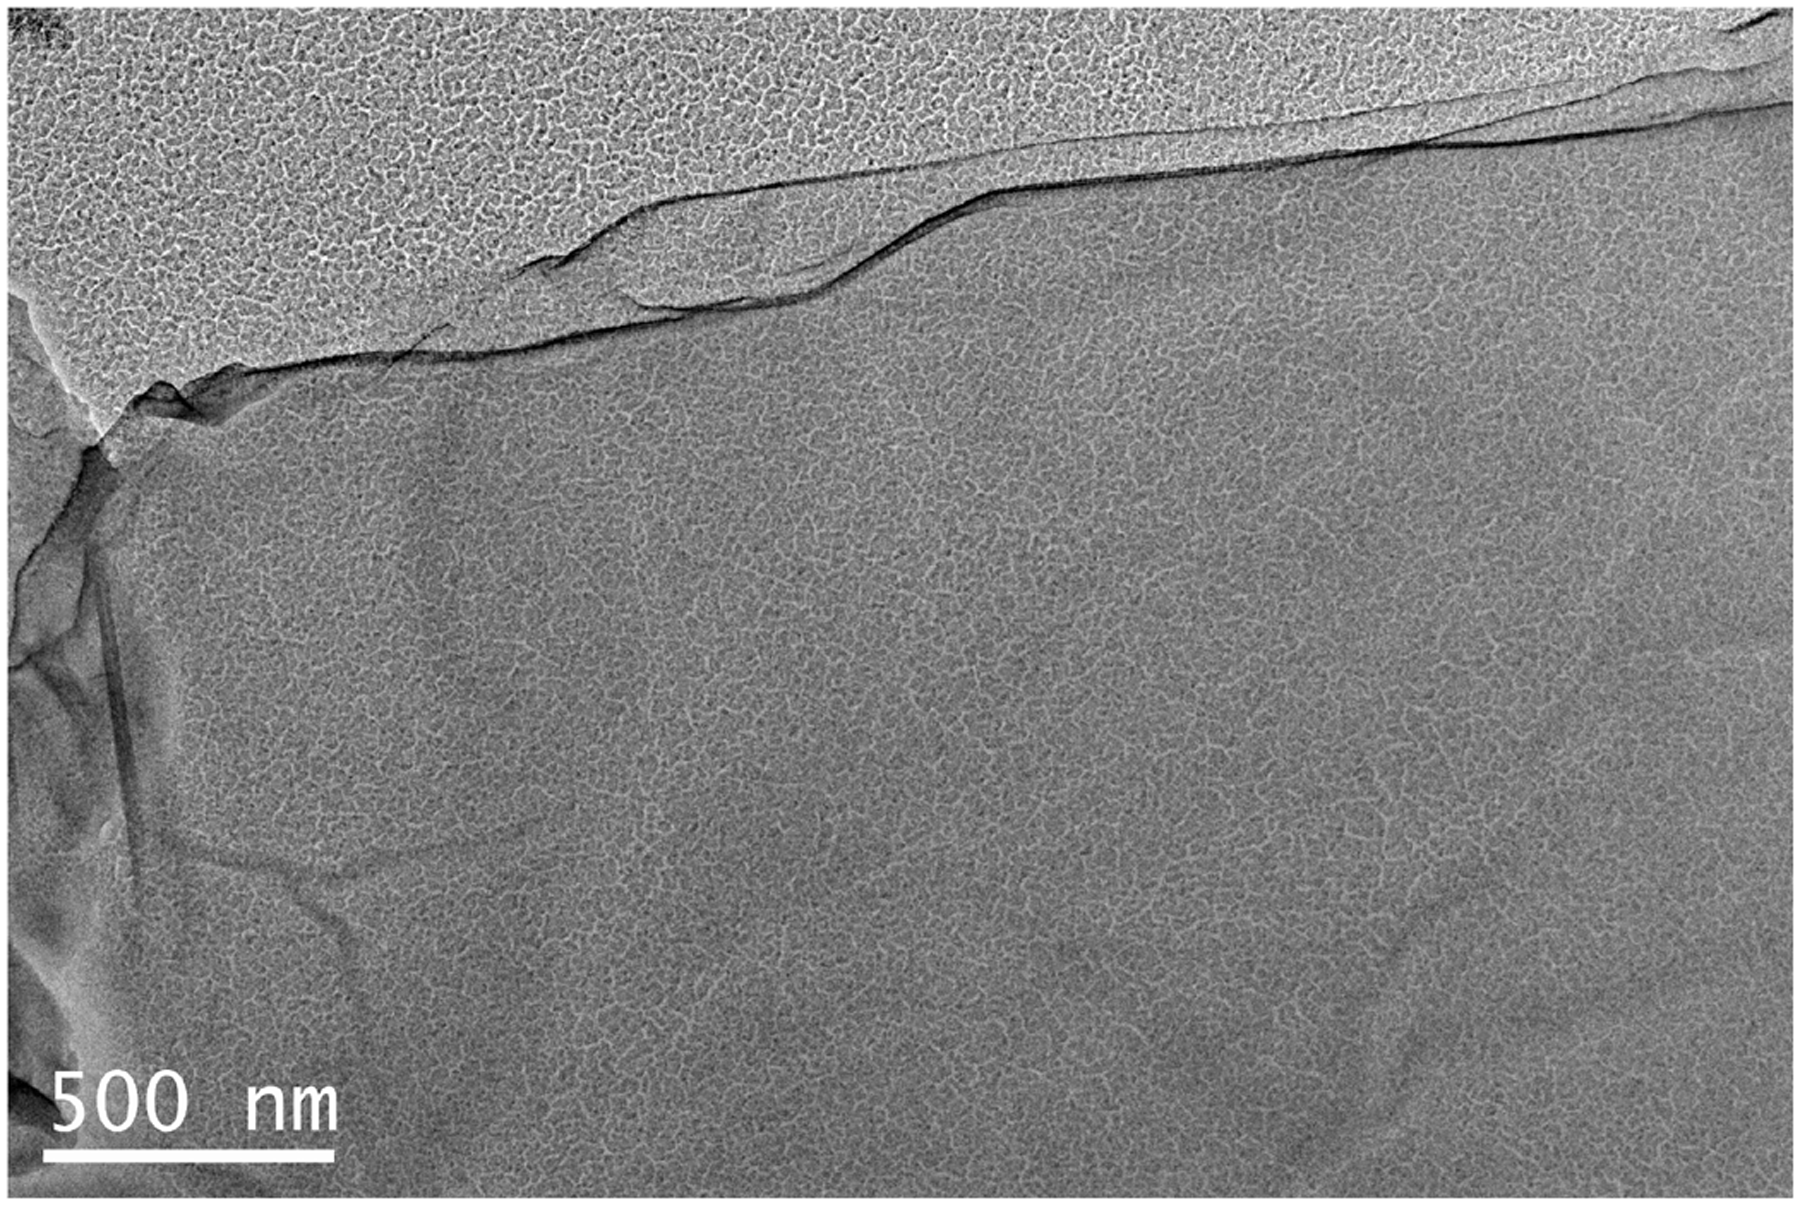
Figure 6 shows cross-sectional SEM images of the WPU/graphene composites films. It is seen that the pure WPU (Figure 6(a)) is characterized with a smooth surface, while scattered island structures existed in the composites with 1.0 and 2.0 wt% of graphene, respectively. When the filling amount of graphene increases to 4.0 wt% (Figure 6(d)), a network structure appears in the composite.
Cross-sectional SEM images of: (a) WPU, (b) WPU/graphene composite with 1.0 wt% graphene, (c) WPU/graphene composite with 2.0 wt% graphene, and (d) WPU/graphene composite with 4.0 wt% grapheme.
Figure 7 shows the dependence of electrical conductivities of WPU/graphene composites on the filling amounts of graphene, for comparison, the conductivities of WPU/graphene in Refs17,18 are also given in the figure. It can be seen that the conductivity of the composites could be increased by the addition of graphene, and with the same filling amount of graphene, the conductivities measured in our study are all higher than the reported values.17,18 When the filling amount increases to 4.0 wt%, the conductivity reaches the highest value of 8.30 × 10⁻⁴ S cm−1. It is obvious that the addition of PVP in graphene greatly increases the composite conductivities.
The dependence of electrical conductivities of WPU/graphene composites on filling amount of graphene.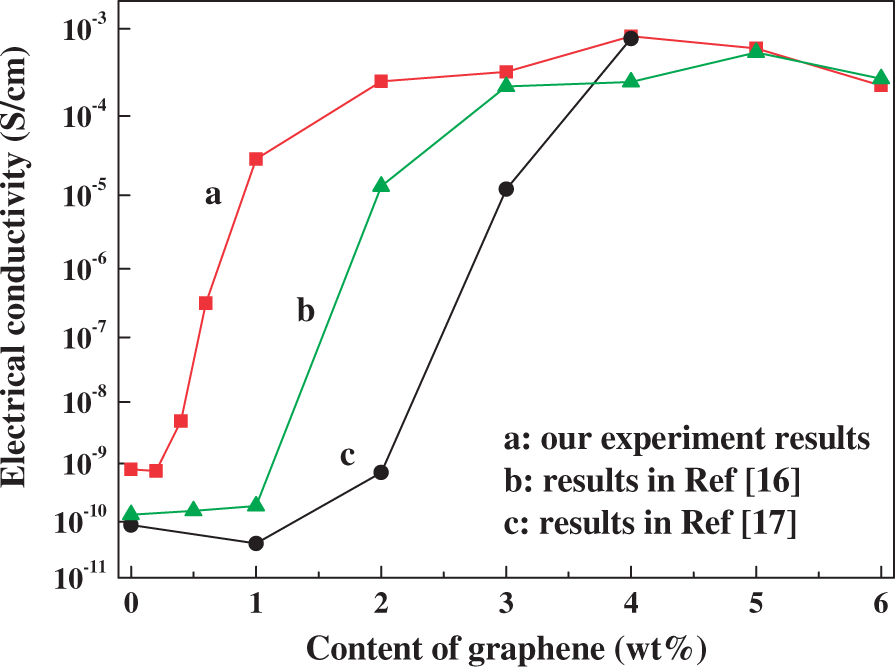
The influence of graphene solution concentration on the conductivities of composites was also studied and is shown in Figure 8. In the composites, the filling amount of graphene is 4.0 wt%. When the graphene solution concentration decreases from 4.0 to 2.0 mg/mL, the conductivities increase from 2.20 × 10⁻⁵ to 8.3 × 10⁻⁴ S cm−1. It indicates that the low graphene solution concentration is favorable to increase the conductivities of WPU/graphene composites.
The dependence of electrical conductivities of WPU/graphene on graphene solution concentration by adding 4.0 wt% graphene.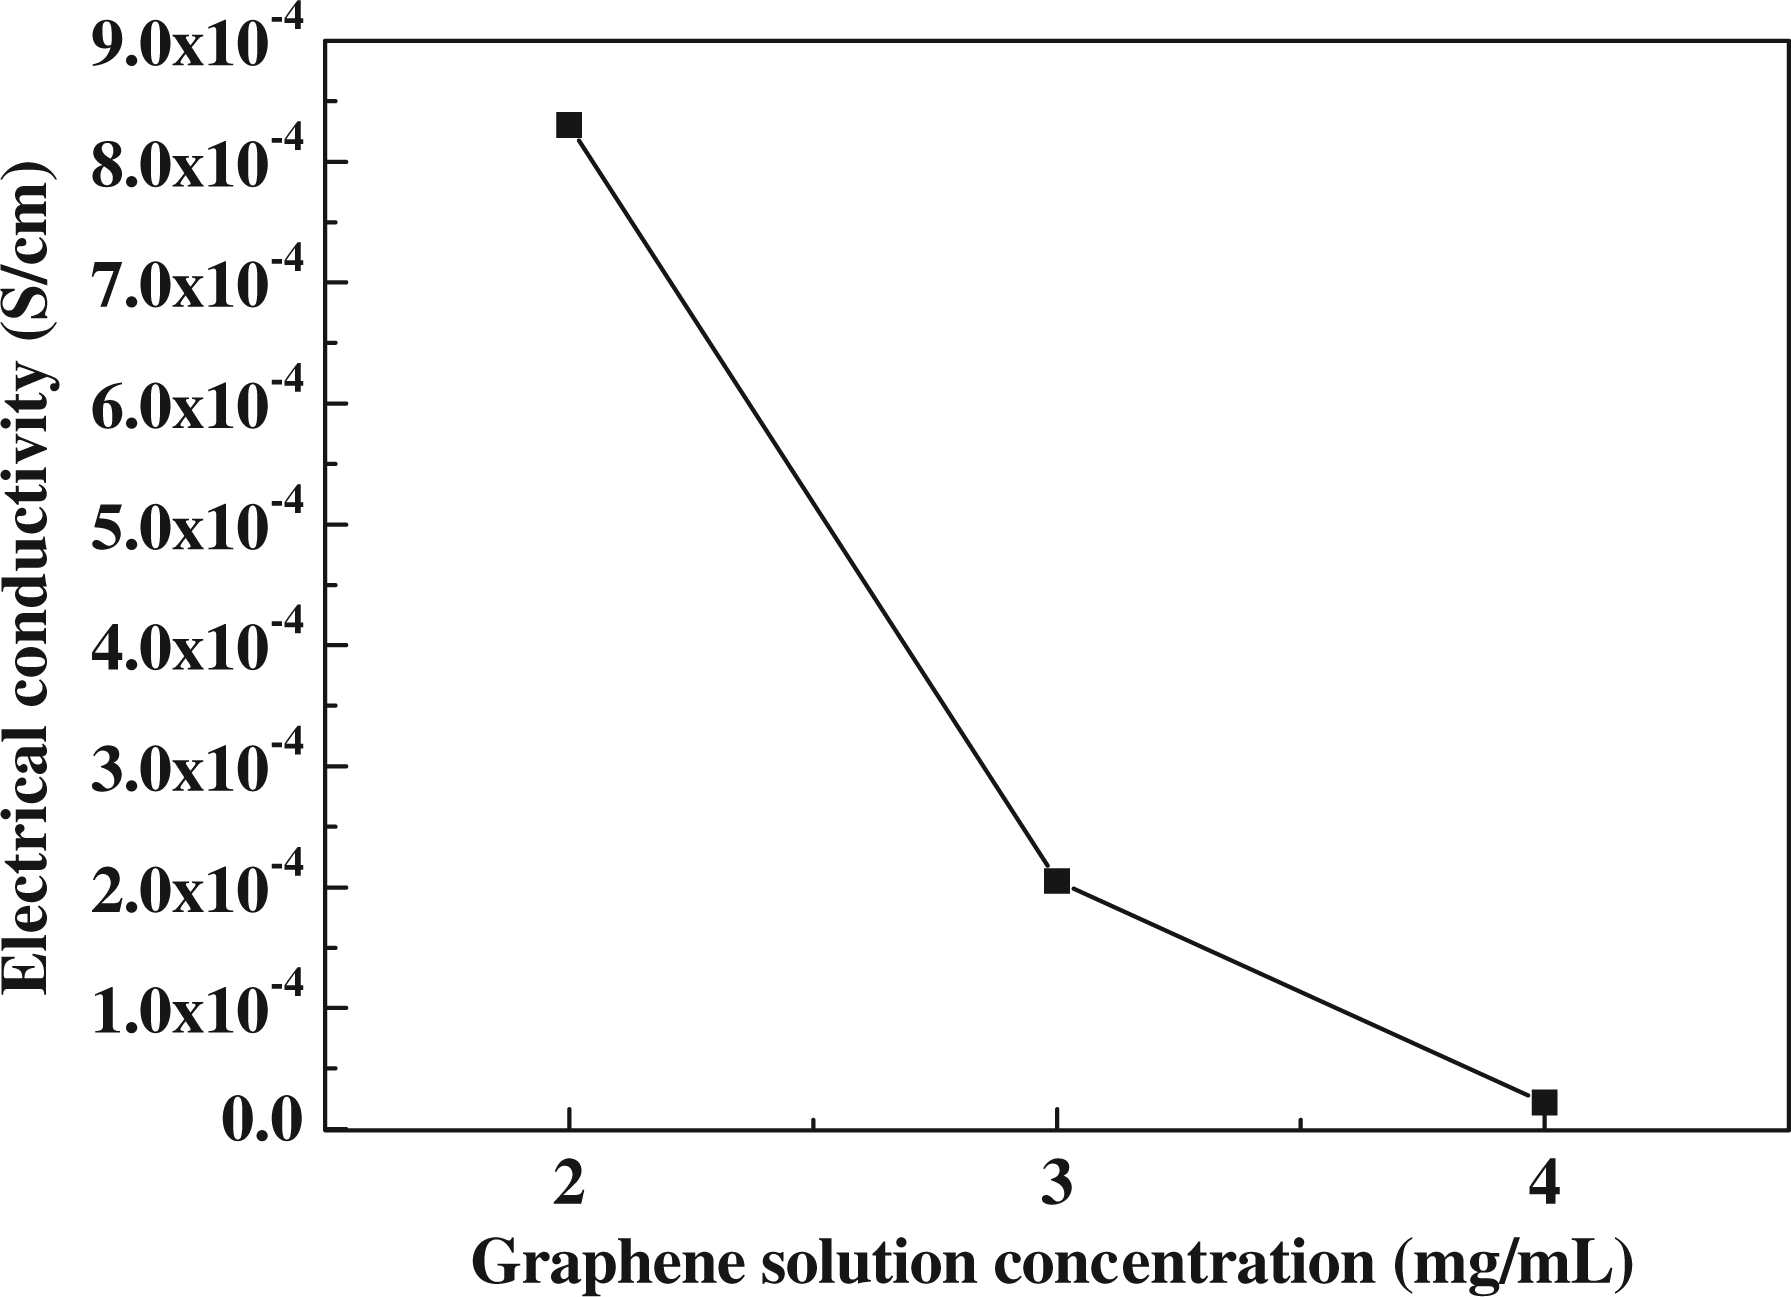
TGA is used to represent the thermal property of WPU/graphene composites. As shown in Figure 9, the initial weight loss of the composite is accelerated with addition of graphene. It indicates that the thermal stability of WPU is improved with addition of graphene.
Thermograms of WPU/graphene composites with different concentrations of graphene.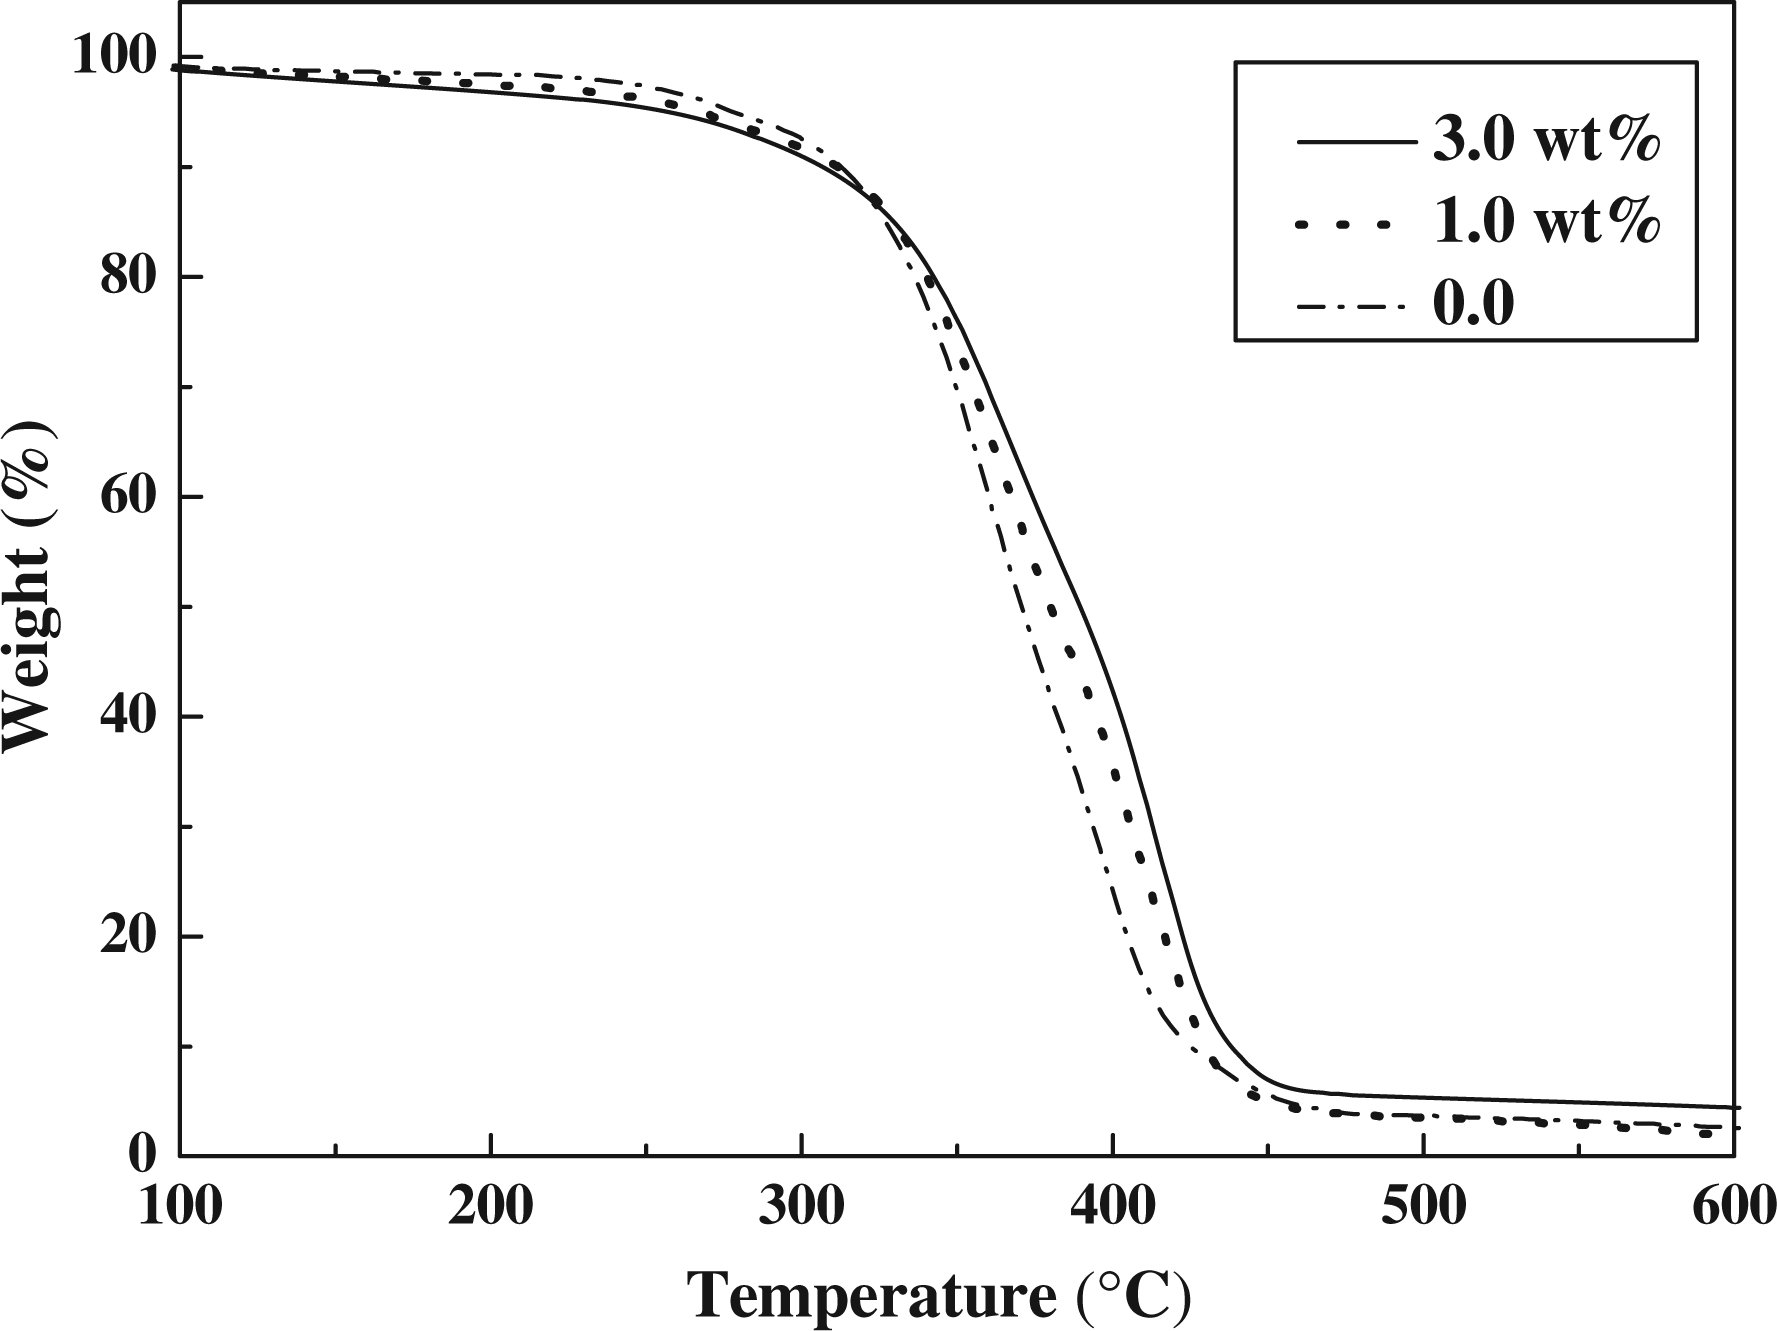
Conclusions
In conclusion, hydrothermal method was used to convert GO to stable dispersion in water with PVP, and have prepared WPU/graphene composites by solution mixing. With addition of graphene, the electrical conductivity of WPU/graphene composites is greatly improved, meanwhile thermal stability is also improved to some extent. With the same filling amount of graphene, the conductivities measured in our study are all higher than the reported values.17,18 When the filling amount increases to 4.0 wt%, the conductivity reaches the highest value of 8.30 × 10⁻⁴ S cm−1.
Footnotes
Acknowledgments
This study was supported by Qing Lan Project (2008-04), Jiangsu ‘333’ Project (201041), the priority academic program development of Jiangsu higher education institutions and Changzhou Science and Technology project (CE20100048).