






Abstract
Compaction of e-glass fabric preforms (random, woven and biaxial) embedded with a distribution medium (polypropylene) is coupled with 1D resin (polyester) flow during initial application of vacuum, mold filling and fiber relaxation stages of vacuum infusion. In our previous study,1 the compaction characterization procedure had been designed and conducted to realistically model the compaction behavior of fiber preforms in vacuum infusion such that the loading was done on a dry specimen; fiber settling was allowed under constant compaction pressure; unloading was done after the specimen was wetted and the fiber relaxation was characterized at constant pressure. To investigate the effects of characterization components on the part thickness evolution, two compaction models (“unloading only” and “unloading and time-dependent relaxation”) were coupled with two models of flow (“uncoupled” and “coupled” pressure-thickness-permeability). The results of the coupled model of “unloading and time-dependent relaxation” and “coupled pressure-thickness-permeability” was the closest to the vacuum infusion experiments.
Introduction
The vacuum infusion (VI) process is used to manufacture composite parts reinforced with continuous fibers in a cured thermoset matrix. It is one of the liquid composite molding (LCM) processes in which a liquid thermoset resin is injected through the empty spaces in a stationary fiber preform previously placed in a mold. VI is also known as resin infusion (RI), vacuum assisted resin transfer molding (VARTM), vacuum bag molding (VBM) and vacuum bagging (VB). In this process, a dry fiber preform is prepared using plies of continuous fiber mats or fabrics, and then compacted between a single-sided mold and a vacuum bag under vacuum using a vacuum pump and sealant tacky tape around the mold. If a distribution medium with high permeability and a peel ply are placed between the vacuum bag and the fiber preform to allow fast mold filling, the process is named as Seeman’s composite resin infusion molding process (SCRIMP). Compared to resin transfer molding (RTM), in which the fabric is compacted in a two-sided mold, the tooling cost is low in VI, an injection equipment is not needed (only a vacuum pump is used) and large parts (tens of meters length) can be readily manufactured with smooth surface on the mold side and rough surface on the vacuum bag side. The major disadvantage of VI is the limitation of the achieved fiber volume fraction due to the low compaction pressure (a maximum value of one atmospheric pressure) whereas high fiber content may be achieved in RTM because the fiber preform is compacted using clamps or a press.
One of the major challenges of this process is to manufacture parts with low dimensional tolerance in thickness. Because the fiber compaction is induced by means of vacuuming the mold cavity between a one-sided mold and a vacuum bag, the compaction varies spatially and with time as the resin pressure changes. To allow the VI process to be used in the automotive industry for high volume manufacturing of parts with tight dimensional tolerances, the challenging task of part thickness control requires understanding of the coupled relationship between resin flow and fiber compaction.
A pressure differential between resin inlets and vents drives the resin into the porous fiber preform. However, this pressure differential also causes undesirable variation in the preform thickness because nonuniform resin pressure results in nonuniform compaction pressure on the vacuum bag and the preform.1,2 To understand and control the thickness variation, many researchers studied the coupled modeling of the compaction and flow, characterized the compaction of the fiber preform either experimentally or with a model and monitored the pressure and thickness distributions during mold filling (and also during the post filling stage if resin bleeding is applied). This paper demonstrates the effects of different compaction characterization approaches on the part thickness by coupling 1D resin flow and fiber compaction; and verifying the model results with VI experiments.
Literature review
In most of the previous compaction models developed in the literature,3–6 a static relationship between compaction pressure and fiber volume fraction was assumed, that is, viscoelastic behavior was not considered, and thus an instantaneous response (change in thickness) was assumed when the compaction pressure changed. However, as seen in Yenilmez and Sozer’s 1 and Govignon et al.’s 7 material characterization experiments, viscoelastic fiber relaxation is very significant, and fiber relaxation with time can be orders of magnitude larger than the spring-back response (instantaneous static response) especially at low compaction pressures.
Gutowski et al. 3 modeled the preform as a bundle of aligned wavy beams with multiple contact points. In Andersson et al.’s model, 4 fiber volume fraction was related to the compaction pressure with constants including a term representing the softening of the reinforcement, and its value is dependent on whether the preform is dry or wet to study the effect of lubrication effect on the fiber compaction. Robitaille and Gauvin 5 and Joubaud et al. 6 used a power law relationship between the compaction pressure and fiber volume fraction.
Grimsley et al. 8 monitored the change in thickness and pressure during the infusion stage of VI using three linear variable displacement transducers (LVDT) and three pressure transducers. Before the local resin pressure started to increase with time after the arrival of resin, a significant lubrication effect was observed especially on the thick preform (multiaxial non-crimp SAERTEX carbon fiber preform) by monitoring a rapid decrease in the thickness. Later, the saturated fabric started to spring-back and its thickness increased. 8 Under typical VI conditions, spring-back response dominates the effect of lubrication resulting in a thicker part than the pre-injected preform. The same setup was also used for the compaction characterization experiments by compacting the fabric at atmospheric pressure, and then, decompacting it in steps, resembling the VI process in quasi-static equilibrium condition. Characterization experiments on wet fabrics verified the lubrication effect seen in the VI experiment.
Li et al. 9 used RTM-based simulation for the resin flow, and developed a model for the post-filling stage to account for the effects of relaxation and curing. The model was based on Darcy’s law for resin flow and a power law for compaction. Thickness and permeability were updated after each time step in the RTM simulation using the calculated pressure values. The authors verified the model with VI experiments. The thickness variation at the end of the filling was 26% of the average part thickness whereas this variation decreased to 5.5% after the post filling stage.
Modi et al. 10 analyzed pressure distribution and fill time for 1D linear and 2D radial flows. The pressure values were lower than the analytical values in the RTM process in the early stages of the infusion. As the flow developed, the pressures increased and exceeded the corresponding RTM values in both 1D and 2D flows.
Tackitt and Walsh 11 used 5 × 5 array of LVDTs to monitor the change in the part thickness during VI. Two types of fabric (felt and S2-glass) were used in both line and point injections. Nesting of the fibers due to the lubrication effect was not observed in the felt significantly, but it was observed in the S2-glass fabric, depending on the flow rate applied. The higher the flow rate at a location, the higher the change in part thickness due to the lubrication effect. For example, the least significant nesting was observed near the ventilation port where the flow rate was the lowest in the mold. Points near the inlet also showed an insignificant lubrication effect because of rapid increase in the resin pressure (and thus decrease in the compaction pressure) after being wetted when the resin flow front reached there. In other words, the increase in the thickness due to decompaction dominated the decrease in the thickness due to the lubrication effect.
Govignon et al. 12 implemented digital speckle stereophotogrammetry (DSS) for monitoring thickness change in a planar 2D mold. The lubrication effect was observed in all experiments; it was significant especially on preforms made of continuous filament random fabric layers. A distribution medium placed on the preform decreased this effect due to the slow through-thickness flow compared to the in-plane flow. Monitoring of filling and post-filling stages revealed that there was a large difference in thickness distributions at the ends of the two stages. To address this issue, Govignon et al. 7 used finite element method for pre-filling, filling and post filling stages. In their model, empirical piecewise power law was used by interpolating different stages of their characterization experiments to model the compaction behavior. Different post-filling strategies were presented to study the effects of vacuum pressure and “brake material” (which was placed between the end of the preform and the vent to slow down the resin flow and thus to increase the saturation in the part).
Bayldon and Daniel 13 modeled the lubrication effect by performing dry and wet compaction characterization experiments separately, and then using them before and after the resin arrival to a location. Dry fabric data is used when the local saturation is zero (i.e., the fabric is dry); wet fabric data is used when the saturation is 100% (completely wetted fabric) and a linear interpolation is used between the two data set for partially saturated case in the vicinity of the flow front.
Yenilmez et al.
2
performed compaction characterization experiments on random fabric preforms with an embedded distribution medium (polypropylene). Unlike the previous experiments in the literature except Govignon et al.’s,
7
they investigated the specimen thickness (h) as a function of the compaction pressure (
Since only one type of fabric was considered, and fiber relaxation experiment was conducted at a particular minor compaction stress of 8 kPa, study by Yenilmez and Sozer
1
could not answer the followings: (1) Is the lubrication effect observed in all fabric types? (2) Can the fiber relaxation at
Yenilmez and Sozer
1
revised the procedure by performing the fiber relaxation on separate specimens at different compaction pressures of 80, 60, 40, 20, 10 and 2 kPa. This approach was important since the fiber preform used in VI is compacted at different levels depending on the location of the preform. For example, the compaction pressure is the highest at the exit region near the vent, and the lowest at the inlet region near the injection gate; thus different levels of fiber relaxation are expected. h decreases with time ( Schematic of the VI experimental setup with five pressure sensors and five thickness measurement sensors to measure the pressure of the medium, Pi(t) and part thickness, hi(t), respectively. The sensors are located at x = 20, 80, 140, 200 and 260 mm, and the part has a length of Lx = 360 mm.
The major contributions of this paper are as follows: (1) to use “fiber relaxation” characterization data 1 (by measuring the thickness while keeping the pressure constant) to investigate the viscoelastic behavior of fiber preforms at different levels of compaction pressure; (2) to implement the lubrication effect data 1 (sudden decrease in h when the preform is wetted) in compaction model; (3) to illustrate how to use compaction characterization data (in the form of a lookup table) in a coupled flow and compaction model and (4) compare the static (i.e., elastic behavior during unloading stage) and viscoelastic (during unloading and relaxation stages) thickness data along with the experimental VI data.
Objective
The main objective of this study is to compare different coupled models of resin flow and preform compaction with the results of the VI process; and then explain how a compaction characterization experiment should be designed for e-glass fabric preforms as done in Reference [1] (and also similarly and independently in Govignon et al. 7 ). The coupled model with that data should be straightforward to use and yet it must represent the VI process appropriately by observing all of the following important behaviors: (1) fiber nesting due to lubrication after resin arrival, (2) thickening due to decompaction and (3) fiber relaxation with time which have orders of magnitude variation in thickness change corresponding to the compaction pressure range (0–100 kPa) in a typical VI application.
VI experiments were conducted on random, woven and biaxial fabric preforms embedded with a distribution medium. The changes in part thickness
Compaction models
C2 uses “unloading” stage alone; and C1 uses both “unloading” and “relaxation” stages of the compaction database that had been constructed in Reference [1] as a lookup table for
Flow models
In F1, the resin pressure
Experiments
Experimental setup, fiber preform, distribution medium and resin
The schematic of the experimental setup is shown in Figure 1. Flat panels with in-plane dimensions of 360 × 100 mm were manufactured in VI process. An Alcatel Pascal 2010 SD vacuum pump was connected to the vent to apply vacuum. The vacuum pump is connected to an SMC IRV2000 regulator for pressure control. The vacuum pressure was set such that VI Experimental results for 
Sensors
Five Microsensor MPM280 pressure sensors were used to monitor the pressure distribution at x = 20, 80, 140, 200 and 260 mm. These sensors provide an operational range of 0–100 kPa with an accuracy of ±0.3 kPa. Each sensor was placed 60 mm apart. Five Omron Z4M-W40 laser displacement sensors were used for non-contact monitoring of the change in the thickness (
An NI PCI-6035E data acquisition card with 200 kS/s, 16-bit and 16 analog input was used for the thickness measurement of the laser displacement sensors. A custom-programmed Microchip PIC 18F4550, Delta-Sigma 14-bit ADC data acquisition card with an acquisition rate of 100 S/s was used for the pressure sensors.
Fiber preform and distribution medium
In all experiments, three types of fiber preform [random (R), woven (W) and biaxial (B)] with an embedded distribution medium [polypropylene core (C)] were used. Each preform was prepared with eight plies of e-glass fabrics and two layers of distribution medium: 2F/1C/4F/1C/2F where F stands for an e-glass fabric ply and C stands for an embedded distribution medium. In each preform layup, all plies were stacked such that the roll direction of the fabric is the width direction of the preform. Compaction characterization of each preform had been performed in our previous study,
1
and its unloading and relaxation database will be used in this study. Brand and superficial density data of each single ply is given as follows:
Random (R): Fibroteks, 500 g/m2; Woven (W): Fibroteks plain weave F50, 500 g/m2; Biaxial (B): Metyx LT850 E10D stitched, 860 g/m2; Polypropylene distribution medium, core (C): Metyx Meticore 250 PP, 250 g/m2.
Resin
Poliya Polipol 337 polyester was used in all experiments. It is a DCPD hybrid type unsaturated polyester with a viscosity of 0.190 Pa.s at 20℃.
Experimental results
The change in part thickness, VI Experimental results for VI Experimental results for The change in specimen thickness during a typical compaction characterization experiment for 2R/1C/4R/1C/2R preform. During the relaxation stage, h increases with very high rate when the compaction pressure is relatively low (2 kPa in this case) at the end of the unloading stage. Re-printed with permission from Ref [1], copyright 2009 Elsevier.


Model
Coupled model of flow (F1) and compaction in VI
Correia et al. 14 investigated the coupled model of resin flow and fiber compaction for 1D flow in the VI process. The spatial variation in the resin pressure affects the compaction of the fiber preform, and thus the part thickness is not constant which is dissimilar to RTM. The fiber volume fraction decreases and permeability of the fiber preform increases as the part thickness increases. The changes in the thickness and permeability cause the resin velocity to vary along the flow direction, and it results in a nonlinear resin pressure distribution along the flow direction as demonstrated in their study.
The conservation of mass in a control volume element is given by Correia et al.
14
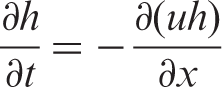



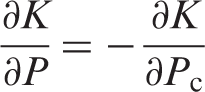
Correia et al.
14
used empirical power law fit to relate the fiber volume fraction

They used Kozeny-Carman equation to relate the permeability to fiber volume fraction:

The constants A, B and k in equations (6) and (7) are calculated by using compaction and permeability characterization experiments on the fiber preform specimens. Part thickness and fiber volume fraction are related as follows for uniform fiber preform structures:

Correia et al.
14
expressed

In this study, instead of using empirical equations (6) and (7), experimentally measured permeability values and a lookup table of compaction characterization experiments will be used, as detailed below.
Compaction/settling/wetting/decompaction/relaxation database
The major contribution of our previous study
1
was to design and conduct a compaction characterization database for the three types of fiber preforms such that the characterization procedure mimics the VI process knowing that the characterization data will be used to model and simulate the coupled flow and compaction of the VI process. A “loading/settling/wetting/unloading/relaxation” (a.k.a. “compaction/settling/wetting/decompaction/relaxation”) characterization cycle on a specimen was designed to measure the thickness of the fiber preform at different stages of the VI process:
Initially, Pc is set to a minor pressure of 5 kPa. Dry loading: Dry fiber settling: dry fiber nesting is allowed at Wetting: fiber preform is impregnated with resin in less than 10 sec at Wet unloading: Wet fiber relaxation: by using separate experiments on separate specimens, fiber relaxation due to viscoelastic behavior was investigated at
A typical h versus t is shown in Figure 5 for a random fiber preform. The loading and fiber settling stages correspond to the combination of (1) pre-injection vacuuming and (2) resin injection up to the time of resin arrival to a location. The wetting stage corresponds to the resin arrival to a location. The unloading and relaxation stages correspond to the post-resin arrival period (from the time of resin arrival to the end of resin injection, and then waiting for the resin gelation and cure). If post-injection resin bleeding is performed in VI by discontinuing the resin injection but still vacuuming from the vent to decrease the thickness variation, one should include that as a final stage of the characterization experiment to model the process appropriately. That stage may be characterized by adding re-loading and settling stages at the end of the cycle discussed above. The reader is referred to References [7,12,18,19] for post-filling studies to investigate the effect of the resin-bleeding and control strategies on the thickness variation.

Unlike some other studies16,17,20,21 in which the thickness was controlled and the compaction pressure was measured, Yenilmez and Sozer
1
mimicked the VI process and measured the thickness by controlling the compaction pressure. This is true for both unloading and relaxation stages. For example, the relaxation was investigated by measuring the change in thickness with time at constant compaction pressure of
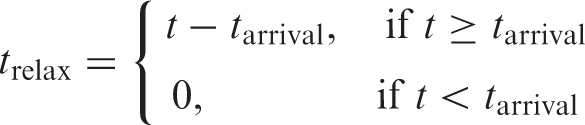
Figure 7 is the illustration of the unloading/relaxation stages for the three types of fiber preforms which was generated using the database in Reference [1]. To emphasize the sudden change in the thickness (usually referred as spring-back) due to viscoelastic behavior at low compaction pressures, the relaxation time axes in that figure were taken between 0 and 1 min only. The actual database extends up to 15 min of relaxation time. Using an interpolation between 2 and 80 kPa, and an extrapolation between 0 and 2 kPa, and between 80 and 100 kPa, a lookup table was constructed for each of the three types of fiber preforms, and they are illustrated in Figure 7. For a particular pair of independent variables Graphical illustration of the fiber unloading/relaxation database.1 The unloading (decompaction) stage (where the compaction pressure is reduced from 100 kPa to Pc with constant dPc/dt) is discontinued at trelax = 0 and then the compaction pressure is kept constant at Pc for the three fabric preform types: (a) Random (2R/1C/4R/1C/2R), (b) Woven (2W/1C/4W/1C/2W) and (c) Biaxial (2B/1C/4B/1C/2B).
Permeability characterization experiments
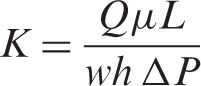
One-dimensional permeability measurement experimental setup with adjustable mold gap was used to measure K along the resin flow direction at different thicknesses. The setup allows us to measure a continuous set of steady permeability values at different fiber volume fractions on the same specimen. A transparent acrylic mold lid allows to monitor if no racetracking channel exists and thus ensure that the transient resin flow is 1D for the validity of the experiment. Clamps are adjusted to uniformly compact a specimen to a desired thickness. The rubber seal allows creating a wide range of mold gap such that no significant interference exists between the seal and the specimen or no possible racetracking channel is formed. The reader is referred to Reference [2] for the details of the experimental setup and its use. The plies were cut and placed in the characterization mold in the same direction as in the VI mold, such that 1D resin flow was along the weft direction of the woven fabric, and also consistently in the same direction of the plies cut from the random and biaxial fabric rolls. The mold is filled completely and resin injection is continued afterwards by flushing it from the vent until the pressure difference between the inlet (gate) and exit (vent) reaches a steady value within the precision of the pressure transducer. The steady permeability value is calculated using Darcy’s law:
The permeability, K along the 1D resin flow direction (weft direction) of the fabric types used in this study. For each fabric type, one “continuous 1D permeability measurement experiment” was conducted on each of the three separate specimens. The thickness domains correspond to the decompaction database (see Figure 7) during the unloading and post-unloading fiber relaxation stages of VI.

Numerical solution of the coupled model
A coupled process model is formed by using either one of the flow (F1 or F2) and one of the compaction (C1 or C2) models together:
Simulated pressure distribution for the three types of fabric preforms using Correia et al.'s model14 in which the unloading stage of the compaction database1 was used. P - Plinear was also plotted to clearly see the deviation of the simulated pressures from the linear distribution which corresponds to 1D resin flow in a channel with a constant thickness as in the RTM process.
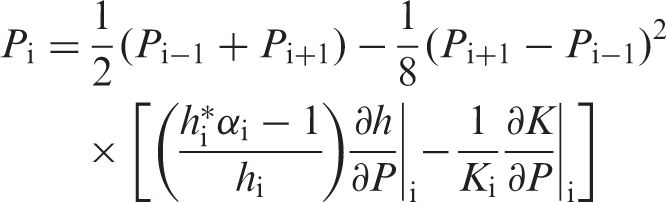
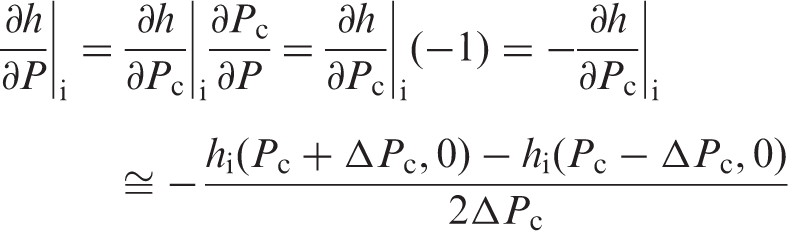


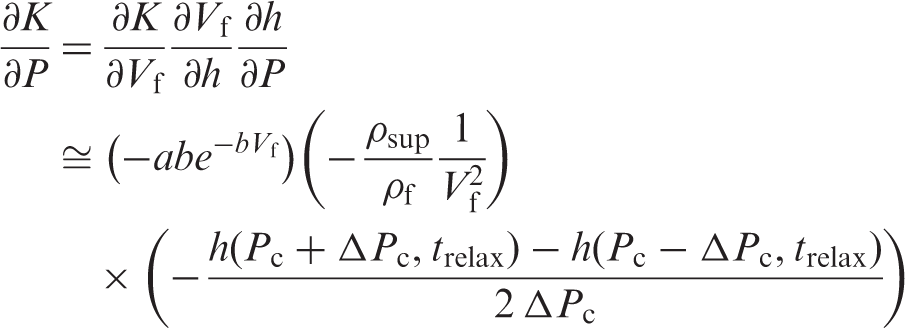
The following algorithm for the numerical solution was applied to solve P, h and K distributions in the resin-covered region:
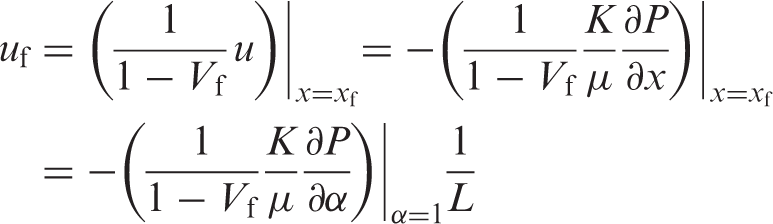
Initially, the first three nodes are assumed to be covered with resin. P is calculated in the resin covered region using the coupled model chosen (either one of F1 or F2). In the dry region ( Flow front velocity is calculated assuming 1D Darcy’s flow:
The flow front is advanced with a time-marching Eulerian method using a time step of
Steps 2–6 are repeated until the flow front reaches the end of the mold,
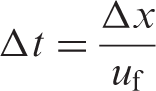

Comparison of the experimental and simulated results
The evolutions of the change in part thickness, During the post-impregnated stage, the order of magnitude of The lubrication effect was experimentally observed to be significant in the random preform, less significant in the biaxial preform and close to zero in the woven fabric (see Figures 2–4). This is in good agreement with the experiments in References [1,2]. For the first three sensors, Recalling that the compaction characterization database
1
was constructed by compacting a dry specimen, then quickly wetting it just before the unloading and fiber relaxation stages by mimicking the VI process, all three models using this database validated the lubrication effect observed in the VI experiments. In those simulations, a significant instantaneous decrease in the thickness was observed for the random and biaxial preforms when the resin flow front arrived at a location (sensor location) and that part of the preform was impregnated with resin. The simulated results are The use of pressure and compaction data in the three models The simulated and experimental thickness and pressure for The simulated and experimental thickness and pressure for The simulated and experimental thickness and pressure for
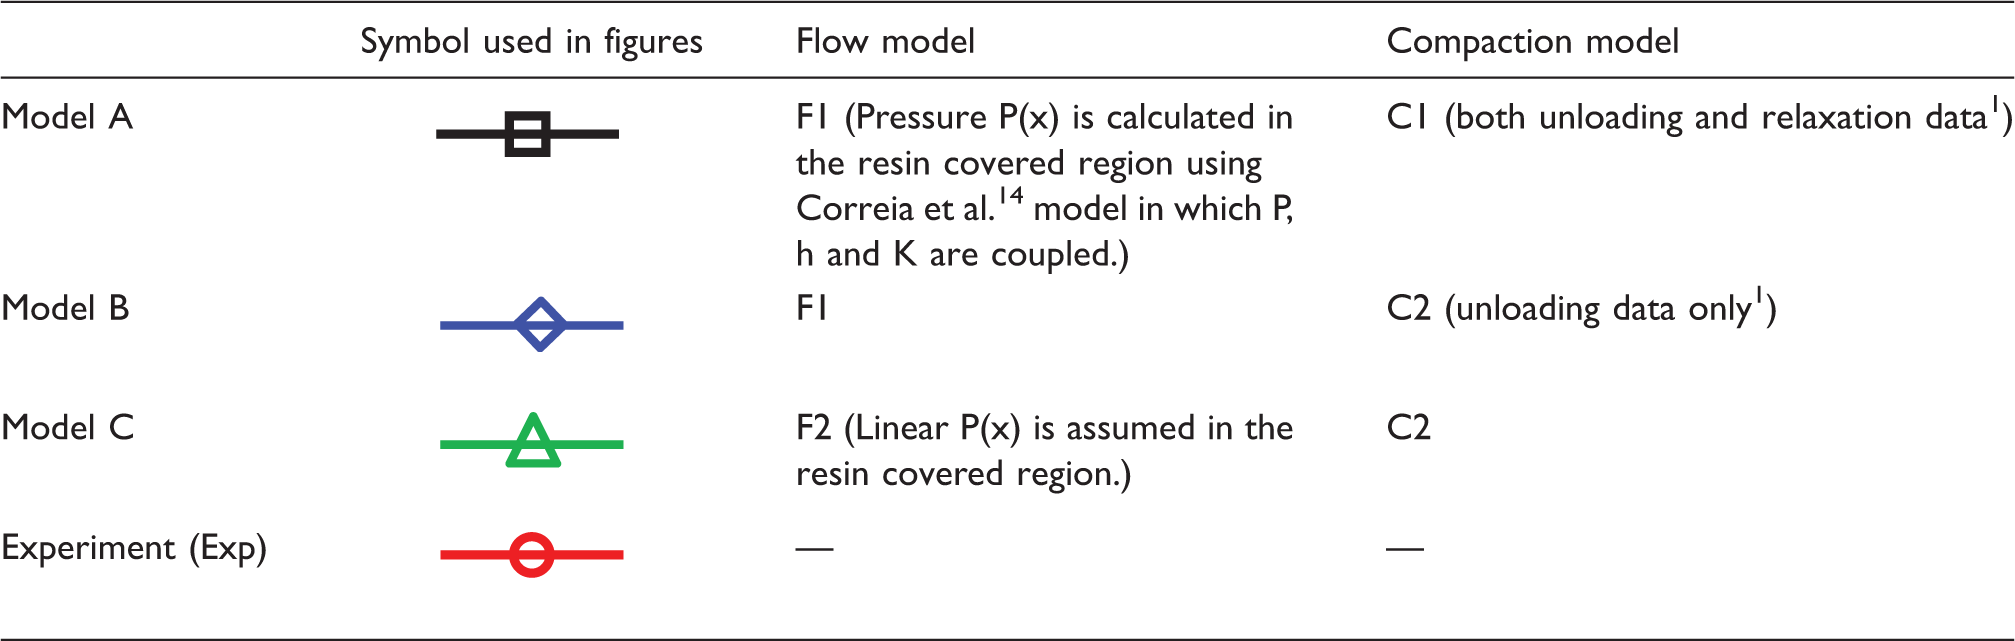


Although none of the model results (A, B and C) is accurate when they are compared with the experiments during the post-impregnated stage (unloading and relaxation stages), there is a good qualitative agreement between the models and the experiments when the trends in
Conclusions
In VI, varying resin pressure affects the compaction pressure on the vacuum bag, and thus it causes an undesired and nonuniform change in the part thickness,
To capture the rapid decrease in the thickness due to the lubrication effect when the flow front arrives at that location, a compaction characterization experiment should be designed as in References [1,2] such that a dry specimen should be first compacted, then impregnated quickly just before it is decompacted by mimicking the VI process. Not all fabric types exhibit this behavior; in this study, the lubrication effect was observed in the random and biaxial preforms, but not in the woven. All three models were used this database, and they all successfully validated the VI experiments.
Even without using a process model and just based on experience, one can predict that the maximum
Footnotes
Funding
This research received grant from TUBITAK (The Scientific and Technical Research Council of Turkey) for MAG-104M290 “Automated Manufacturing of Composite Materials by Solving the Issues of RTM and VI Processes” at Koc University, Istanbul, Turkey.
Conflict of interest
None declared.
Acknowledgements
The authors thank the following companies for their support in this work: Poliya Composites and Polymers, METYX Composites.