
Abstract
A phenomenological study was carried out on laminated carbon fibre-reinforced polymer composites subjected to constant amplitude fatigue loading. Visualization of damage progression was performed using a high-resolution Skyscan micro-computed tomography unit which provided detailed information on propagation of initially occurring cracks throughout fatigue life at specific intervals. Quantitative analysis of image sequences of virtual cross-sections throughout the three orthogonal planes of the sample resulted in defining fatigue crack growth rates, da/dn for each plane, which was interpreted in terms of the three damage modes: opening (mode I), in-plane shear (mode II) and out-of-plane shear (mode III). By applying linear elastic fracture mechanics laws, strain energy release rates were calculated and then used in a cohesive zone model formulation to define model parameters. Considering a bi-linear triangular cohesive zone model curve, maximum traction and maximum separation were calculated for each of the three damage modes, differentiating between modes II and III in a novel manner.
Background
Advanced laminated carbon fibre-reinforced polymers (CFRP) composites continue to replace metal parts in aircraft structures 1 to improve fuel efficiency, reduce airframe weight and lower part numbers. In order to maintain flight safety, progressive damage in critical parts commonly experiencing constant or variable amplitude fatigue loading are required to lie within standards of damage tolerance requirements for composites, 2 hence increasing the necessity of accurate damage prediction methods.
Propagation of existing cracks in materials subjected to fatigue loading is conventionally studied using Linear Elastic Fracture Mechanics (LEFM) and the well-known Paris law in which crack propagation rate is directly proportional to strain energy release rate in a linear relation. Published expressions of Paris law for composites which account for contribution of both fracture modes I (opening) and II (in-plane shear) were summarized by Blanco et al. 3 The contribution of mode III (out-of-plane shear) was found to be negligible in most studies.3–5 Another approach, the Virtual Crack Closure Technique (VCCT) was introduced by Singh and Talreja. 6 VCCT is an energy-based model in which it is assumed that the work done to open new cracks between the previously existing cracks is critical to initiate cracks in other plies by crack sliding displacement. However, the assumption of symmetrical crack propagation associated with this technique limited its popularity in addition to the commonly encountered condition in both LEFM and VCCT laws of defining a pre-existing crack length.
Defining failure criteria in textile composites had been extensively studied by applying continuum models, of which studies gained considerable reliability.7–13 These criteria were implemented for simulating failure scenarios using finite element analysis (FEA) software. However, they have a limited perspective of predicting microscopic evolution of arbitrary cracks or their complicated interacting mechanisms leading to their progression as noted by Talreja and Singh. 14
Tracing the microscopic initiation of arbitrary cracks during fatigue testing of CFRP laminates and quantitatively defining their coordinates and length is a cumbersome and time-intensive task if carried out manually and, to the authors’ knowledge, the automation of this task had not been thoroughly addressed in literature. Published experimental results, mainly for propagation of an artificially embedded delamination crack, provide data for Paris-type damage characterization caused by static loading under mode I, investigated using the Double Cantilever Beam (DCB) test, 15 mode II studied by the End Notch Flexure (ENF) test 16 or a mix of both modes studied by the Mixed-Mode Bending (MMB) test for static loading 17 and fatigue loading.3,18 Mixed-Mode End-Loaded Split (MMELS) test was also used for fatigue loading. 3
To overcome the difficulties in experimental data acquisition, analytical models have been developed to predict the growth of cracks and reduce the costly testing. Cohesive zone model (CZM) formulation was used for addressing fatigue damage propagation using quasi-static laws in conjunction with a fatigue damage degradation factor, owing to the fact the no procedures were specifically designed for damage characterization caused by cyclic fatigue loading featuring non-linearity. Within this context, Harper and Hallet 4 developed a fatigue law in which the traction-separation response of the interface cohesive element was discretized in a degrading manner allowing computation of the updated strain energy release rate corresponding to the rate of fatigue propagation. Another approach was used by de Moura et al. 19 who performed fatigue analysis on carbon-epoxy composite bolded joints by adopting a data reduction scheme that only needs to use the varying displacements recorded during fracture testing to estimate an equivalent crack length and consequently the strain energy release rate. As a general practice, an initial crack length should be defined.
Optical microscopy is often used to analyze the visible surface cracks in materials, considered to be a destructive testing (DT) method. As the term implies, the method involves a procedure of cutting the sample and preparing it for testing, which normally damages part of the internal architecture. Alternatively, non-destructive testing (NDT) methods are used in assessing the microscopic structure of composites, where manufacturing quality and in-service inspection are conducted routinely using acousto-ultrasonics (AU) that is ultrasonic characterization combined with acoustic emission (AE) monitoring (a mechanical vibration technique), shearography (an optical technique) and infrared thermography (a thermal technique). However, they do not adequately provide microscopic data necessary for damage modelling. On the other hand, both X-ray micro-computed tomography (MicroCT) and N-ray neutron tomography (both employ radiation technique) are capable of creating cross-sections of a 3D-object that later can be used to recreate a virtual model. The difference between these two NDT radiographic methods is that the images in the former are based on X-ray attenuation properties while they are based on neutron attenuation properties in the latter, implying different resultant characteristics due to the different ray interaction with the sample material. In the MicroCT method, which was proved efficient by several researchers, X-rays are used to capture a large number of radiographic projections of the sample at different angular positions. By means of specific algorithms, it is possible to reconstruct the transverse sections, which are then stacked to obtain a volumetric representation of the sample and to visualize the internal structure. 20 Hence, the microCT tool was used for conducting this work for its documented efficiency and practicality in accessing the facility.
A number of researchers have used the microCT technique for different types of qualitative studies of damage, defects and internal structures in composites. It was employed for proving reliability in investigating damage,21,22 characterizing voids,23,24 assessing quality of resin impregnation during composites processing 25 and studying degradation due to ultra violet exposure. 26 Also, it provided a qualitative characterization of damage modes relative to the progressive fatigue load. 27 Synchrotron Radiation Computed Tomography (SRCT) was used for demonstrating an assessment of the density of micro voids relative to the number of fatigue cycles. 28 The same technique was used in quantitative analyses, in terms of interacting damage mechanisms, 29 varying displacements through the crack thickness and along its length 30 and for studying the distribution of fibre breaks 31 in notched samples subjected to tensile loading.
The objective of the present work is to perform a phenomenological study on CFRP notched sample subjected to constant amplitude cyclic fatigue loading until failure. Visual images were provided by a high-resolution microCT Skyscan 1173 to monitor the growth behaviour of physical cracks at prescribed intervals. These data were intended to provide quantitative information on interacting variables manipulating crack evolution which leads to a criterion defining the onset of arbitrary cracks. Further, geometry and locations of propagated cracks relative to the life cycle were statistically analyzed to obtain the damage growth trend. Strain energy release rates can hence be predicted by using available laws. The sought information will be mathematically implemented in a user sub-routine written for the ABAQUS finite element analysis tool to simulate the evolution and propagation of high-cycle fatigue loading, deferred to a future publication.
Material and methodology
The notched sample, Figure 1, was manufactured at the National Research Council (NRC) and cut by a water jet at the Science and Technology Centre at Carleton University. Material was unidirectional carbon fibre aerospace epoxy prepreg - DA409U/G35-150. Its nominal cured ply thickness was 0.375 mm with a nominal laminate density of 1.96 g/cm3 and estimated fibre volume fraction of 0.57. Tow count was 12 K and fibre density was 1.77 g/cm3. Dimensions were designed following the ASTM Standard D5766/D5766M,
32
where ratio of width/diameter was 6.2 and ratio of diameter/height was 1.3. The sample was of 177.8 mm length, 24 ± 1 mm width, 2 ± 0.03 mm notch radius and 3 mm thickness and the cross-sectional area was 72 mm2. Configuration featured a symmetric cross-ply laminate stacking sequence [0°/90°/0°/90°]s of 8 plies.
Sample dimensions.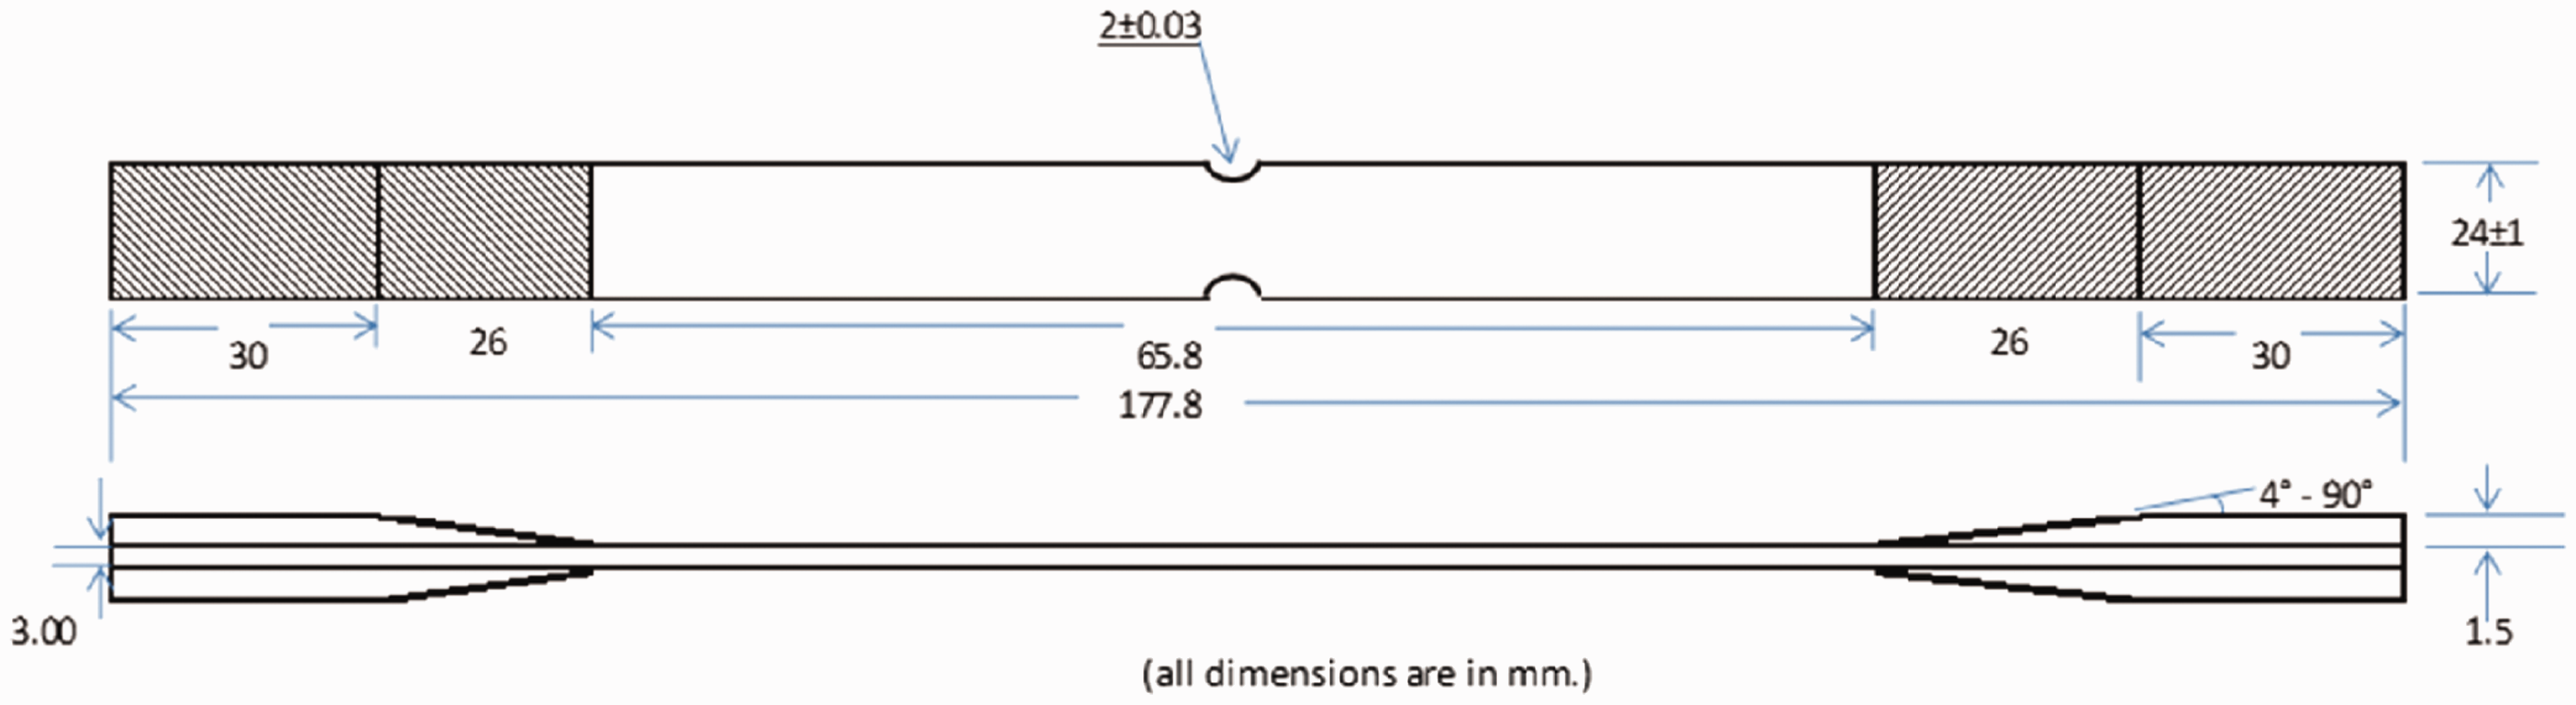
A static tensile test to failure was performed on one notched sample to provide an estimate of the tensile strength which recorded 450 MPa. The stress–strain relationship recorded during the static test is seen in Figure 2. Uniaxial constant amplitude fatigue testing was conducted in a load-control mode using a servohydraulic material test frame at a loading frequency of 10 Hz with a sinusoidal waveform. The minimum bandwidth was 10 f Hz, the minimum data rate was 50 f points/s and the standard deviation of noise level did not exceed 0.2%. The stress level was chosen by referring to properties of normalized Transport Wing Standard Load (TWIST) spectrum
33
on the wing during cruise flight, where the mean stress σm was = 6.93 MPa, amplitude σa = 1.53 MPa and R = 0.637. Hence, σmax was 8.46 MPa and σmin was 5.39 MPa. Factor of safety was 30, and by taking the cross-sectional area into account, the actual applied testing loads were Pmax = 18.3 KN and Pmin = 11.6 KN (tension – tension loading), with Pm = 15 KN and Pa = 3.3 KN. The sample was studied at seven phases of its fatigue life starting with the pristine state, then progressed with accumulated fatigue stress as it was subjected to 200,000 cycles, 400,000 cycles, 600,000 cycles 800,000, 1,200,000 cycles and 1,800,000 cycles. Axial strain was monitored using an extensometer recording an average of 0.018 mm/mm. Tests were performed at ambient temperature.
Stress-strain recorded during the composite static test.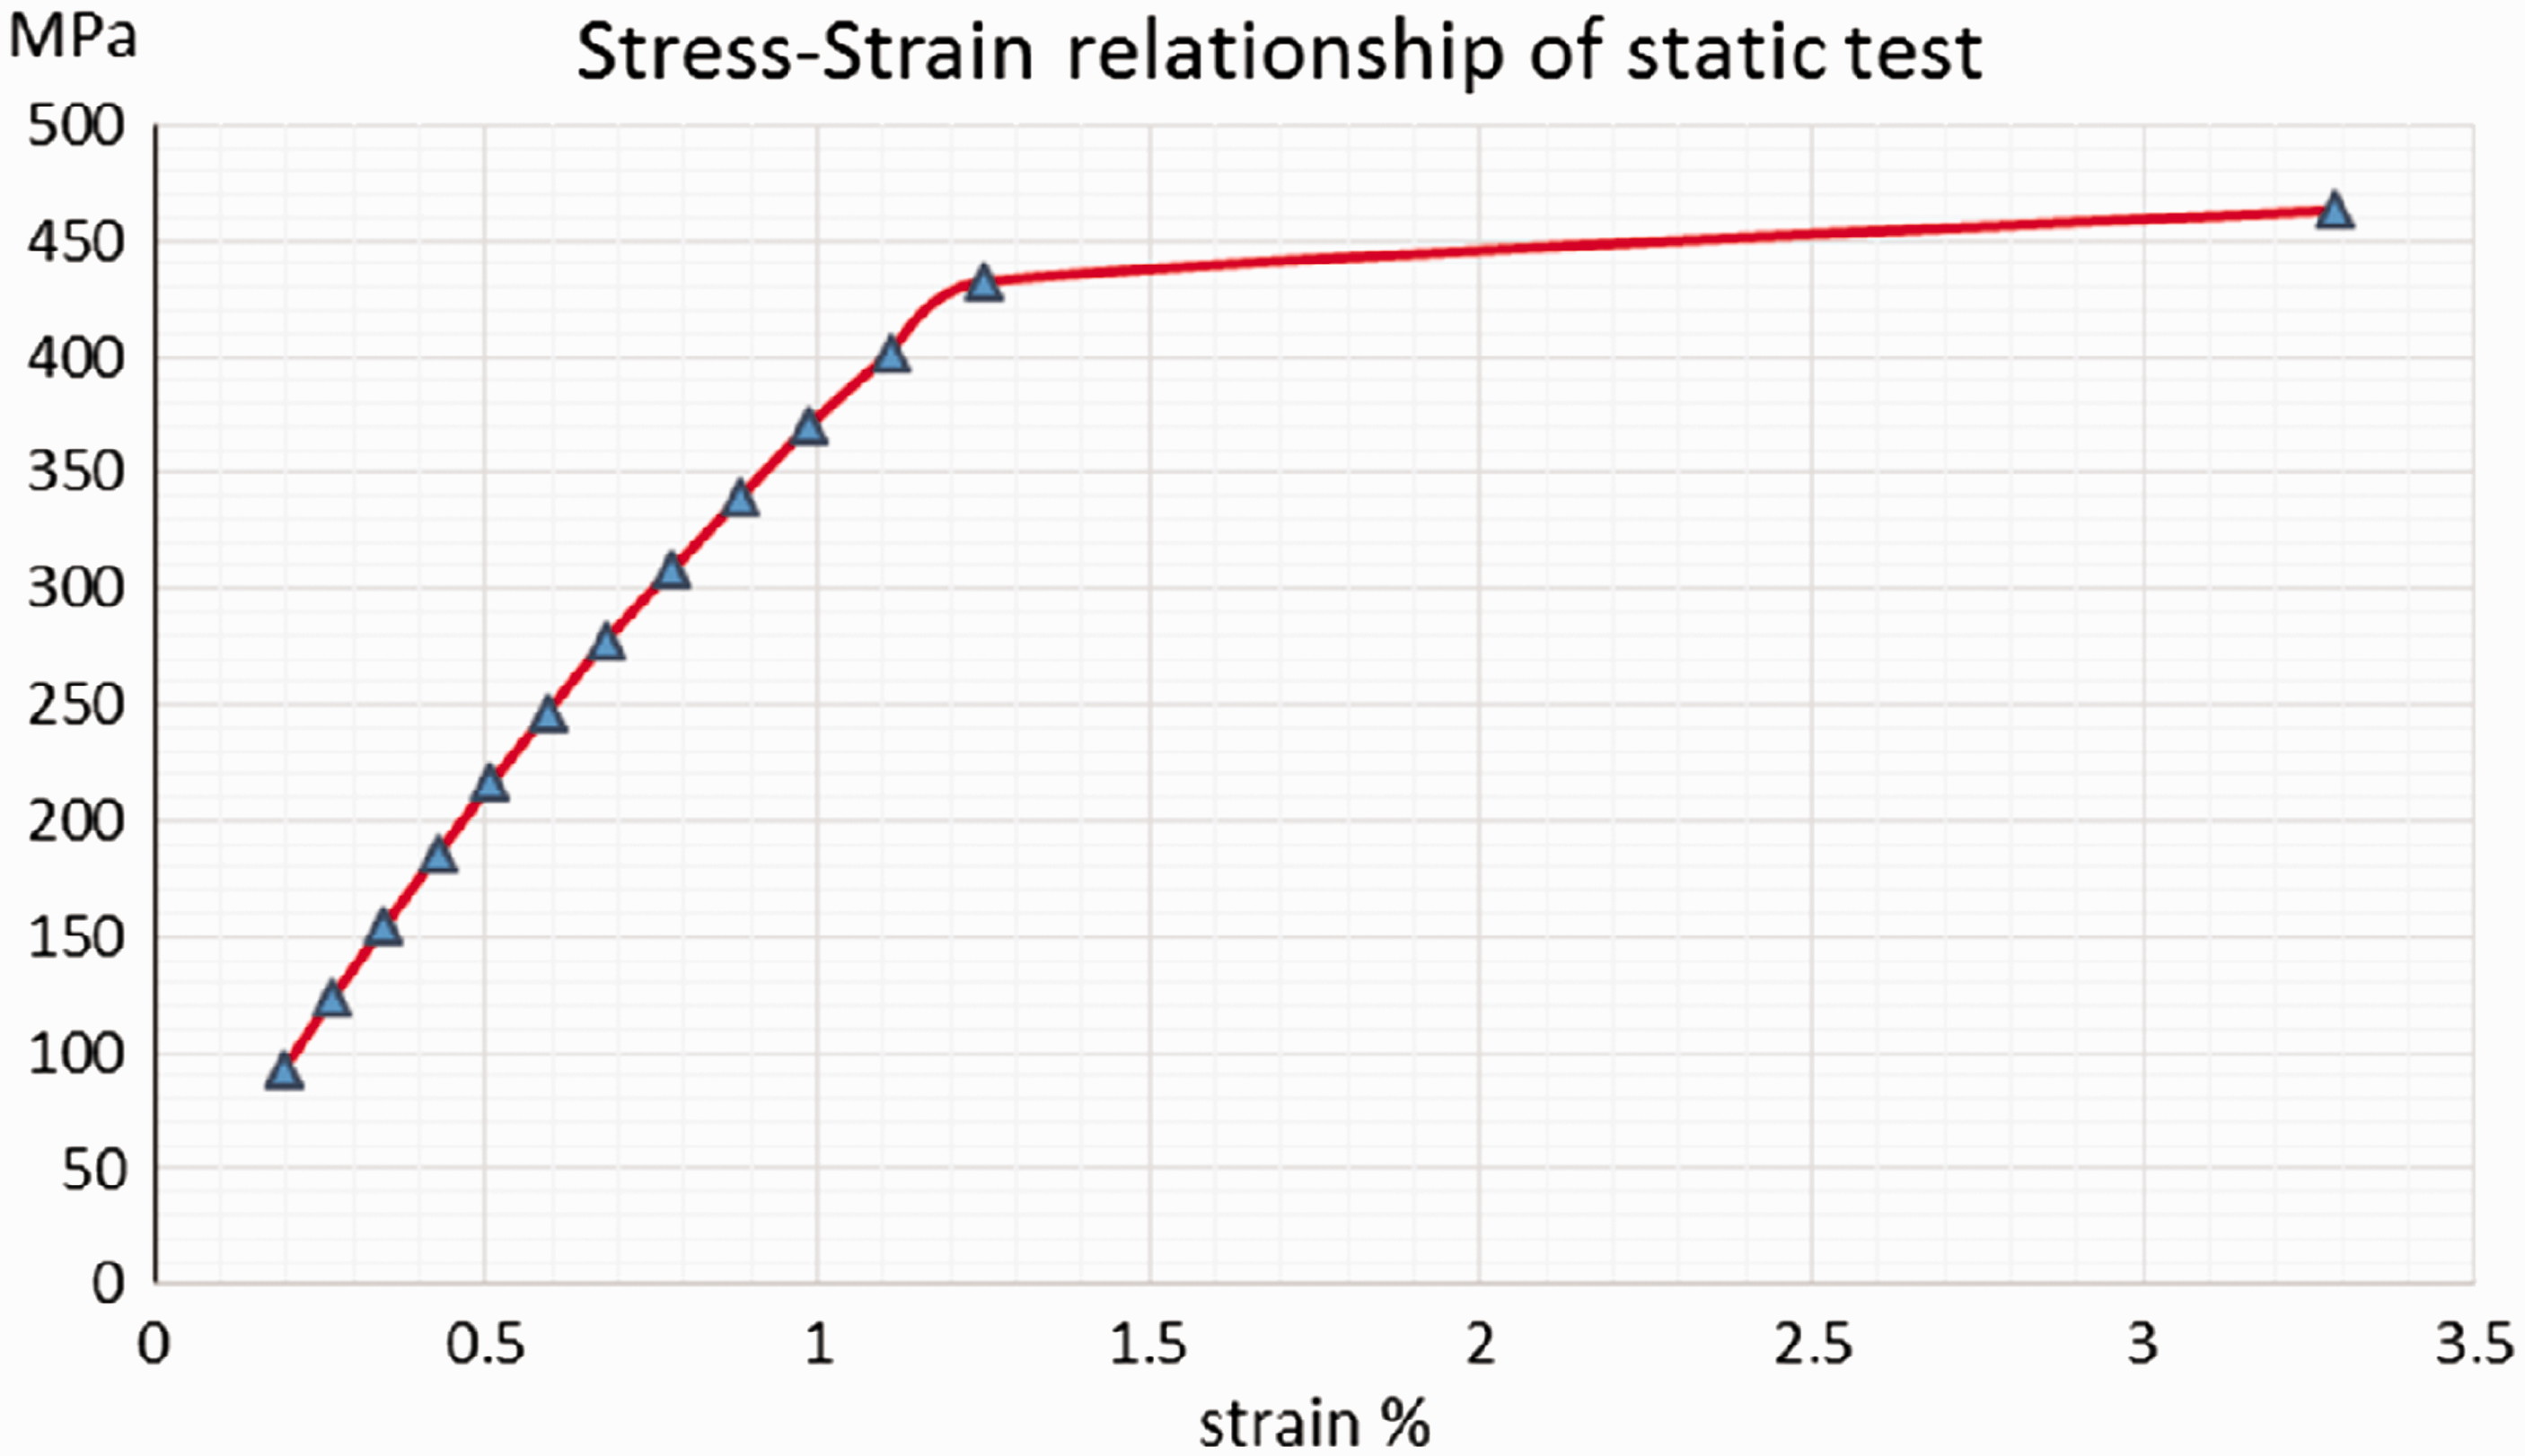
High-resolution scanning of the entire sample was performed on an ultra-high high-resolution SkyScan 1173 microCT in the Department of Earth Sciences at Carleton University with a camera pixel size of 50.0 µm, a source voltage of 70 kV and a source current of 114 µA. For each set of scans, the sample was rotated in the X-ray beam over 360° in 0.2° steps using 1-mm-thick aluminium filter. The thickness of each attenuation slice was 12.08 µm defining a spatial resolution of the 3D image of 12.08 µm per voxel, while image pixel size was 12.08 µm. Scanning time was approximately 2.6 h. A specific volume of interest (VOI) was selected for further investigation. This volume was selected to magnify the notched area where the sample was prone to damage due to the presence of stress concentrators. Images post-processing was performed using Skyscan (NRecon, CTan, CTvox and DataViewer) software. 34
Procedure
Image construction
Experimental results available in literature3,16–18 provide analysis of crack propagation that pertains to artificially embedded cracks. Conversely, in this work, it was possible, by the aid of high-resolution SkyScan 1173 micro-CT, to detect pre-existing manufacturing defects in otherwise pristine samples, as shown in Figure 3. Then, progressive non-destructive microscopic probing of damage throughout the sample thickness at seven intervals of its fatigue life were performed hence verifying the experimental data and providing a more robust scenario of damage progression. Simulation of scanned images using commercial FEA methods serves in validating the analytical models. A procedure for employing the available software tools for simulating micro-CT scans into ABAQUS was proposed by ElAgamy et al.
35
Ply layer thickness under microscope.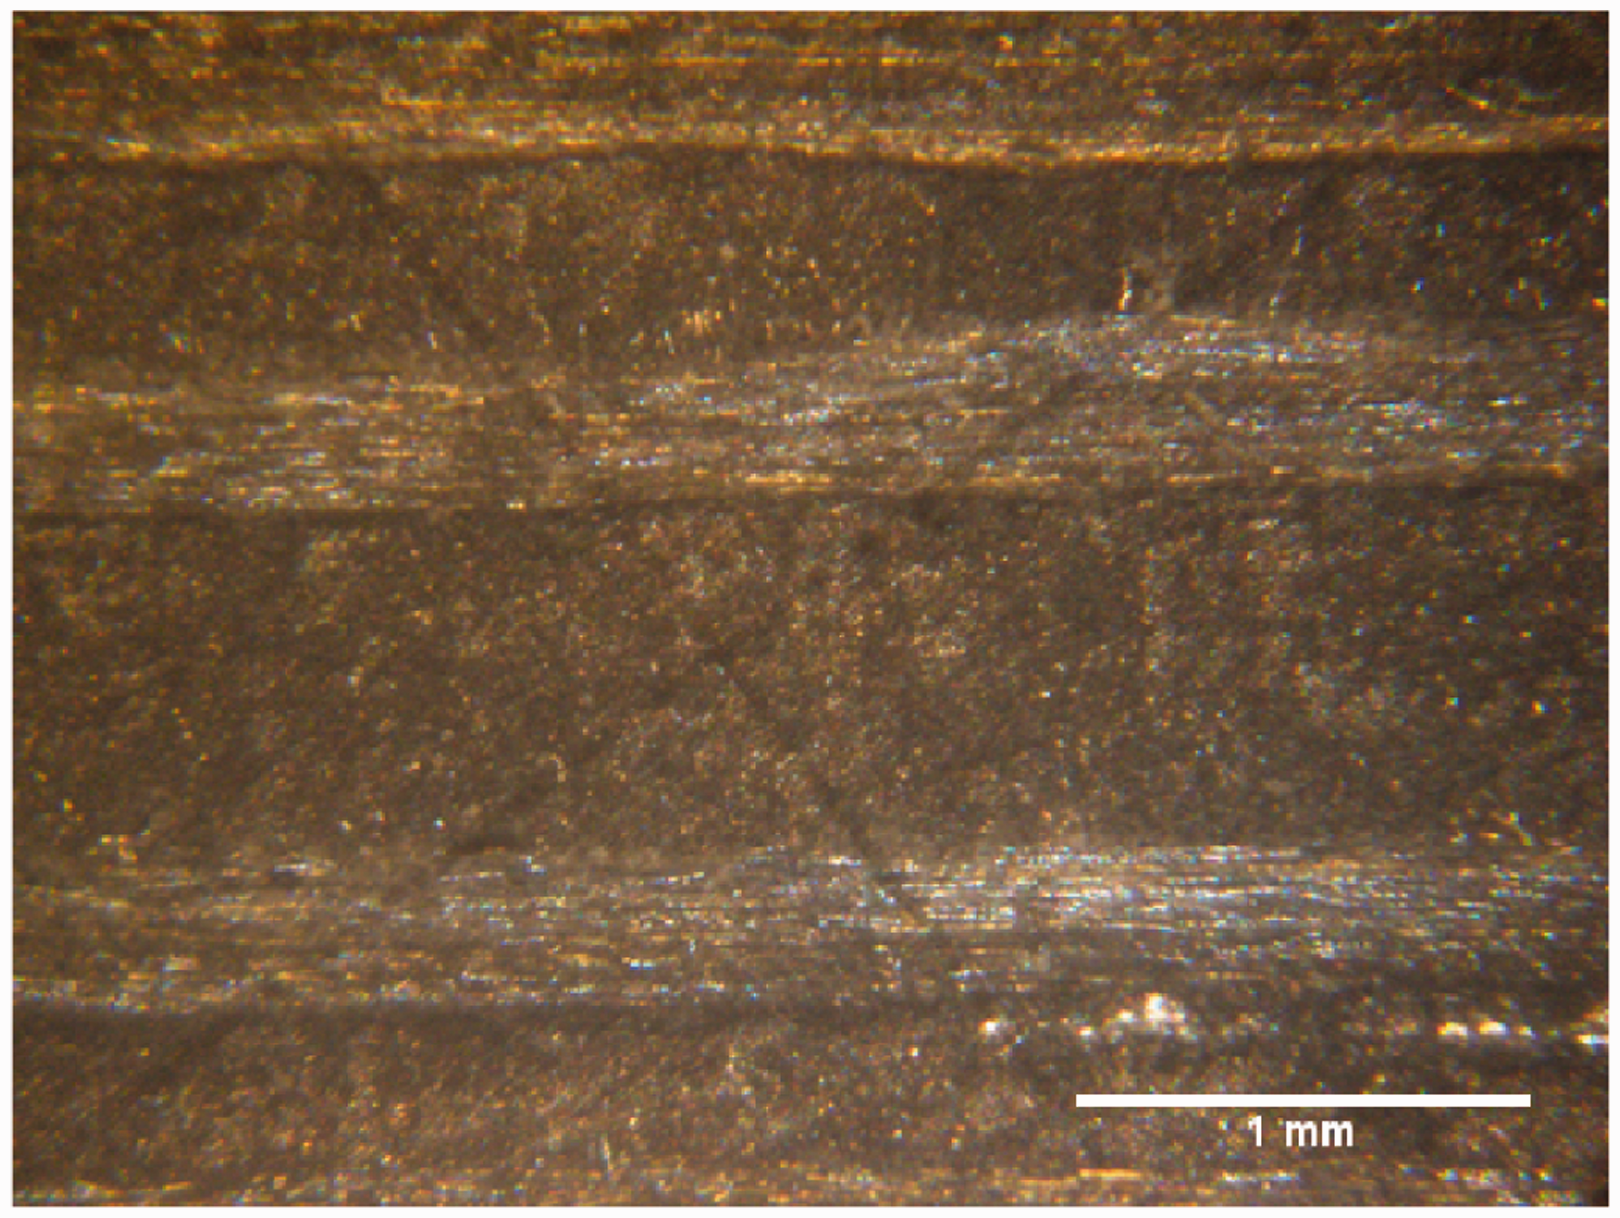
Acquired raw micro-CT scans, which consist of approximately 1900 radiographic images for each phase of fatigue life, were reconstructed using NRecon software resulting in 2D images of area 2240 × 2240 pixels then processed using CTvox software for building 3D reconstructions of typically 1024 × 1024 × 1024 voxels. By adjusting the opacity and light levels for rendered 3D reconstruction, the progression of damage was qualitatively assessed, Figure 4.
Rendered volume.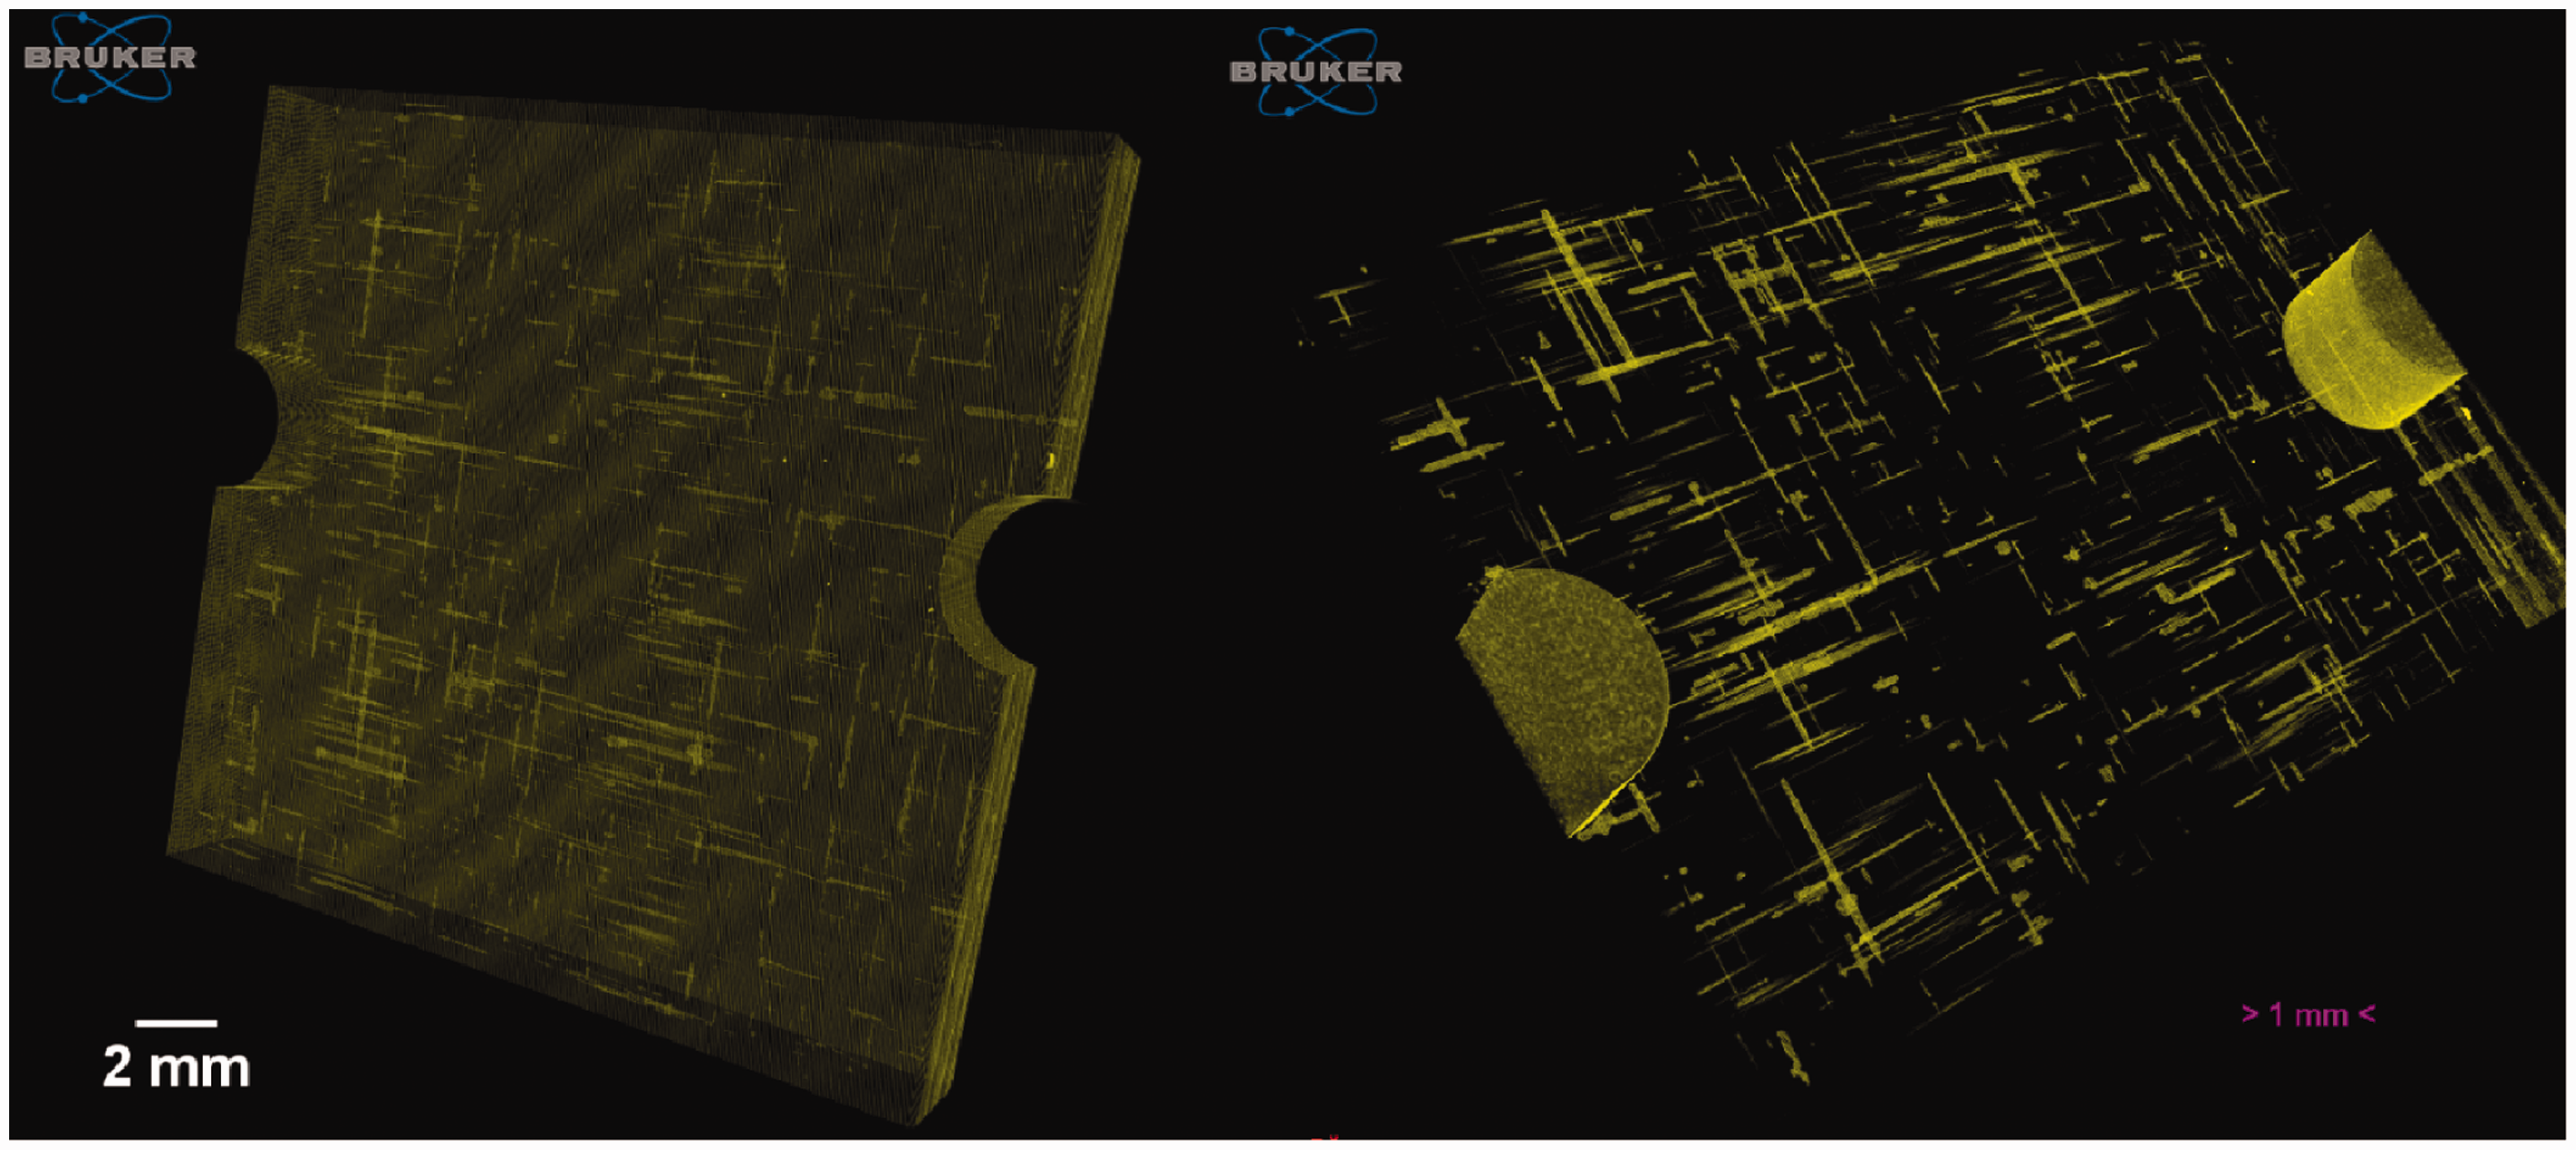
Using DataViewer software, image sets for each of the seven fatigue life phases were sliced over the three orthogonal 2D planes at 1 pixel intervals to provide sequences of cross-sections throughout the thickness. A VOI was defined for the area of highest stress concentration near the notches, seen in Figure 4, which identifies the three orthogonal planes. The VOI featured stacked images each of 1972 × 1370 pixels (23.82 mm × 16.55 mm) in the X-Z (coronal) plane, 224 × 1370 pixels (2.71 mm × 16.55 mm) in the Y-Z (sagittal) plane and 1972 × 224 pixels (23.82 mm × 2.71 mm) in the X-Y (transverse) plane. Hence, counts of cross-sections summed up 224 images of the X-Z plane, 1972 images of the Y-Z plane and 1370 images of the X-Y plane, Figure 5, for each of the seven phases.
Virtual cross-section of the sample in X-Y (transverse) plane clearly identifying the 0/90 layers.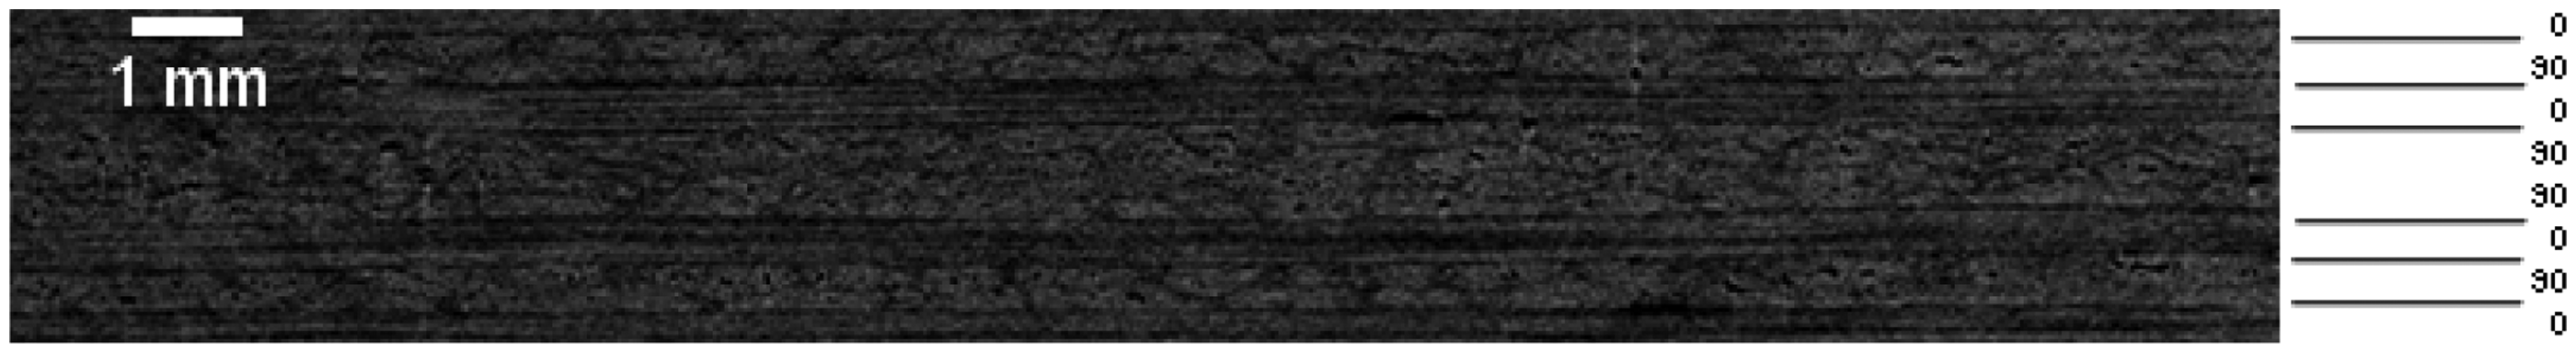
Segmentation
Segmentation is the process of applying a threshold to separate regions of different density levels or X-ray attenuation, in other words separate voids developed by damage, where the detected voids correspond to areas with little or no x-ray attenuation, i.e. black areas on the 2D image. ImageJ open-source software
35
was used to apply thresholds to the image sequences of cross-sections, where two threshold methods: minimum
36
and triangle
37
methods were visually selected and compared. The auto-threshold minimum method assumes a bimodal histogram which is iteratively smoothed using a running average of size 3, until there are only two local maxima. Considering pixels at coordinates (x,y), the threshold t is such that
36

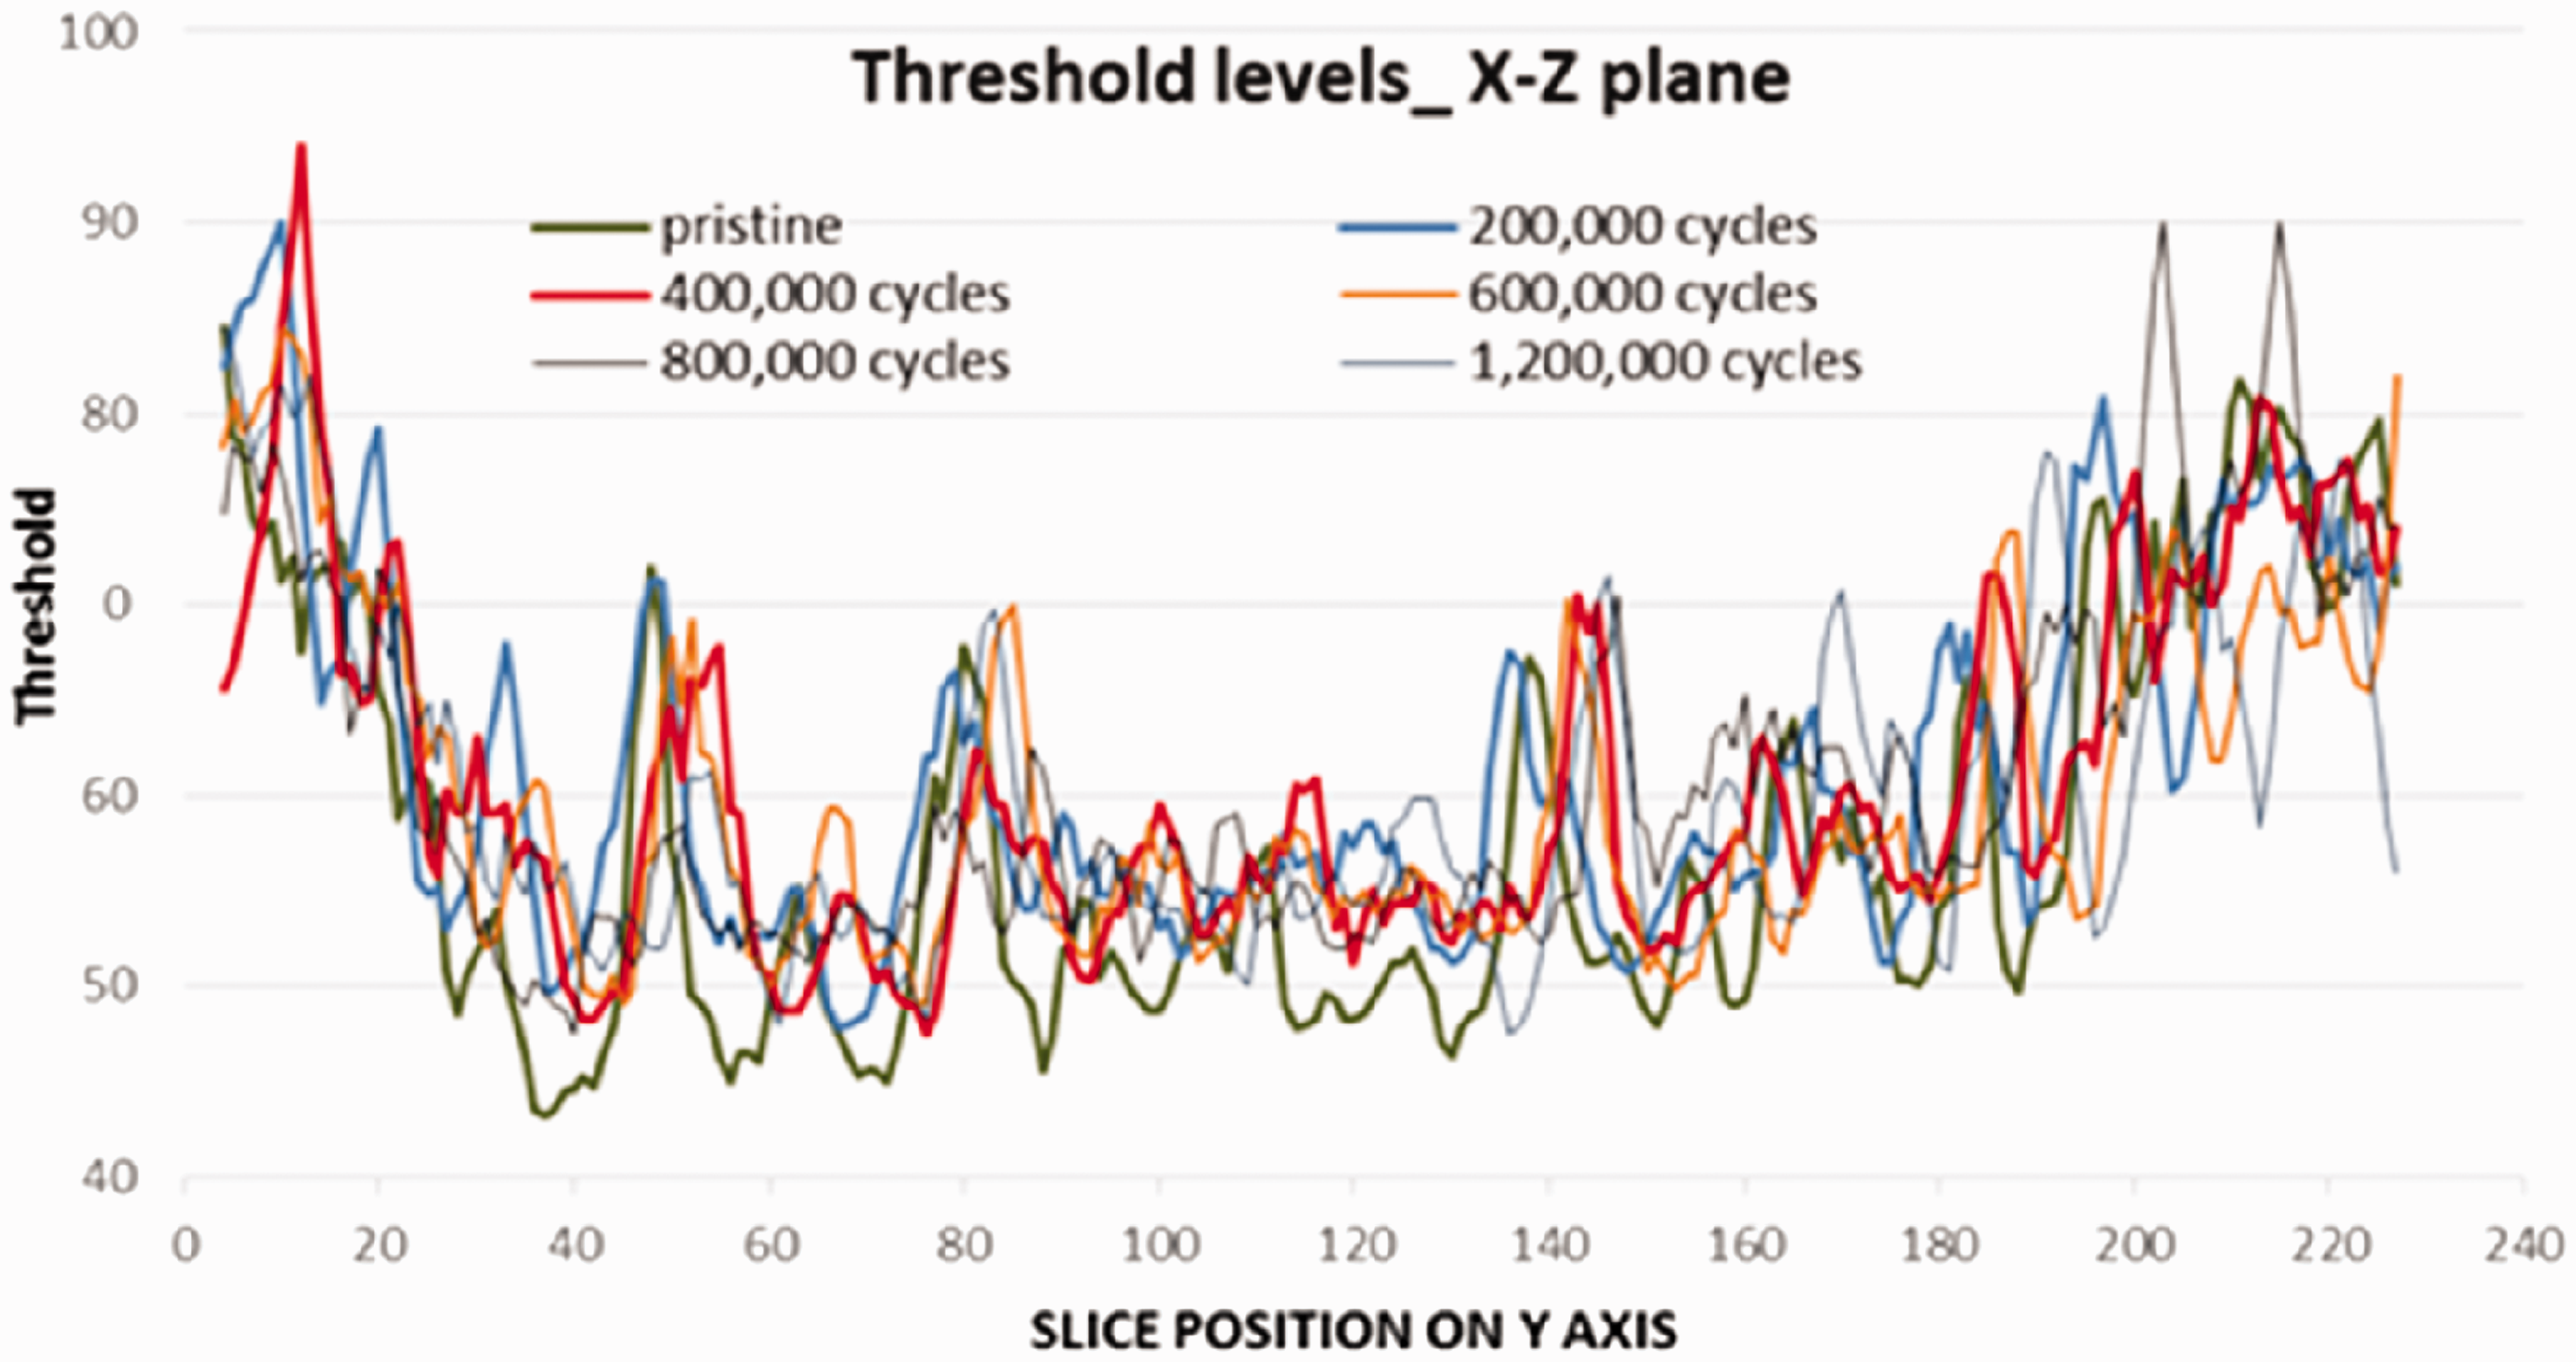
For the X-Z plane image sequences, the triangle auto threshold method resulted in noisy images, compared to more defined voids traced by applying the minimum auto threshold method, Figure 6. Given that the void areas in this plane are relatively large and their values were not considerably influenced by the threshold method, the latter method was selected for separating voids for the X-Z plane. Trends of the threshold levels used throughout the 224 images at fatigue life intervals were not significantly different, Figure 7.
Virtual cross-section image of X-Z plane (left), minimum threshold method (middle) and triangle threshold method (right). Minimum auto threshold levels for stages of fatigue life in the X-Z plane.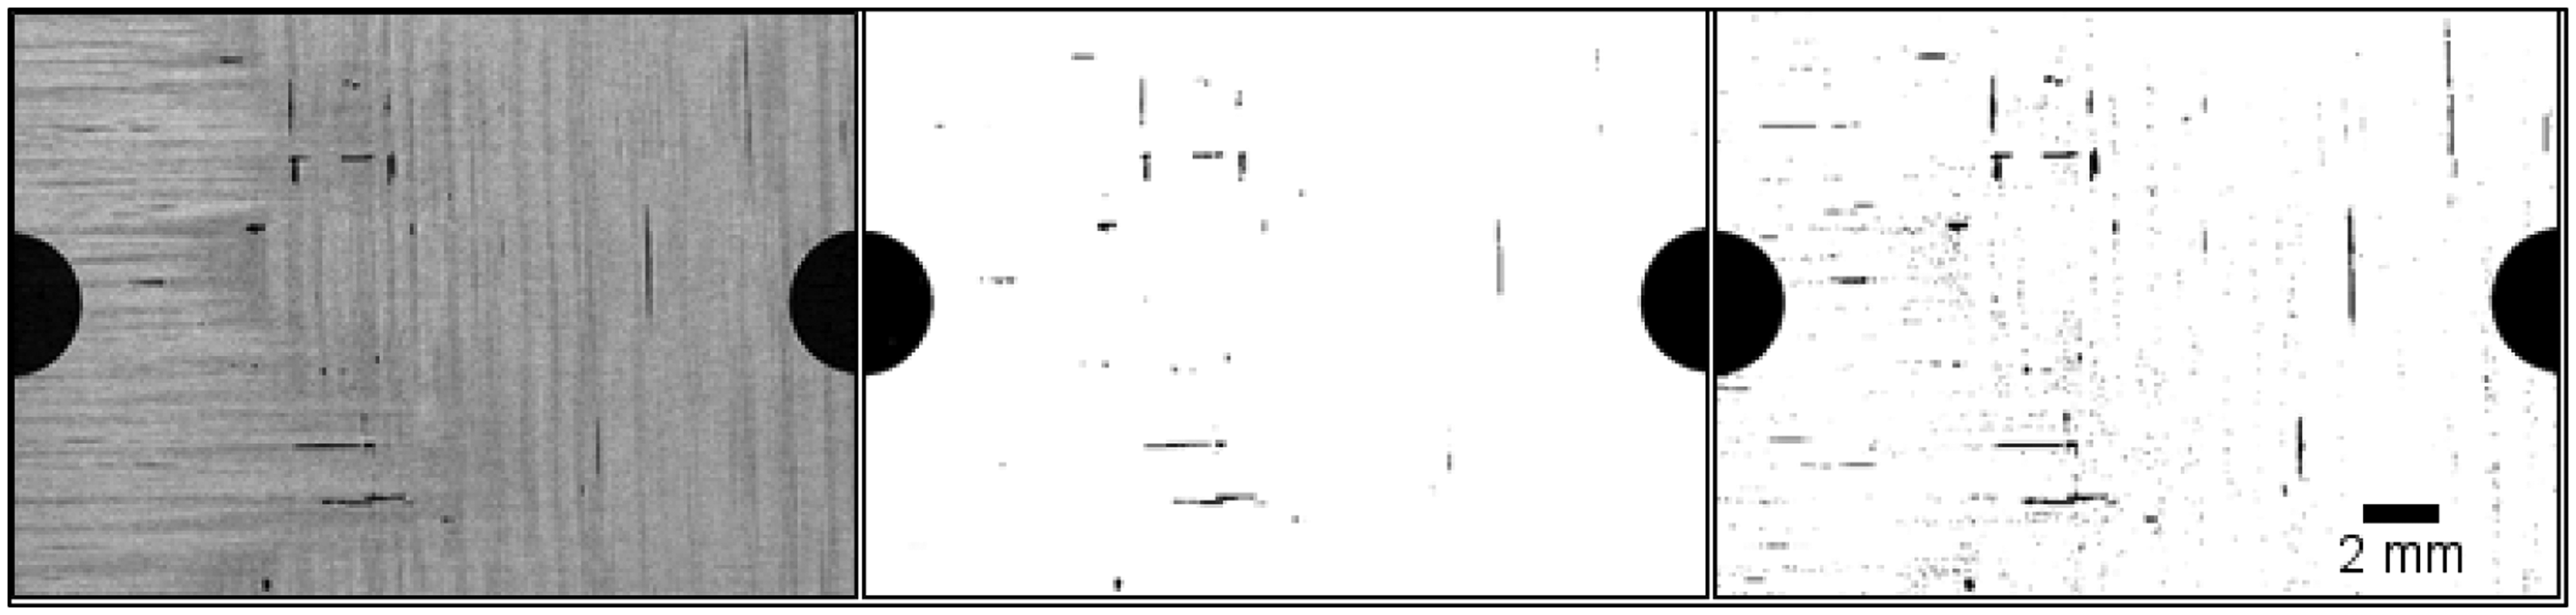
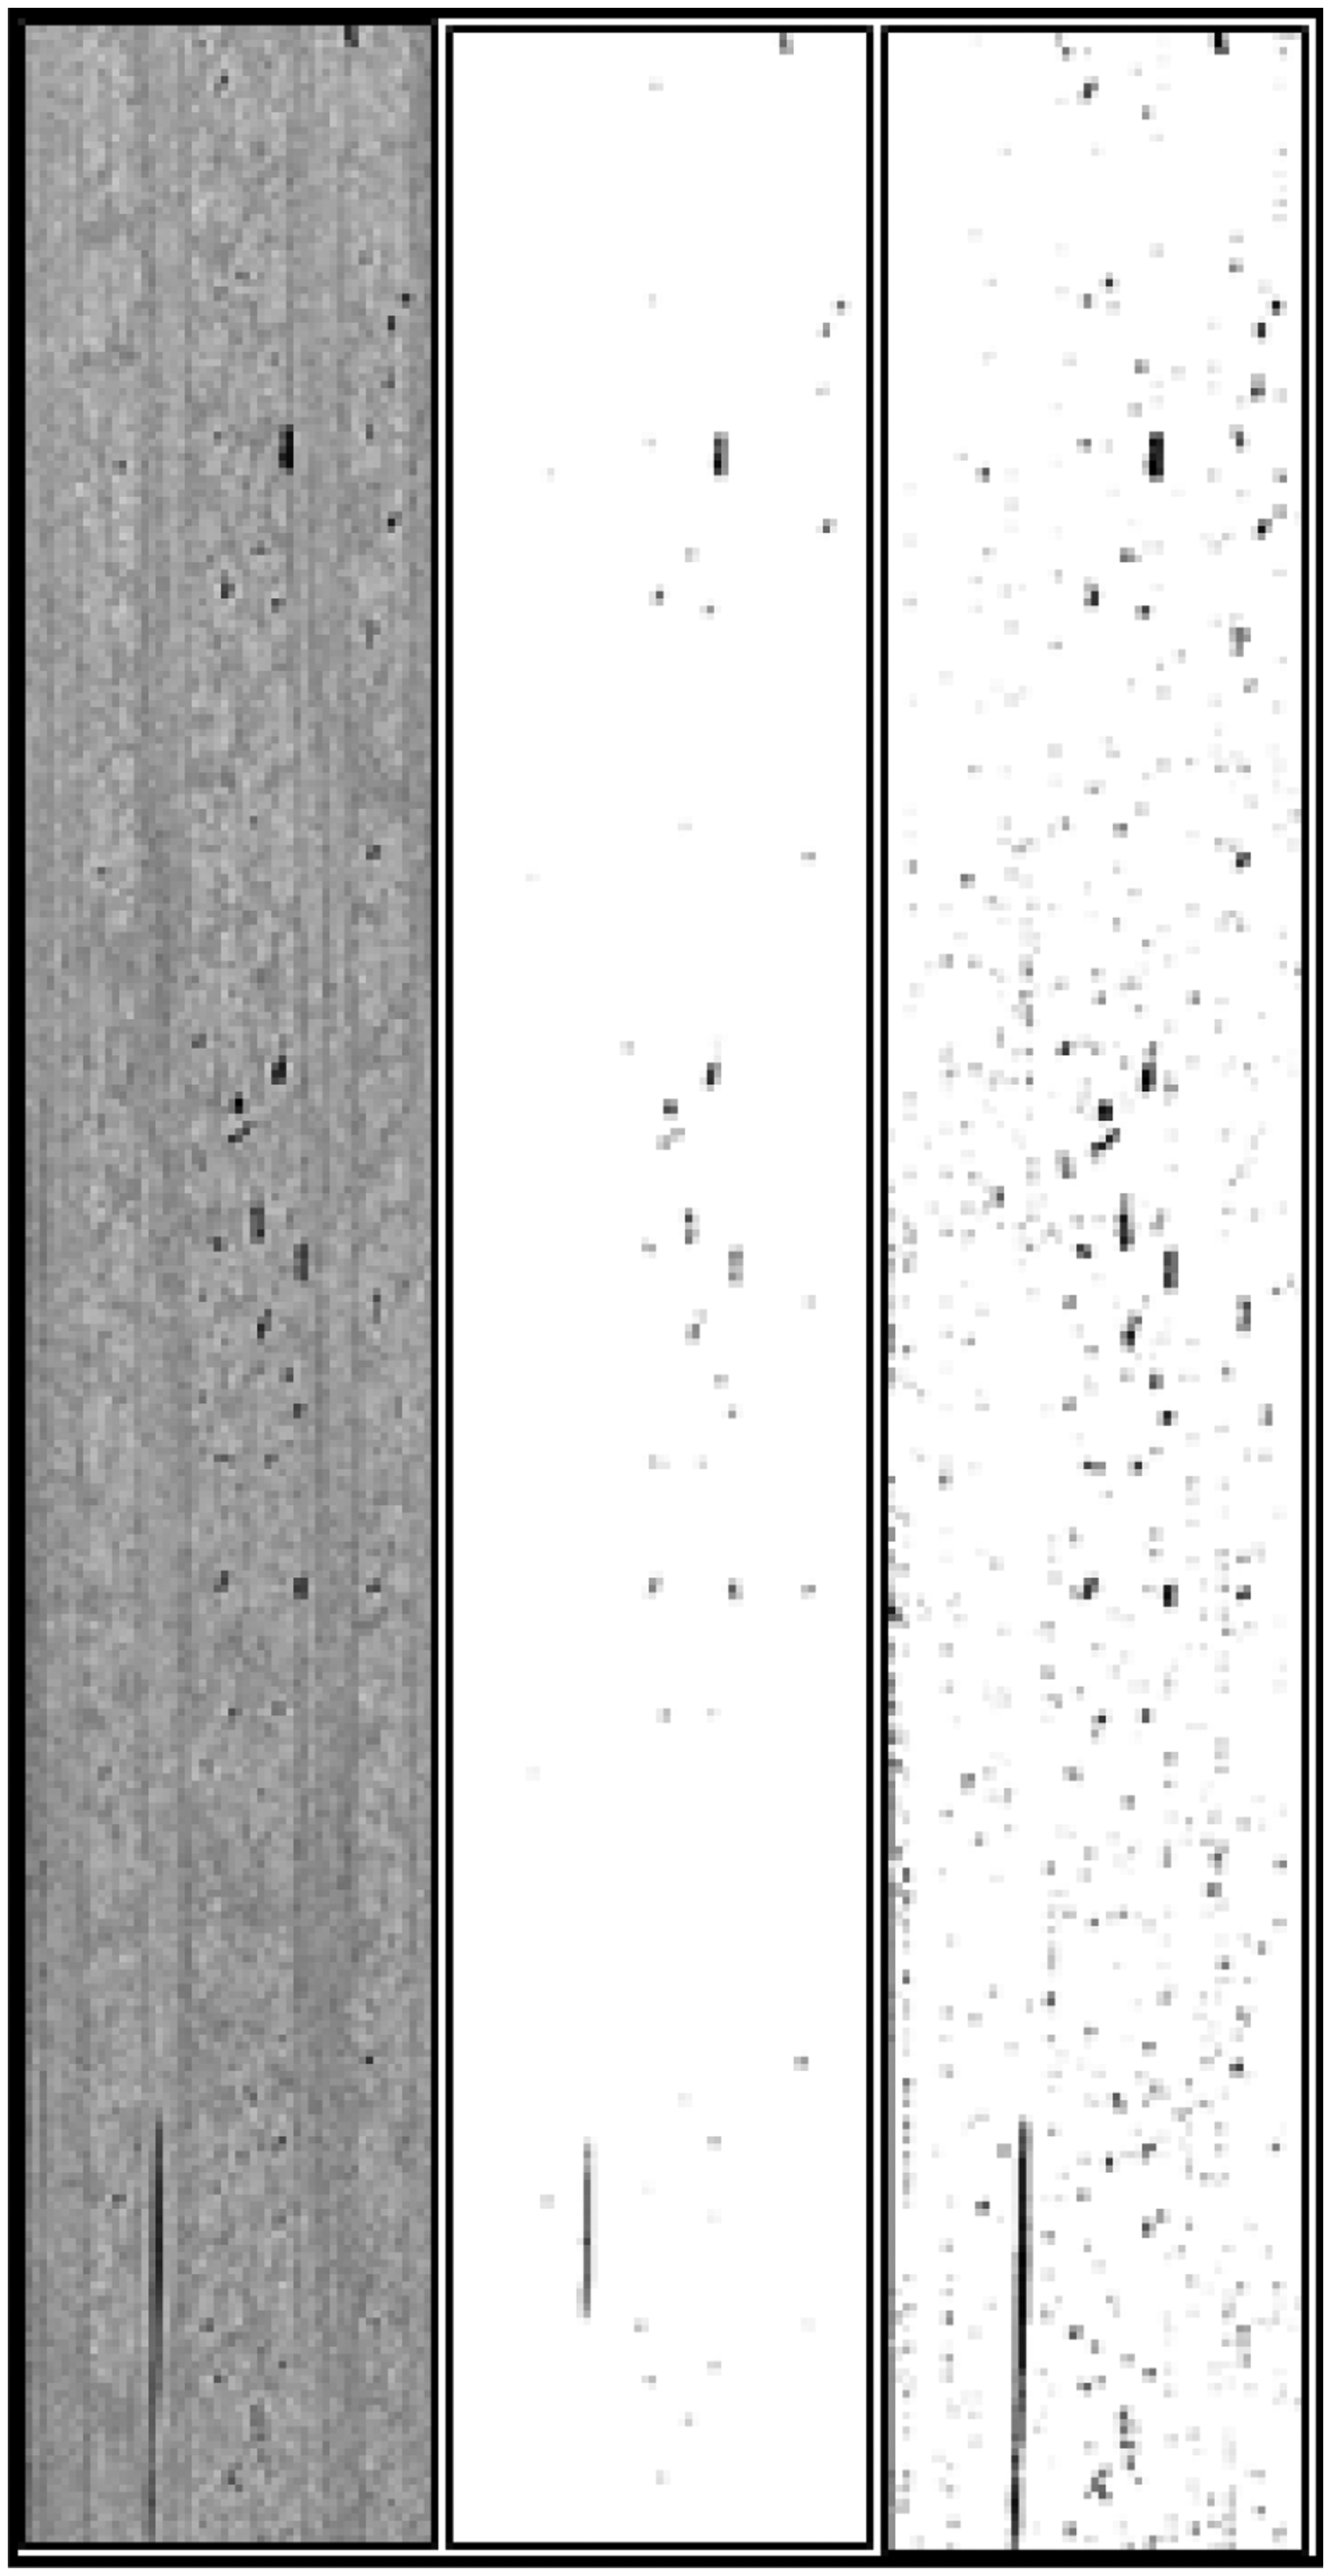
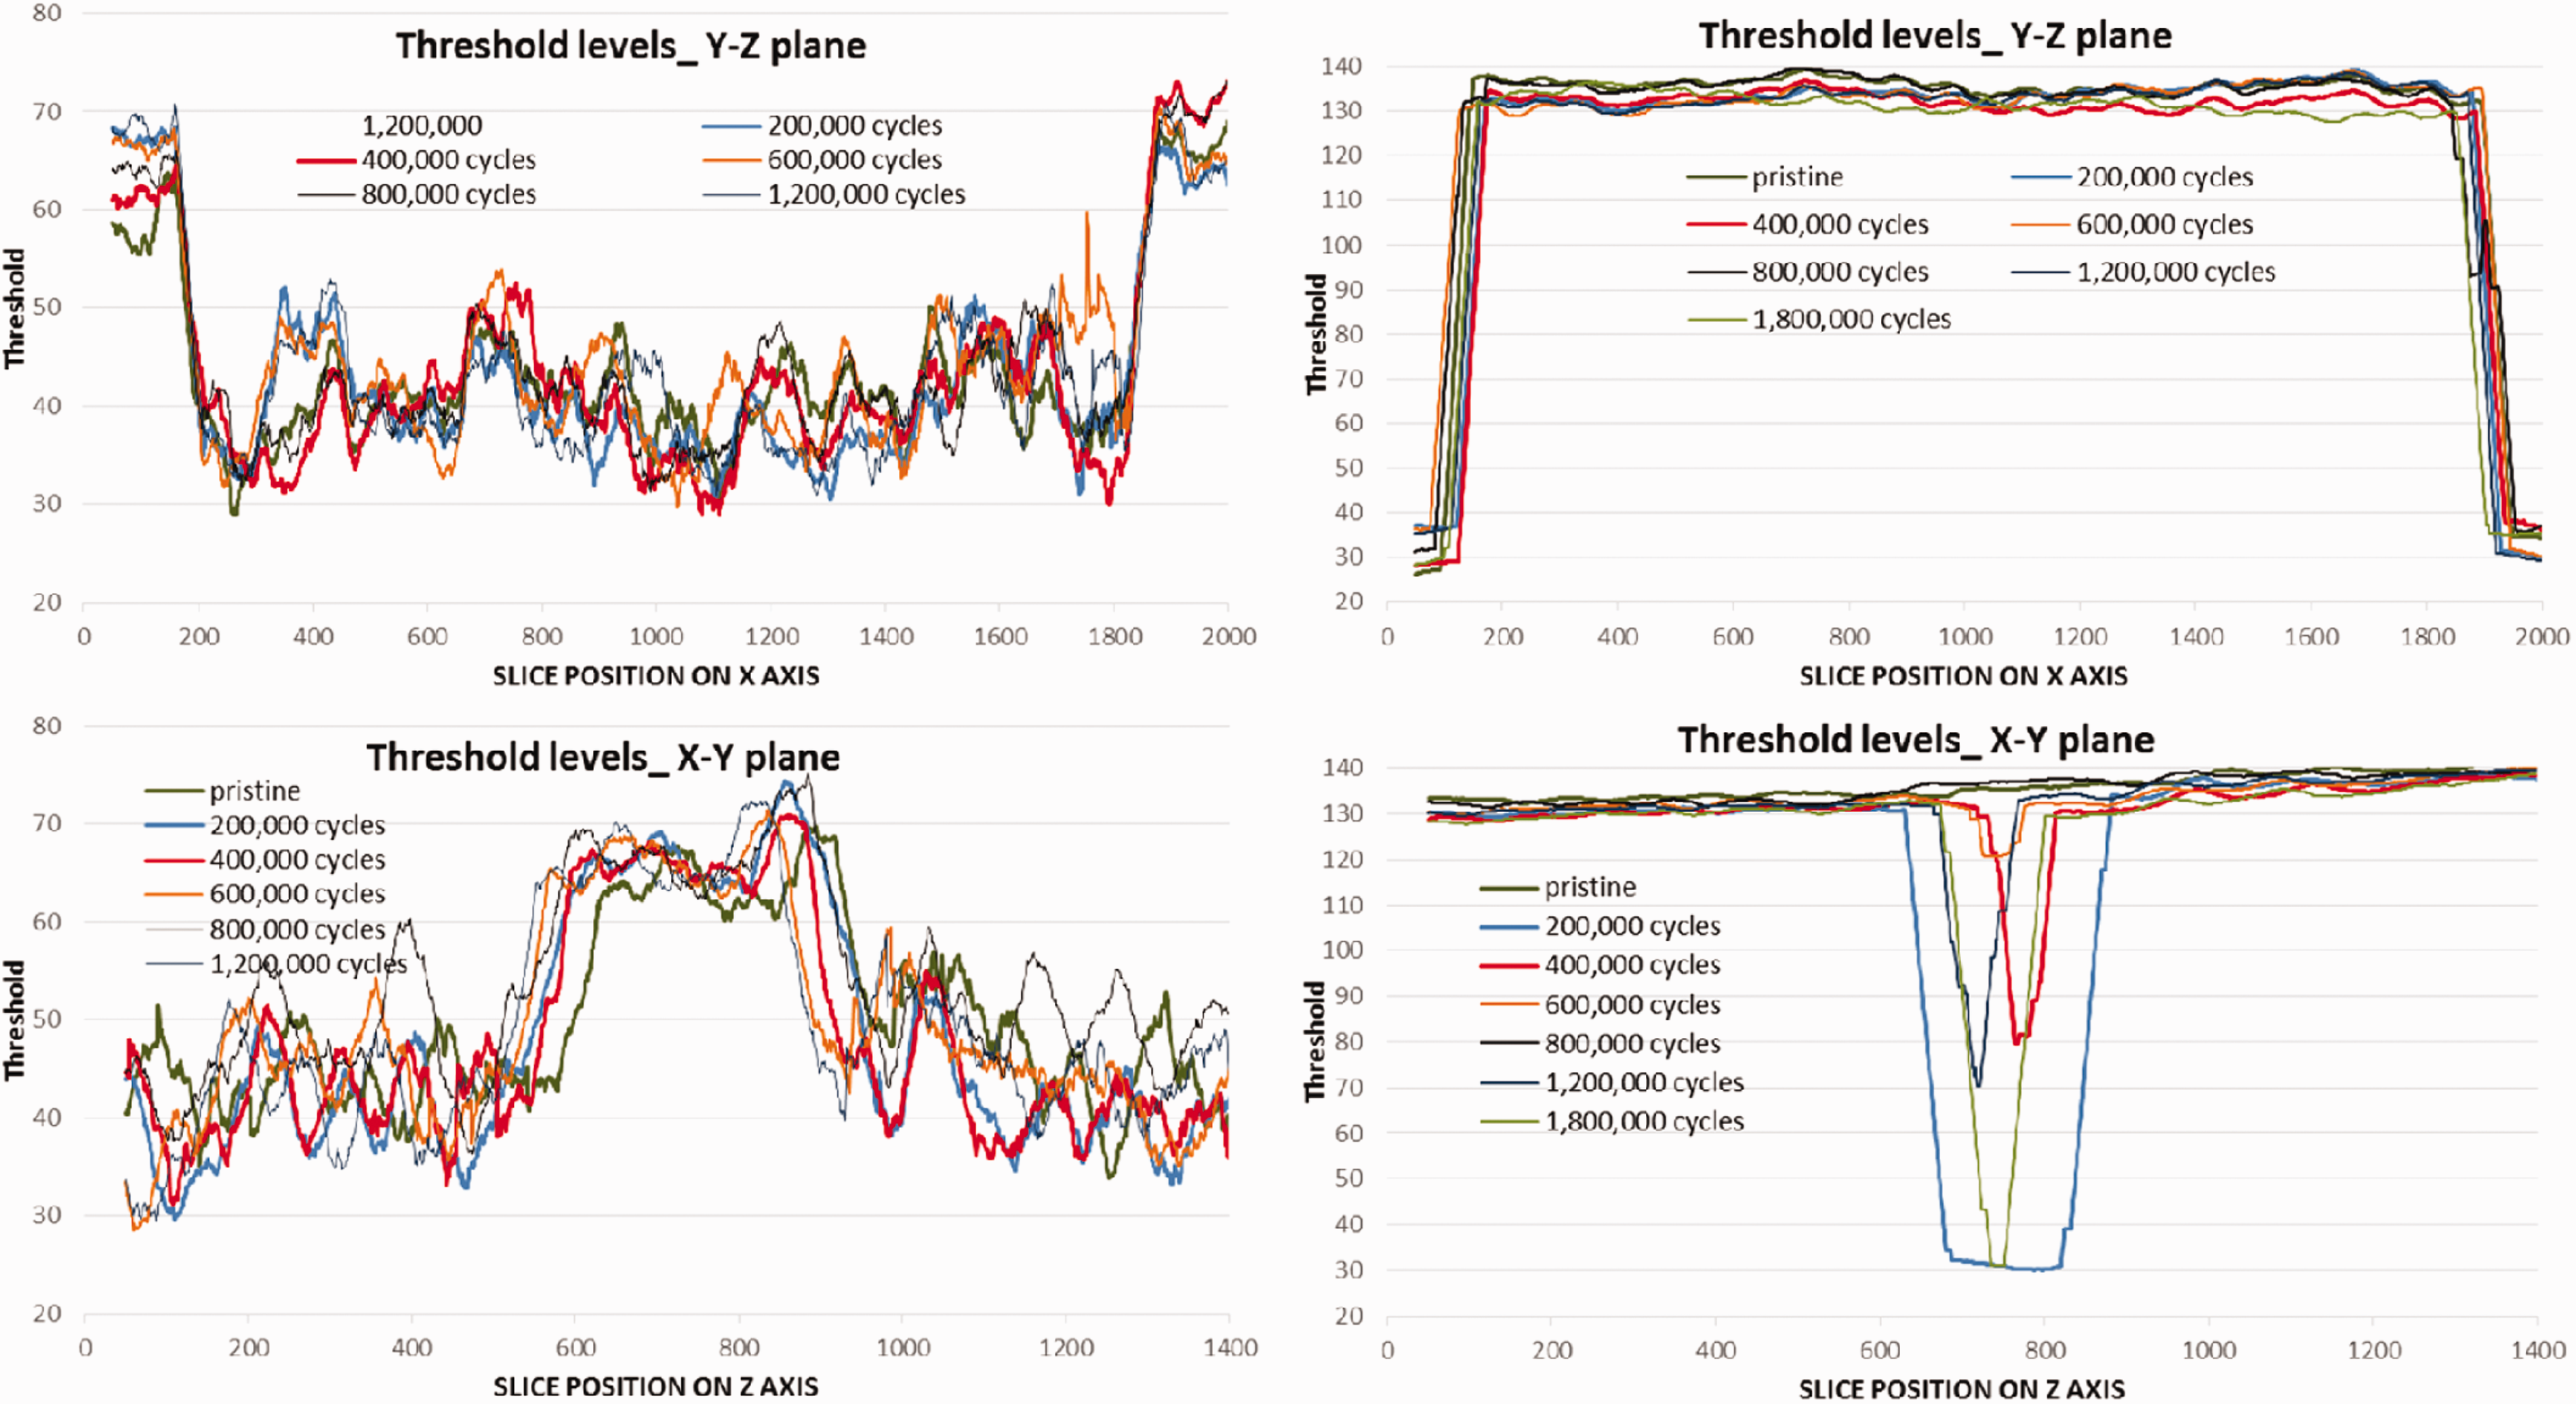
On the contrary, for both the X-Z and the Y-Z planes, characterized by smaller flaws, minimum auto threshold method resulted in segmented voids of areas less than their actual values, raising concerns of resulting in misleading data of crack propagation; whereas triangle auto threshold method resulted in more realistic representation of segmented voids, Figures 8 and 9. Hence, the triangle method was selected for segmentation of these two planes. The applied threshold levels were recorded for both methods throughout the 1972 images constituting the thickness of the Y-Z plane, and the 1370 images across the X-Y thickness for all stages of fatigue life. Void areas were calculated and compared for further justifying the choice of triangle method. In the Y-Z plane, the auto minimum threshold levels averaged 60–70 for the images showing notches and 35–45 for the solid images, compared to 130 threshold level for solid images and 30 for the notched ones in case of the auto triangle method. A similar pattern was observed in the X-Y plane. No significant difference was observed in comparing phases of fatigue life. A plot of threshold levels throughout the thickness in each of these two spatial planes appears in Figure 10 for all life cycle intervals.
Virtual cross-section of X-Y plane (above), minimum threshold method (middle) and triangle threshold method (bottom). Virtual cross-section of Y-Z plane (left), minimum threshold method (middle) and triangle threshold method (right). Threshold levels applied by auto ‘minimum’ method (left) for the Y-Z (up) and the X-Y (down) planes and auto ‘triangle’ method (right) for the Y-Z (up) and the X-Y (down) planes.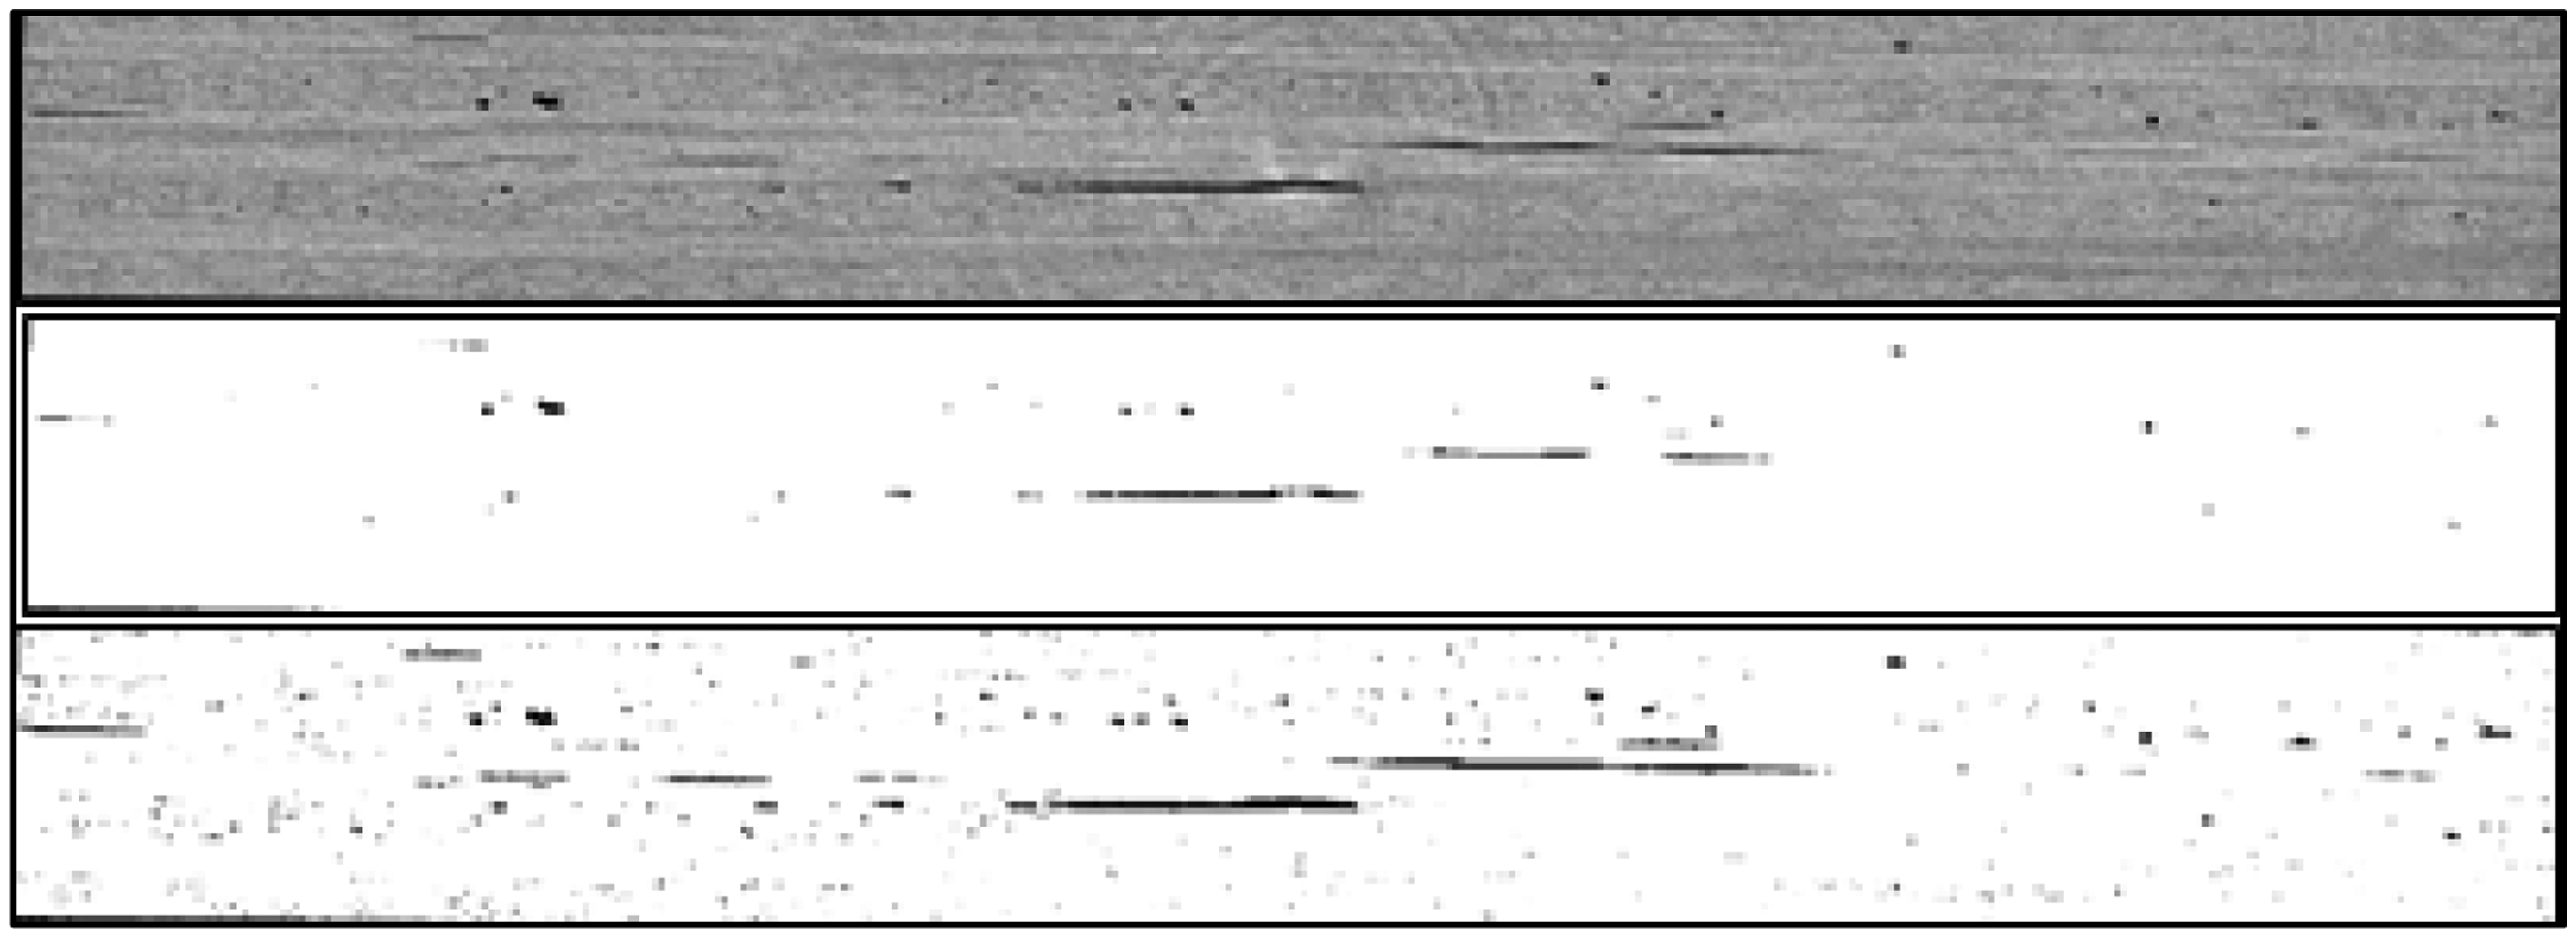
Results
A higher number of voids with larger sizes and circularity was observed in the X-Z plane as compared to fewer and more longitudinal voids in both the Y-Z and the X-Y planes. Considering the lay-up direction of laminated plies, the voids in the X-Z plane represent the opening (mode I) damage, where changes in size of voids correspond to fibres separation, i.e. breakge and/or splitting, Figure 11. On the other hand, changes in length of the longitudinal voids in the Y-Z (sagittal) plane indicate in-plane shear (mode II) damage, where parallel laminates slide in opposite directions leading to increase in length of the pre-existing voids resulting in delamination. The same delamination defects, were traced in the orthogonal X-Y (transverse) plane and the changes in length of cracks were assumed to correspond to out-of-plane shear (mode III) damage. In mode III damage, the pre-existing intra-ply cracks experience shear loads in opposite directions that change their lengths. Hence, the recorded change in crack lengths in the X-Y plane was generally of negative magnitude due to the fact that ply layers inclinely slide at acute angles if transverselly viewed resulting in decrease in their observed lengths.
Fibre breakage detected in virtual X-Z cross-section.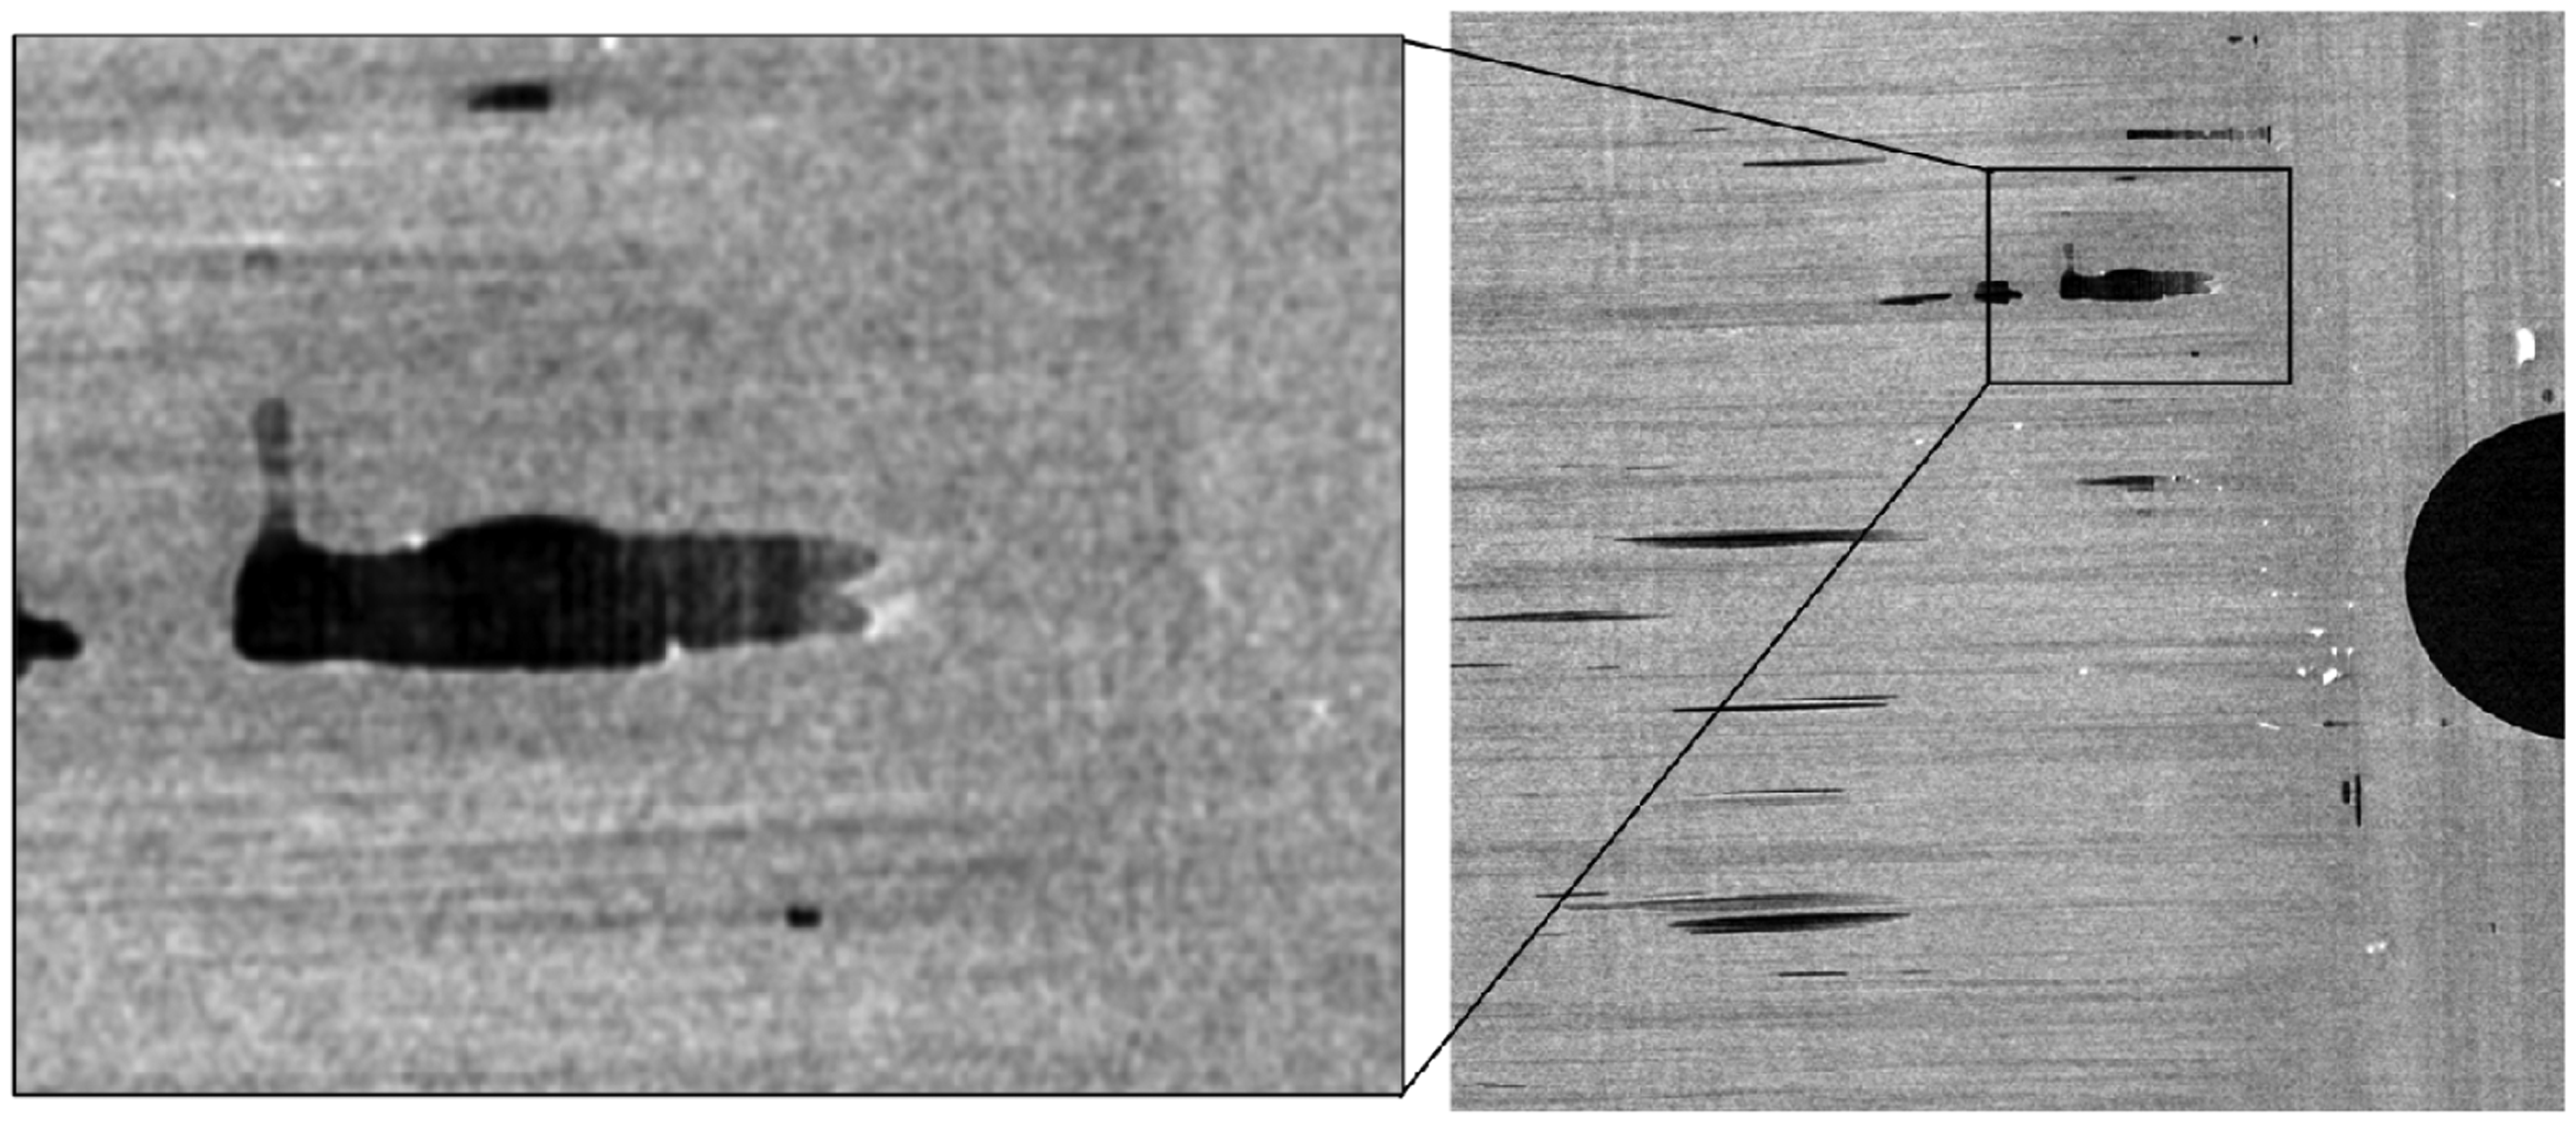
Quantitative analysis was performed by studying the cracks of which areas exceeded 1000 pixel 2 in all planes. All circularities (0-1) in the X-Z plane were considered for analysis, whereas only longitudinal cracks of circularity below 0.25 were considered in both the Y-Z and the X-Y planes. Voids not meeting these criteria were neglected. Similarly, cracks that were not consisitently present for three or more consecutive intervals at 1 pixel inteval were excluded.Crack lengths were calculated assuming cracks being rectangular in shape with average width of 10 pixels as revealed from random study of voids. Length conversions and positions of voids through the thickness of each plane were calculated based on a pixel size of 12.08 µm.
X-Z plane
Cracks coordinates and change in length for X-Z plane.
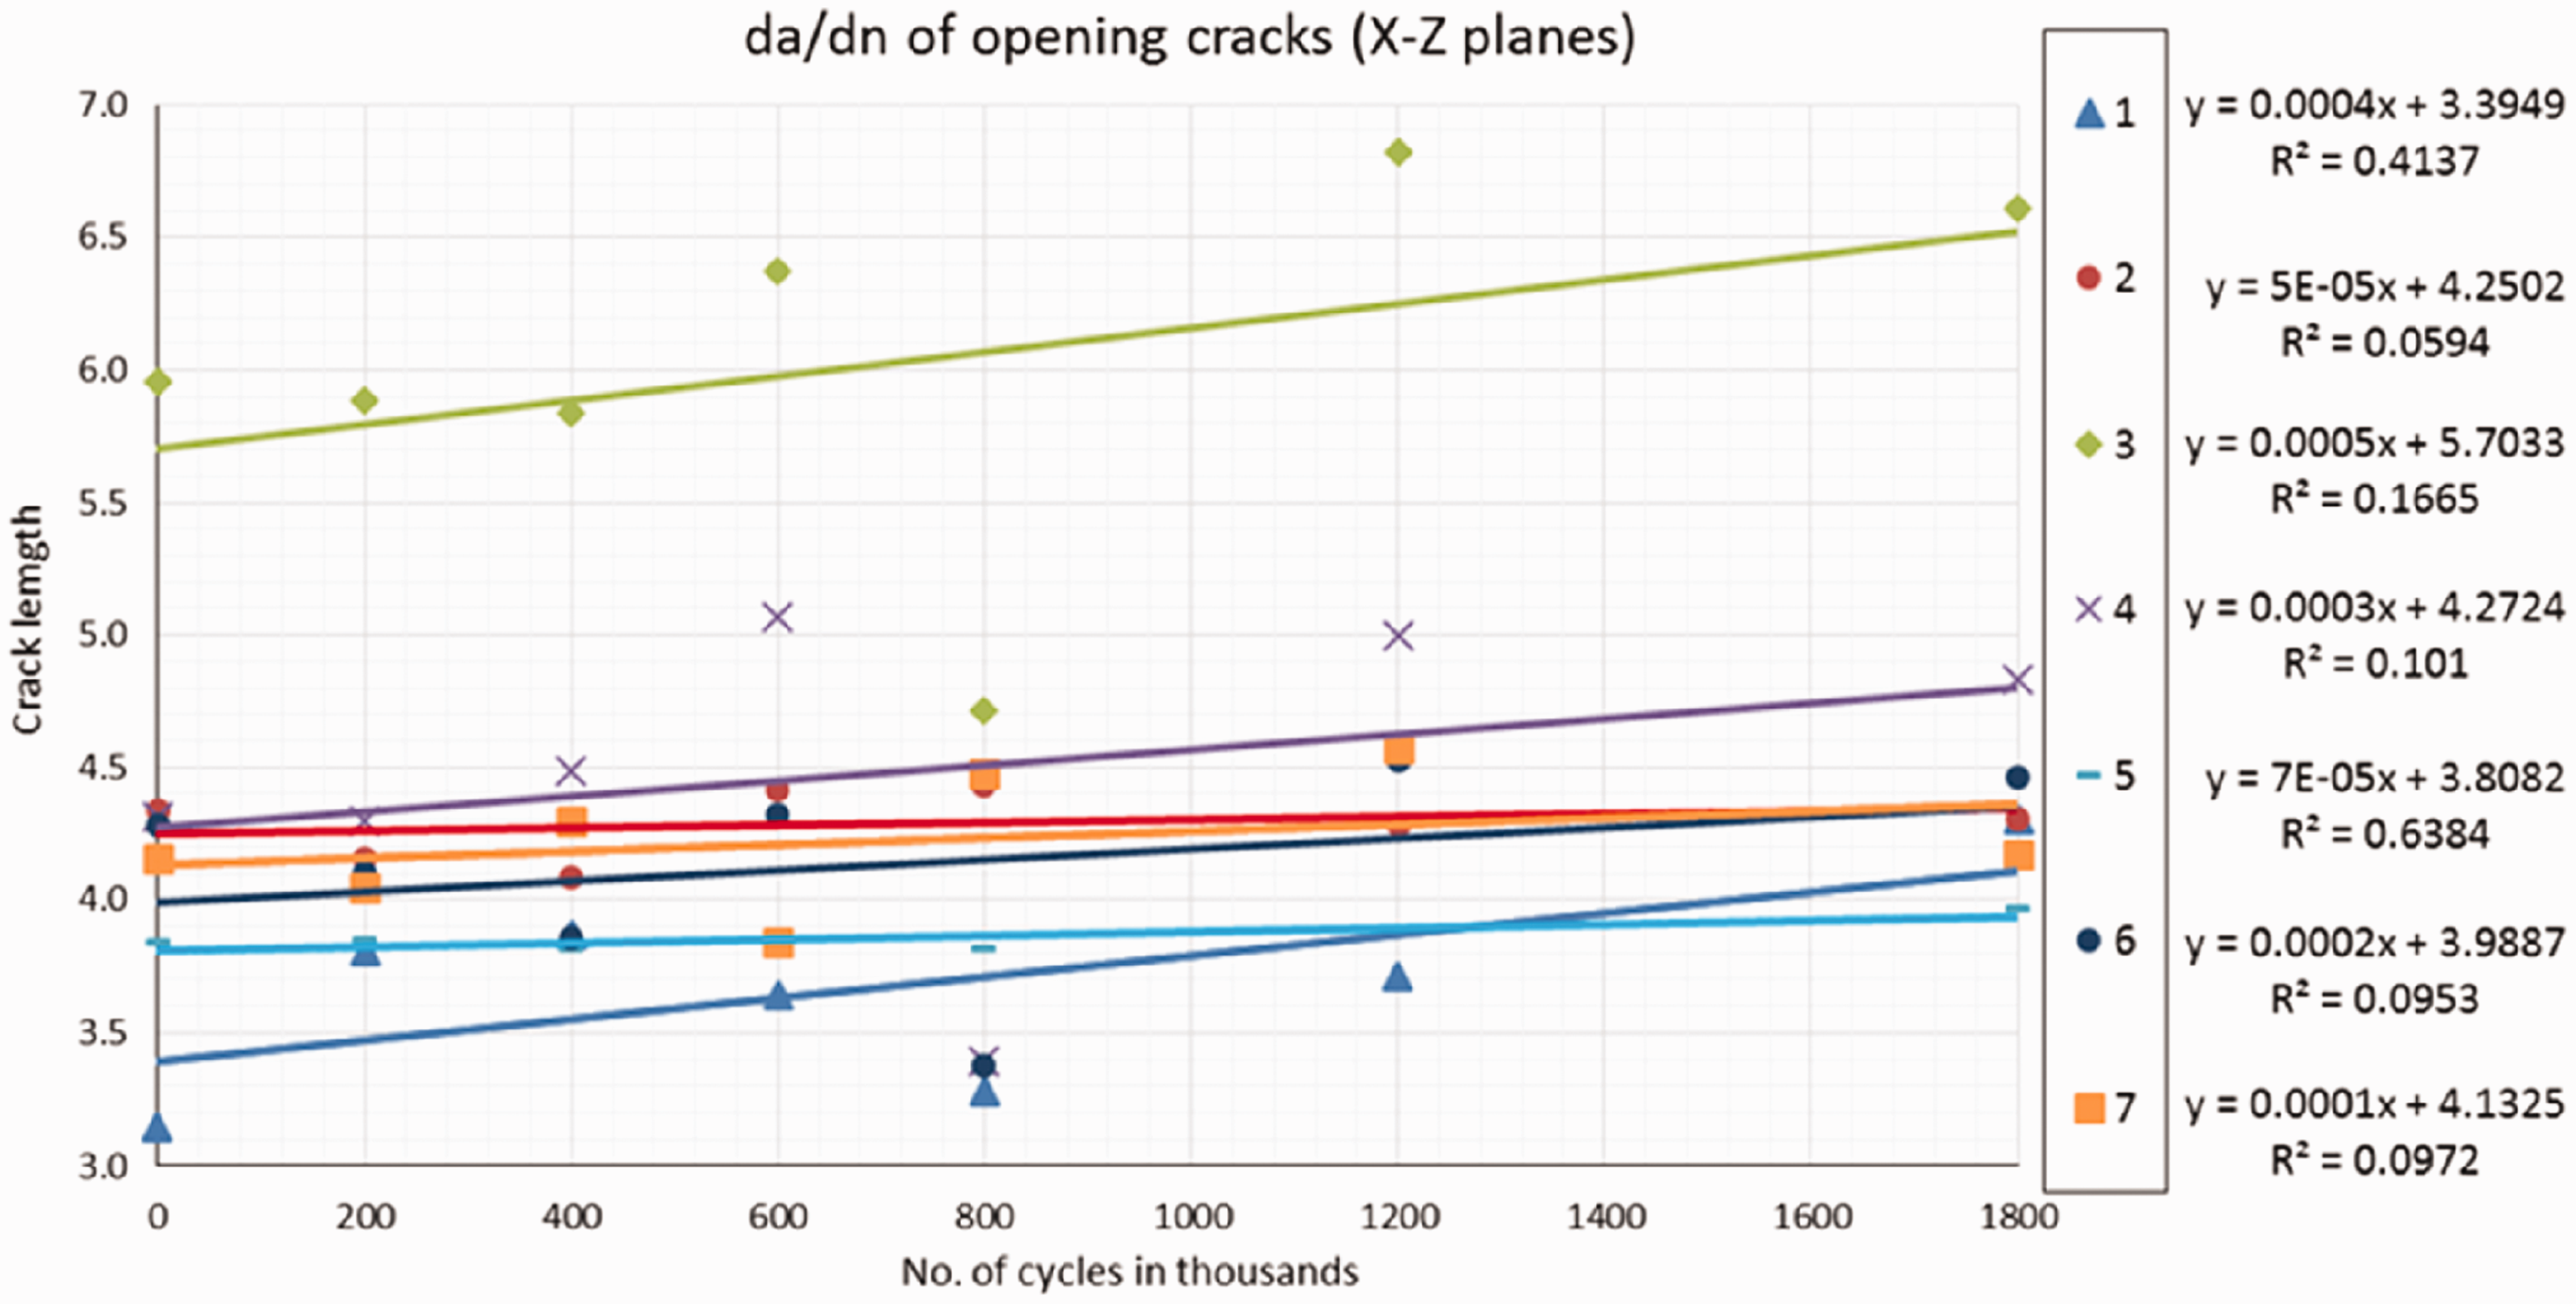
Fatigue crack growth rate of mode I opening cracks.
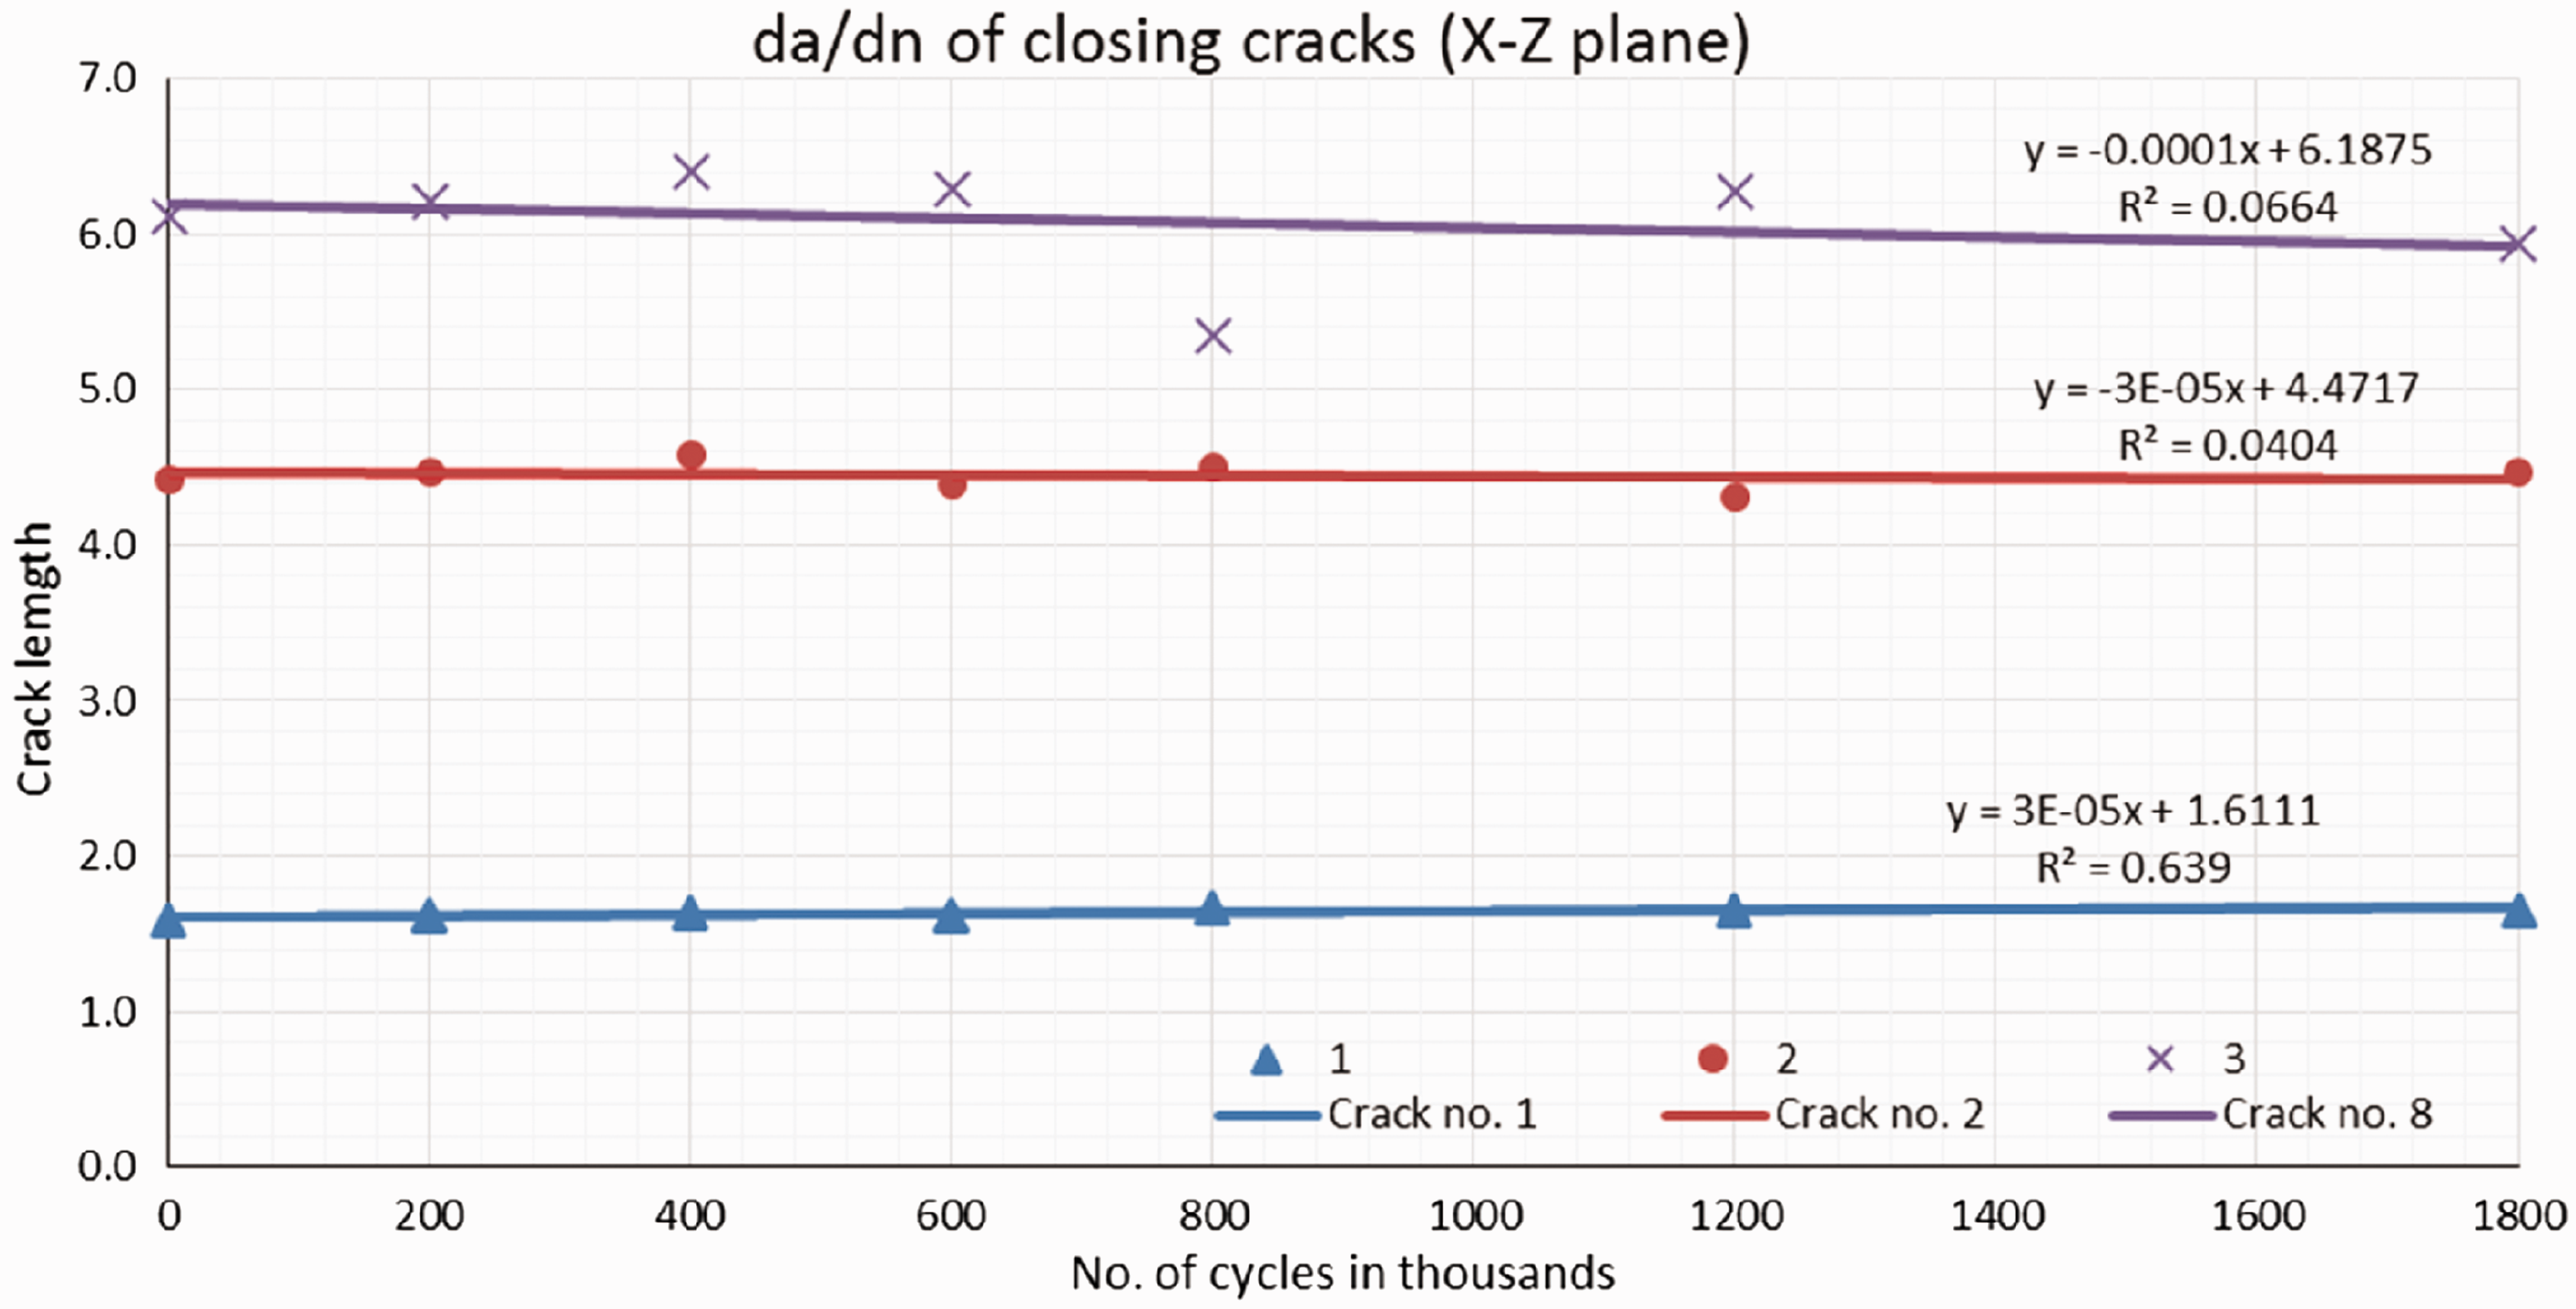
Fatigue crack growth rate of mode I closing cracks.
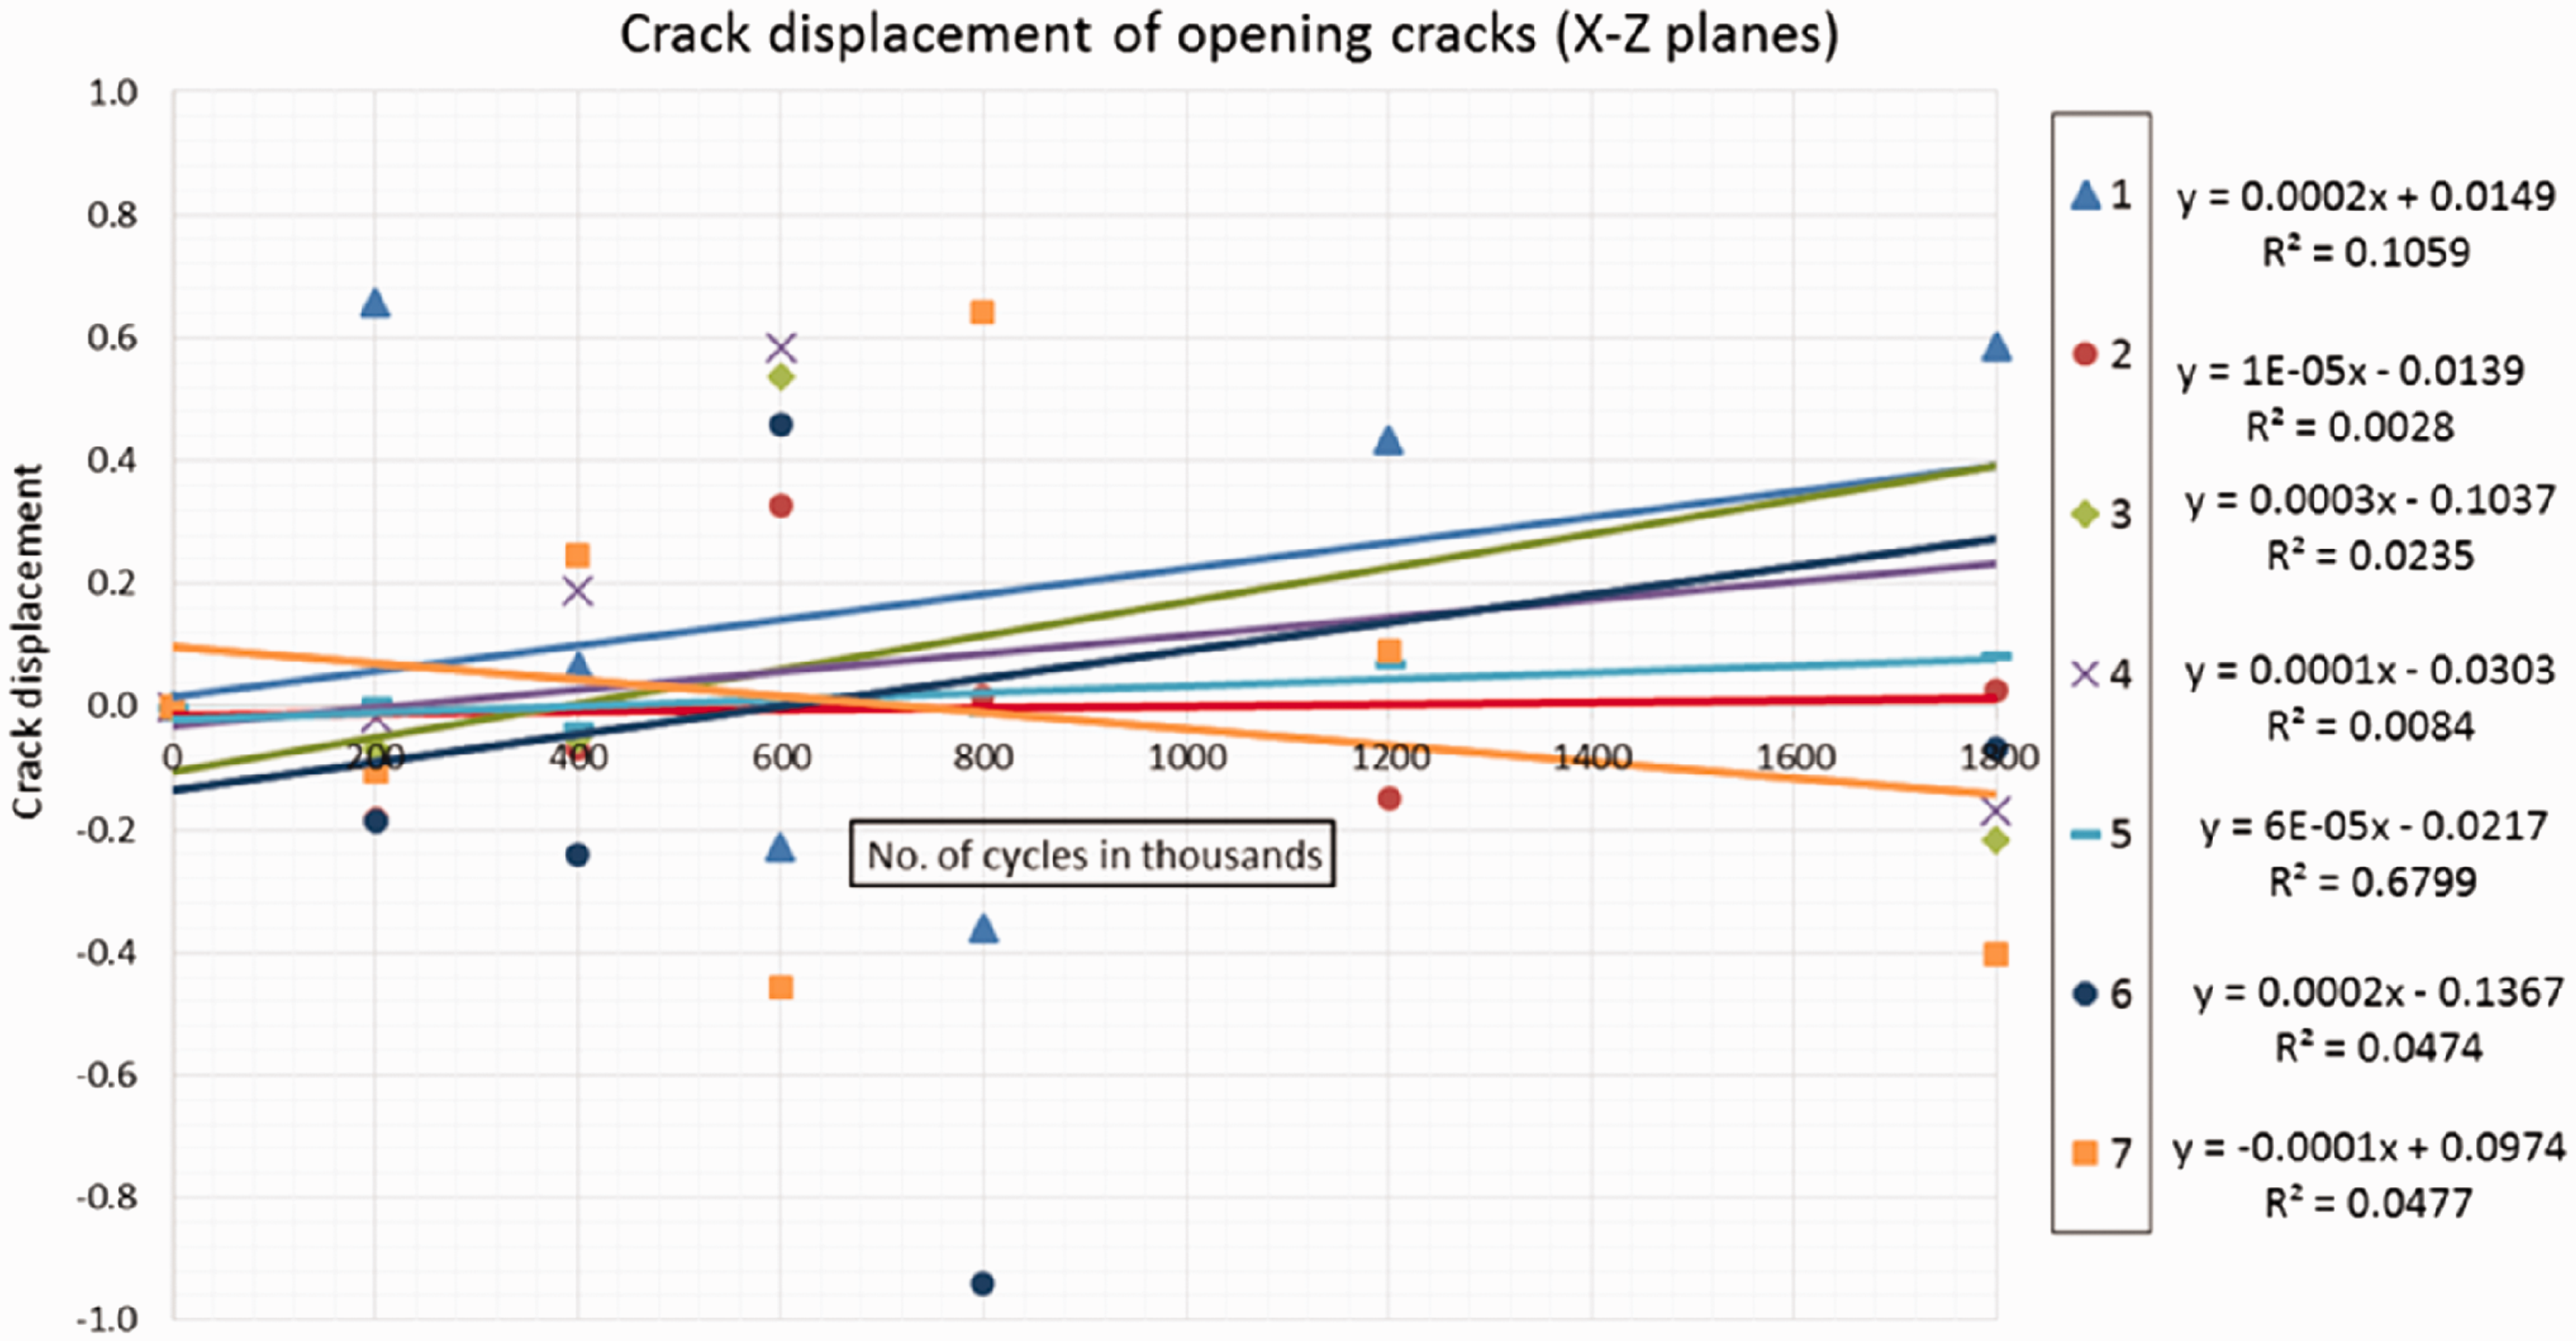
Crack displacements of mode I opening cracks.
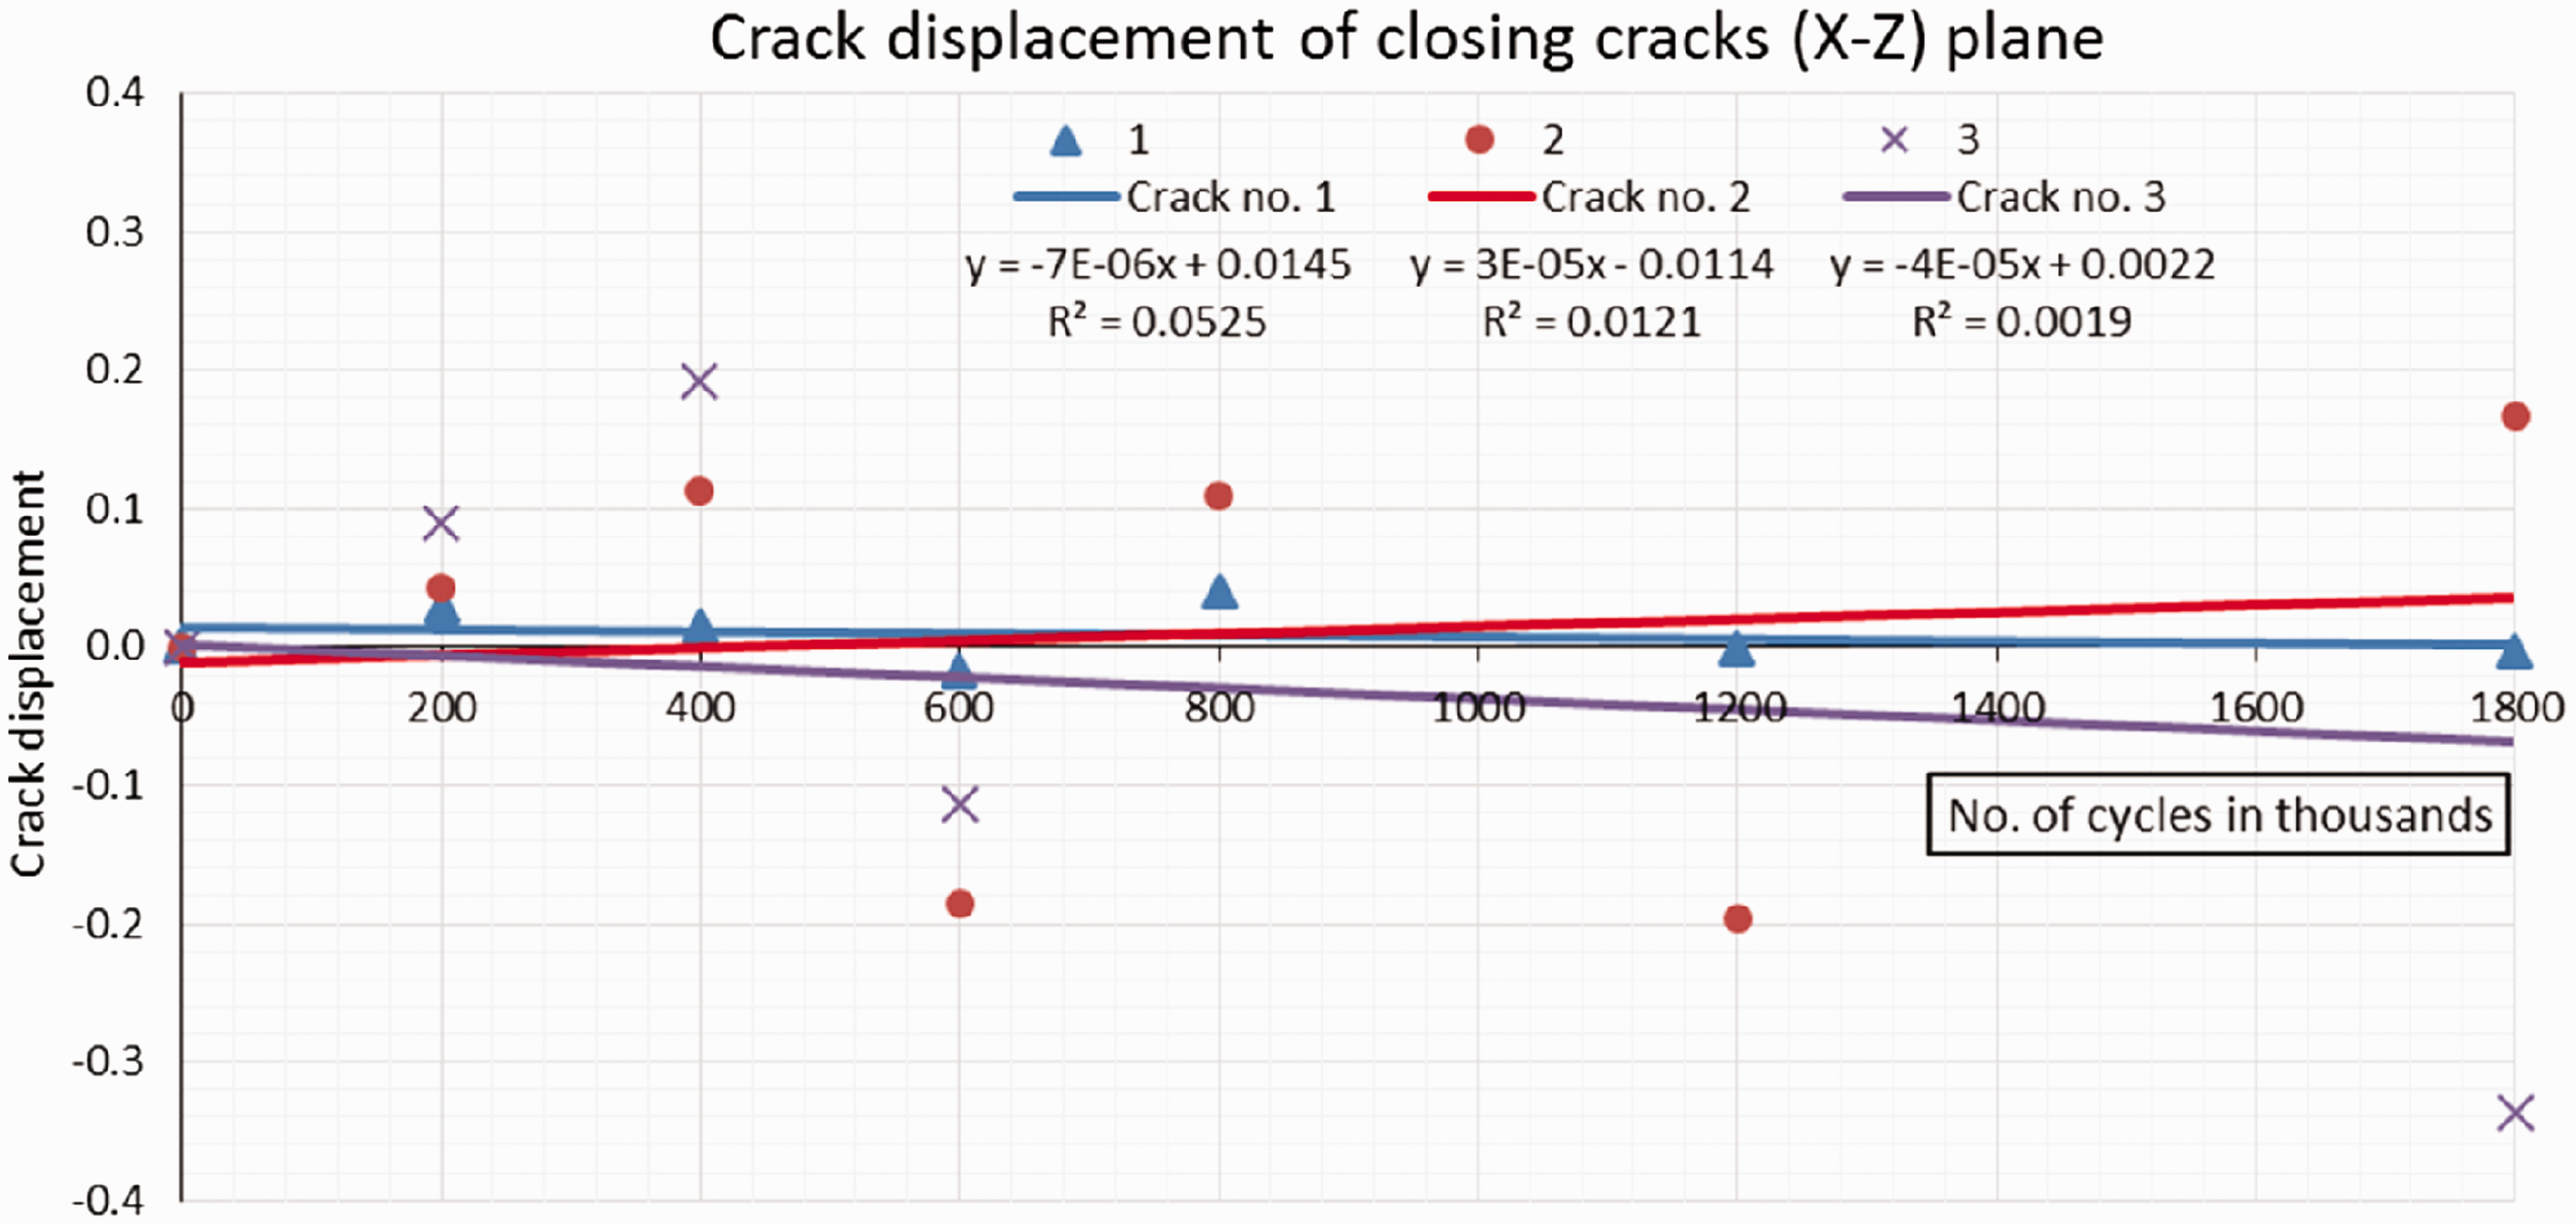
Crack displacements of mode I closing cracks.
Y-Z plane
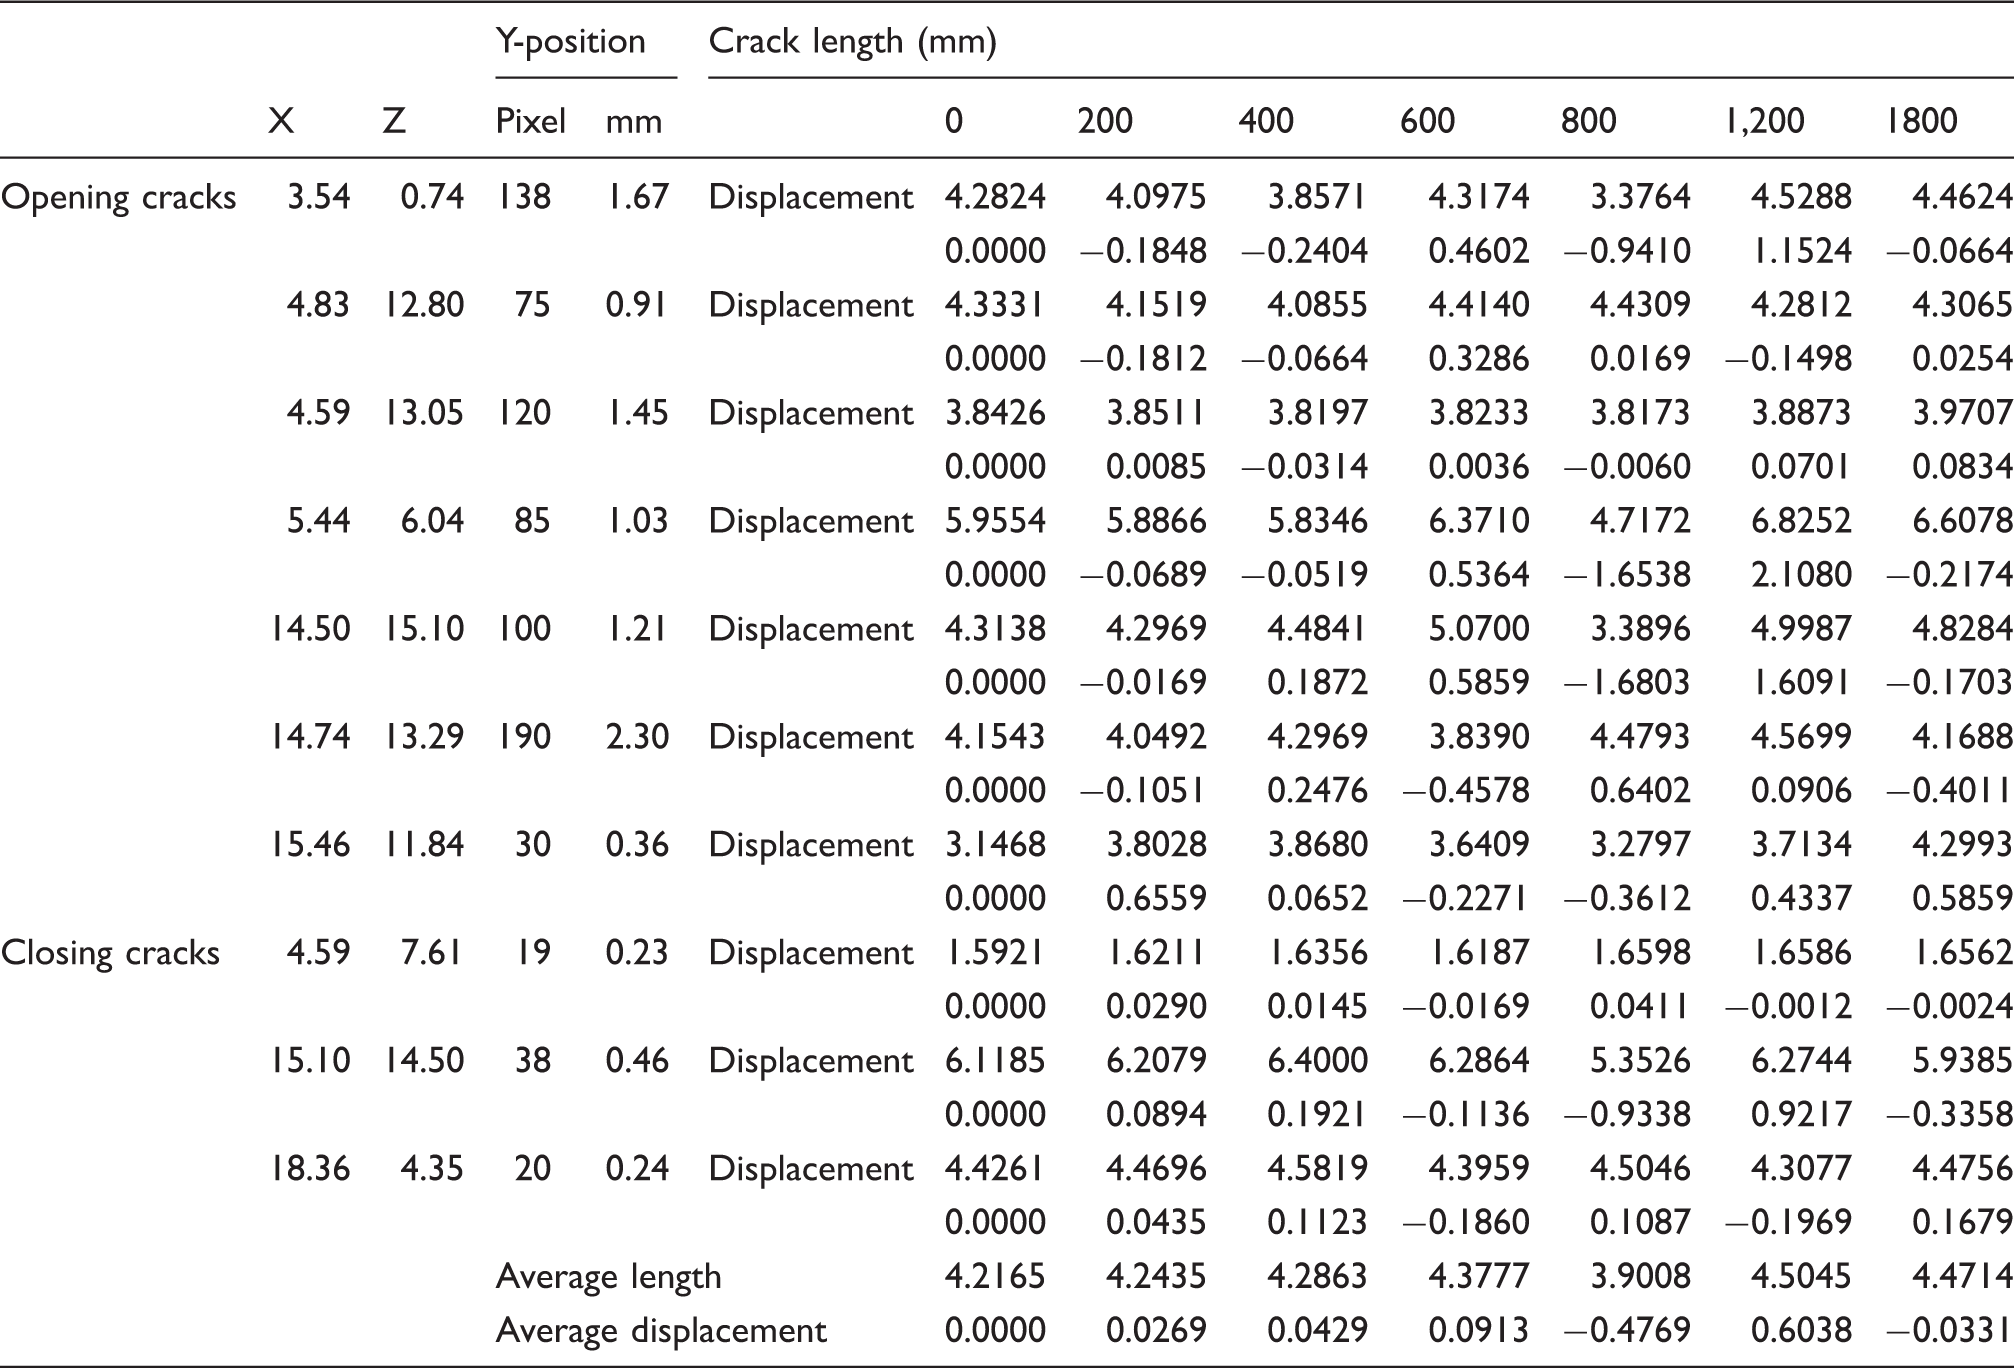
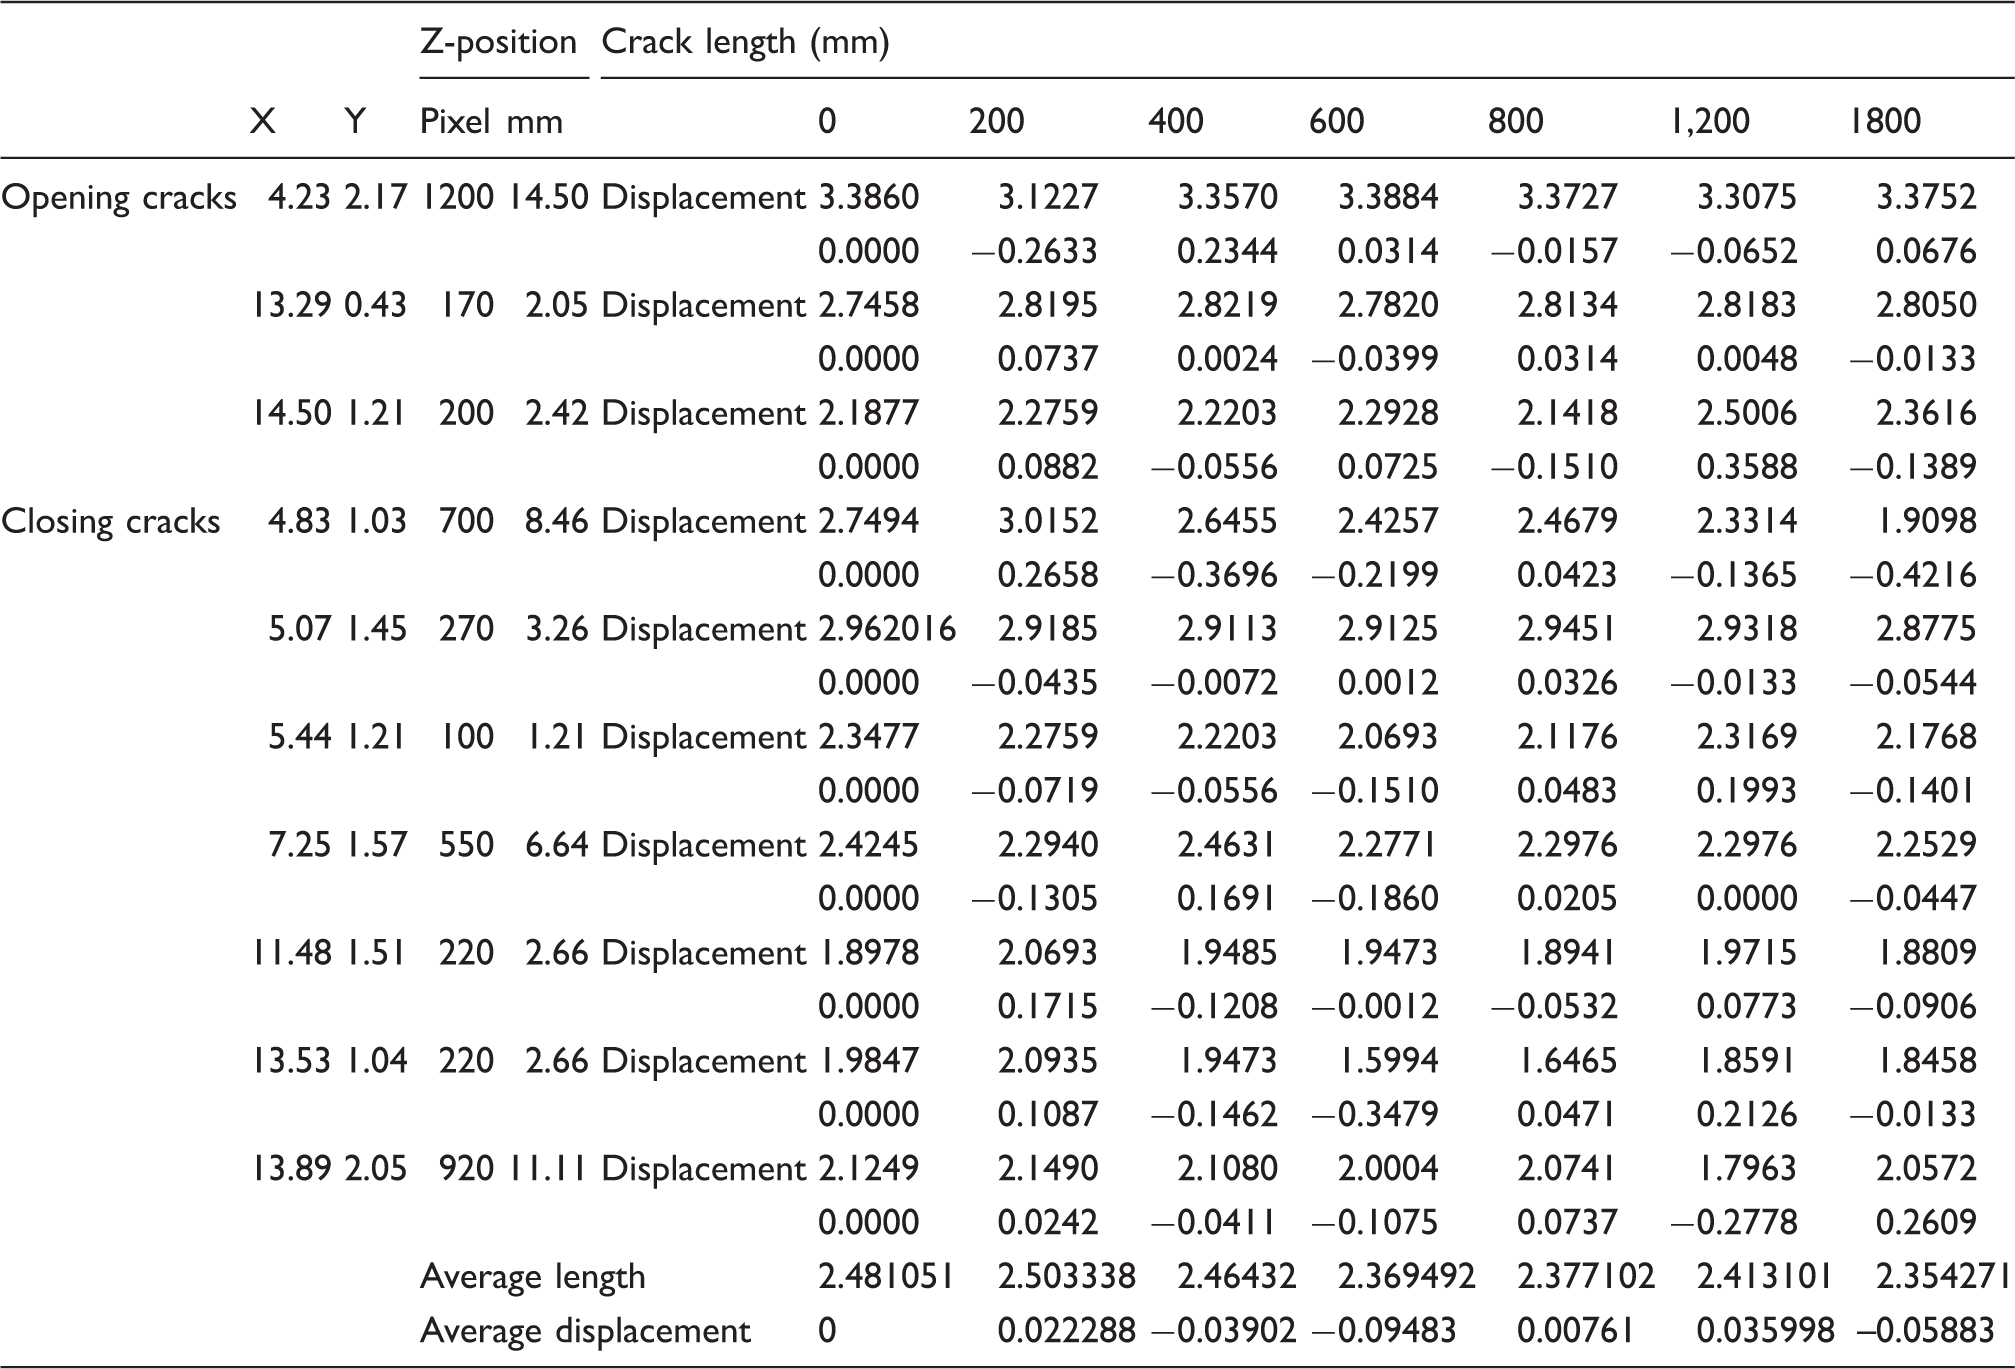
Cracks coor−dinates and change in length for Y-Z plane.
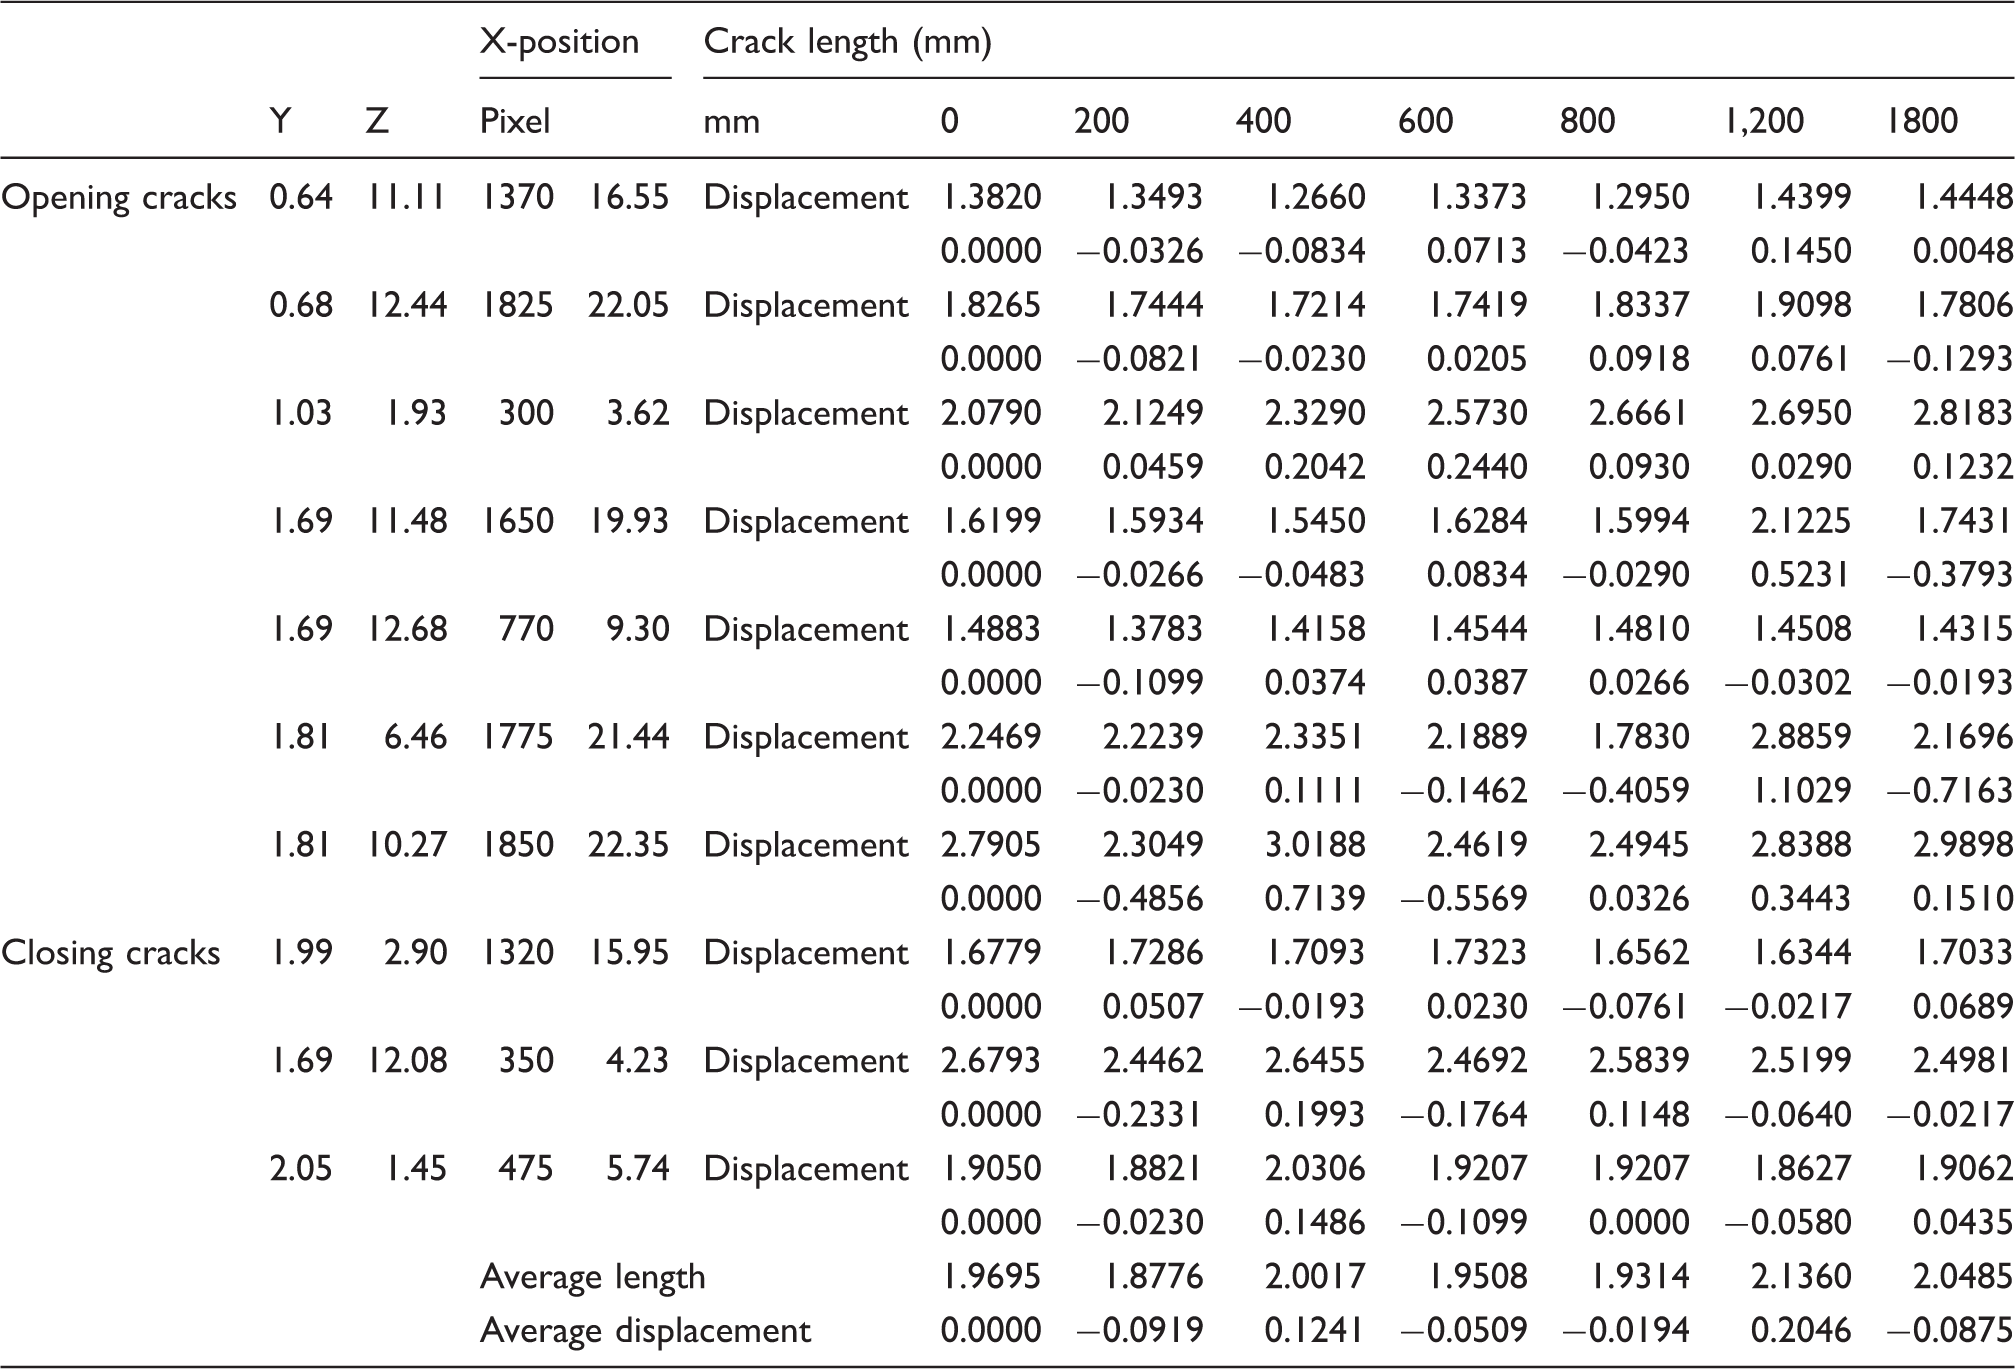
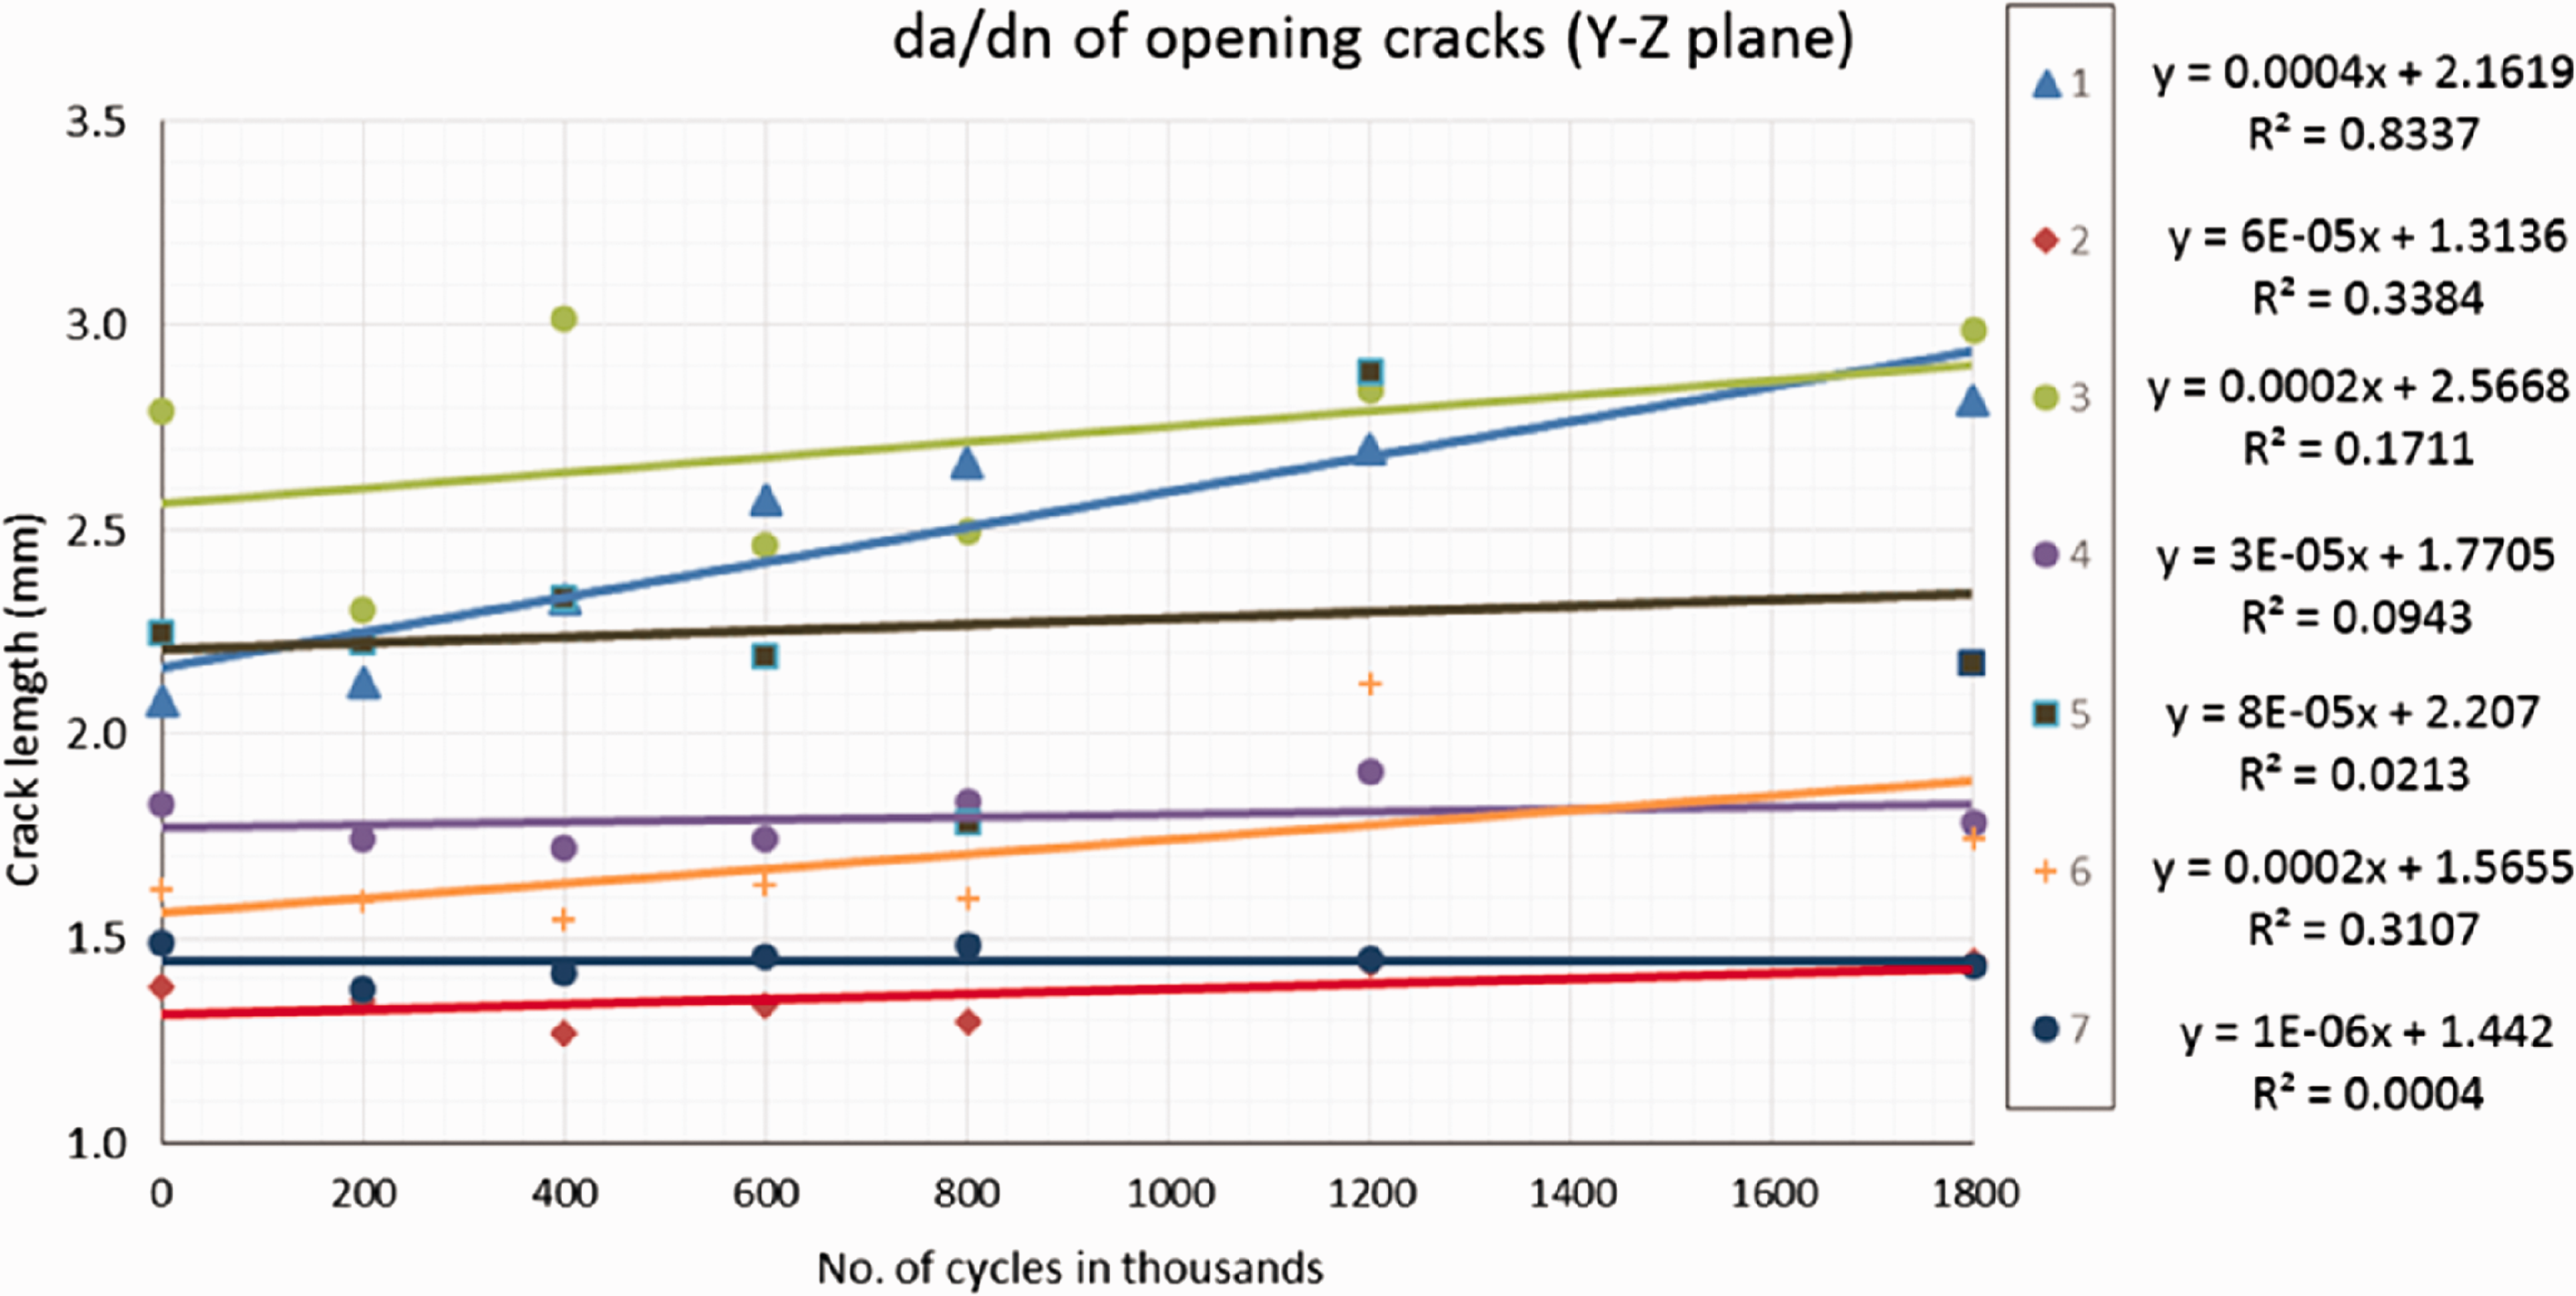
Fatigue crack growth rate of mode II opening cracks.
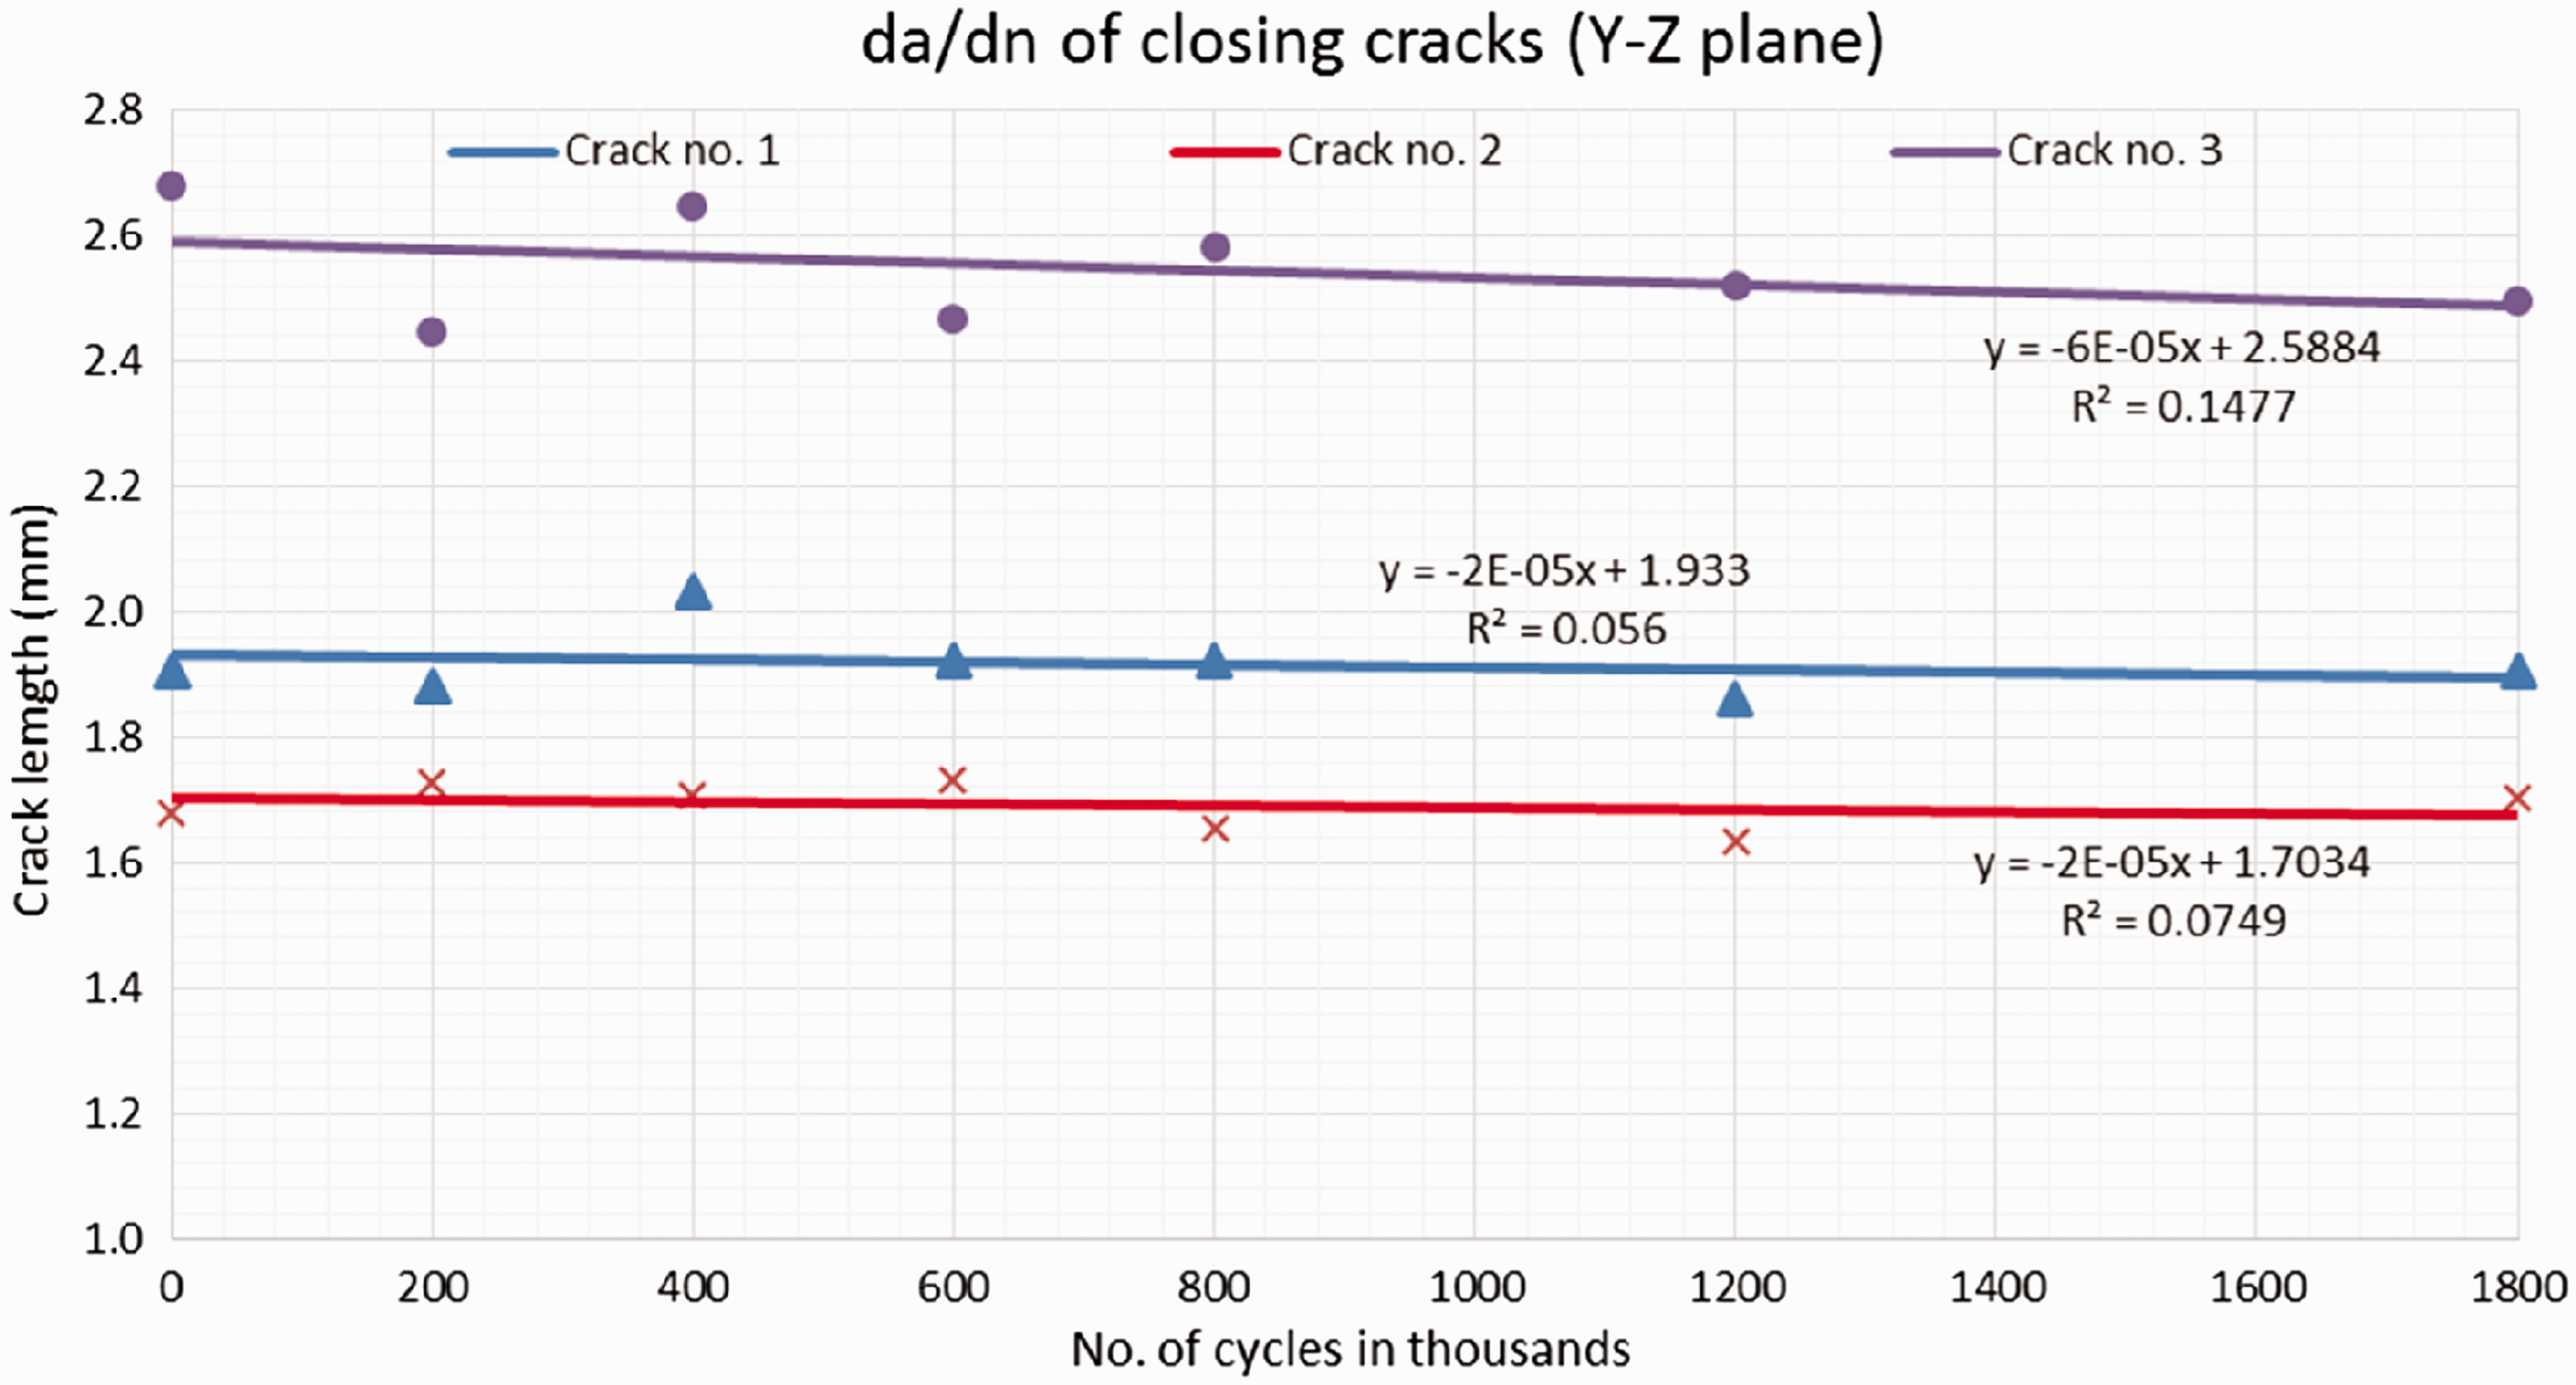
Fatigue crack growth rate of mode II closing cracks.
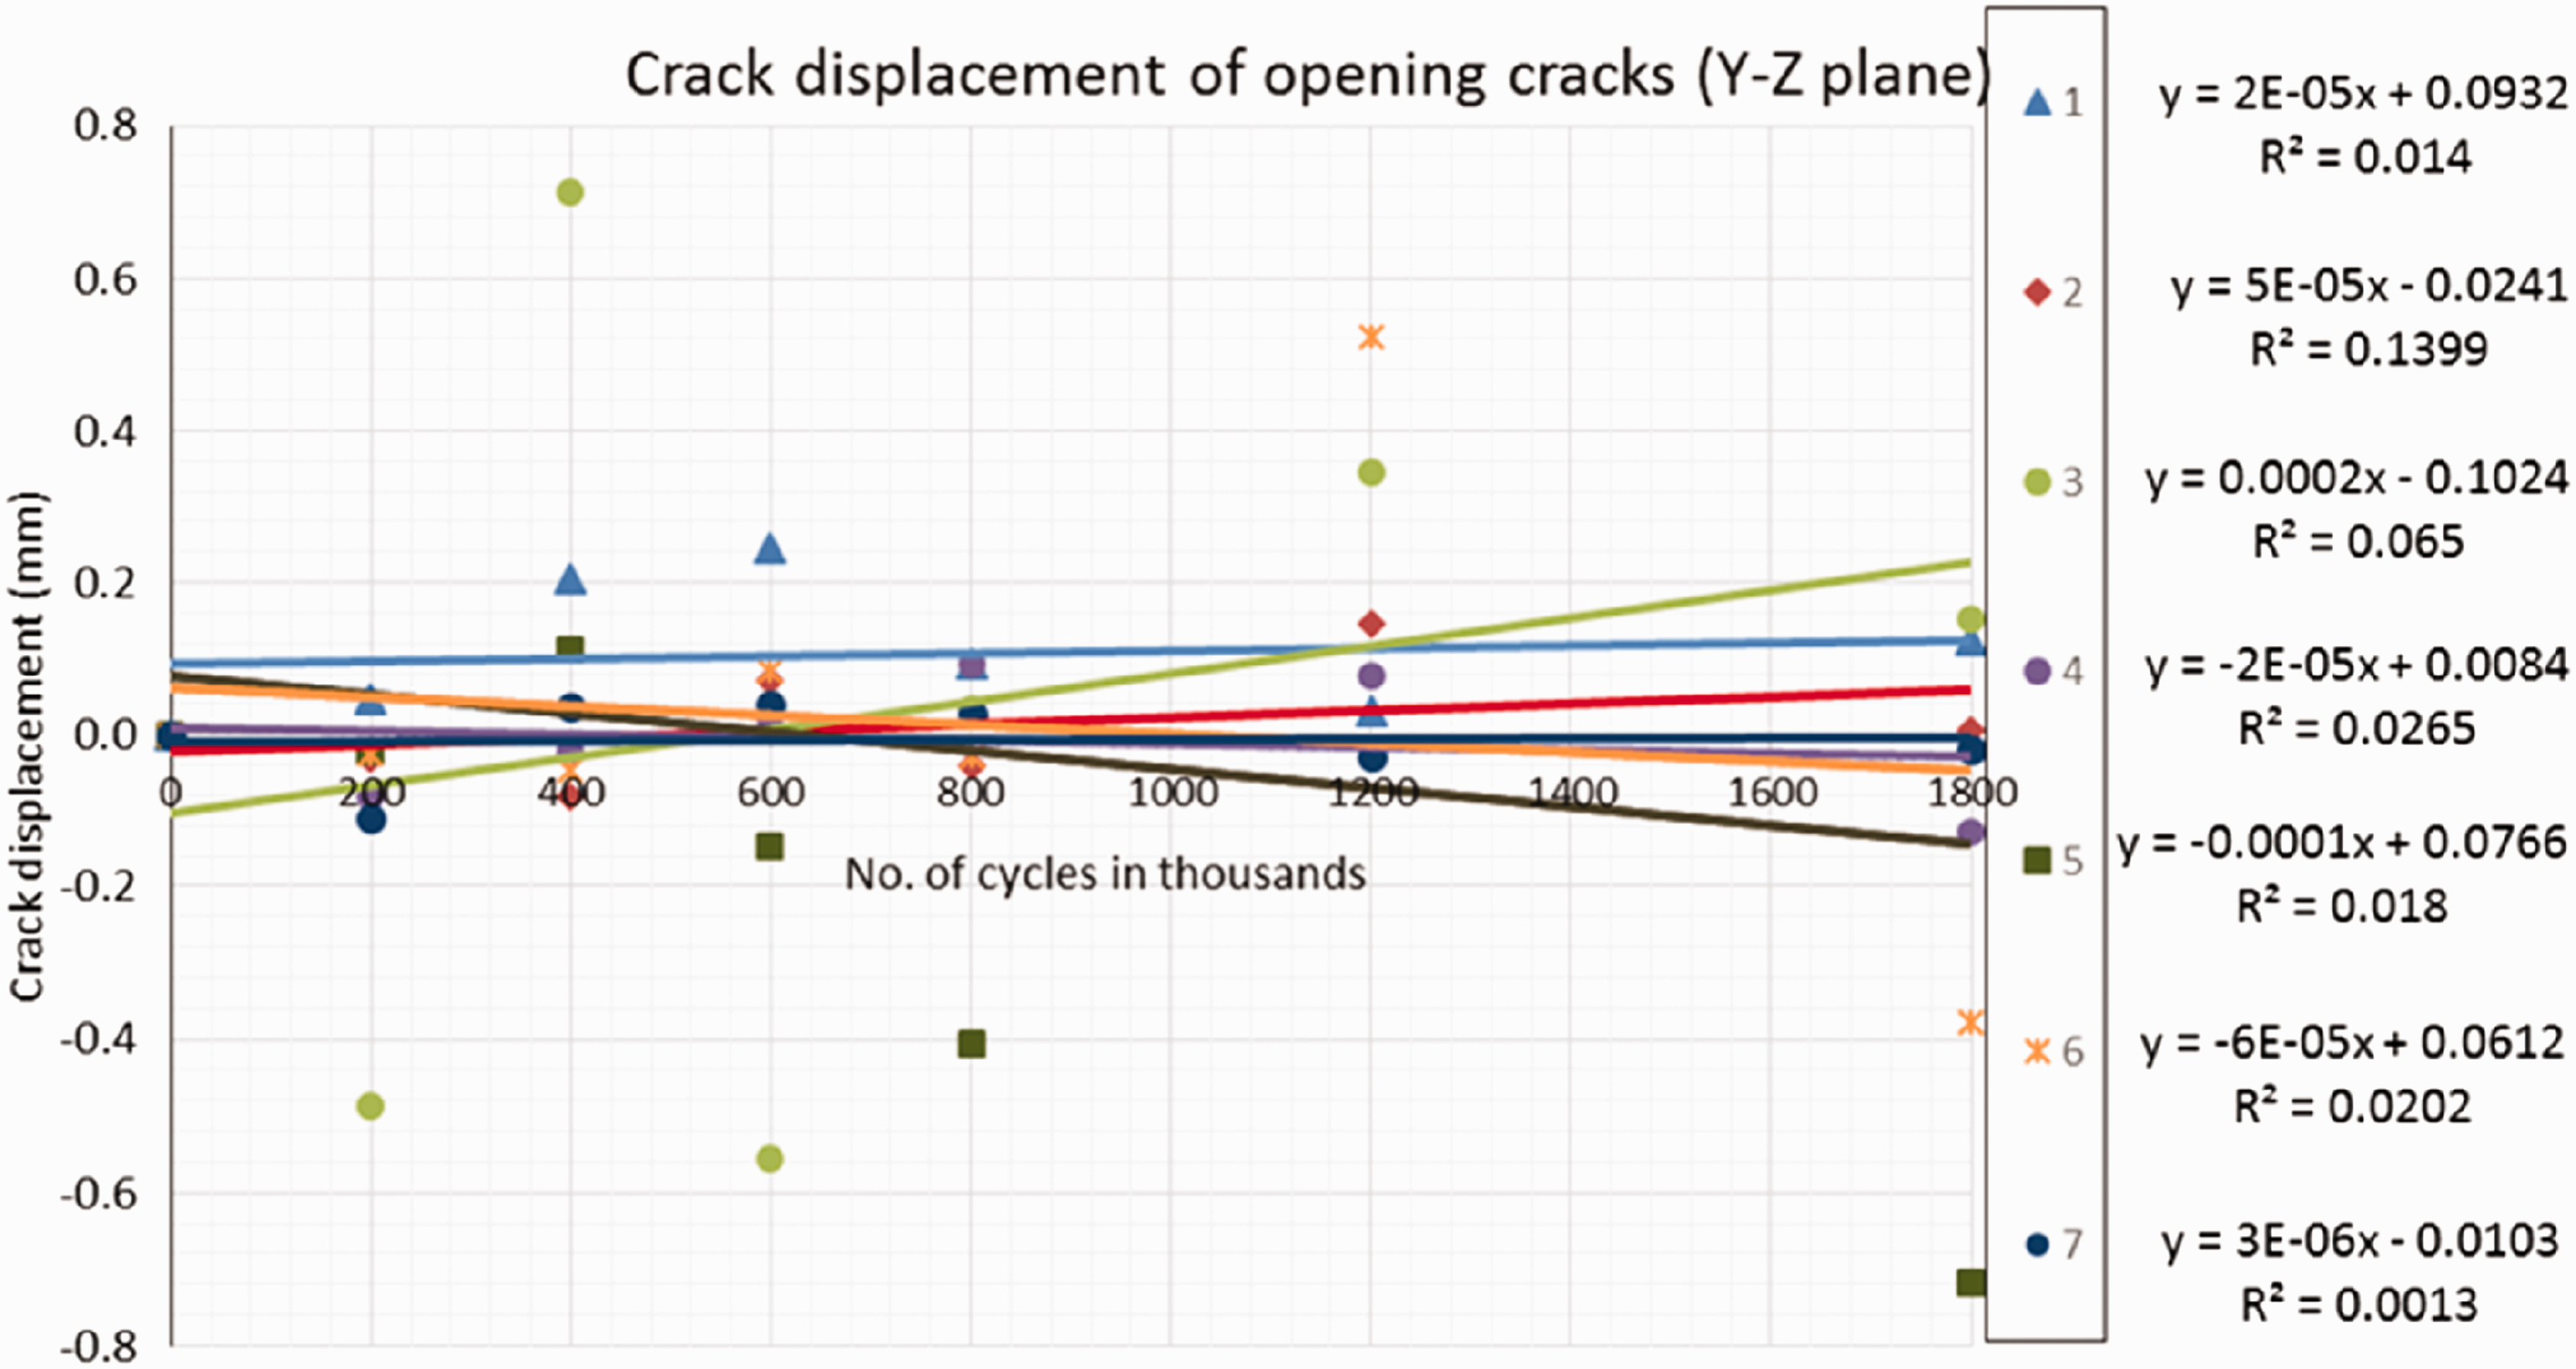
Crack displacements of mode II opening cracks.
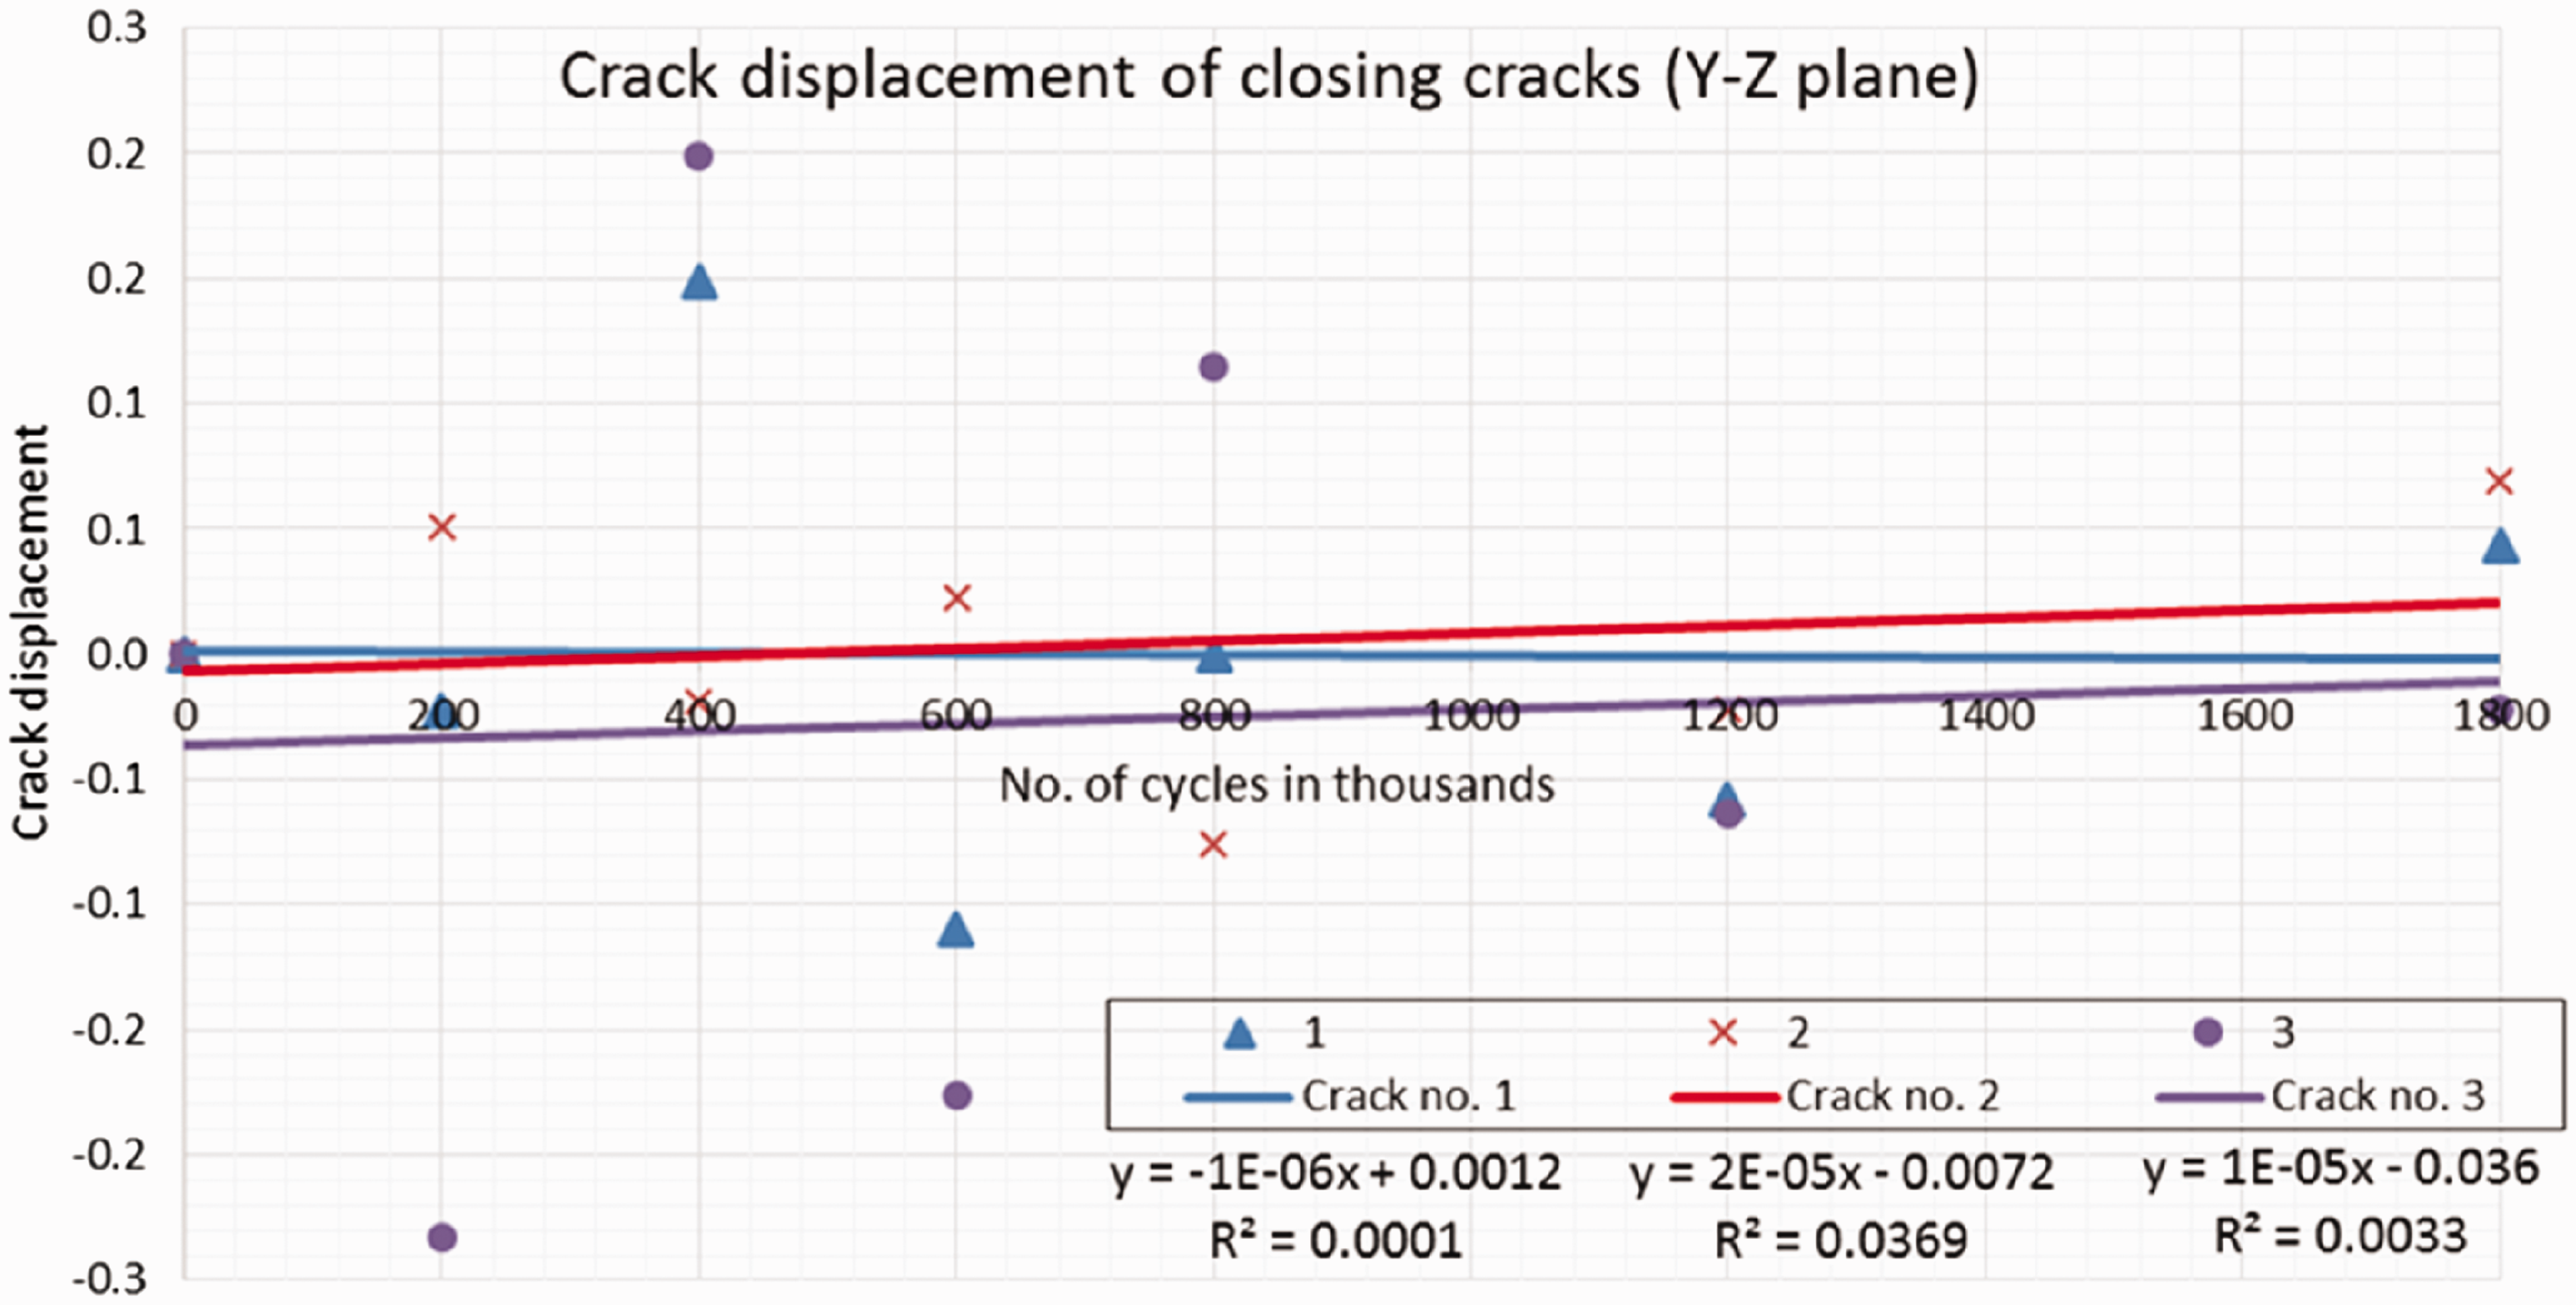
Crack displacements of mode II closing cracks.
X-Y plane
Cracks coordinates and change in length for X-Y plane.
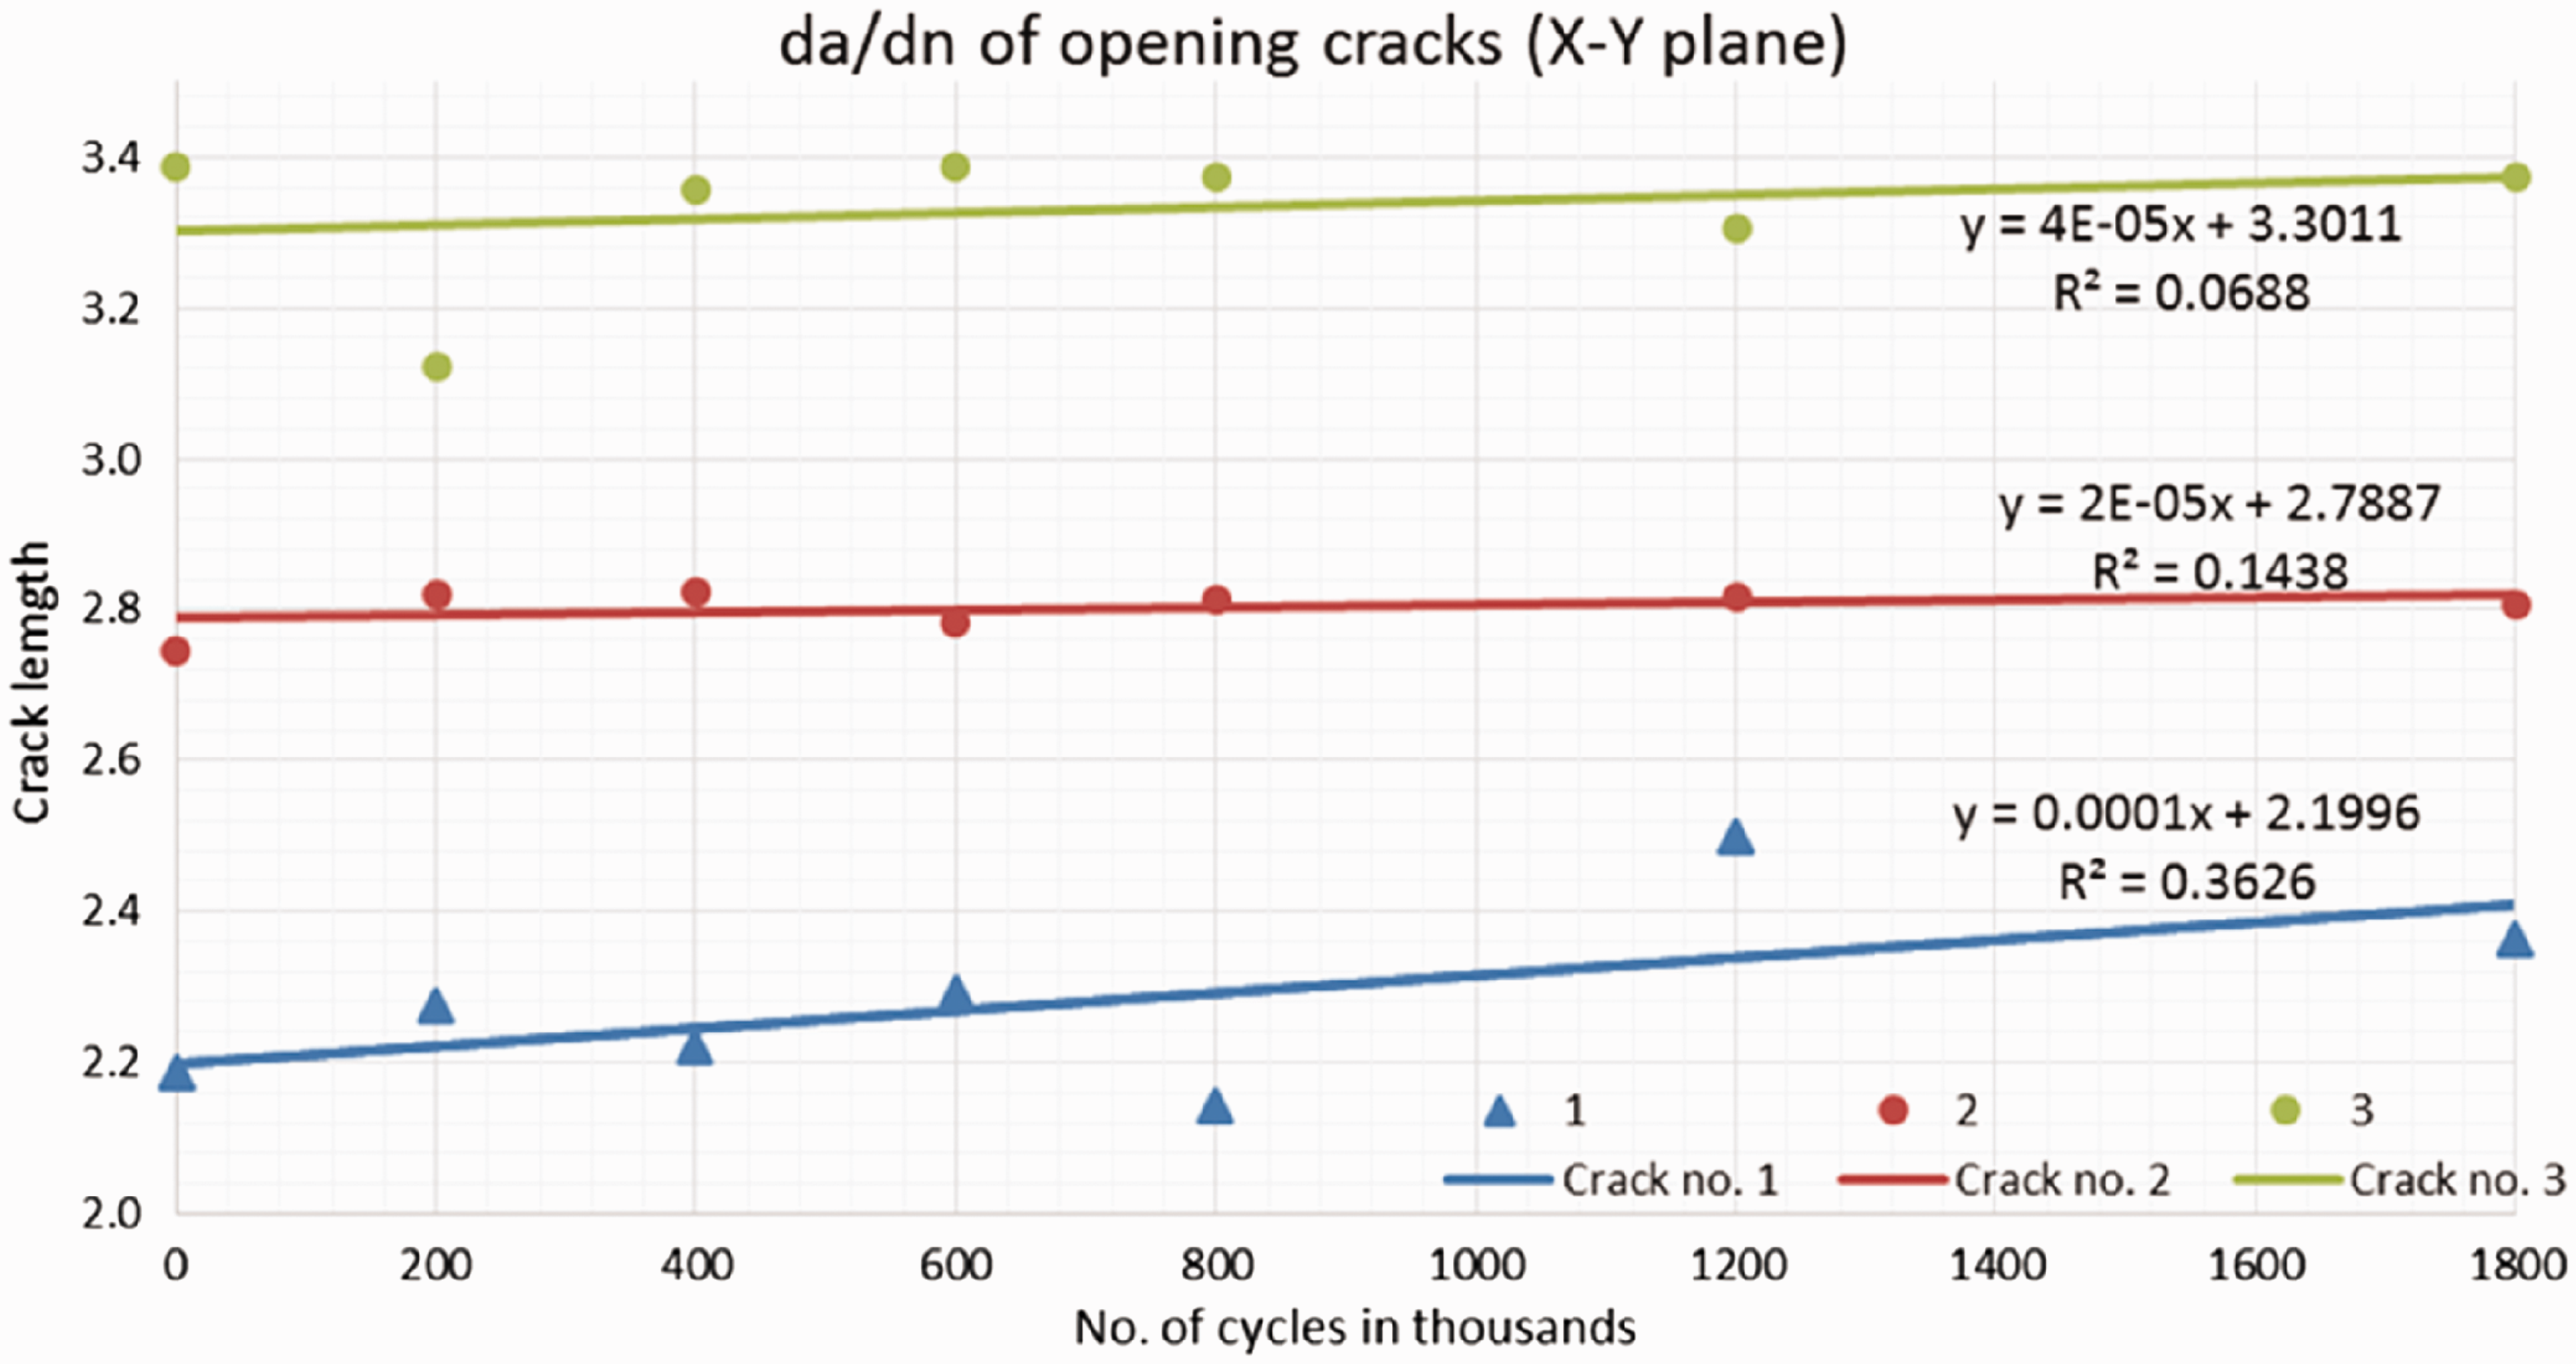
Fatigue crack growth rate of mode III opening cracks.
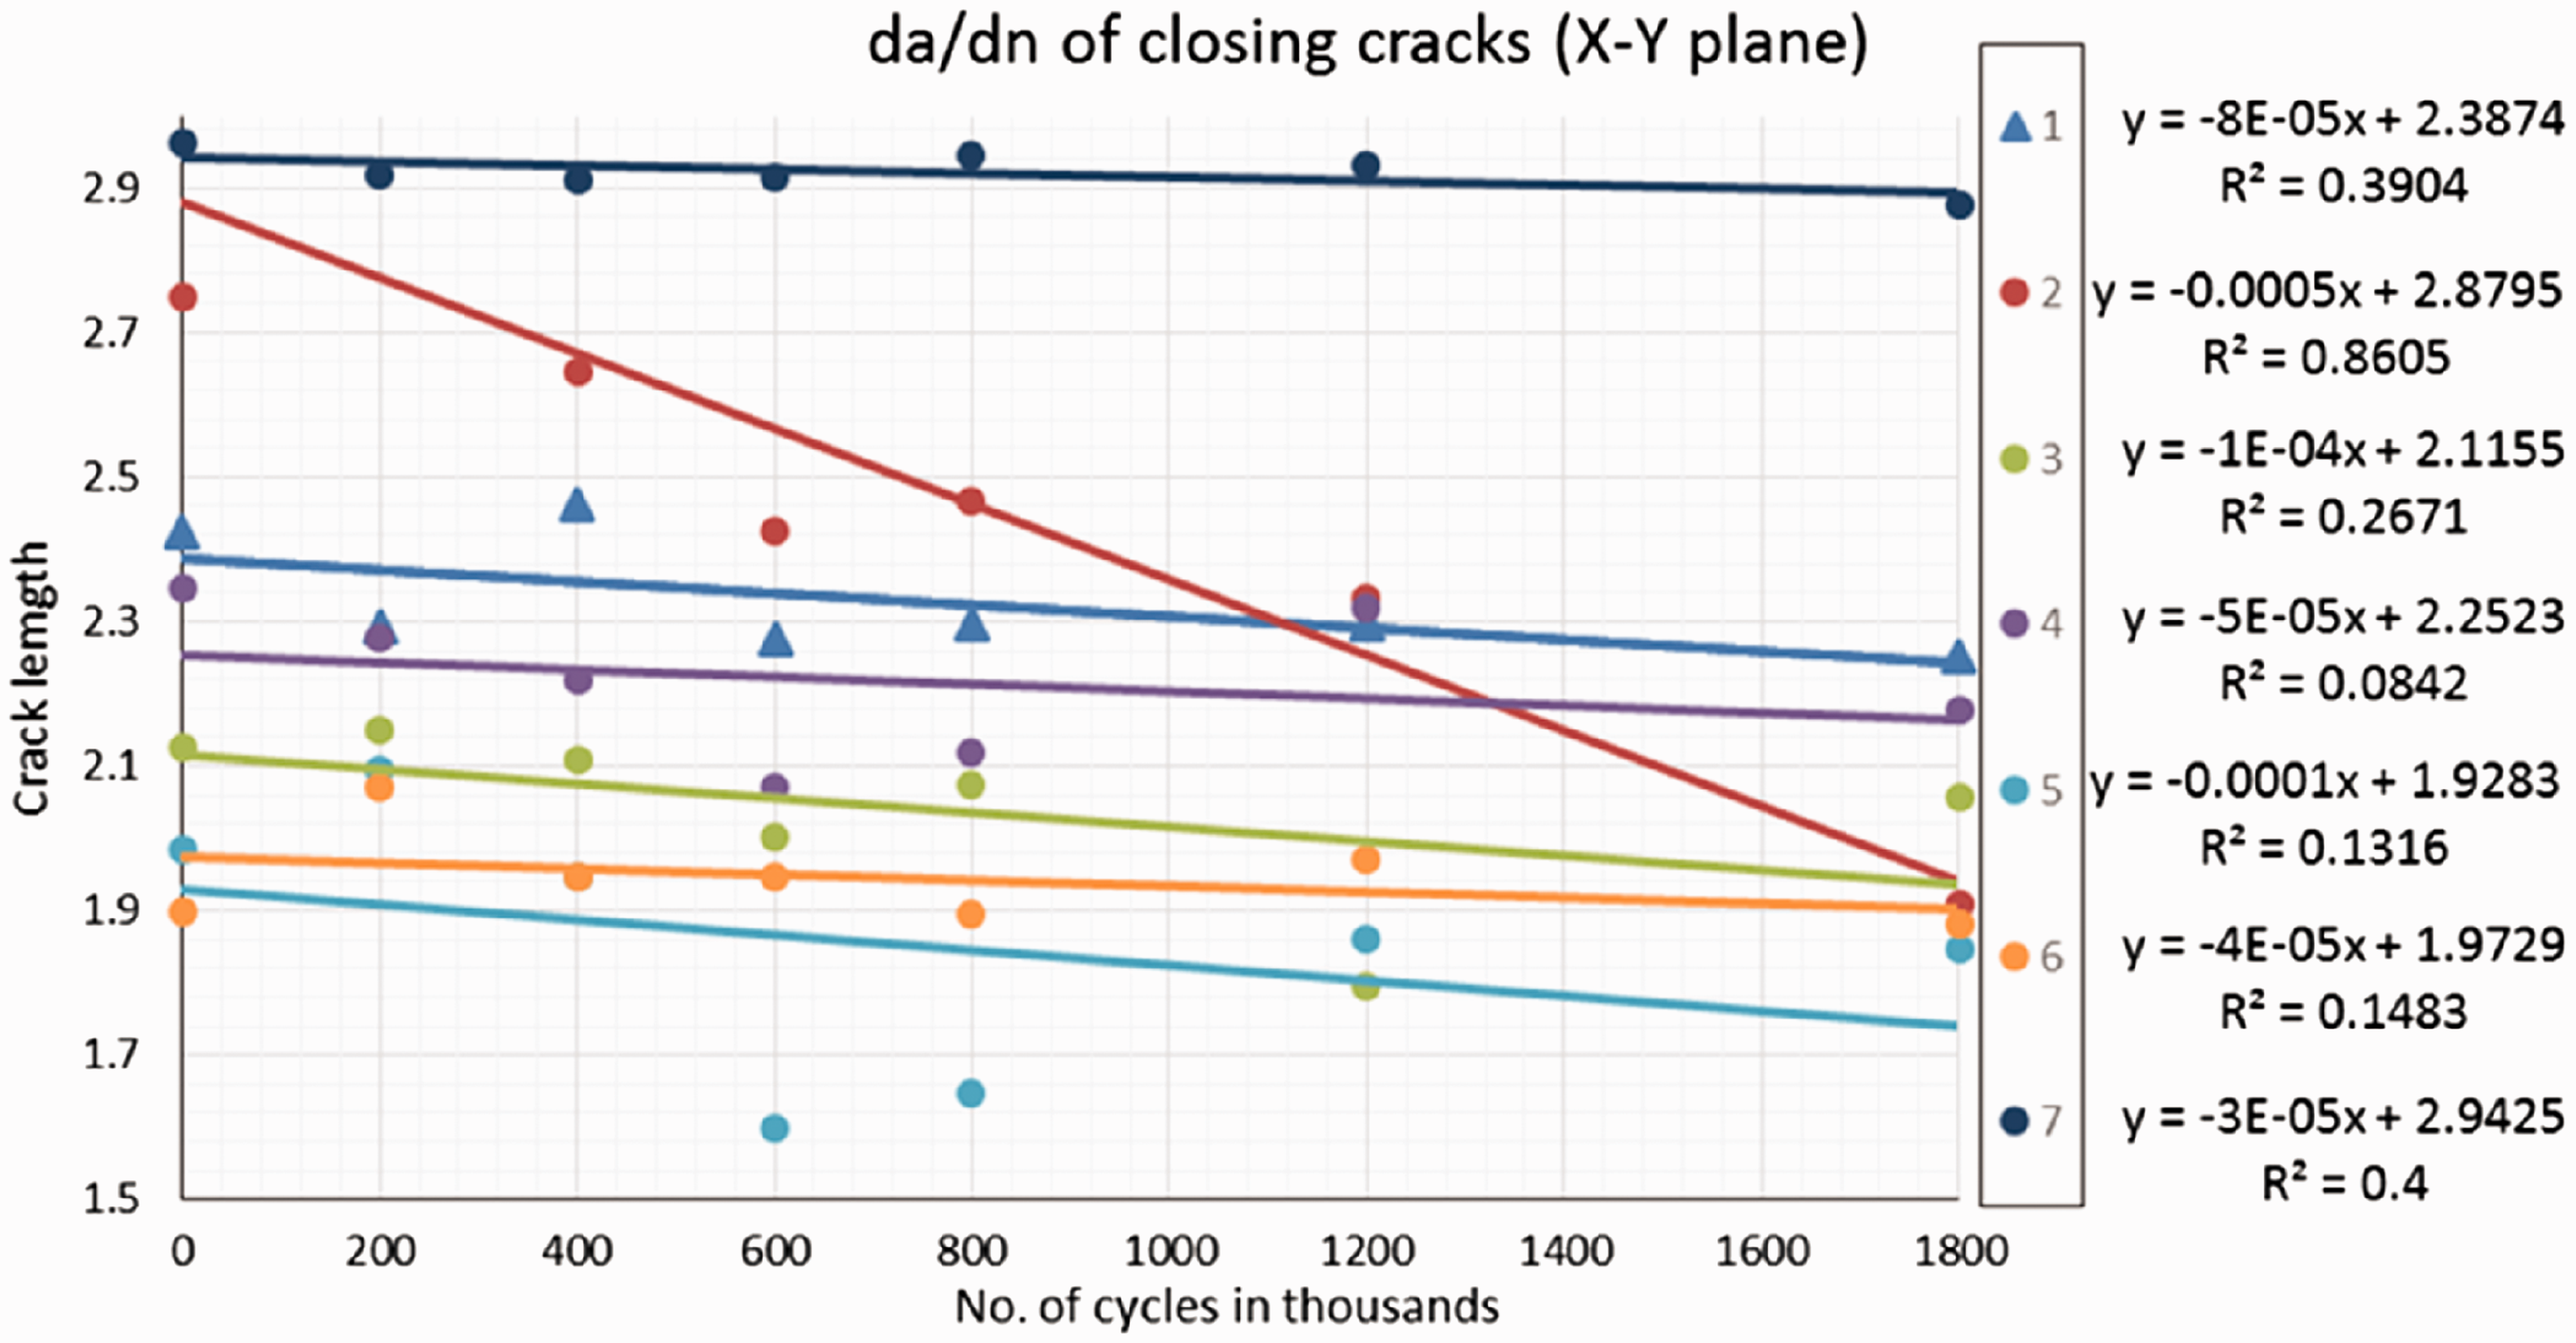
Fatigue crack growth rate of mode III closing cracks.
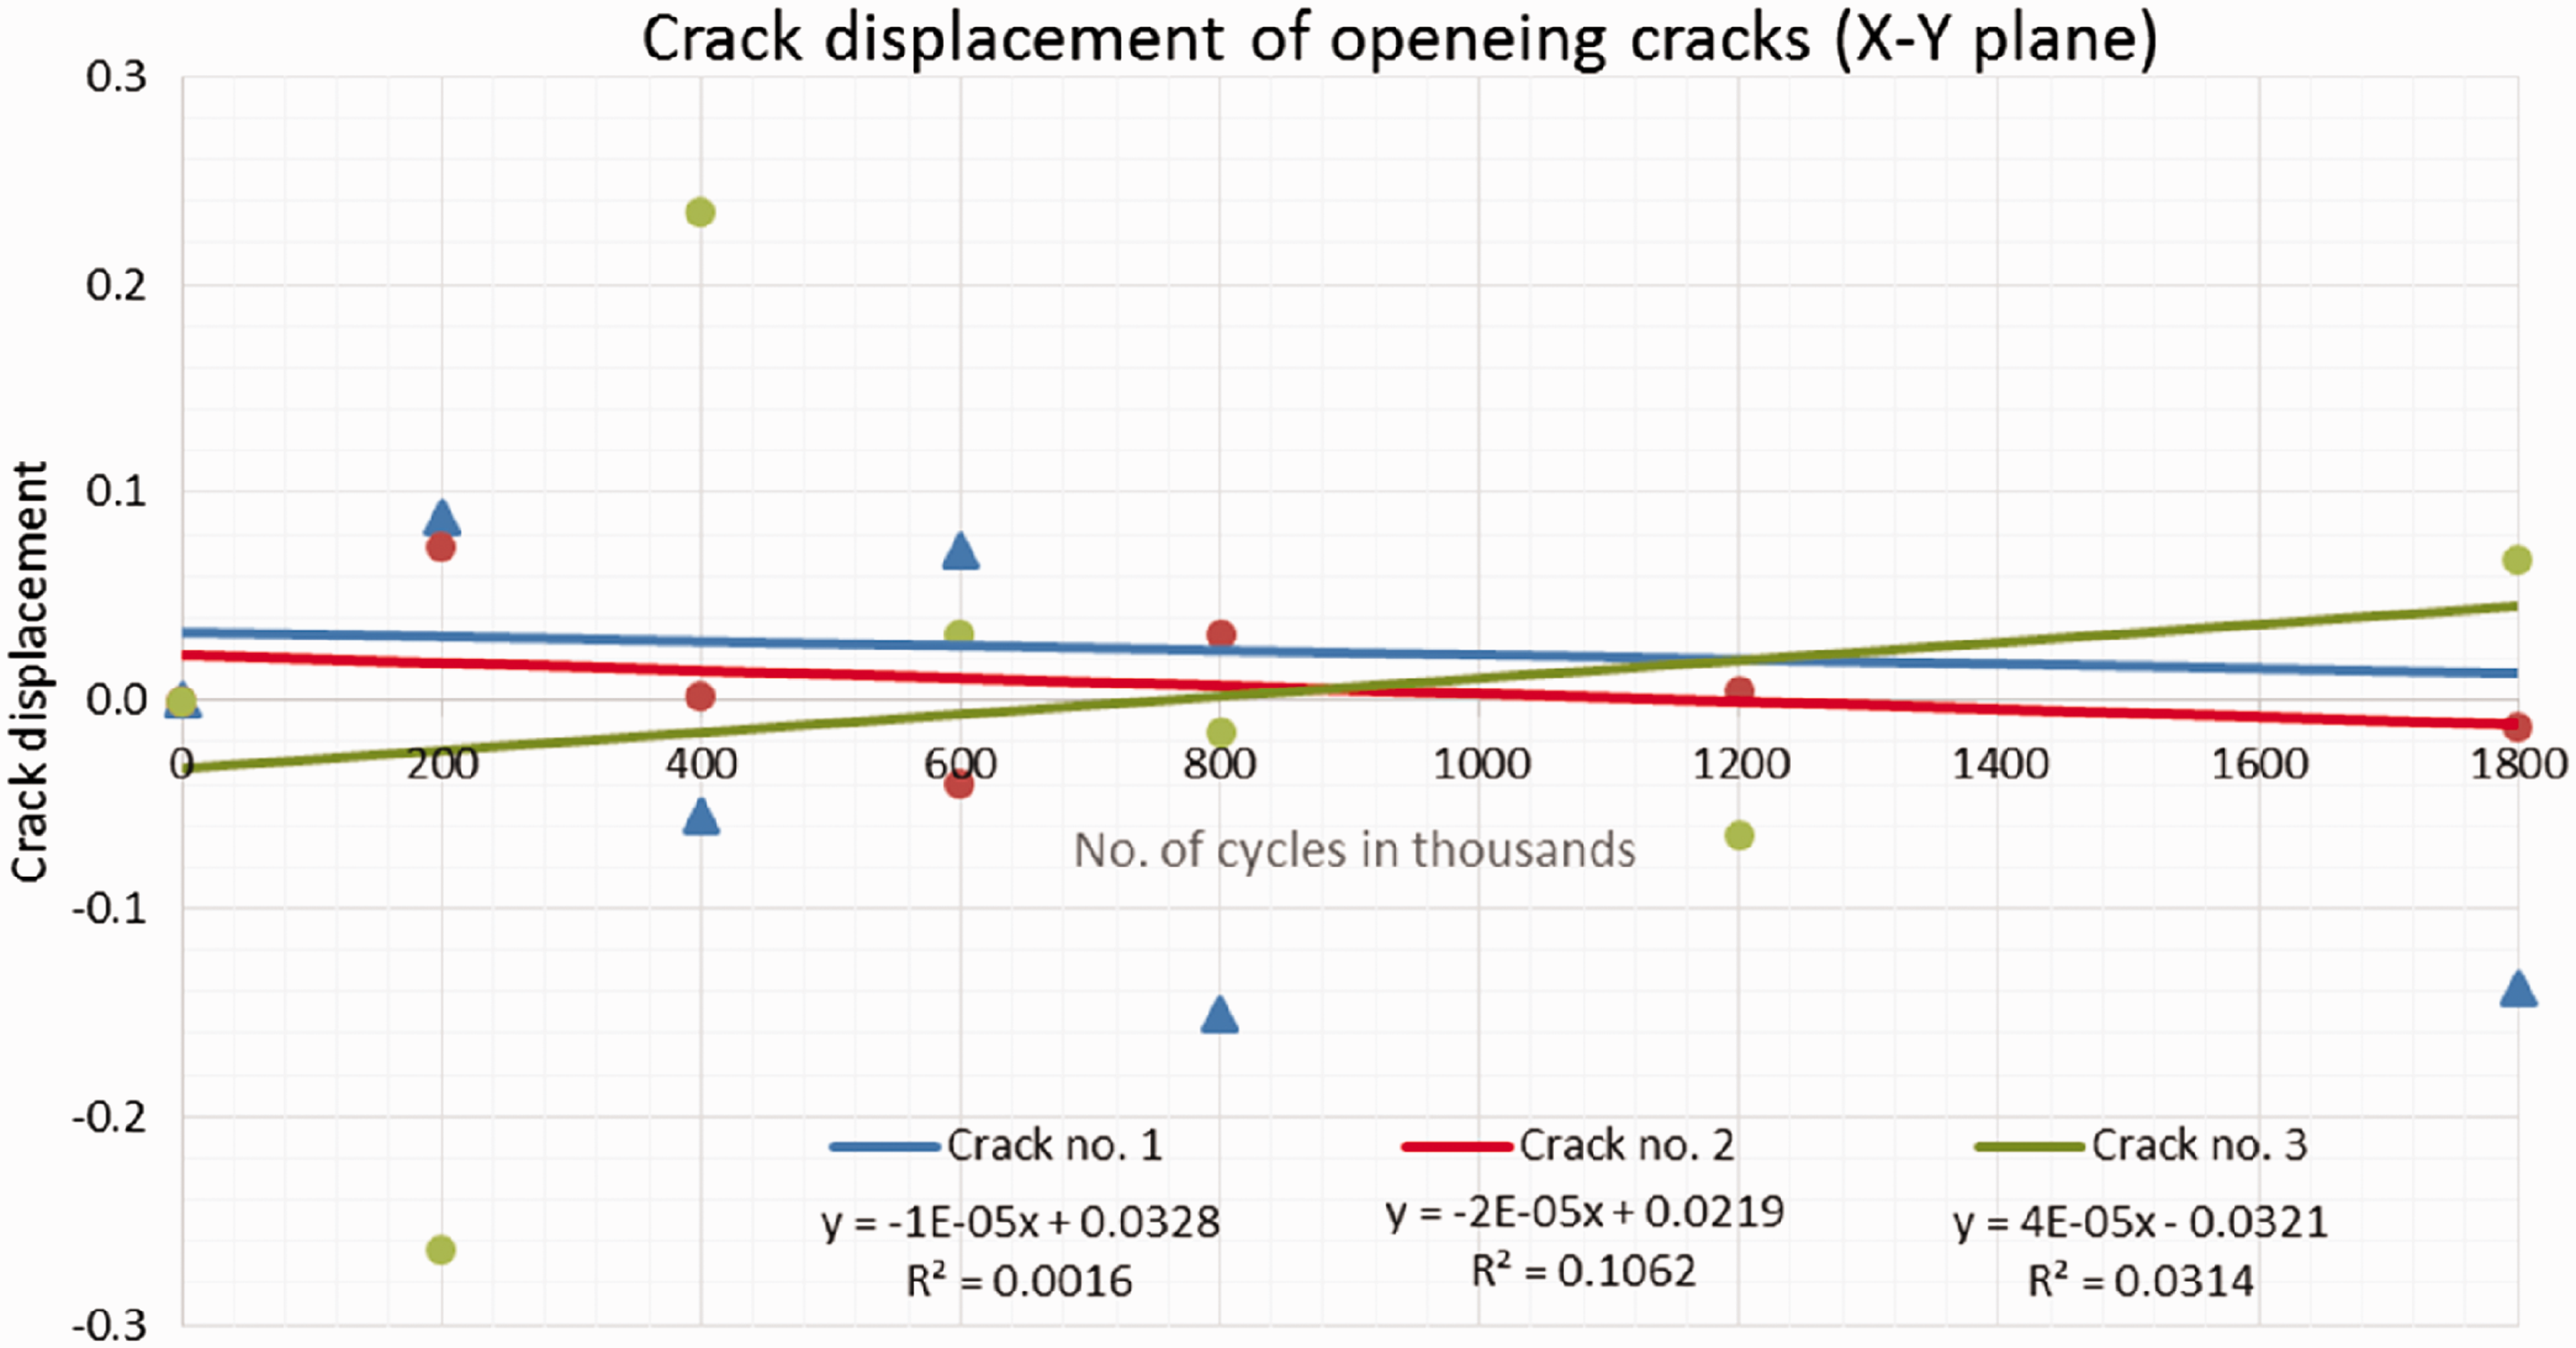
Crack displacements of mode III opening cracks.
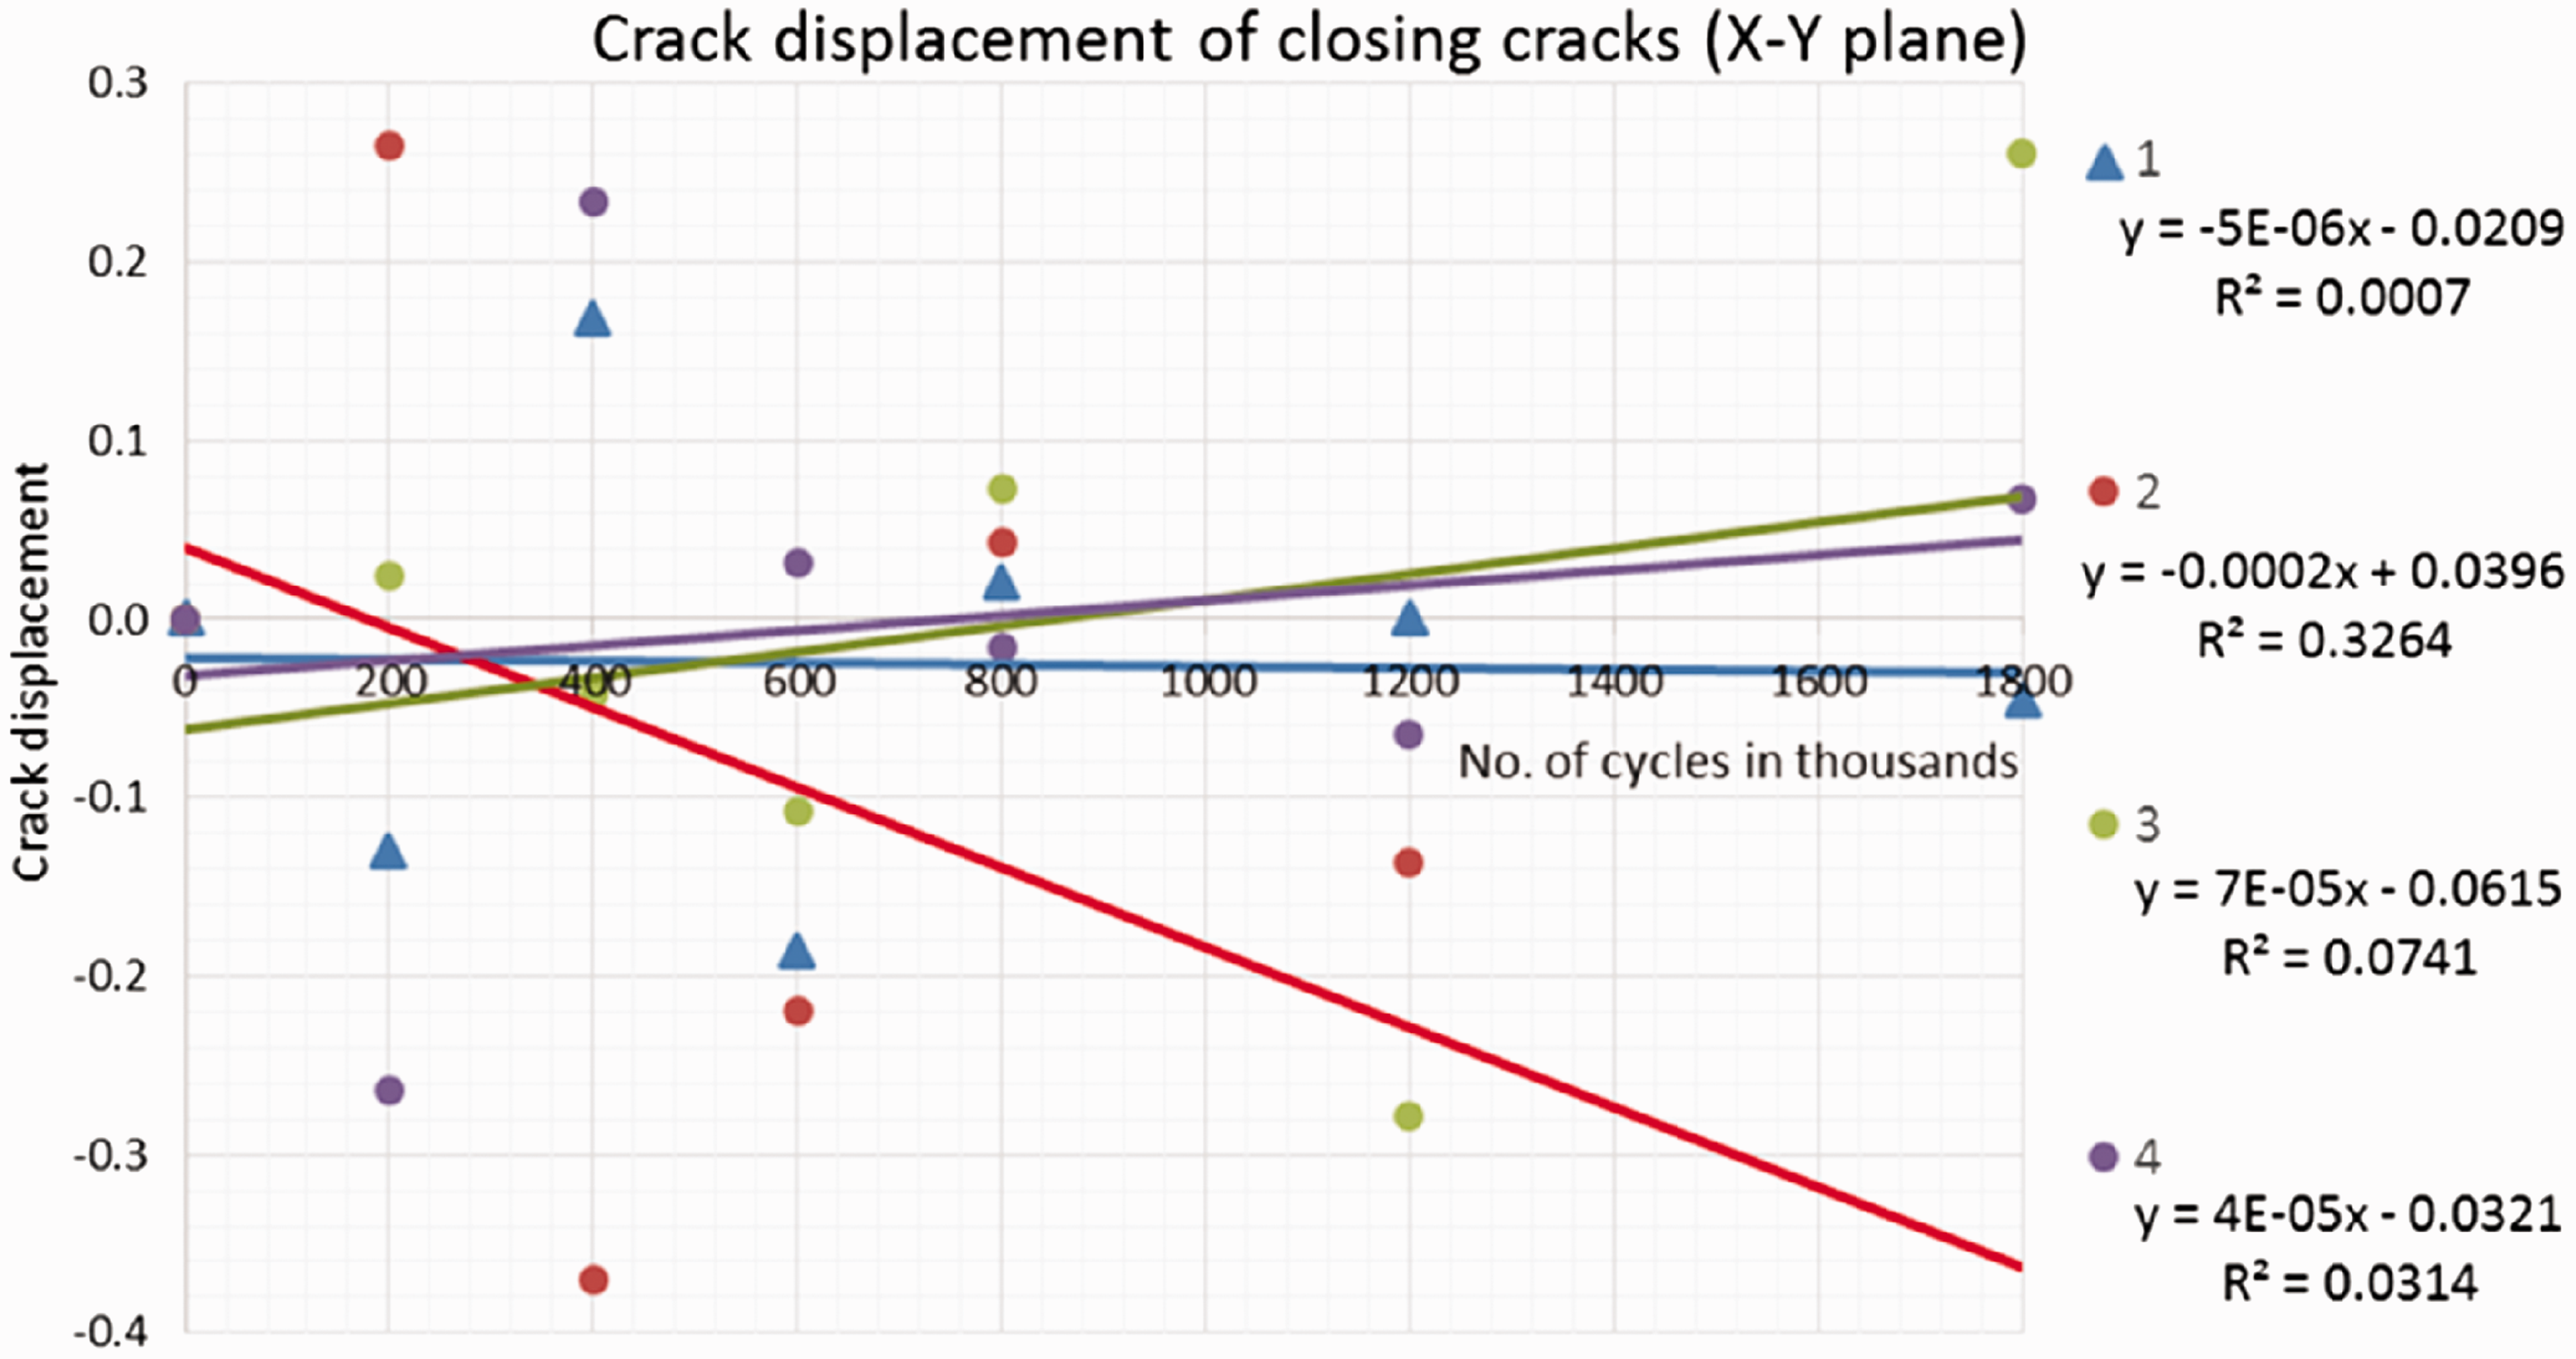
Crack displacements of mode III closing cracks.
Fracture energy and CZM parameters
Calculated values of fatigue crack growth rates in the three planes were directly implemented in LEFM Paris law in its general form, equation (2), using values of constants published by Blanco et al.
3
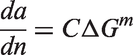
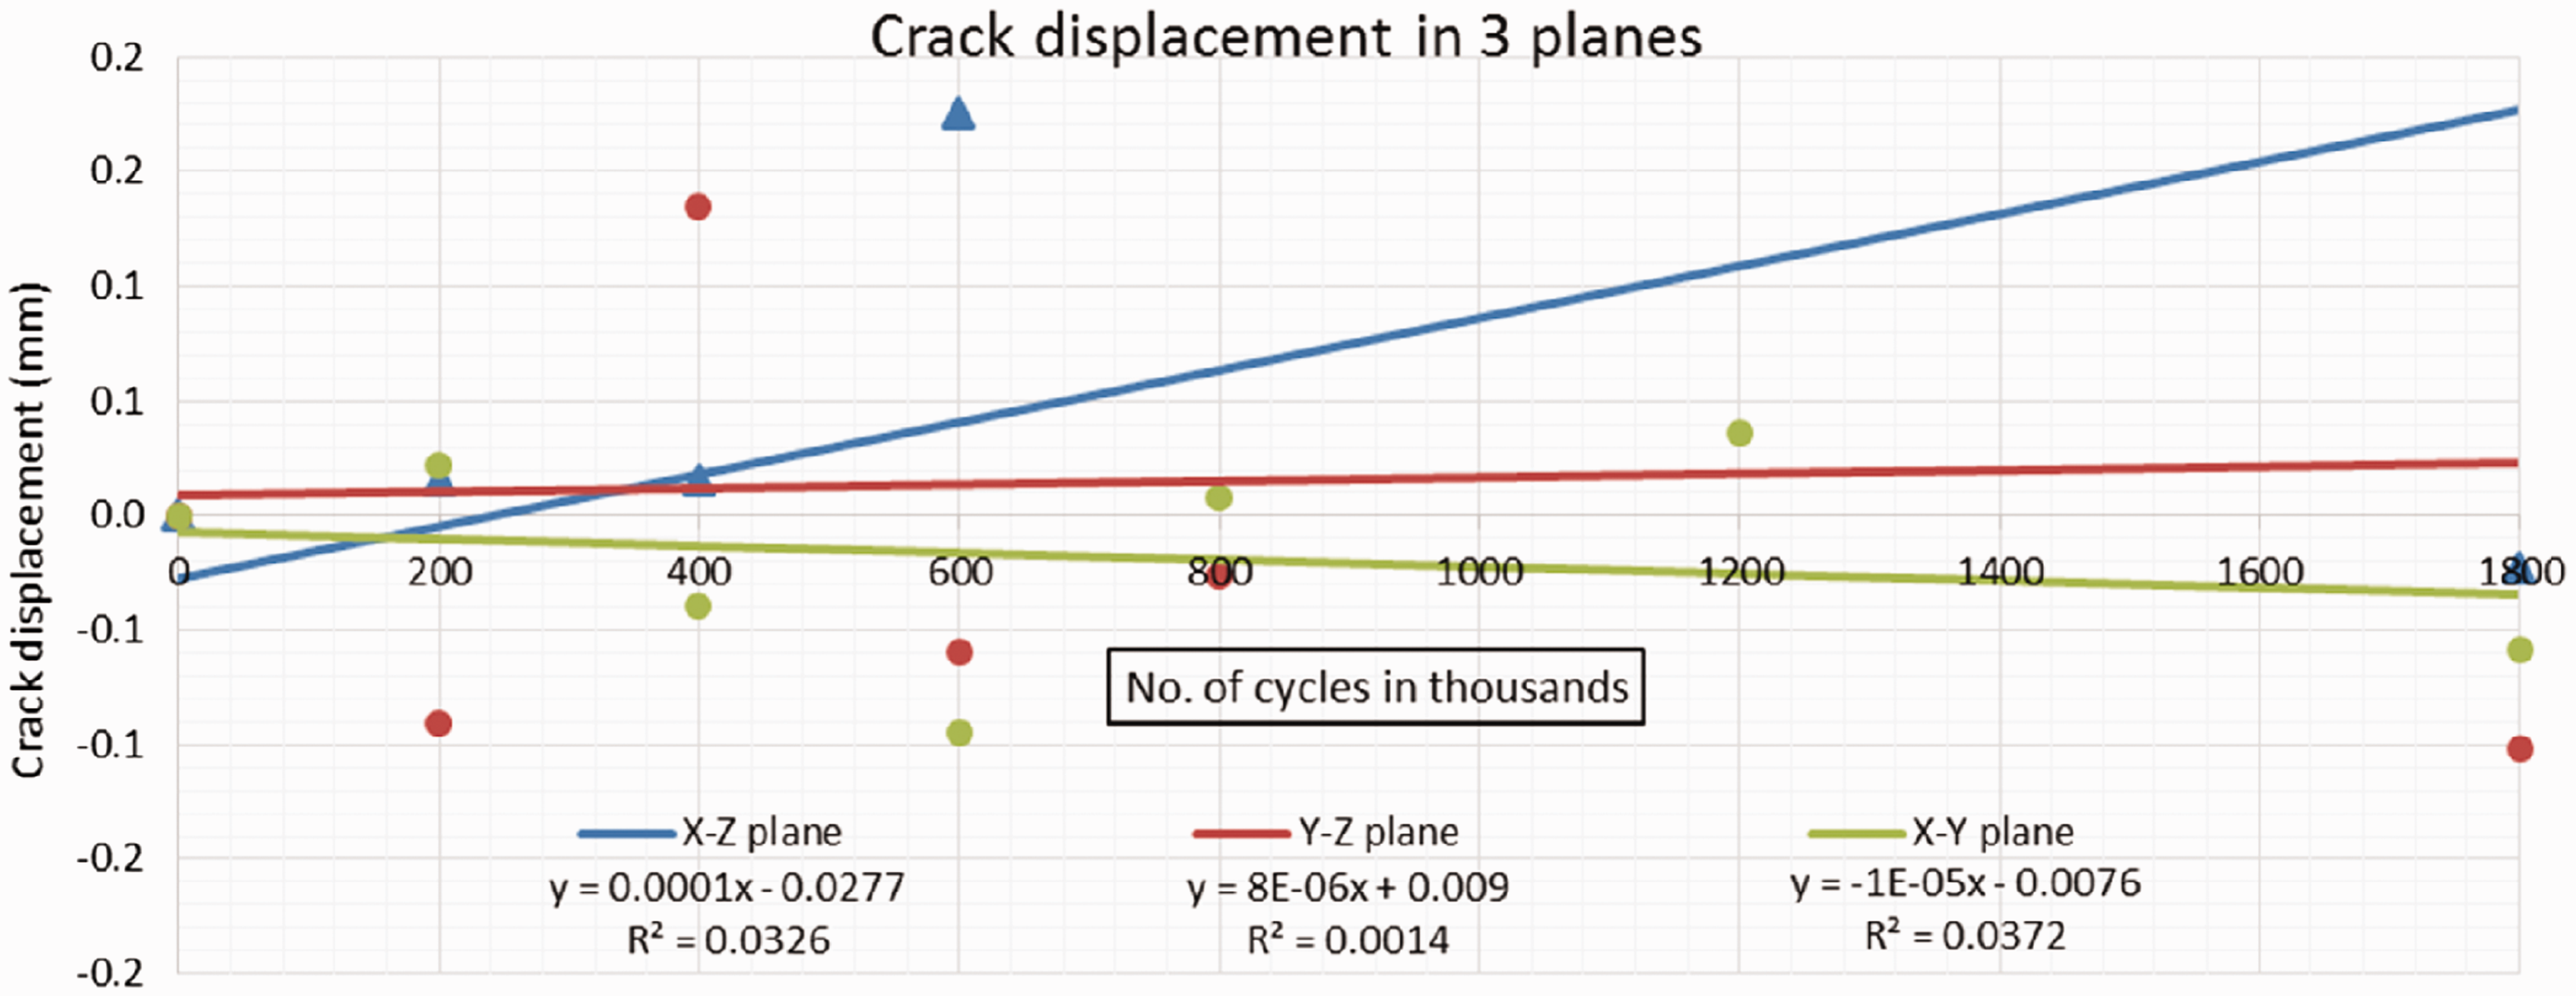
Strain energy release rate (fracture tougness), G, was calculated for the three planes where the slope da/dn of the X-Z plane was assumed to correspond to opening (mode I) fracture energy, GI, while the slope da/dn of the Y-Z plane addressed the in-plane shear (mode II) fracture energy, GII and that of the X-Y plane corresponded to out-of-plane shear (mode III) fracture energy, GIII, seen in Figures 24 and 25. Unit of constant C was in (mm/cycle)(N/mm)−m. Results were GI = 0.16208 N/mm, GII = 0.19344 N/mm and GIII = 0.18265 N/mm.
General trend of fatigue crack growth rate in the three orthogonal planes. General trend of crack displacements in the three orthogonal planes.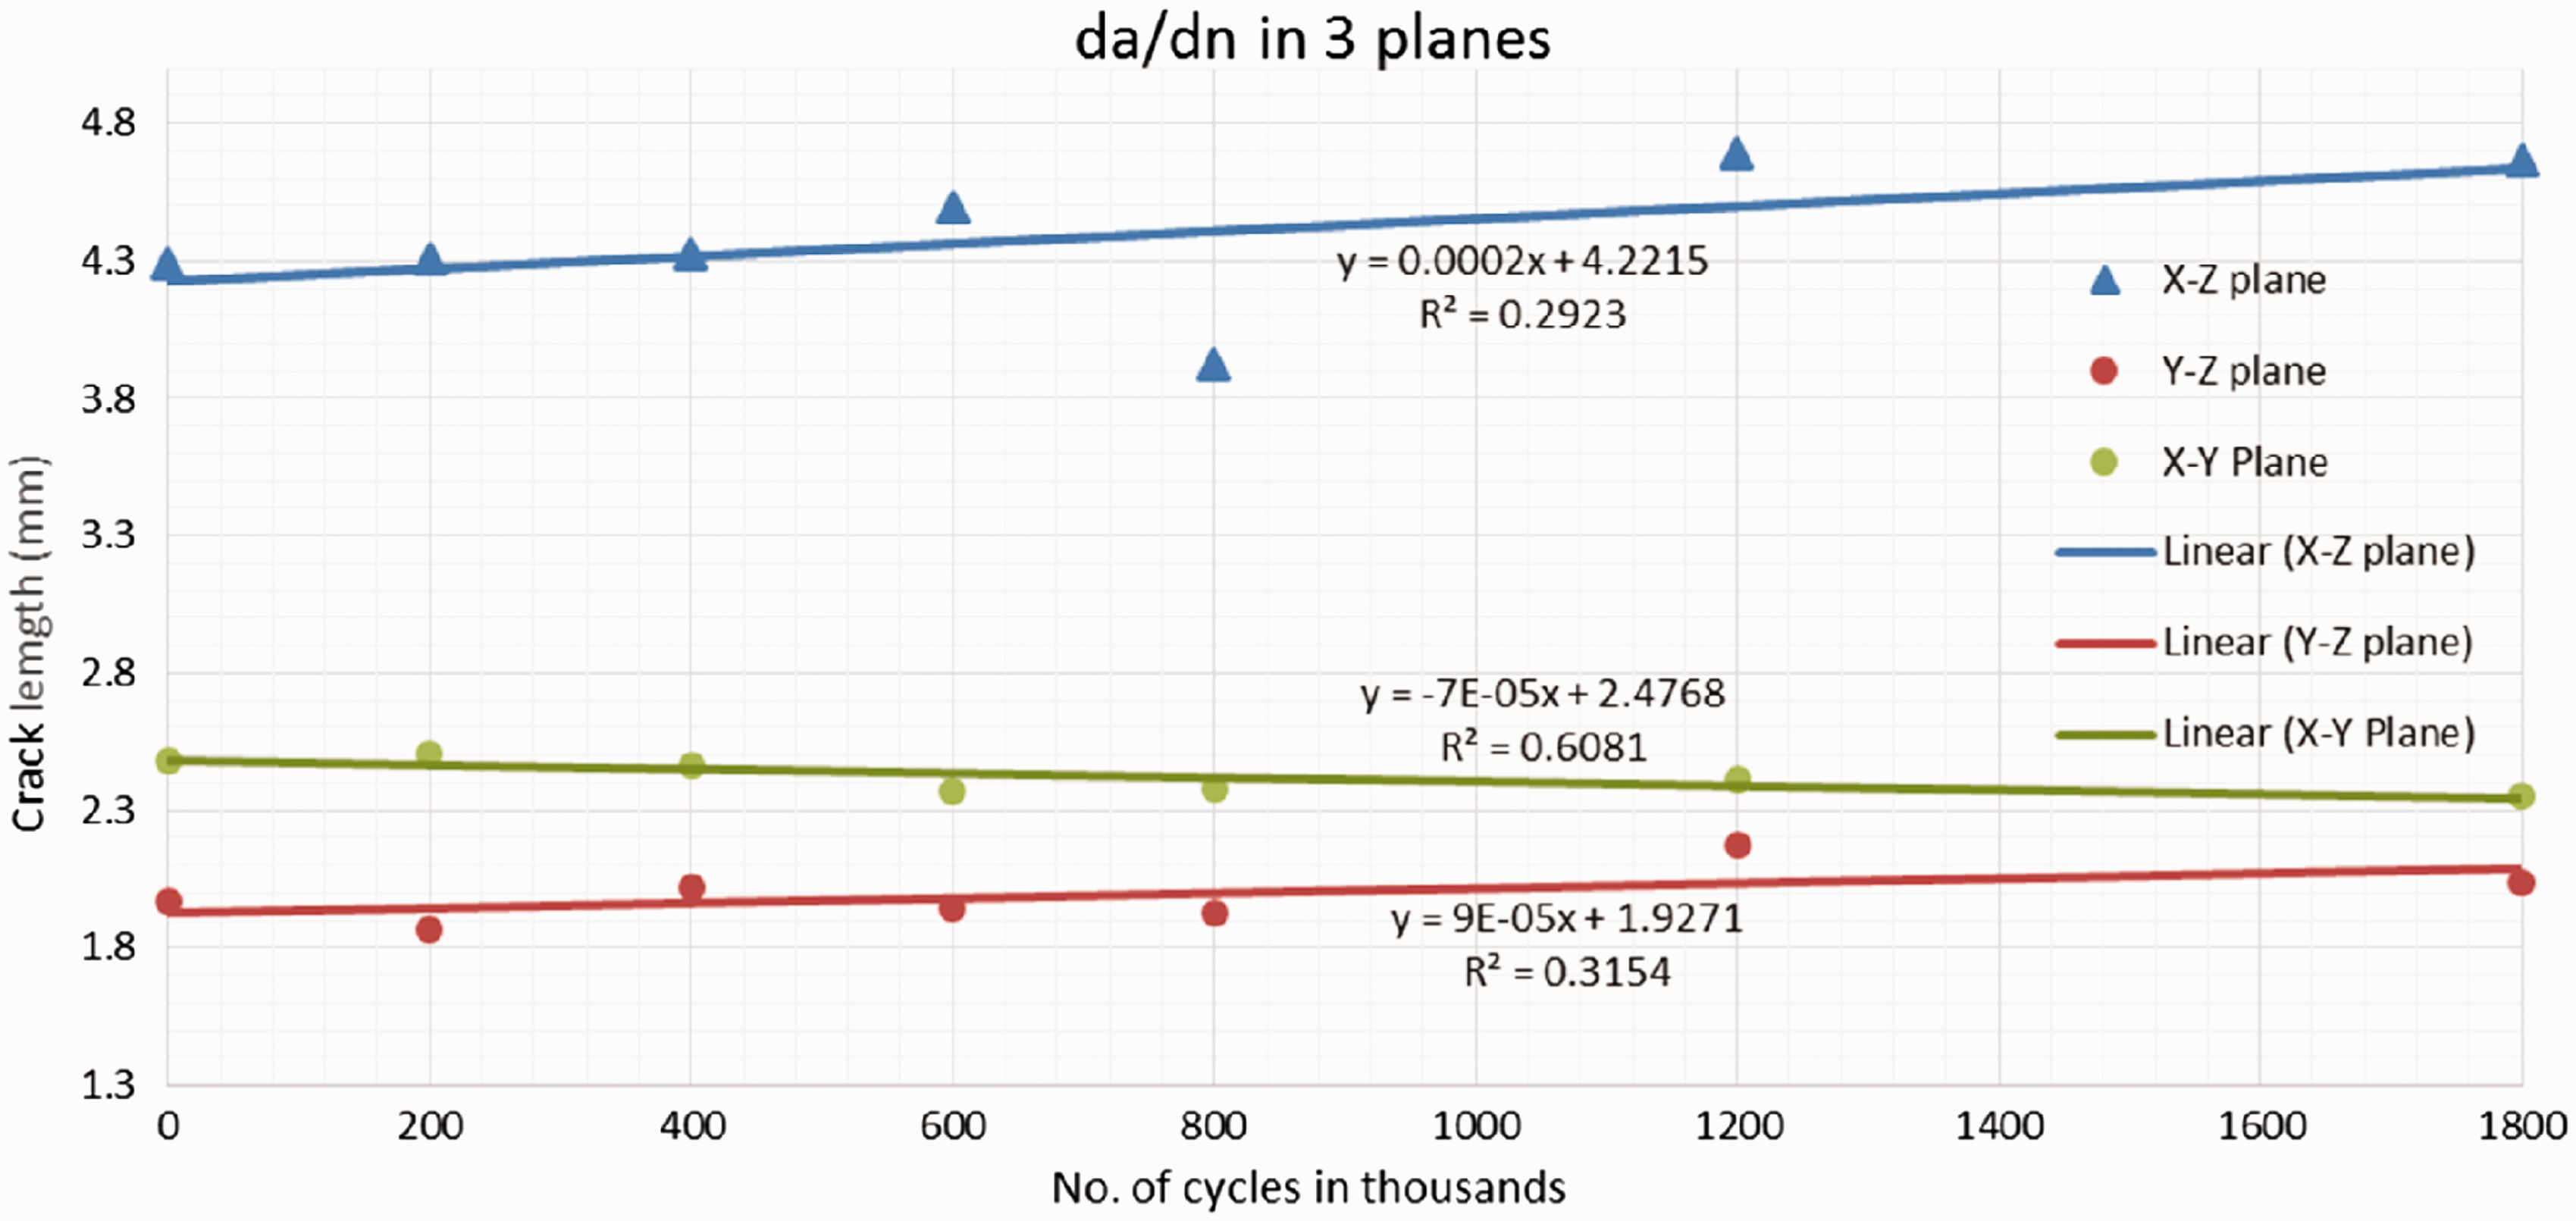
Summary of results.
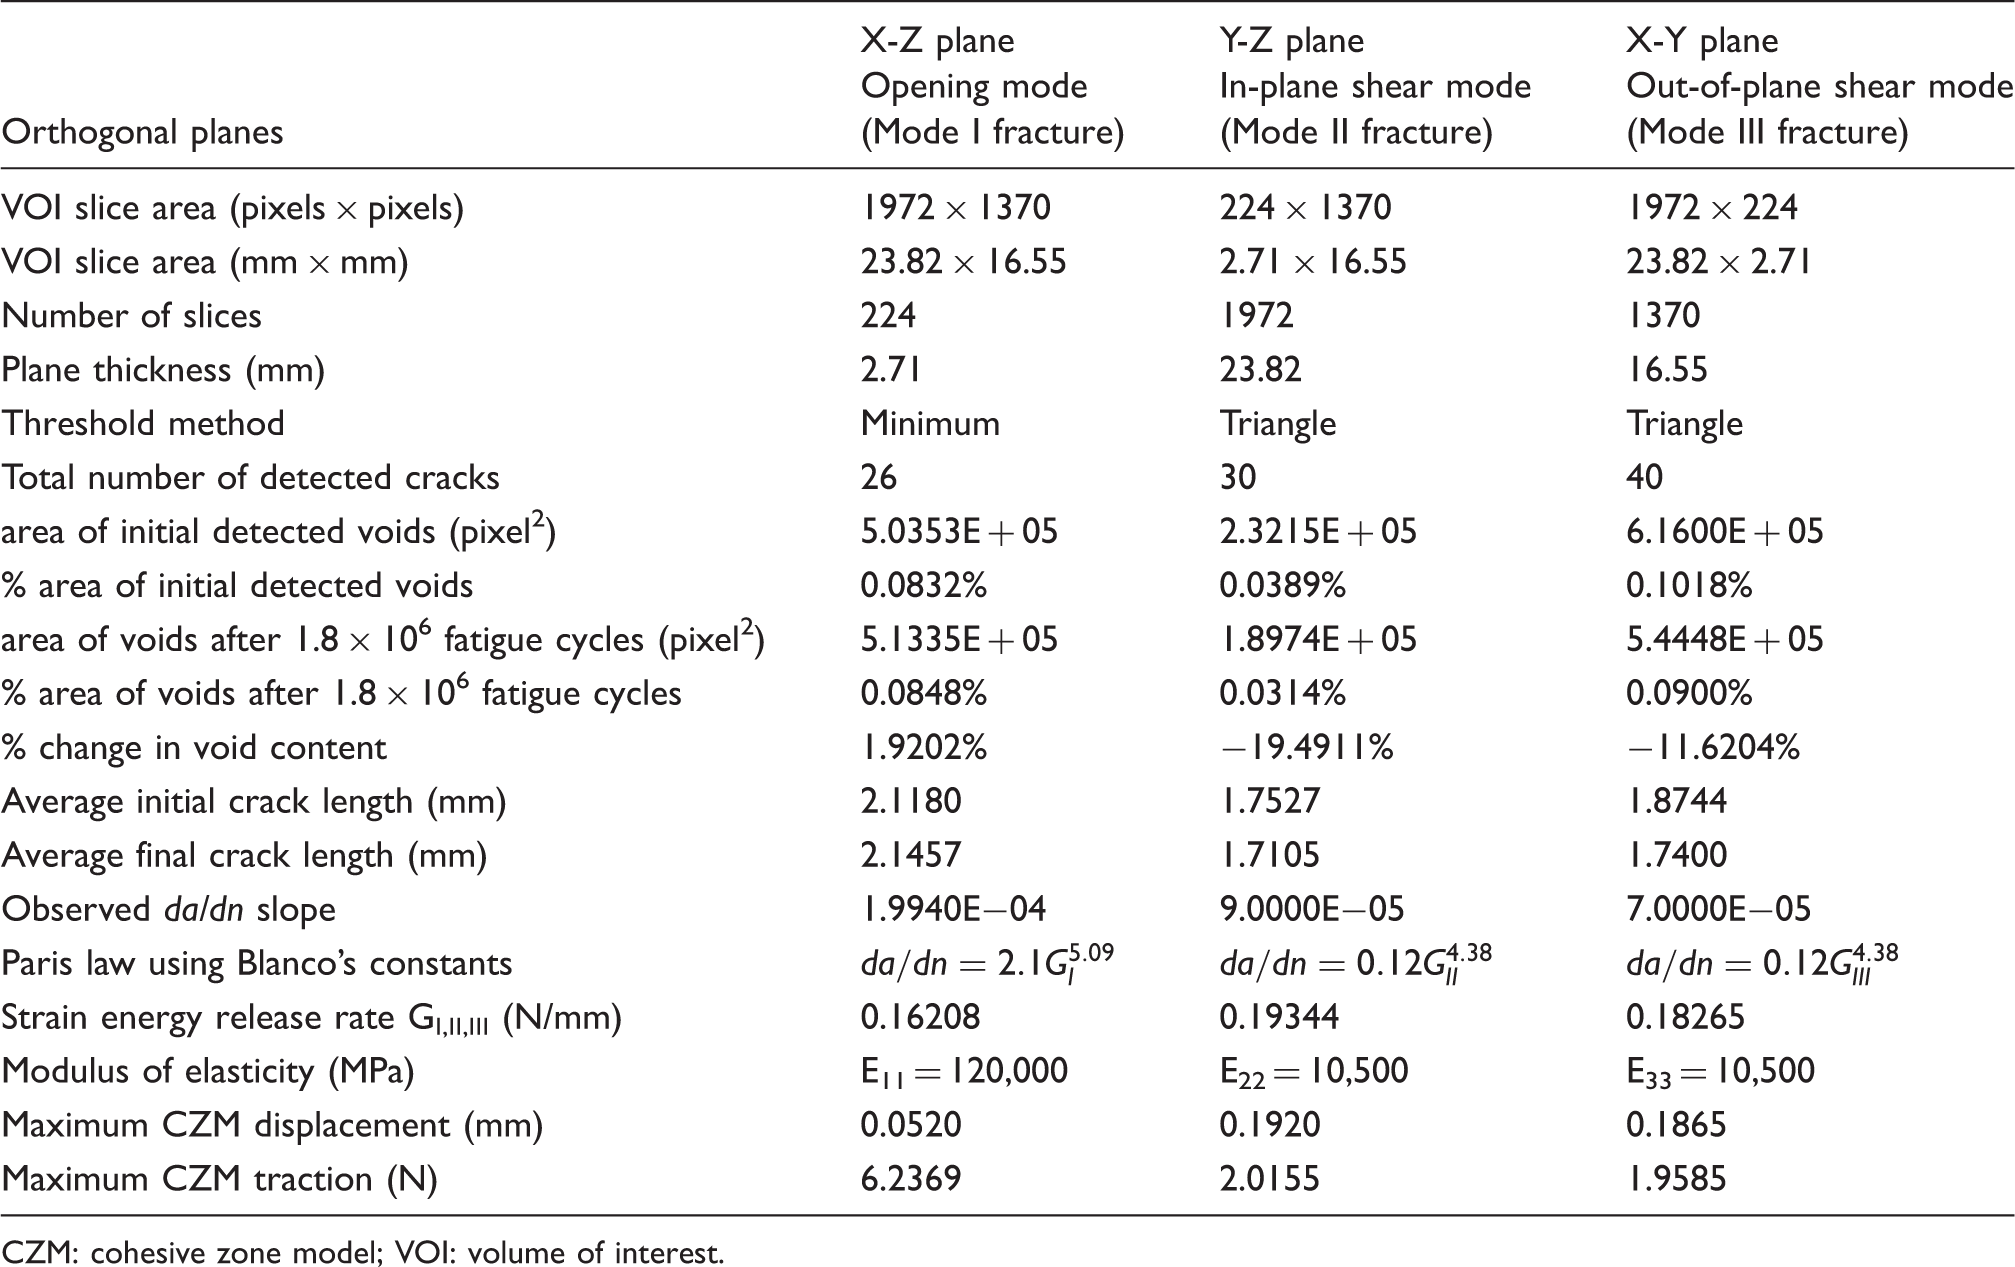
CZM: cohesive zone model; VOI: volume of interest.
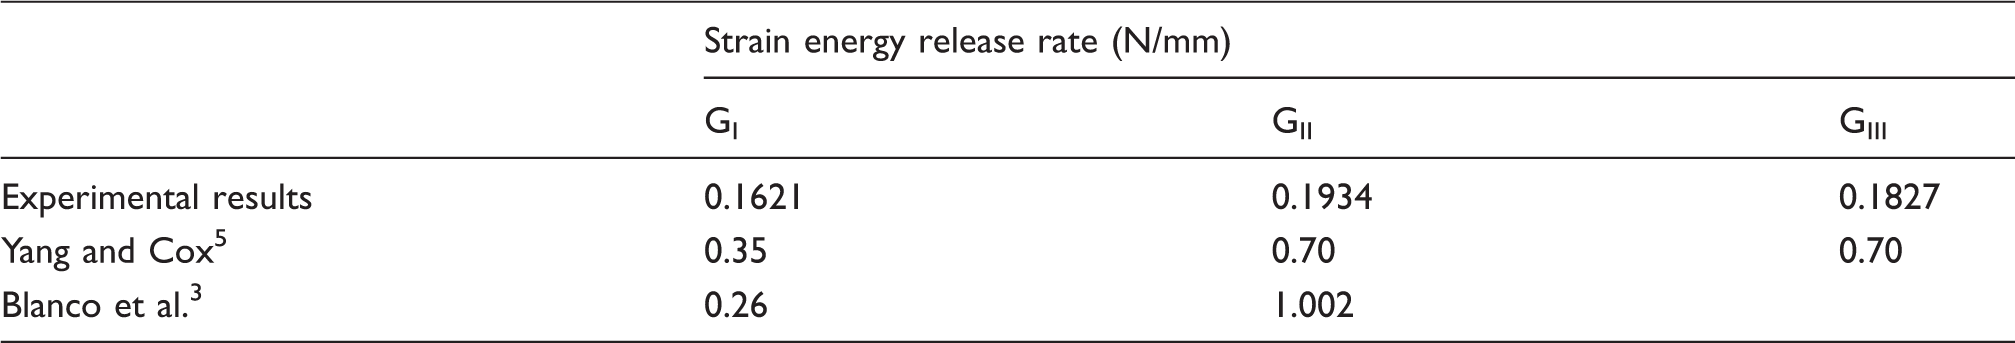
Comparison of published and experimental data.
Conclusion
Ultra high-resolution microCT Skyscan 1173 could successfully provide non-destructive probing of the internal damage propagation caused by constant amplitude fatigue loading in laminated CFRP composites used in aircraft structures. Mesoscopic data of distribution, frequency and geometry of the initially detected cracks and their progression over fatigue life were quantitatively analysed, through studying stacks of image sequences of virtual cross-sections in three orthogonal planes. Fatigue crack growth rates in the three planes were observed and used to calculate strain energy release rate, G, by using LEFM laws. Their values were used to define cohesive zone parameters for the three damage modes: opening, in-plane shear and out-of-plane shear. It was made possible for the first time, to the author’s knowledge, to differntiate between in-plane shear and out-of-plane shear damage modes in terms of fracture toughness, maximum cohesive traction and maximum cohesive separation which were generally assumed to be identical in previous published literature. It is recommended for future work that more samples are to be scanned at varaiable fatigue intervals for providing more datasets and confirm the hypothesis. An overall damage parameter that addresses the accumulation of total damage as a function of fatigue cycles can hence be modelled. Further, it is planned for future work to use the acquired data in writing a user-defined sub-routine for an FEA tool to simulate progressive fatigue crack propagation until failure of laminated CFRP composites.
Footnotes
Declaration of Conflicting Interests
The author(s) declared no potential conflicts of interest with respect to the research, authorship, and/or publication of this article.
Funding
The author(s) received no financial support for the research, authorship, and/or publication of this article.