
Abstract
Cement mortars with different contents of nano silica (NS) were fabricated and tested. Their compressive and flexural strengths showed significant increases. Theoretical calculation and thermogravimetry (TG) analysis, scanning electron microscope (SEM) and X-Ray powder diffraction (XRD), and electrical resistivity test were used to analyze the reinforcing mechanisms of NS. Theoretically, consumed calcium hydroxide (CH) increases with NS content, which indicates that NS has huge potential to react with CH. According to the results of TG, the amount of consumed CH increases and agrees with theoretical calculation when the content of NS is less than 1.5%. However, a plateau is achieved for the mass of consumed CH in results of TG when the content of NS exceeds 1.5%. SEM shows that NS can make matrix dense and also reduce the size of CH in matrix beside interfacial transition zone (ITZ). The results of XRD prove that NS can change the tendency of crystal of CH in cement matrix. However, the change degree of tendency of crystal of CH in cement matrix is lower than that in ITZ. The change trends of electrical resistivity with increasing NS content and curing age are similar with those of flexural and compressive strengths. This indicates that electrical resistivity can reflect strength and structural compactness of cement matrix.
Introduction
Cement and concrete are the most widely used construction materials because they are resistant to water, easily formed into various shapes and sizes, the cheapest, and readily available everywhere. In the foreseeable future, cement and concrete materials will continue to play an important role in construction materials. However, the development of cement and concrete materials is encountering enormous problems and challenges. For example, cement manufacturing consumes high energy and emits out a large amount of carbon dioxide. Additionally, most raw materials of cement are non-renewable. These disadvantages mentioned above are likely to pose great pressure on environment. Increasing attention has also been paid on the security of cement and concrete structures since cement and concrete are brittle materials and usually work with cracks. Moreover, the service environment of cement and concrete structures becomes hard. Therefore, the durability is needed to be considered more carefully during the cement and concrete design and application.
Nanotechnology is an emerging field related to the understanding and control of materials at nanoscale. Recent developments of nanotechnology show significant promise in addressing many of the challenges in various areas. To date, applications and advances of nanotechnology have injected new vitality into cement and concrete materials. 1
Nano silica (NS), seen the promoted of silica slag, has been introduced to cement and concrete materials since 2001. 2 Compared with silica fume, NS has higher fineness, specific surface area and pozzolanic activity.3,4 NS can enhance the mechanical properties3,5–14 and durability15–24 of ordinary and high-performance concrete. Xiao25,26 studied the impact of addition of 3 wt%, 5 wt%, and 10 wt% of NS to cement mortars, and got an increase in compressive and flexural strengths. Haruehansapong et al. 27 fabricated cement mortars containing different contents (3%, 6%, 9%, and 12% of cement weight) of NS with various sizes of 12 nm, 20 nm, and 40 nm. They observed that 40 nm size NS is more effective for improving compressive strengths compared with 12 nm and 20 nm size NS. The optimum content of 9% NS can improve compressive strength to 1.5 times at 28 d against the plain cement mortars. Ghafari et al. 3 prepared ultra high-performance concrete with NS. They found that NS significantly increased the early compressive strength. Quercia et al. 28 found that the addition of NS can increase the freeze-thaw resistance. In addition, the self-compacting concrete (SCC) with colloidal NS had better freeze-thaw resistance than that with powder NS. What’s more, NS can also improve the early age mechanical properties of fly ash concrete, ground ceramic powder concrete, recycled aggregate concrete, and other green concrete, 29 thus broadening the road of green concrete. Li 30 incorporated 4% NS into concrete with 50 wt% fly ash and obtained an increase of 81% in compressive strengths compared with concrete with only 50 wt% fly ash at 3 d. Lin et al. 31 found that NS can increase the compressive strength of sludge/fly ash cement mortars. Heidari et al. 32 fabricated concrete with 0.5–1% of NS and 10–25% of ground ceramic powder and observed that using NS and ground ceramic powder simultaneously leads to improving compressive strength and reducing water absorption capacity.
Reinforcing mechanisms of NS to cement and concrete materials has also been explored. The contributing factors for enhancement mechanisms may include nucleus effect,11,33 filler effect, 12 and pozzolanic reaction. 33 NS inside the hydration products can prevent the crystal (such as calcium hydroxide (CH) and ettringite (AFt)) from forming big size due to nucleus effect. 26 Said et al. 34 used thermogravimetry (TG) to analyze the hydration products and found that increasing NS from 3% to 6% did not decrease the content of CH, which indicated that the improvement of performance associated with increasing the amount of NS from 3% to 6% may be mainly attributed to the filler effect. In addition, the pozzolanic activity of NS can consume CH crystal, decrease the orientation of CH crystal, and reduce the size of CH in interfacial transition zone (ITZ). 4
NS is a promising material for developing high-performance cement and concrete materials. The reinforcing mechanisms of NS to cement and concrete material need to be further studied which is also beneficial to understand the reinforcing effect of other nanomaterials. In this study, cement mortars with NS at levels of 0.0%, 0.5%, 1.0%, 1.5%, and 2.0% were fabricated and investigated. Compressive and flexural strengths are measured at age of 3 d and 28 d. Theoretical calculation and TG, scanning electron microscope (SEM), and X-Ray powder diffraction (XRD) were used to analyze the reinforcing mechanisms of NS in cement matrix. In addition, electrical resistivity test was carried out to study the reinforcing mechanisms and the relationships of flexural strength, compressive strength, and electrical resistivity.
Experimental programs
Materials
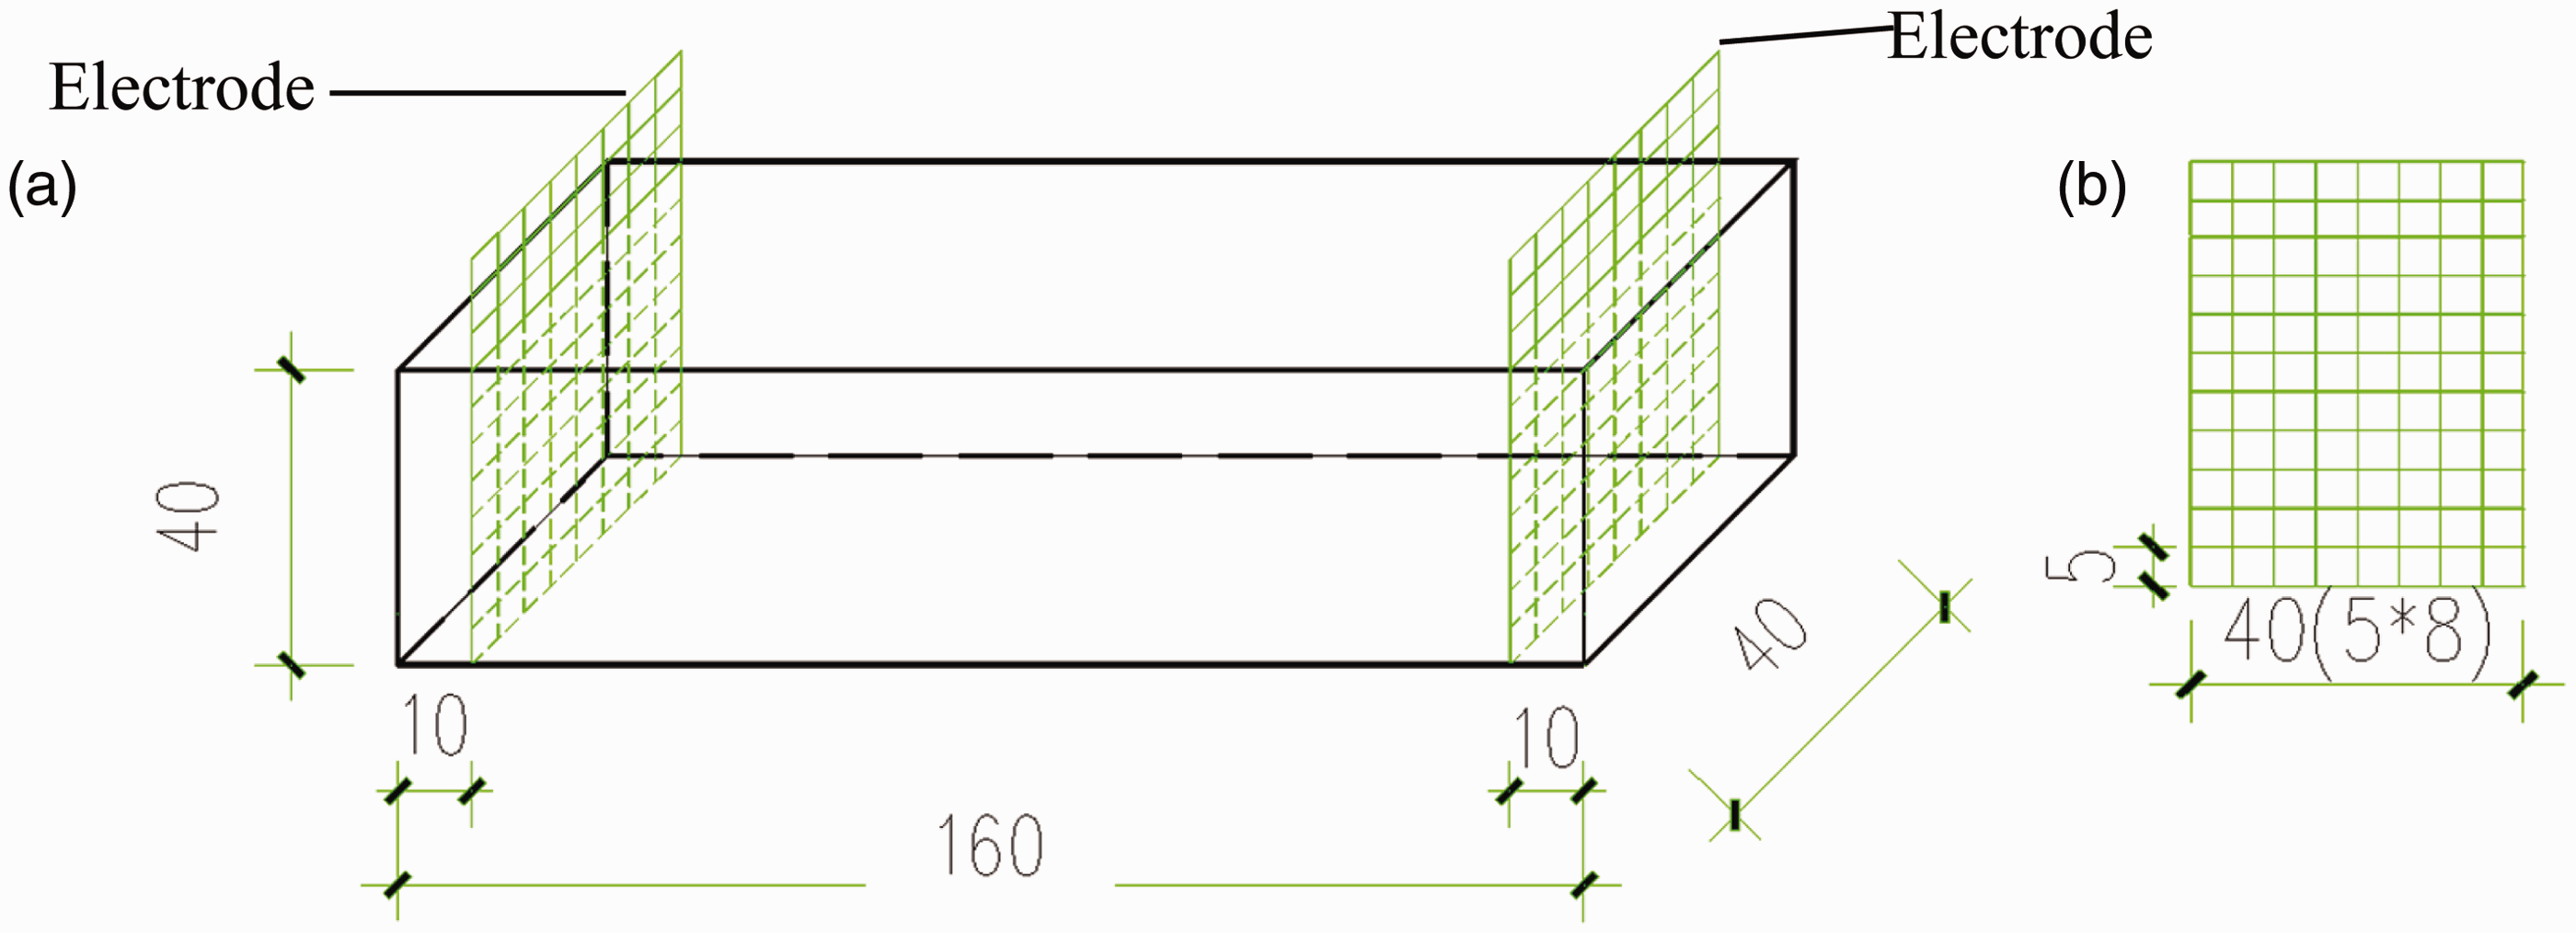
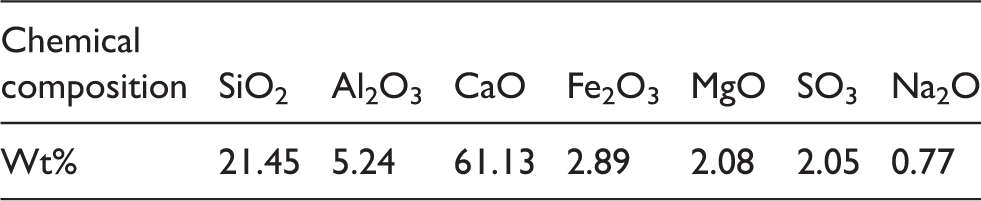
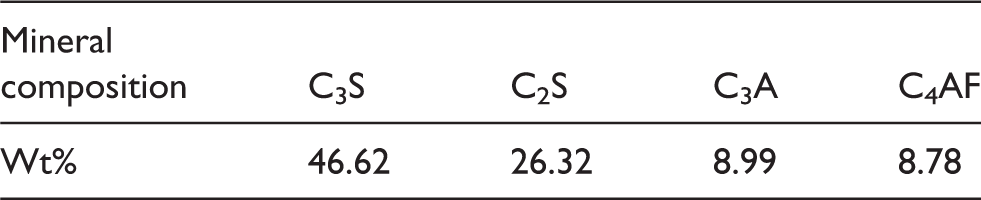
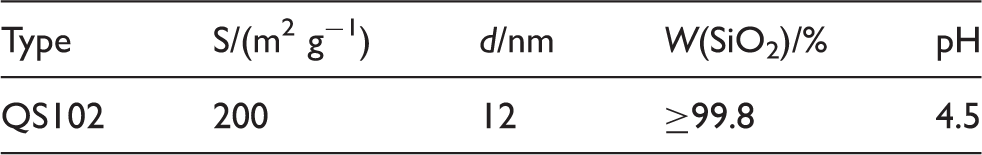
P·O 42.5R cement (Dalian Onoda Cement Co. Ltd., China), conforming to the requirement of Chinese standard, was used as a binder material. The chemical and mineral compositions of cement are shown in Tables 1 and 2, respectively. NS produced by Tokuyama in Japan was applied. The main properties of NS are shown in Table 3. NS is in a state of agglomerate which can be seen from Figure 1. As fine aggregate, standard sand (Xiamen AI Ou Standard Sand Co., Ltd, China) was used. A commercially available polycarboxylate-based cement superplasticizer (PC), named as 3310E, was provided by Dalian Xi KaCo., Ltd, China. PC was used for dispersing NS and maintaining workability of fresh cement mortar. Its solid content is 45% and it can reduce water to an extent of 30%. In addition, stainless steel gauzes with opening of 5 mm × 5 mm were used as electrodes (as shown in Figure 2(b)).
SEM image of NS. Sketch of (a) electrode arrangement in the specimens (40 mm × 40 mm × 160 mm) and (b) electrode. Chemical composition of cement. Mineral composition of cement. Properties of NS.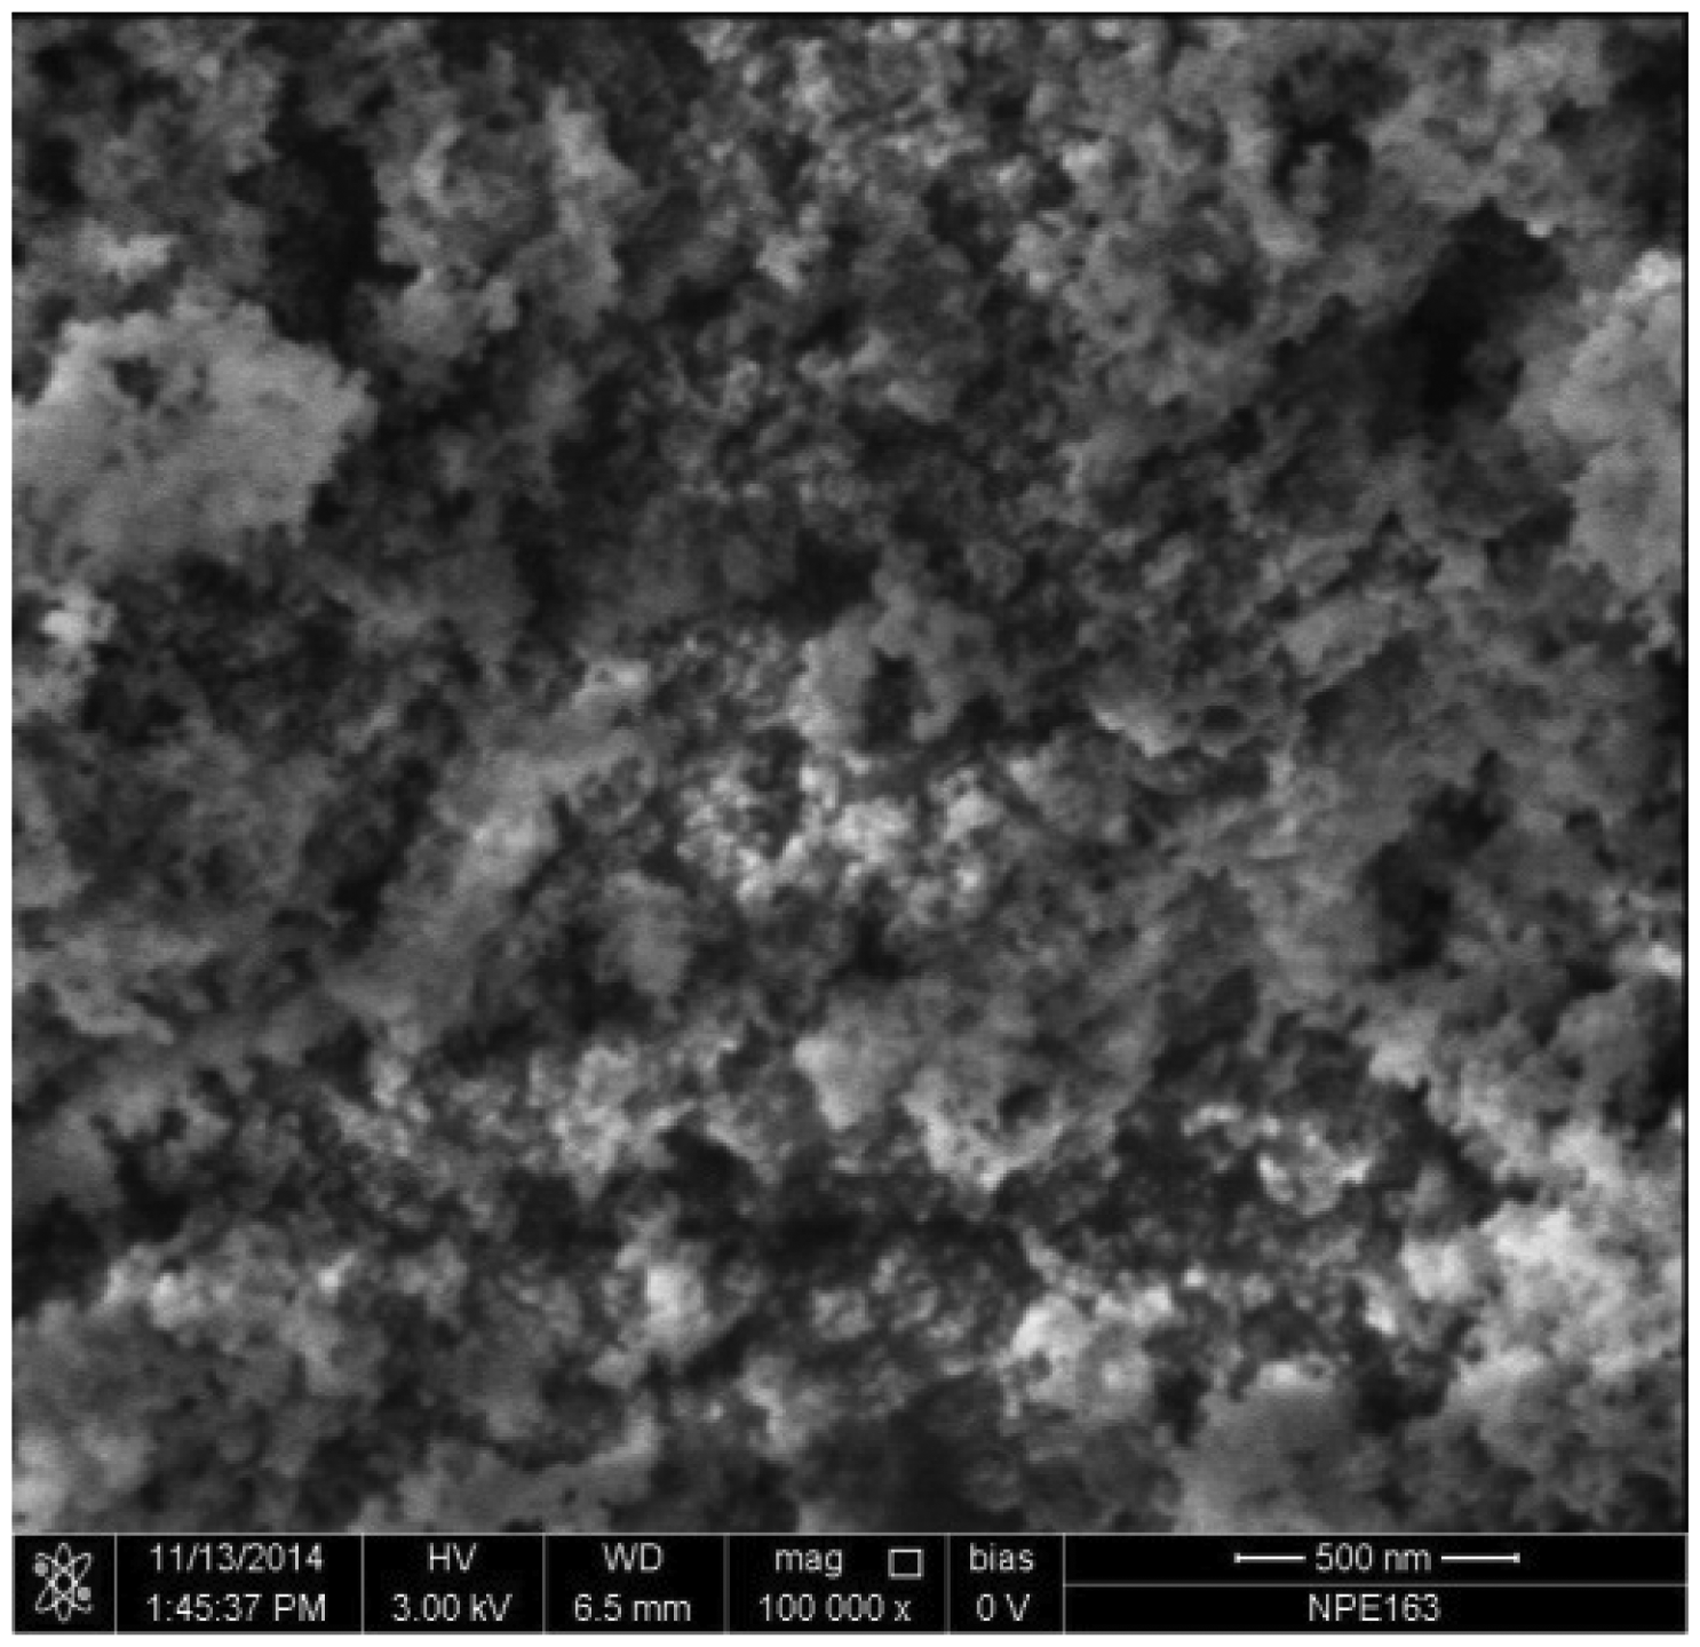
Preparation
Compositions of the cement mortars (by weight of cement).
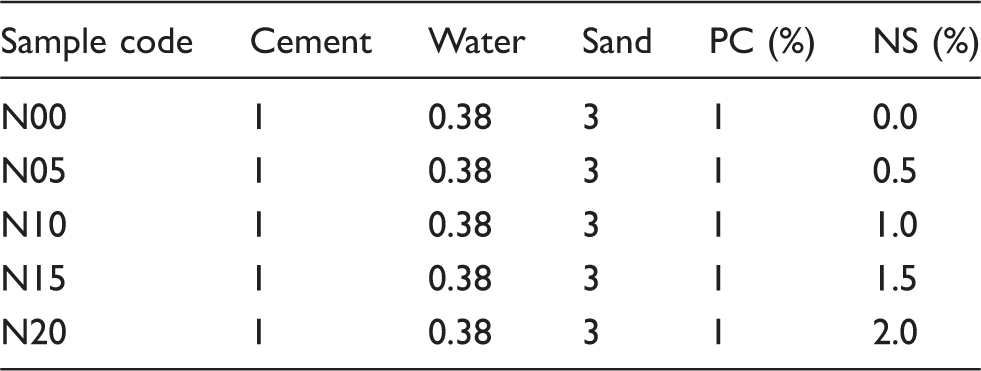
The process of fabricating NS filled cement mortars is as follows: (1) water, NS, and PC were mixed by glass bar and then sonicated in a bath sonicator (2510 E-DTH ultrasonicator, Bransonic Ultrasonics Corporation) for 30 min. (2) Cement was put into the suspension slowly and at the same time mixed by DW-2 DC Constant Speed Stirrer (Chinese Yu Hua Instrument Ltd.) at low speed first for 60 s and then at fast speed for 30 s. (4) Sand was put into the mixing pot and at the same time mixed at low speed first for 60 s and then at fast speed for 30 s. Another low speed for 60 s and fast speed for 30 s were needed before finishing stir. (5) The mixture was poured into the oiled mould and then the mold was put on the electric vibrator in order to eliminate bubbles. (6) Two electrodes were embedded in the mixture (as show in Figure 2). (7) All cement mortars were cured at a temperature of 20.0℃ in 95% relative humidity for 24 h before demolding. Then specimens were cured in water at 20 ± 1℃ until the curing age was arrived at age of 3 d and 28 d.
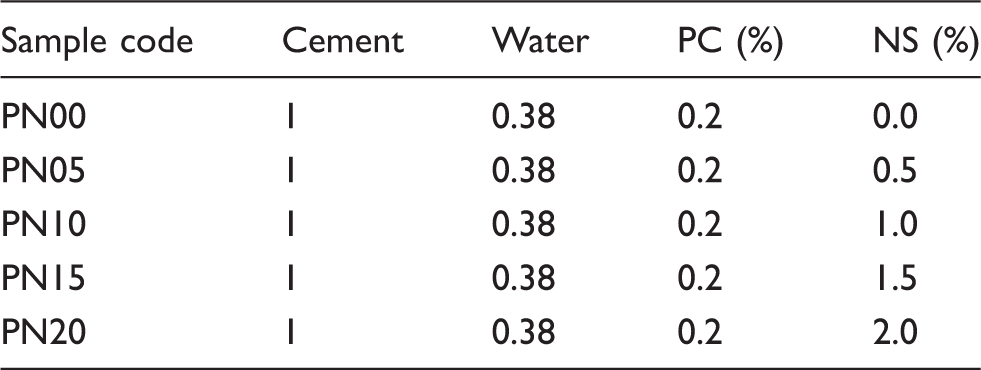
Compositions of the cement pastes (by weight of cement).
The samples for SEM were selected from cement mortar after testing flexural and compressive strength at the age of 28 d.
Measurement
The tests of specimens included flexural strength, compressive strength, electrical resistivity, and microanalysis. The flexural strength was measured by the mortar folding meter DKZ-5000 (Wuxi Jianyi Instrument & Machinery Co., Ltd) at the age of 3 d and 28 d. Compressive strength was tested by universal electronic testing machine WDW-200E (Jinan Times Shi Jin Test Machine Co., Ltd). All the specimens were loaded to failure at a constant loading rate of 1.2 mm/min. The average value of flexural and compressive strengths of three specimens in each group was regarded as the final results in every curing age if the difference between average and the maximum and the minimum compressive strength was less than 10%. The average value of electrical resistivity of three specimens in each group was regarded as the final results which used in figures and for comparing with plain cement mortar. The alternating current (AC) electrical resistivity of specimens was measured by a two-probe method using a digital logger (U1733C, Agilent Technologies, Inc., USA). Field emission scanning electron microscope (Nova Nano SEM 450, American FEI Ltd.) was used to observe the microstructures. TG analysis was performed using a METTLER TOLEDO STARe system to get the amount of CH and other hydration products. The condition of TG analysis was under nitrogen atmosphere at a heating rate of 10℃/min up to 1000℃. XRD (Bruker D8 Advance, Bruker German) was applied for studying the change tendency of crystal of calcium hydroxide which was caused by NS.
Results
Flexural strengths
Figure 3 shows the relationship between the content of NS and flexural strength at 3 d and 28 d. The error bars in the figure denote the standard deviations of the experimental results. The increase rate of 3 d and 28 d flexural strengths is shown in Table 6.
Flexural strengths of cement mortar with NS at the age of 3 d and 28 d. Increase rate of flexural strengths of cement mortars with different contents of NS at age of 3 d and 28 d (%).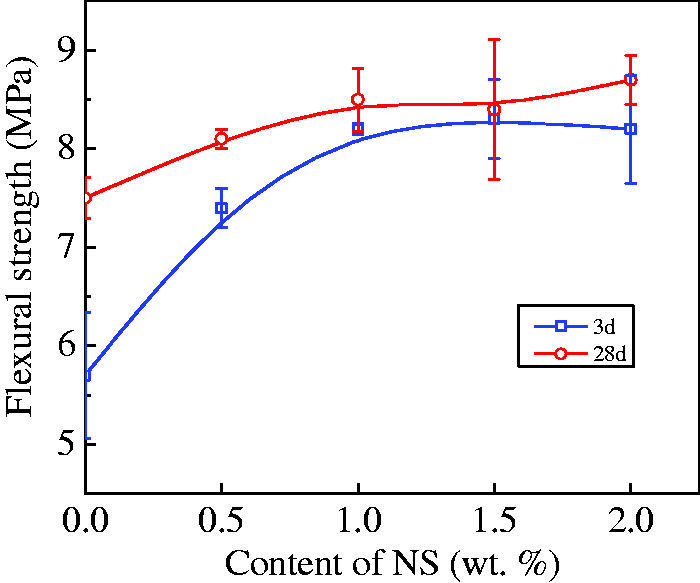
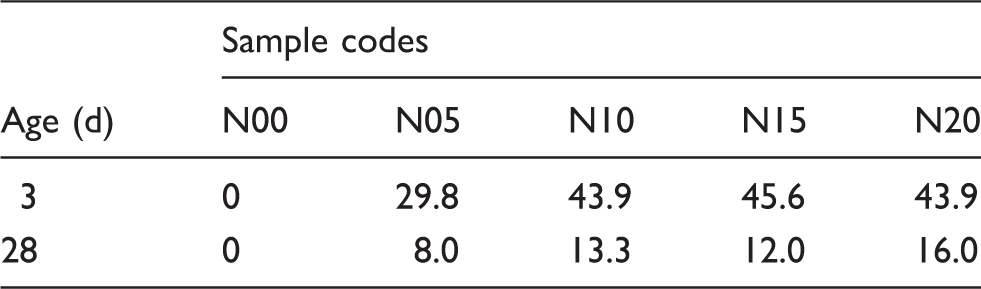
Three-day flexural strengths of NS-filled cement mortar first increased and then decreased slightly as the content of NS increased. When the content of NS is 1.5%, flexural strength reached its maximum 8.3 MPa and increased 45.6% compared with the plain cement mortar. Flexural strength of NS filled cement mortar at 28 d grew with increasing content of NS. The optimal level of NS content was achieved at 2.0% at the age of 28 d. The flexural strength was 8.7 MPa and improved 16.0% relatively to plain cement mortar at 28 d.
As shown in Figure 3, 28 d flexural strengths are higher than that at 3 d with the same content of NS. However, 28 d increase rate of flexural strengths was lower than that at 3 d when the content of NS was same (as shown in Table 6). In other words, NS can enhance 3 d flexural strength significantly while the effect of NS on 28 d flexural strength is not obvious. In addition, the gap between 3 d flexural strengths and 28 d flexural strength diminished as the content of NS increased.
Compressive strengths
Figure 4 shows the relationship between content level of NS and compressive strength at 3 d and 28 d. Table 7 shows the increase rate of 3 d and 28 d compressive strengths.
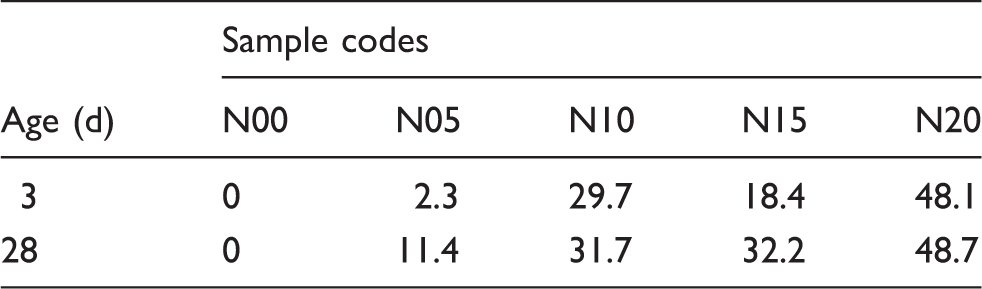
Compressive strengths of cement mortar with NS at age of 3 d and 28 d. Increase rate of compressive strengths of cement mortars with different contents of NS at age of 3 d and 28 d (%).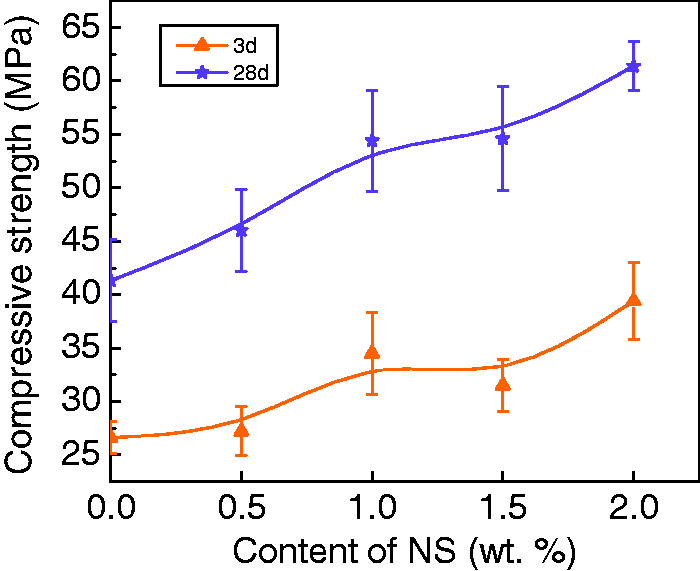
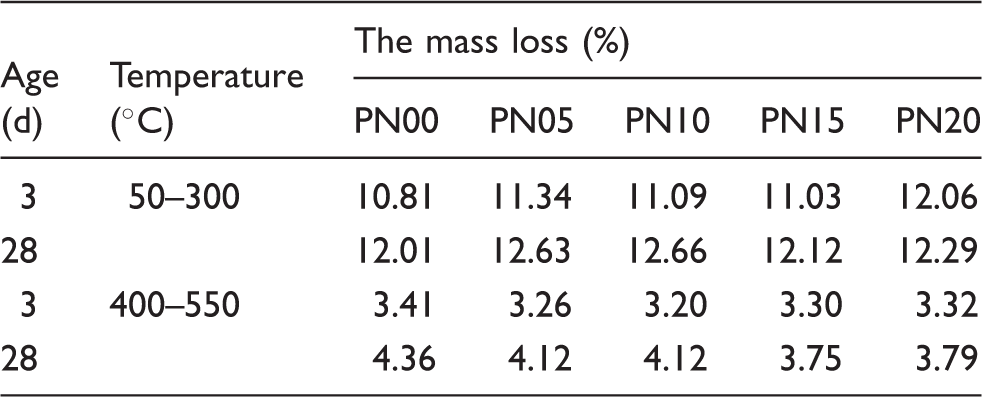
Mass loss of PN00, PN05, PN10, PN15, and PN20 at 3 d and 28 d (TG).
Reinforcing mechanisms
TG and Theoretic calculation TG
TG and DTG diagrams of samples at 3 and 28 d are shown in Figures 5 and 6, respectively. The mass loss between 50 and 300℃ is due to the dehydration of C–S–H gel, Aft, and physically bonded water.
35
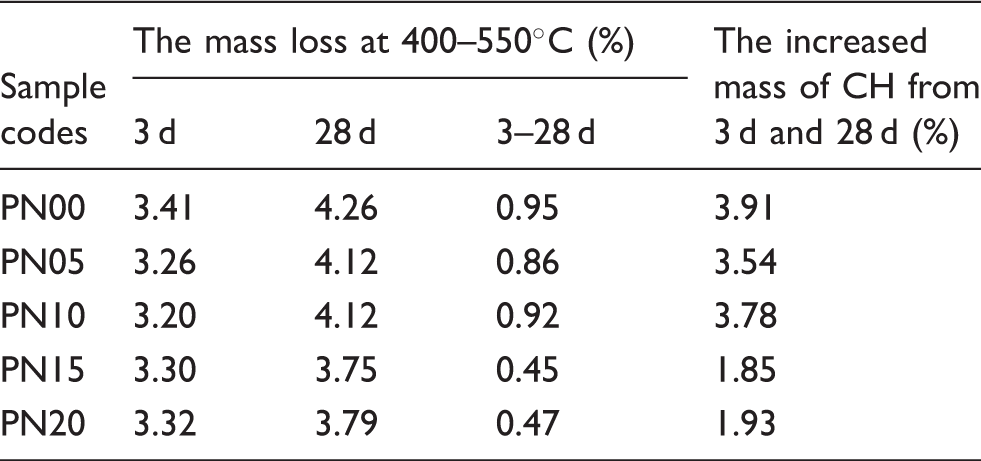
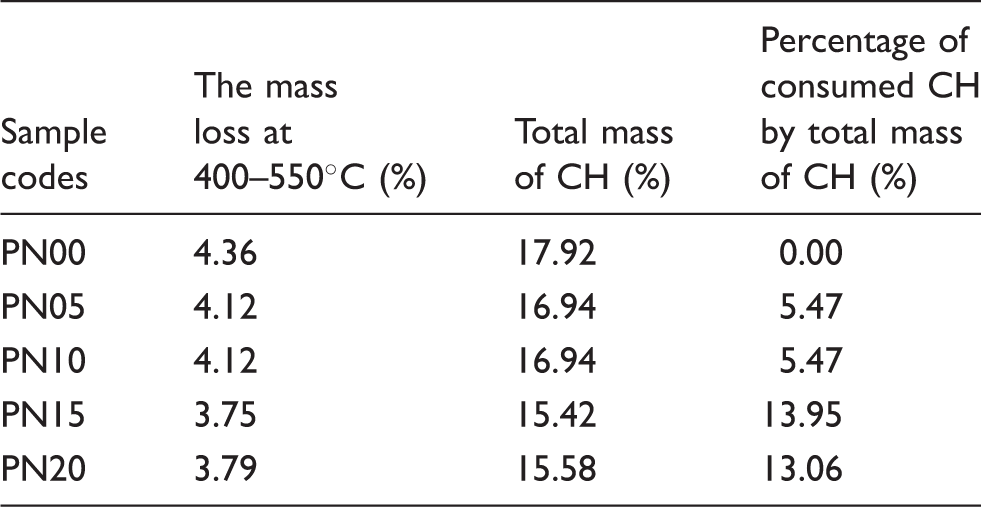
The mass loss step in 400–550℃ results from the decomposition of CH. The details of mass loss in 50–300℃ and 400–500℃ are shown in Table 8. The mass loss of cement pastes with NS in 50–300℃ at 3 d is all higher than that of plain cement pastes, which indicated that NS can improve the hydration of cement due to nucleus effect. In addition, cement hydration degree can be obtained based on the TG results and the calculation method given in Ref. [11]. Furthermore, the water required is 0.23 g for full hydration of 1 g cement.
33
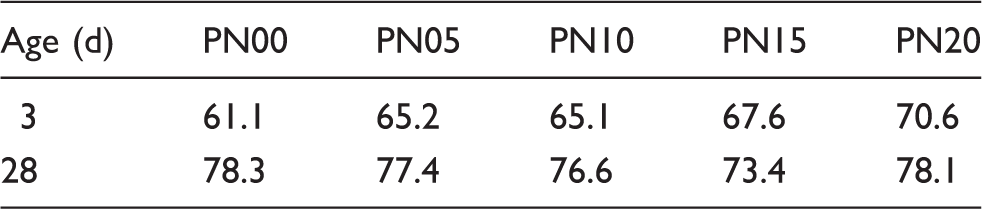
Based on the above-mentioned methods, the cement hydration degree mentioned in this paper can be calculated. It can be seen from Table 9 that the cement hydration degree increases with increasing of NS at 3 d. When the content of NS is 2%, the cement hydration enhanced 9.5% compared with plain cement paste. However, the cement hydration degree is almost the same at 28 d. It indicated that acceleration of hydration caused by nucleus effect plays an important role in early age. However, the nucleus effect not only can accelerate the hydration of cement but also makes the distribution of hydration production more uniform and restricts the size of CH. Hence, nucleus effect may also benefit to enhance the strength at late age. The mass loss of cement pastes with NS in 400–550℃ are all low compared with plain cement pastes. The mass of CH in cement pastes depends on two facts at 3 d. First, the amount of CH reduced by pozzolanic reaction of NS and CH. Second, nucleus effect of NS can enhance the hydration process and produce more CH. Therefore, the mass of CH does not show very obvious law at 3 d.
TG diagram (a) and DTG diagram (b) for PN00, PN05, PN10, PN15. and PN20 at 3 d. TG diagram (a) and DTG diagram (b) for PN00, PN05, PN10, PN15. and PN20 at 28 d. Cement hydration degree at 3 d and 28 d (%). The increased amount of CH in cement pastes from 3 d to 28 d.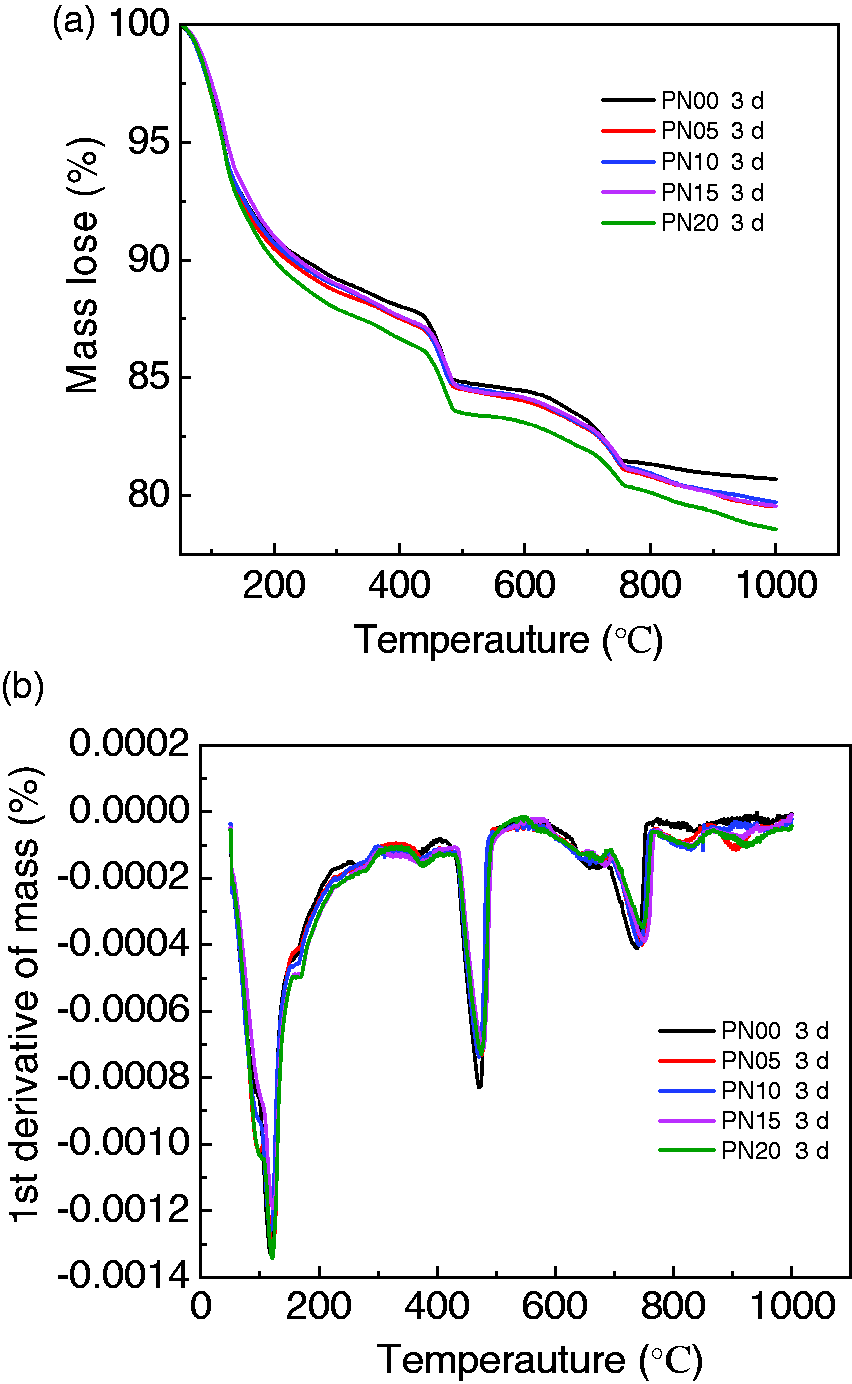
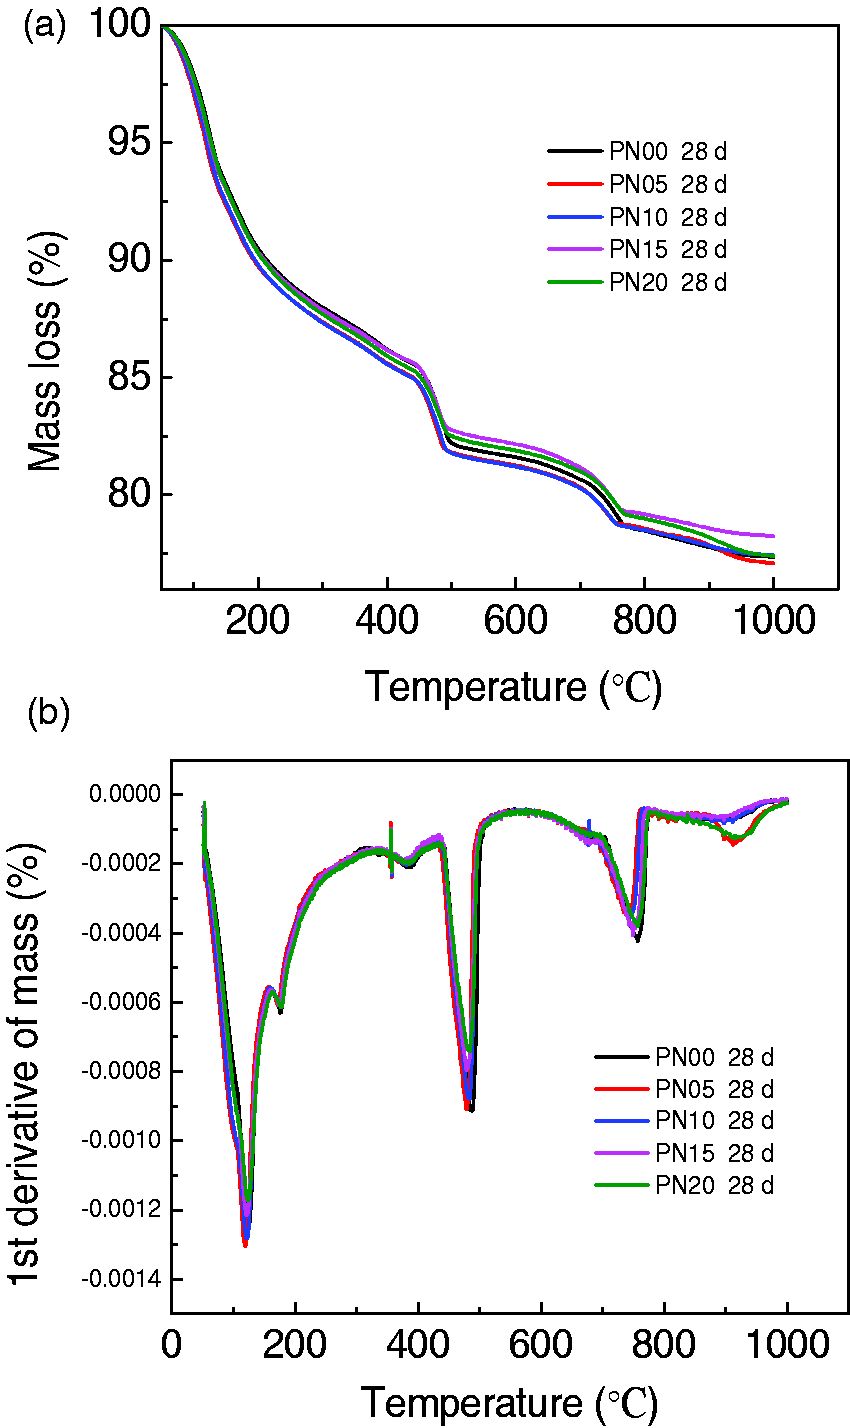
Experimental results of consumed CH by NS. The amount of C–S–H, Aft, and bonded water in all cement pastes are very close to that at 28 d which indicated that nucleus effect very weak at 28 d. Therefore, the mass of CH in cement pastes with NS at 28 d decreased compared with plain cement paste mainly due to pozzolanic reaction. The mass of water, which is from decomposing CH in 400–550℃, can be obtained by TG. According to the chemical equation of decomposing CH, the experimental value of CH can be obtained. The total mass of CH (%) was calculated by the equation (1).
36
Then the mass of consumed CH by NS, namely the amount of CH in plain cement paste minus the amount of CH in cement paste with NS, were calculated by equation (2).


Amount of CH in cement pastes measured from TG at 28 d.
The amount of CH in cement pastes calculated in theory.
Theoretic calculation
Ordinary Portland cement mainly includes four mineral compositions: tricalcium silicate (C3S), dicalcium silicate (C2S), tricalcium aluminate (C3A), and tetracalcium alumino-ferrite (C4AF). In the case of complete hydration, the approximate composition of C–S–H may be assumed as C3S2H3 which can be used for stoichiometric calculations. The stoichiometric reaction for fully hydrated C3S and C2S can be expressed as equation (3) and (4).
37


NS reacts with CH can be expressed as equation (5).

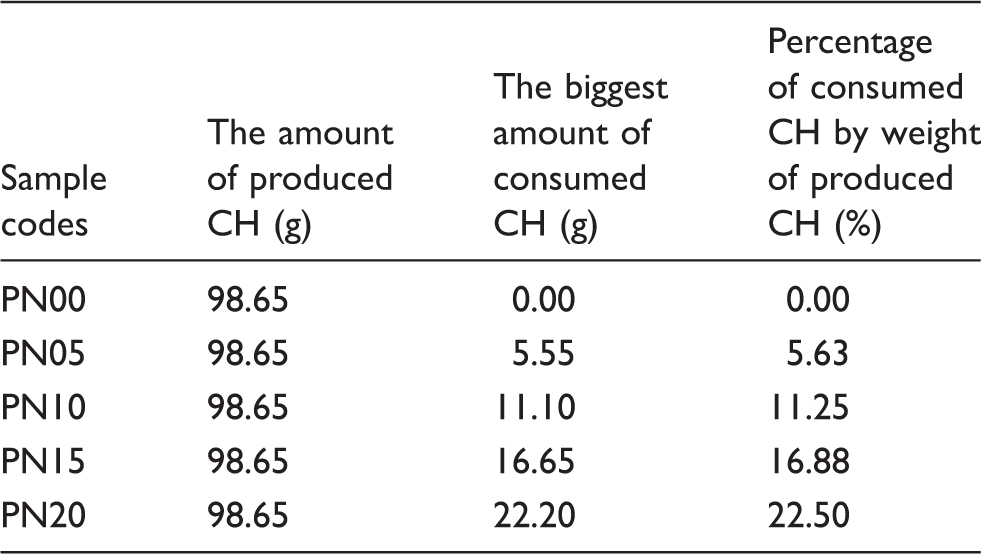
It should be noted that the x in the chemical equation (5) is less than or equal to 2. Obviously, NS can consume the most CH when x is equal to 2. The cement hydration degree is 78.3% which is given in Table 9. Therefore, 78.3% C3S and 78.3% C2S react with water according to equations (3) and (4). The weight of cement is 450 g and the percentage of C3S and C2S can be found in Table 2. The amount of CH produced by C3S and C2S, the biggest mass of consumed CH, and percentage of consumed CH by weight of produced CH are shown in Table 12.
It can be seen that the amount of consumed CH grows as the content of NS increases. The amount of consumed CH by NS ranges from 5.63% to 22.50% of the total amount of CH. Theoretically, NS has huge potential for consuming CH.
Comparison of theoretical and experimental results of consumed CH by NS
Comparison of theoretical and experimental results of consumed CH by NS can be seen in Figure 7. The mass of consumed CH enhanced linearly with increasing content of NS in theory. It can be seen from the results of TG that the amount of consumed CH increases when the content of NS is less than 1.5%. However, a plateau is achieved for the mass of consumed CH when the content of NS exceeds 1.5%, i.e., the pozzolanic effect in PN15 and PN20 is approximate. This may show that NS would be encircled by the hydration and pozzolanic reaction products, which stop the reaction of NS and CH. Therefore, compressive strength of N20 enhanced 11.07% compared with N15 at 28 d, which may attribute to filling effect of NS.
Comparison of theoretical and experimental results of consumed CH by NS.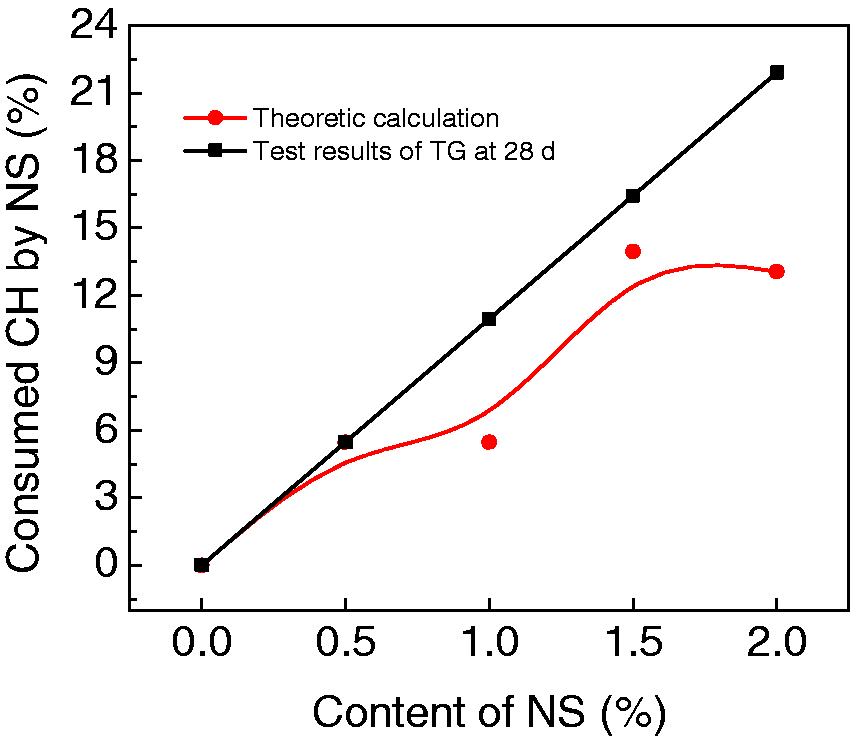
XRD
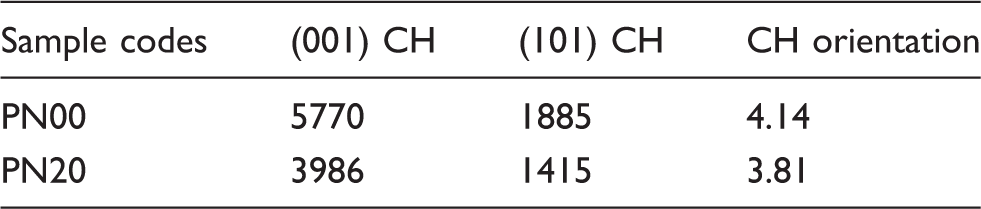
XRD pattern of PN00 and PN20 are shown in Figure 8. It can be seen that the intensity of main diffraction peaks of CH in PN20 is lower than those in PN00. It is also indicated that NS consumed some CH. In addition, (001) and (101) crystal face peak intensity of CH can be obtained and then the CH orientation can be calculated according to the calculation given in Ref. [4]. The results are shown in Table 13 and prove that NS can reduce the CH orientation in cement matrix. Compared with Ref. [4], the effect of NS on the CH orientation is low although the content of NS is different. This may indicate that the effect of NS on CH orientation is more obvious when the CH is in ITZ.
XRD patterns of PN00 and PN20 at 28 d. Diffraction intensity and orientation of CH at 28 d.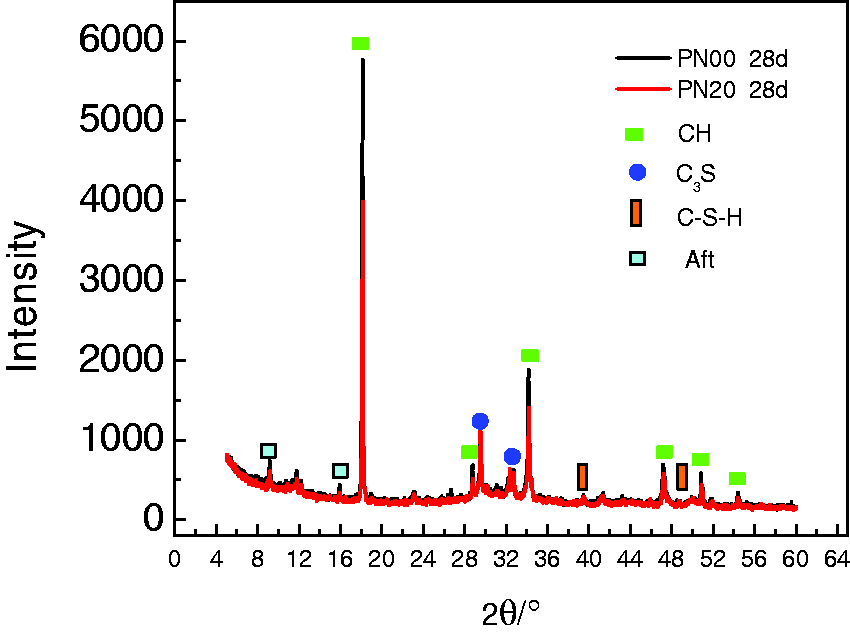
SEM
Figure 9 shows the overview microstructures of N00, N05, and N10 at age of 28 d. It shows that the cement matrixes become denser with increasing NS content. This is also compatible with the results of flexural strengths and compressive strengths.
SEM micrographs of cement mortar at age of 28 d: (a) N00; (b) N05; (c) N10.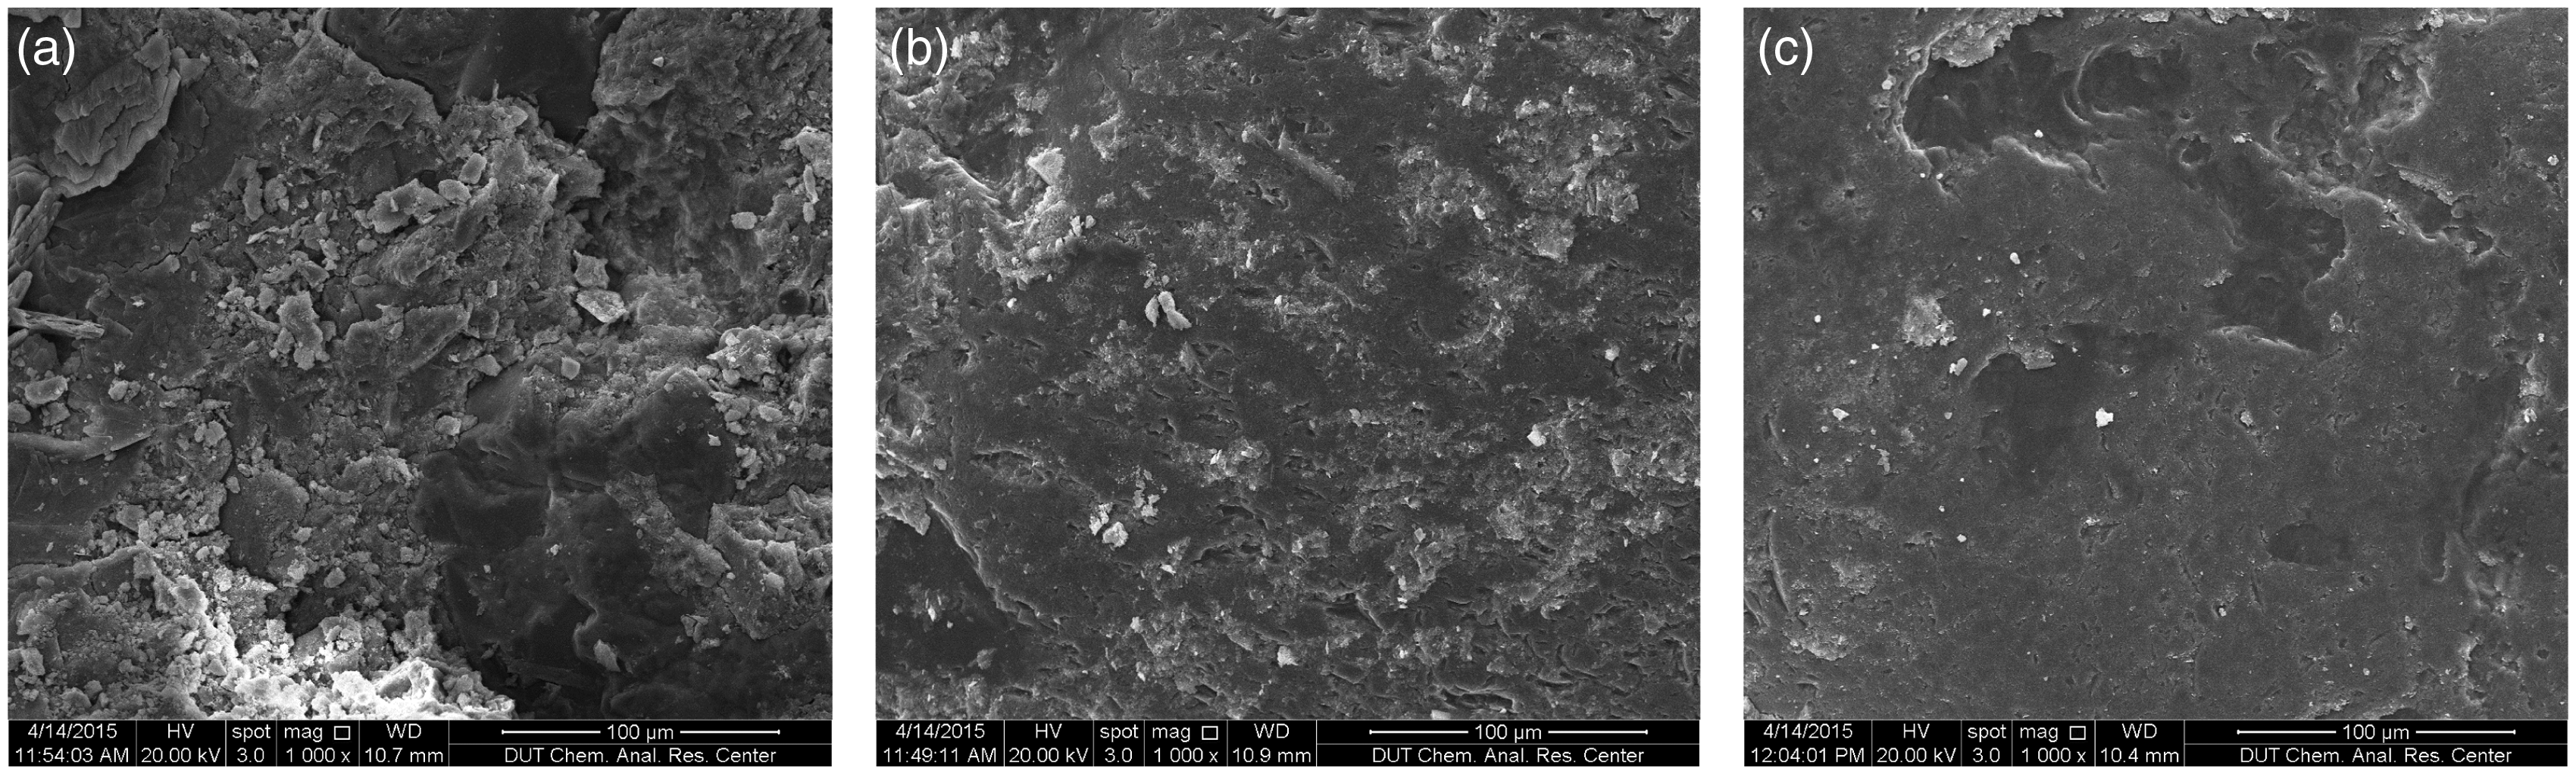
The size of CH in cement mortar with different contents of NS can be seen in Figure 10. Obviously, the size of CH in cement mortar with NS is smaller than that in plain cement mortar.
SEM micrographs of CH in cement mortar at age of 28 d: (a) N00; (b) N05; (c) N10.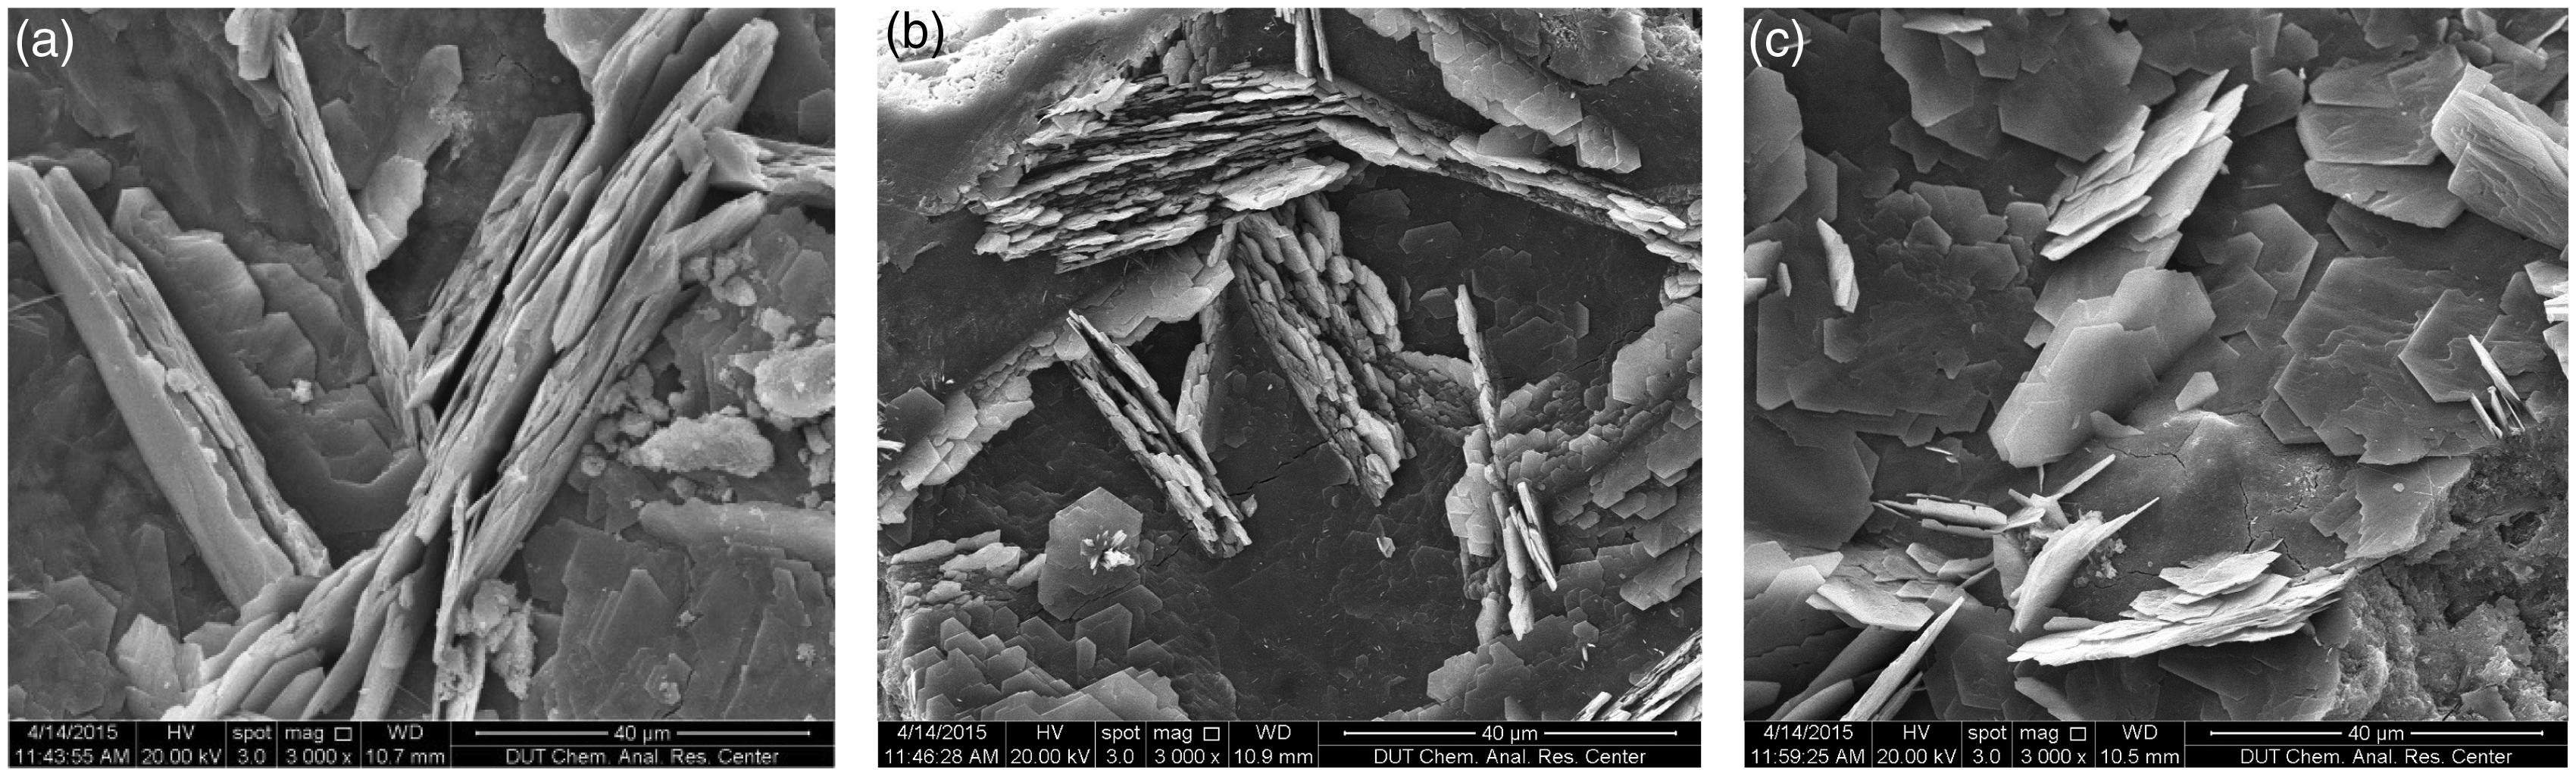
NS can reduce the size of CH in ITZ which have been reported in Refs. [4,26]. The samples of Figure 10 are taken randomly and SEM micrographs are not taken in ITZ. Thus, NS can not only reduce the size of CH in ITZ but also reduce the size of CH in matrix.
Electrical resistivity test
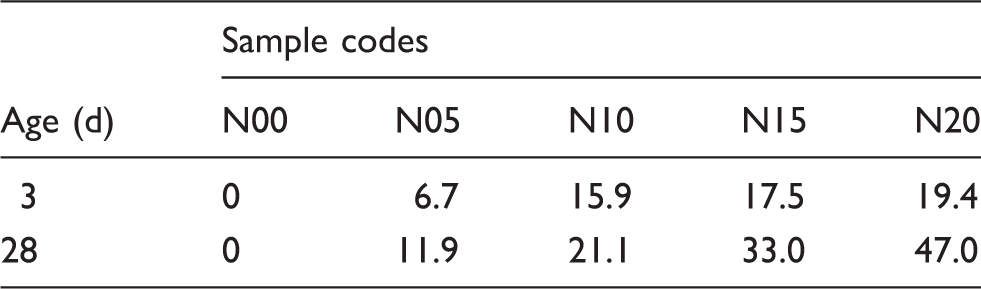
Figure 11 shows the relationship of flexural strength, electrical resistance, and content of NS. It can be seen that 3 d and 28 d electrical resistivity of cement mortar increased as NS content increased. The enhancement of 3 and 28 d electrical resistivity of 2% NS-filled cement mortar was 19.4% and 47.0%, respectively (as shown in Table 14). In addition, 28 d electrical resistivity of cement mortar was higher than that at 3 d.
Electrical resistivity and flexural strength of cement mortar with NS at 3 d and 28 d. Increase rate of electrical resistivity cement mortars with different contents of NS at age of 3 d and 28 d (%).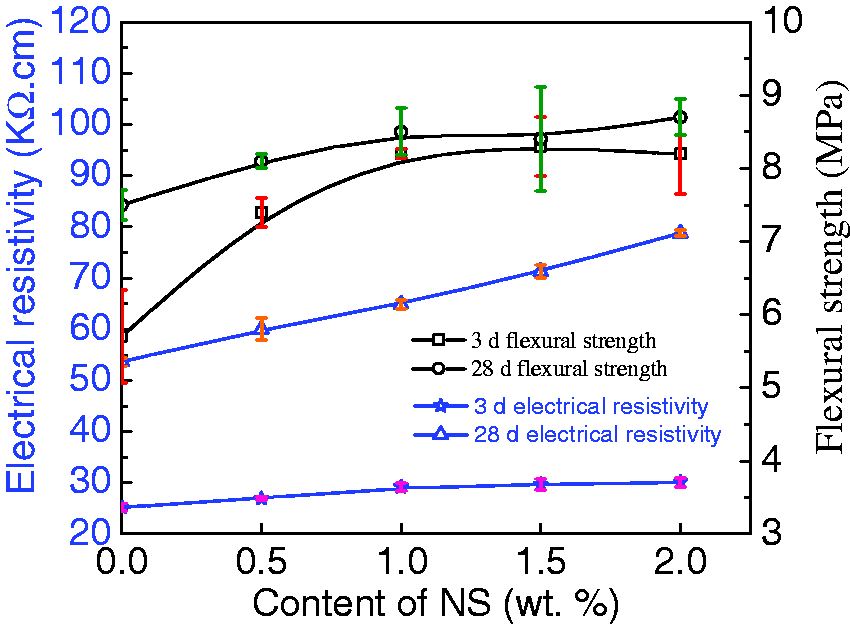
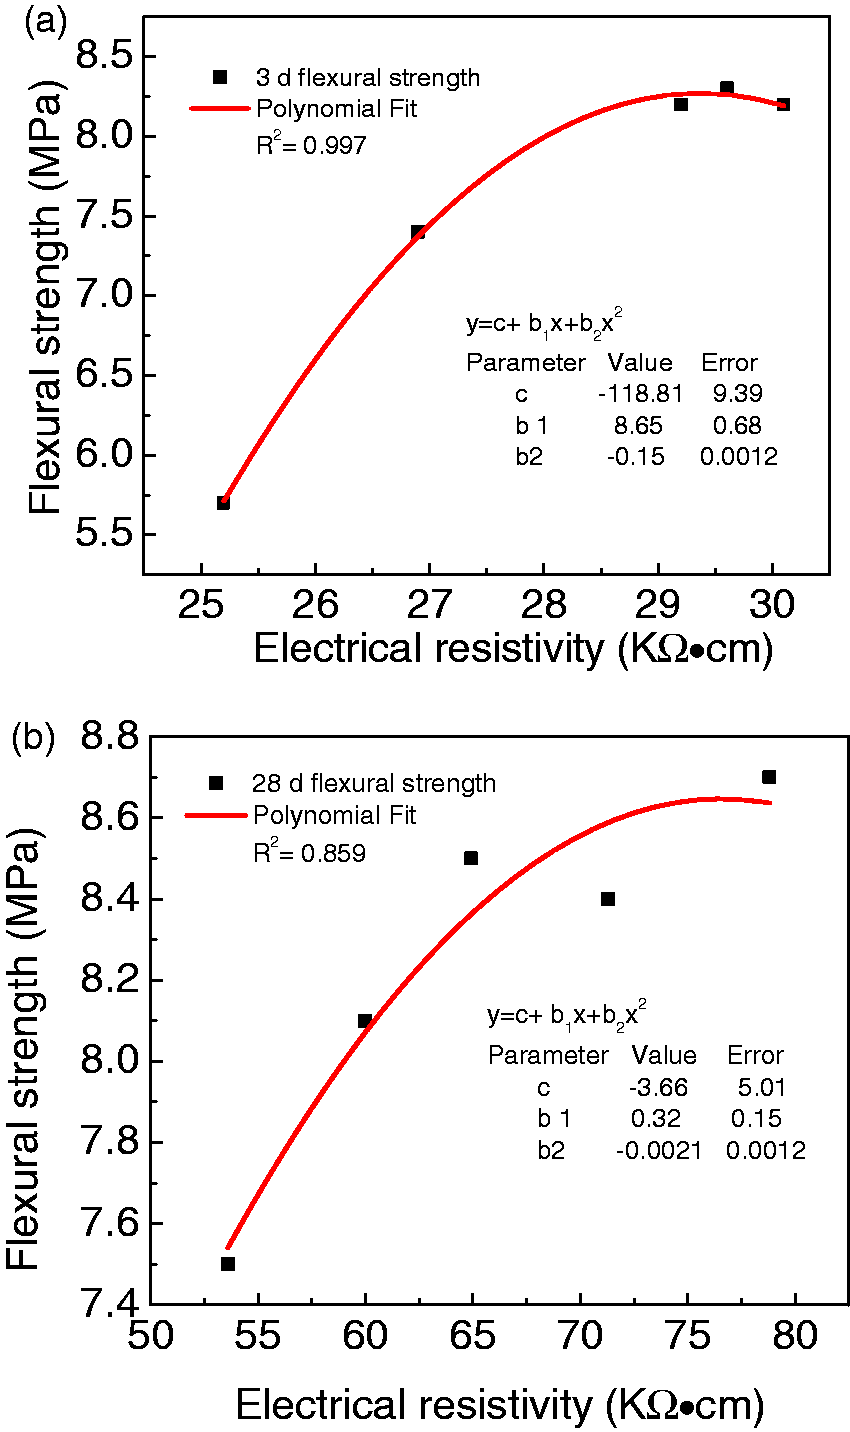
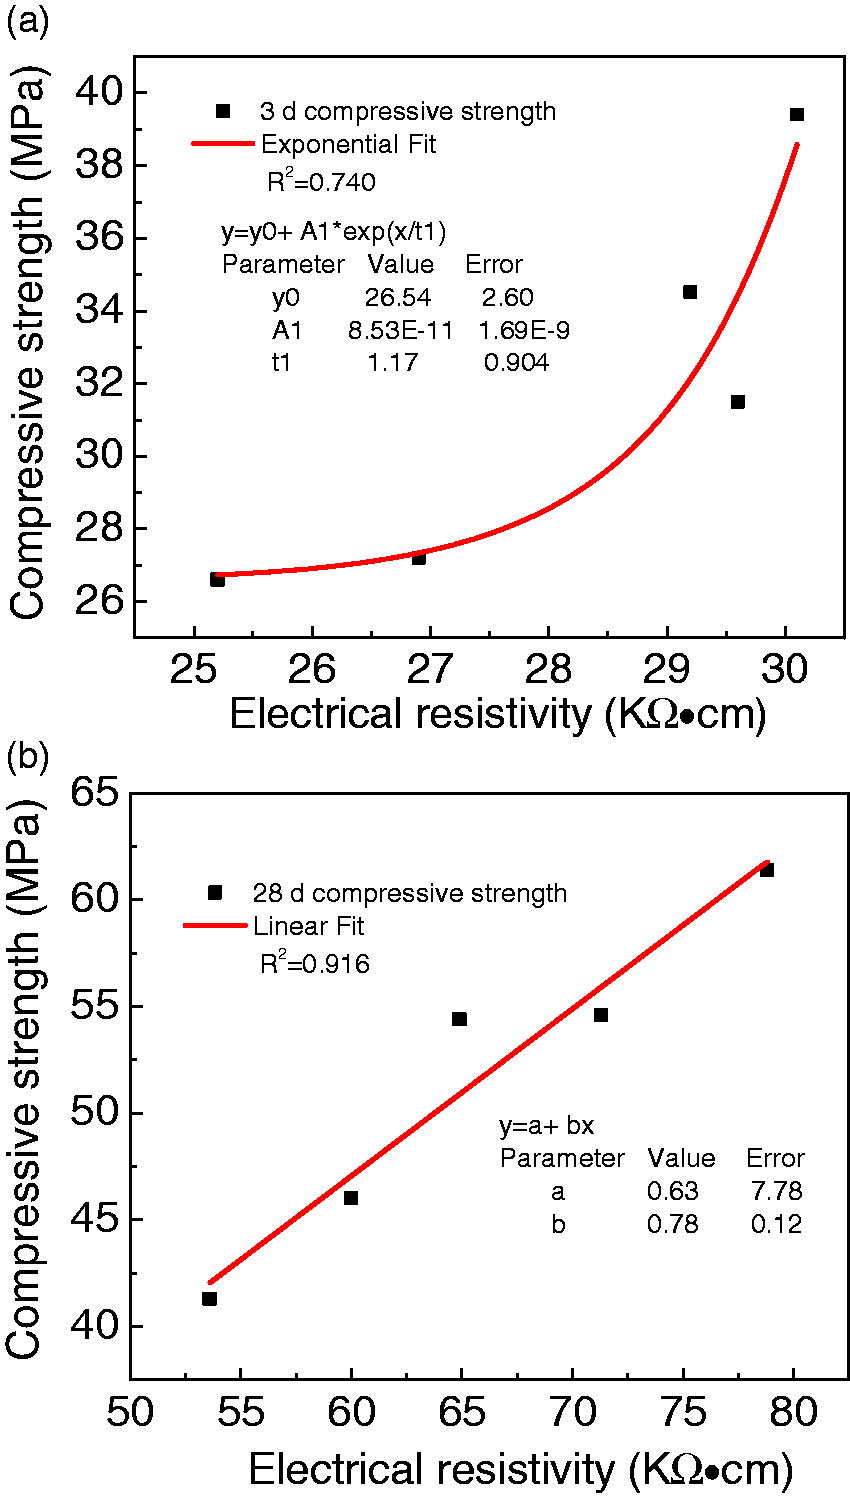
Interestingly, the change trends of flexural and compressive strengths with increasing content of NS and curing age were similar with those of electrical resistivity (as shown in Figures 11 and 12). It can be seen in Figure 13 that the flexural strengths and electrical resistivity at 3 and 28 d are close to quadratic polynomial relation. However, as shown in Figure 14, the 3 and 28 d compressive strengths grew exponentially and linearly with increasing electrical resistivity, respectively. Different relationships among flexural strengths, compressive strengths, and electrical resistivity indicated that cement-based materials are non-homogeneous.
Electrical resistivity and flexural strength of cement mortar with NS at 3 d and 28 d. The relationship between electrical resistivity and flexural strengths at 3 and 28 d. The relationship between electrical resistivity and compressive strengths at 3 d and 28 d.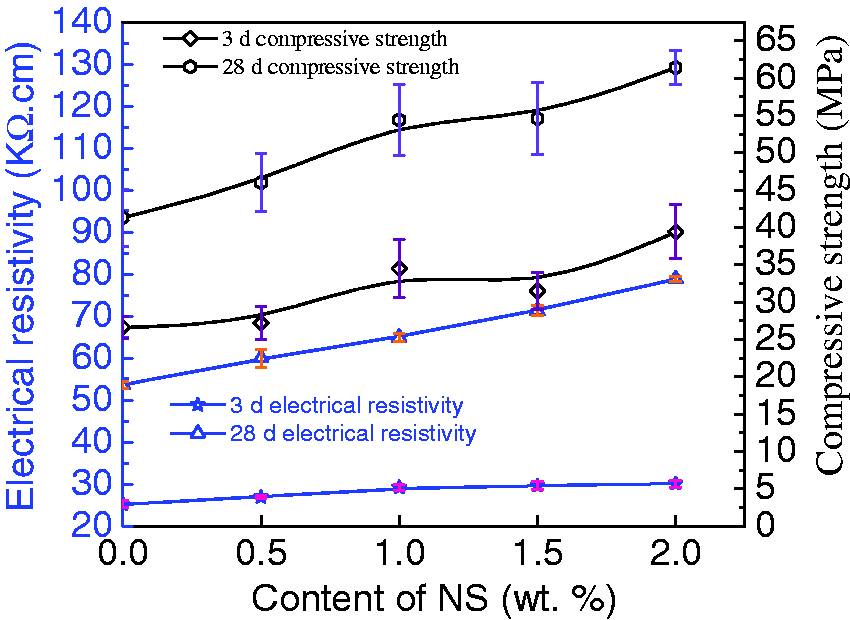
Cement mortar without conductive filler is a poor conductor of electricity. The main electric conduction depends on the transfer of electrolyte ion. When cement mortar matrix becomes dense, the path way of electrolyte ion was longer and the movement of electrolyte ion becomes difficult. As a result, the denser the matrix is, the higher the electrical resistivity becomes. NS can enhance the compactness of cement matrix by the following reasons. NS can react with CH which can produce more hydration products compared with plain cement mortar which can be seen in Table 9. NS and the hydration products can fill the pore in cement mortar, which make cement matrix much denser (as show in Figure 9). In addition, NS particles or agglomerates are able to absorb part of the mixing water, 11 thus reducing the effective w/c ratio of the mortars. Therefore, low w/c makes silica gel hydrate and cement matrix much denser. These are contribution to increasing electrical resistivity, flexural, and compressive strength at the same time. Therefore, electrical resistivity may describe the change trend of compactness, flexural, and compressive strengths.
Conclusions
Cement mortar with NS at levels of 0.0%, 0.5%, 1.0%, 1.5%, and 2.0% were fabricated. Compressive and flexural strengths were tested at the age of 3 d and 28 d. Theoretical calculation of consumed CH and TG, SEM, XRD, and electrical resistivity test was carried out to explore the reinforcing mechanisms. The following conclusions can be drawn from the present study:
Three-day flexural strengths increased with NS up to 1.5% and then decreased. 28 d flexural strengths increased with increasing NS content. The maximum flexural strengths of cement mortar with NS were 8.3 MPa and 8.7 MPa and enhanced 45.6% and 16.0% relative to plain cement mortar at 3 d and 28 d, respectively. Flexural strengths of 28 d are all higher than those at 3 d while the increase rate of 28 d flexural strengths are lower than those at 3 d. Compressive strengths of cement mortar with NS at 3 d and 28 d increased as the content of NS increased. With 2.0% content of NS, 3 d and 28 d compressive strengths reached maximum 39.4 MPa and 61.4 MPa and increased 48.1% and 48.7% compared with plain cement mortar, respectively. The 28 d compressive strengths are all higher than 3 d compressive strength with the same content of NS. The 3 d and 28 d increase rates of compressive strengths are similar. Theoretically, consumed CH increases linearly with increasing NS which shows that NS has huge potential to react with CH. According to the results of TG, the amount of consumed CH increased and agreed with theoretical calculation when the content of NS is less than 1.5%. However, a plateau is achieved for the mass of consumed CH in results of TG when the content of NS exceeds 1.5%, i.e., the pozzolanic effect in PN15 and PN20 is approximate. Therefore, compressive strength of N20 enhanced 11.07% compared with N15 at 28 d, which attributes to filling effect of NS. Microstructures of cement mortar with NS are much denser than that of plain cement mortar. NS can not only significantly reduce the size of CH in ITZ but also in cement mortar matrix except for ITZ. The results of XRD show that NS can decrease tendency of crystal of CH in cement matrix. The change degree of tendency of crystal of CH in cement matrix is lower than that in ITZ. NS makes cement matrix denser. The denser cement matrix is, the higher electrical resistivity, flexural, and compressive strength become. The change trends of electrical resistivity with increasing NS content and curing age are similar with those of flexural and compressive strengths. The flexural strengths and electrical resistivity at 3 and 28 d are both close to quadratic polynomial relation. However, 3 and 28 d compressive strengths grew exponentially and linearly with increasing electrical resistivity, respectively.
Footnotes
Declaration of Conflicting Interests
The author(s) declared no potential conflicts of interest with respect to the research, authorship, and/or publication of this article.
Funding
The author(s) disclosed receipt of the following financial support for the research, authorship, and/or publication of this article: The authors thank the funding supported from the National Science Foundation of China (51428801 and 51578110)