
Abstract
Various researchers have developed techniques to control delamination in laminated structures. One of these techniques is “interleaving,” adding high toughness material to key interfaces in a laminate. This paper studies using polyester veil as a low-cost interleaf alternative to other materials and focuses on a nonwoven, polyester spunbond material. Two different interleaf thicknesses, 0.18 mm and 0.74 mm, are primarily used. In addition, fine 4 g/m2 polyester was also compared. Carbon/epoxy composites are manufactured using 2 × 2 Twill 24″–12k carbon fibers embedded in an epoxy resin, with polyester interleaves at key interfaces. Specimens are fabricated using wet hand layup and cured at room temperature in a vacuum bag. Mode I fracture toughness is measured using the double cantilever beam test and Mode II fracture toughness is examined using the end-notched flexure test. Further evaluation is made using static indentation and full penetration impact testing. Toughness is compared, and the resulting fracture surfaces are investigated. Significant improvement is seen in Mode I testing. Up to a factor of 4 increase in propagation energy per unit area resulted from the inclusion of the interleaf material. Smaller improvements were observed in Mode II, with the best cases showing an increase in propagation energy to maximum load by about a factor of 2 compared with control cases. The polyester interleaf significantly influences the fracture morphology observed in static indentation and full penetration tests.
Keywords
Introduction
Delamination, damage that disconnects the interfaces between layers in a laminated composite, is a limiting factor in the toughness and durability of composite structures.1–3 There are many causes of delamination. Perhaps the most important factors are insufficient reinforcement in the thickness direction and the existence of interlaminar stresses that result from transverse loading, such as may result from impact loading or from the effect of structural discontinuities.4,5
Various researchers have demonstrated techniques to control delamination in laminated structures including stitching through the thickness, 6 Z-pinning, 7 using three-dimensional weaving, 8 or fabric architectures such as weft-knitted fabrics, or 3D textiles, 9 as well as some more unconventional techniques. 10 Although these techniques can work effectively, they add complexity to the manufacturing process, which results in increased cost. A simpler technique, which has long been used to suppress delamination, is “interleaving,” adding high toughness, thin material to key interfaces in a laminate. Interleaving has been effectively utilized within diverse applications without significantly increasing cost. Interleaf materials include adhesive film, 11 thermoplastic film, 12 powdered thermoplastic material, 13 or nonwoven veil materials. 14 Among these techniques Penteado et al. 2 identified that interleaving with nonwoven veil materials is a favorable option to provide a simple, low-cost solution that can be effectively incorporated in out of autoclave manufacturing processes such as vacuum infusion. This work demonstrated some capabilities of utilizing polyester interleafs to improve the toughness and durability of a composite laminate. 1 Previous work by other researchers also investigated this approach. Kuwata and Hogg 14 showed that using nonwoven random fiber veils, including polyester veil, as an interleaf materials in carbon fiber composite structure manufactured using vacuum infusion techniques results in improvements in Mode I and Mode II toughness.
Reichard and his colleagues have studied polyester interleaf materials in different applications, as reported by Fleming et al. 1 Some of these applications used previously in industry include using polyester interleaf into adhesive between carbon fiber–reinforced polymer (CFRP) laminate and metallic structure to enhance fatigue life, and using polyester interleaf in a CFRP infused laminate of road grader blade for NASA that demonstrated superior performance. While these applications produced good performance in practice, there was a lack of supporting data upon which to base such designs. The goal of the present paper is to provide data to support the use of polyester interleaf materials in design applications such as those described by Fleming et al. 1 through development of experimental data that explore the interlaminar fracture behavior of a family of nonwoven polyester materials not previously examined in the literature. The materials under study are generally thicker than those explored in previous studies, such as by Kuwata and Hogg, 14 and are applicable to relatively thick laminates manufactured using low-cost molding techniques.
Experimental methods
Four testing procedures are utilized to quantify the effects of the addition of polyester interleaves in carbon fiber composites: double cantilever beam (DCB), end-notched flexure (ENF), static indentation (SI), and full penetration (FP) impact tests.
All tests were conducted using carbon/epoxy laminates fabricated using hand layup. 2 × 2 Twill woven carbon fiber cloth from Composite Envisions with 12k tows and a 19.7 oz/yd 2 areal weight was used for all laminates. Resin and hardener were acquired from Fiberglass Florida, and are based on Dow 331 epoxy resin with a modified cycloaliphatic amine hardener. The epoxy is mixed with hardener at a 2:1 ratio, and the specimens cured under vacuum bagging process for at least 24 h, then at room temperature for at least another 24 h. The glass transition temperature for this resin, per the manufacturer's data, is approximately 150 ℃. The primary interleaf material use in this study is a nonwoven spunbond thermoplastic polyester fabric, manufactured by Johns Manville, using their trade name DuraSpun. Two different thicknesses of polyester fabric are considered, DuraSpun 016/090 with thickness of 0.18 mm and a basis weight of 75 g/m2 and DuraSpun 016/120 with thickness of 0.74 mm and basis weight of 119 g/m2. DuraSpun is manufactured by “melting thermoplastic pellets and extruding fibers, which are stretched using a combination of gravity and high speed air, then spun down on a lay belt and needle punched to entangle the fibers and form a fabric.” 1 This is followed by heat setting and a calendaring process to control the loft. No lubrication or fiber coatings are present on the material. In addition, Optiveil 20254A fine polyester veil with 4 g/m2 basis weight was also used in some cases. For specimens requiring a pre-crack, a Teflon film was inserted into the laminate during the manufacturing process. The Teflon film used has a thickness 0.013 mm and was acquired from the CS Hyde Company.
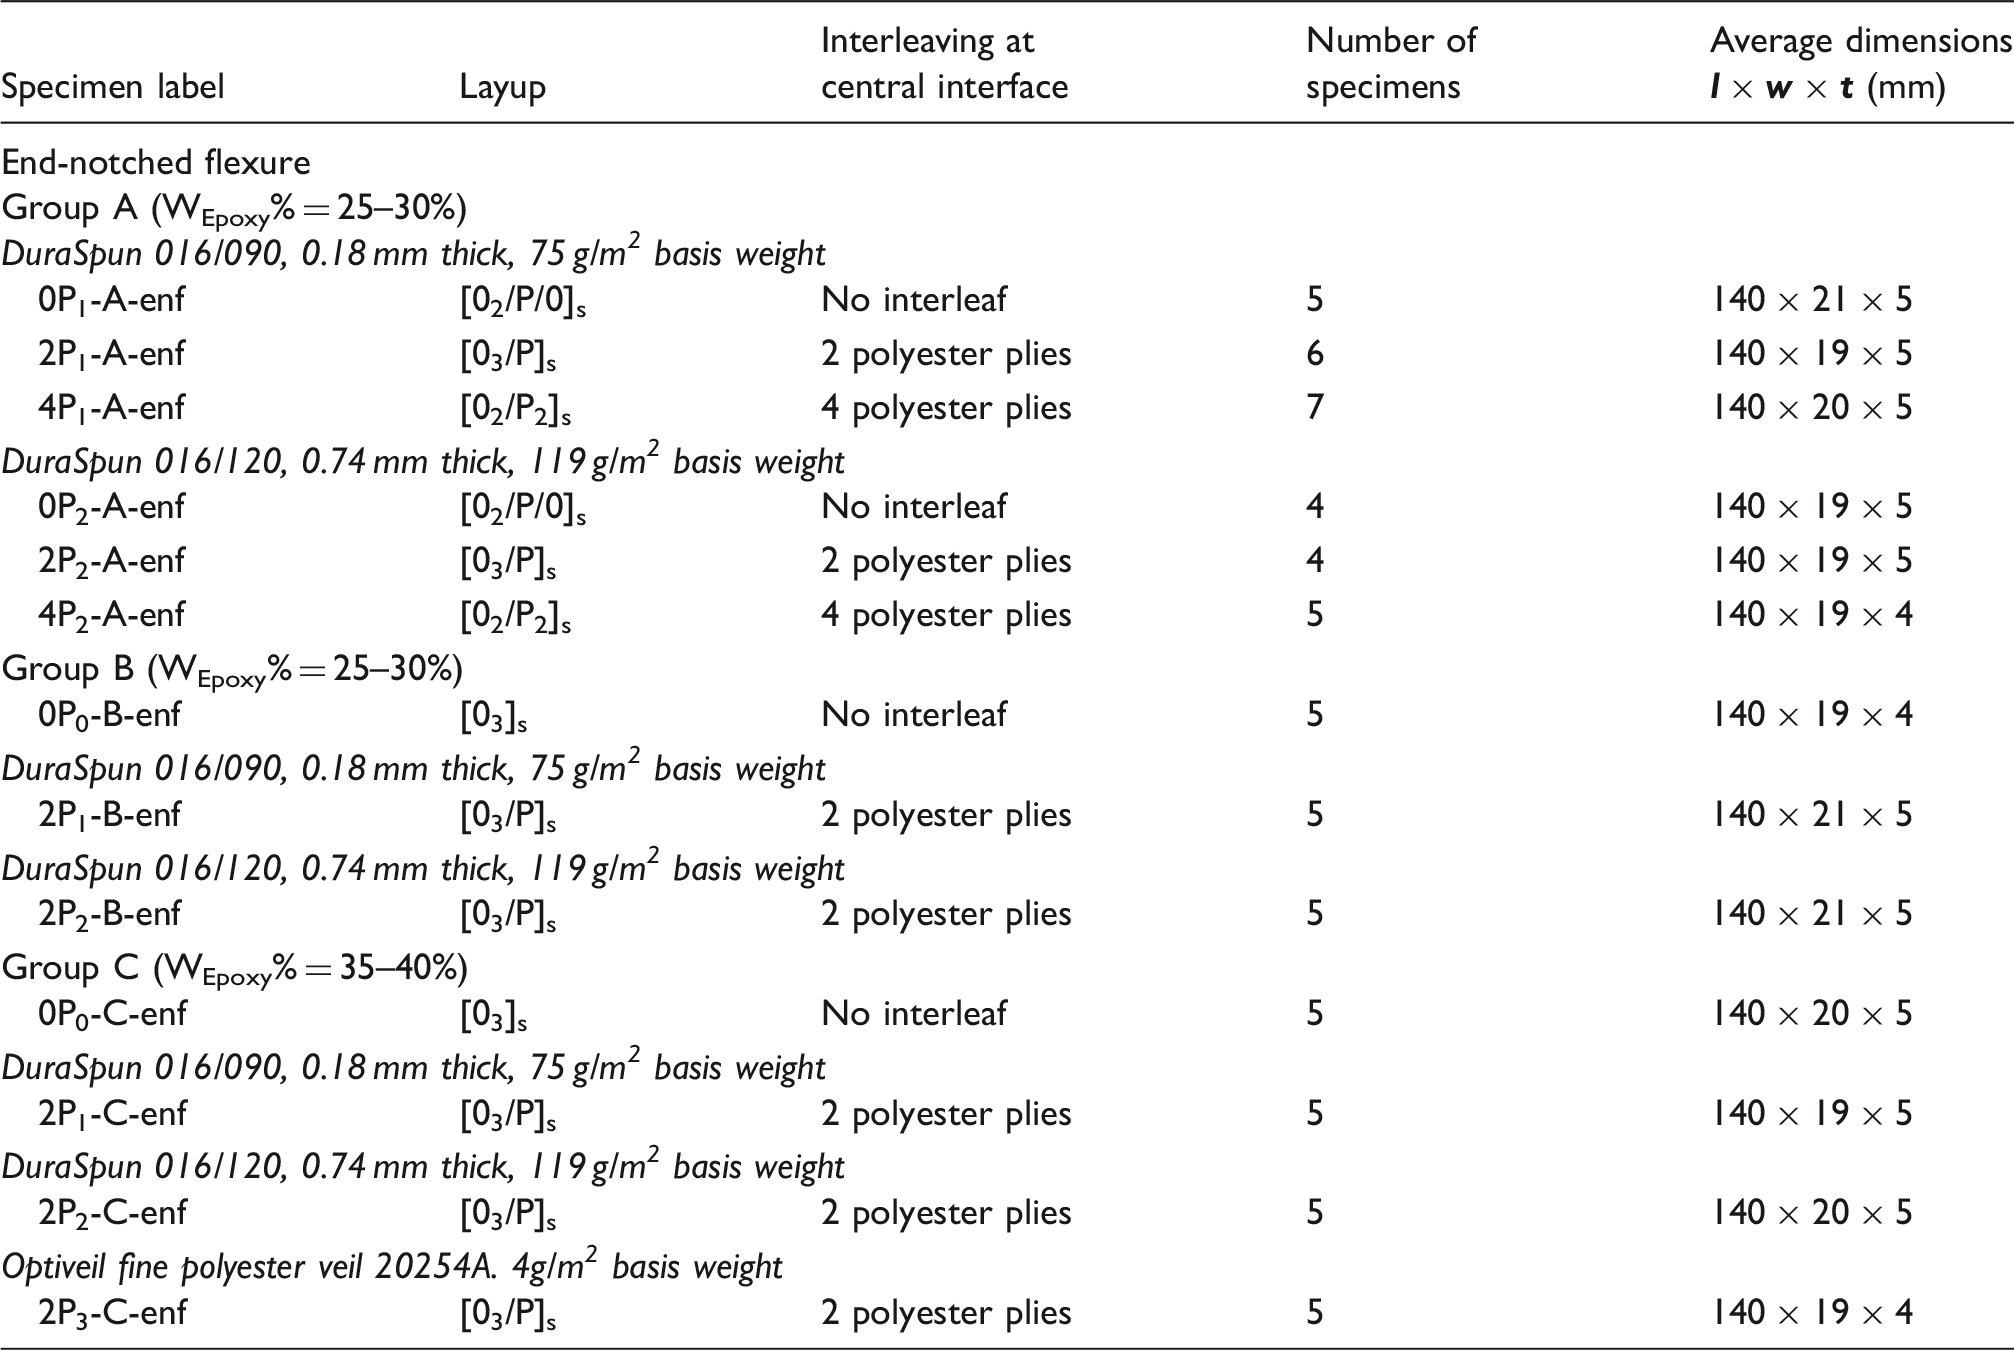
Test matrix of double cantilever beam (DCB) tests. Test specimen layup, materials and dimensions summary.
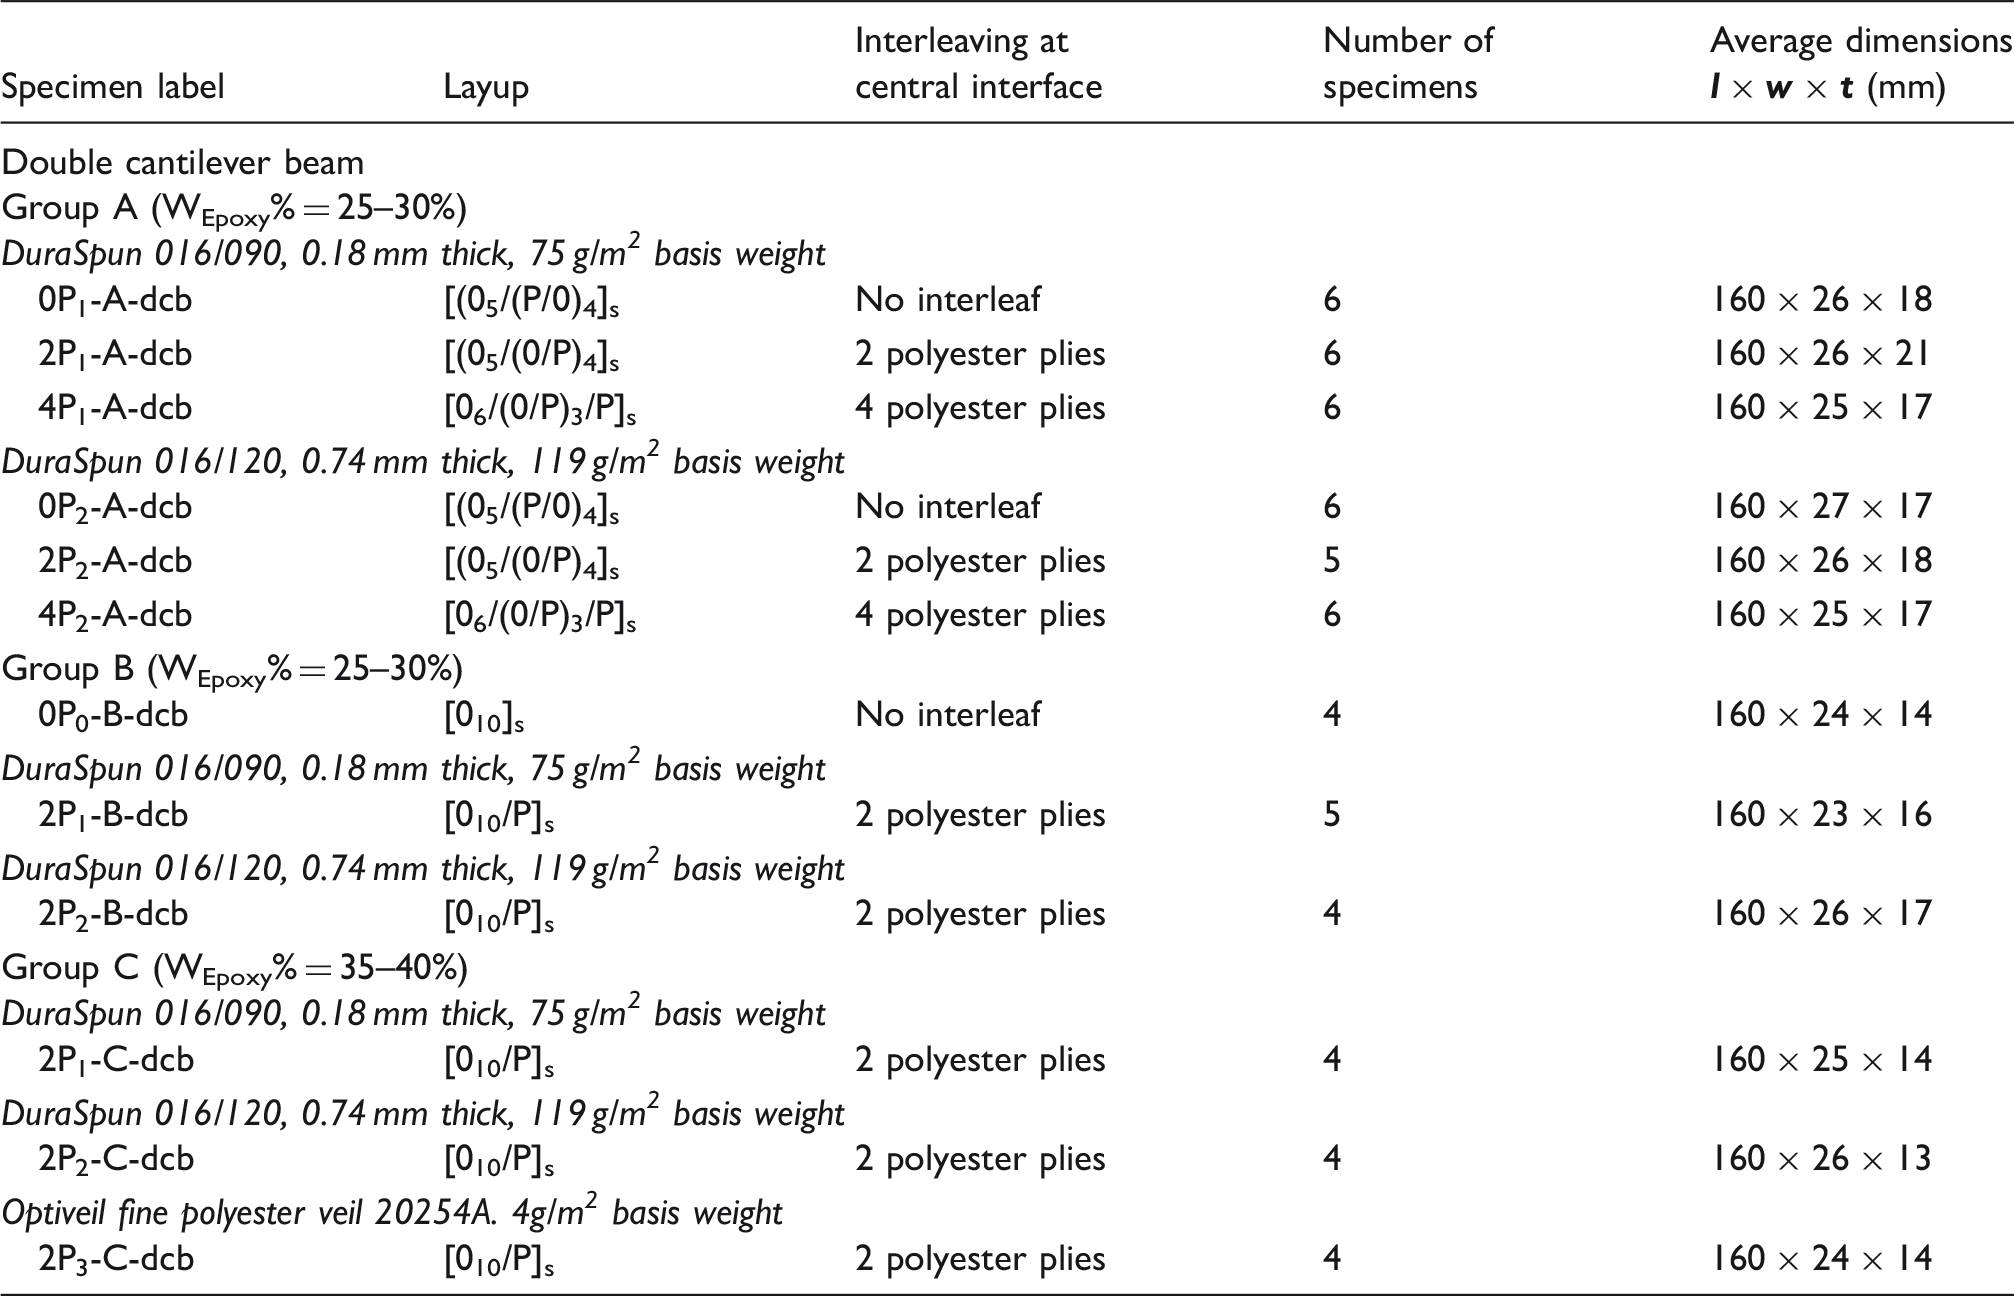
In the DCB tests, all laminates have approximately the same thickness within each group. The tests compare specimens without polyester interleaf at the midplane, specimens with two polyester plies at the central interface, and specimens with four polyester plies at the central interface as seen in Figure 1. The specimen notation scheme is: iPj-X-, where i indicates the number of polyester plies at the central interface. The subscript j in Pj indicates the type of polyester veil used (0 indicates no polyester, 1 indicates DuraSpun 016/090, 2 indicates DuraSpun 016/120, and 3 indicates Optiveil 20254A). The letters between hyphen, A, B, or C, indicate the test group number. Groups A and B used the same manufacturing processes resulting in a matrix weight fraction between 25% and 30%. Group C is rich of epoxy and the matrix weight fraction is between 35% and 40%.
Interleaving at central interface for DCB specimens: (a) (0P) No interleaf, (b) (2P) 2 polyester plies, and (c) (4P) 4 polyester plies.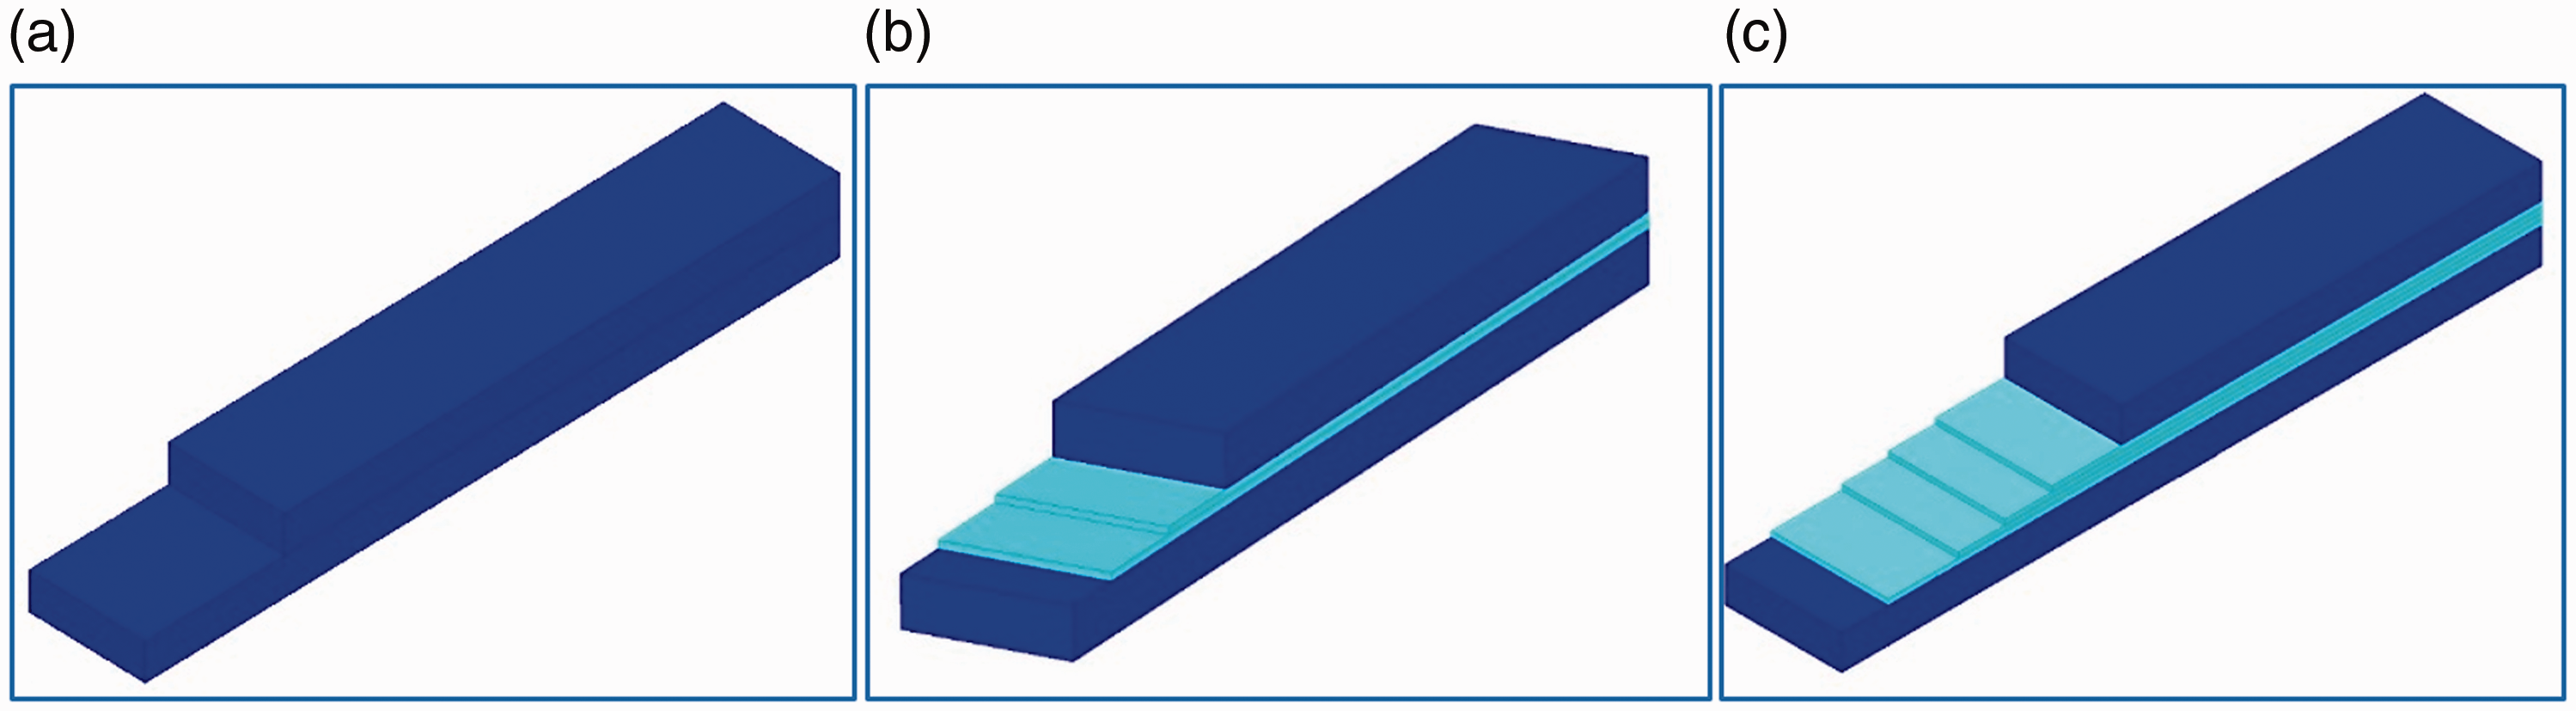
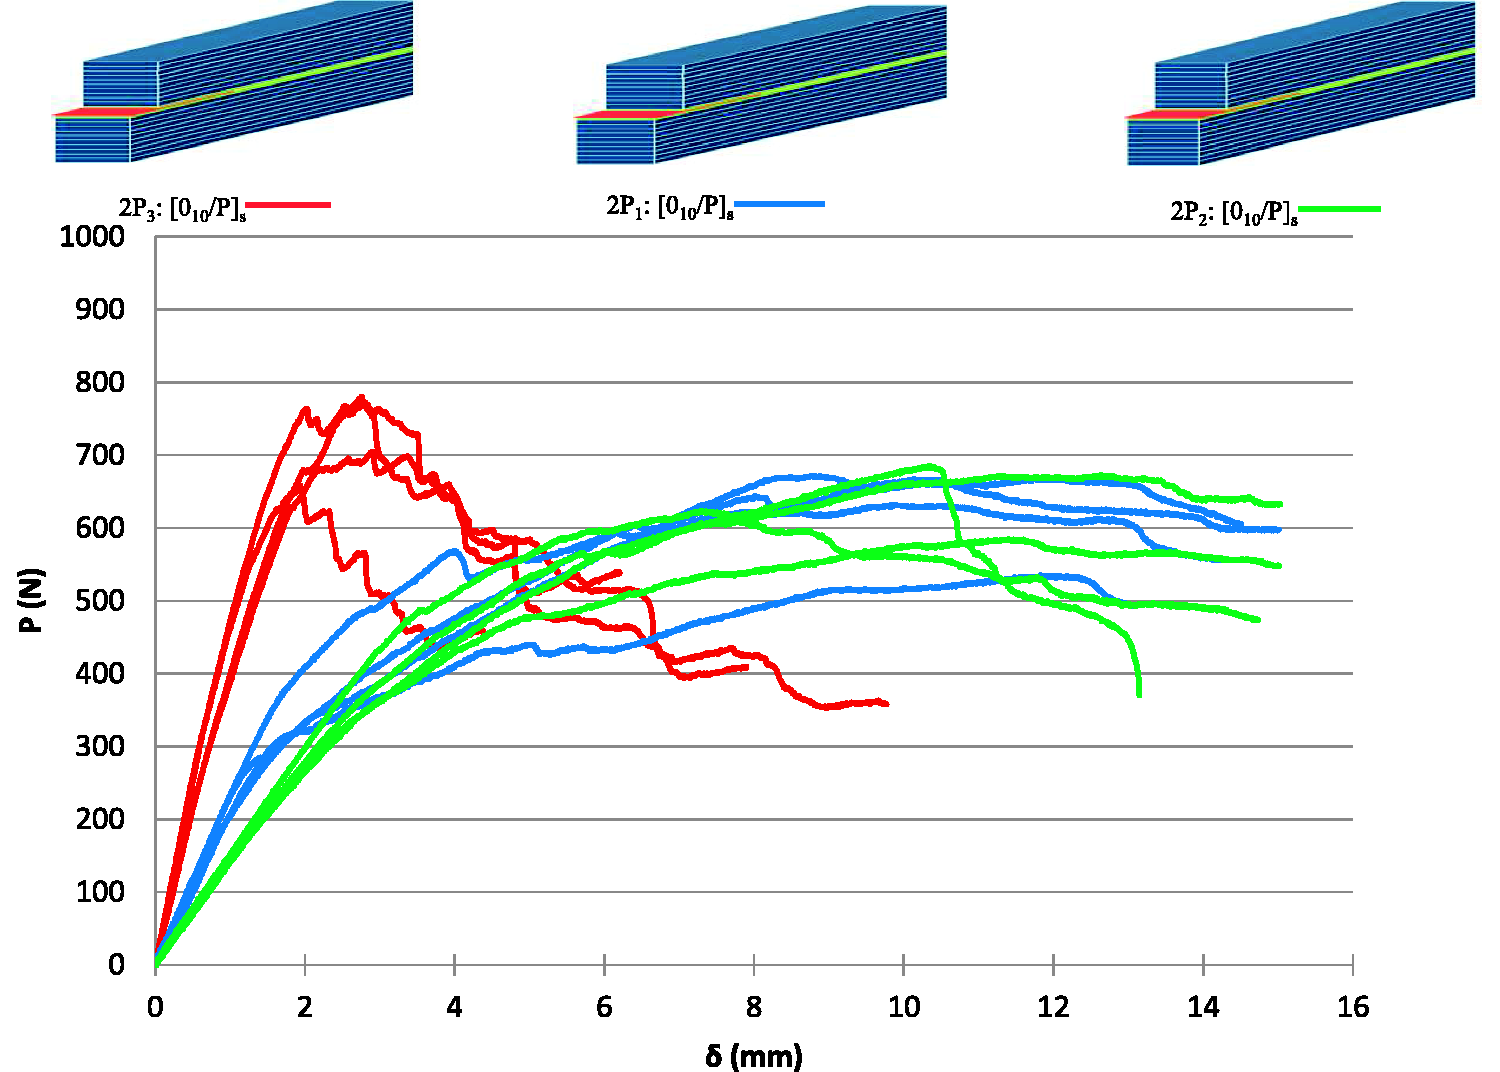
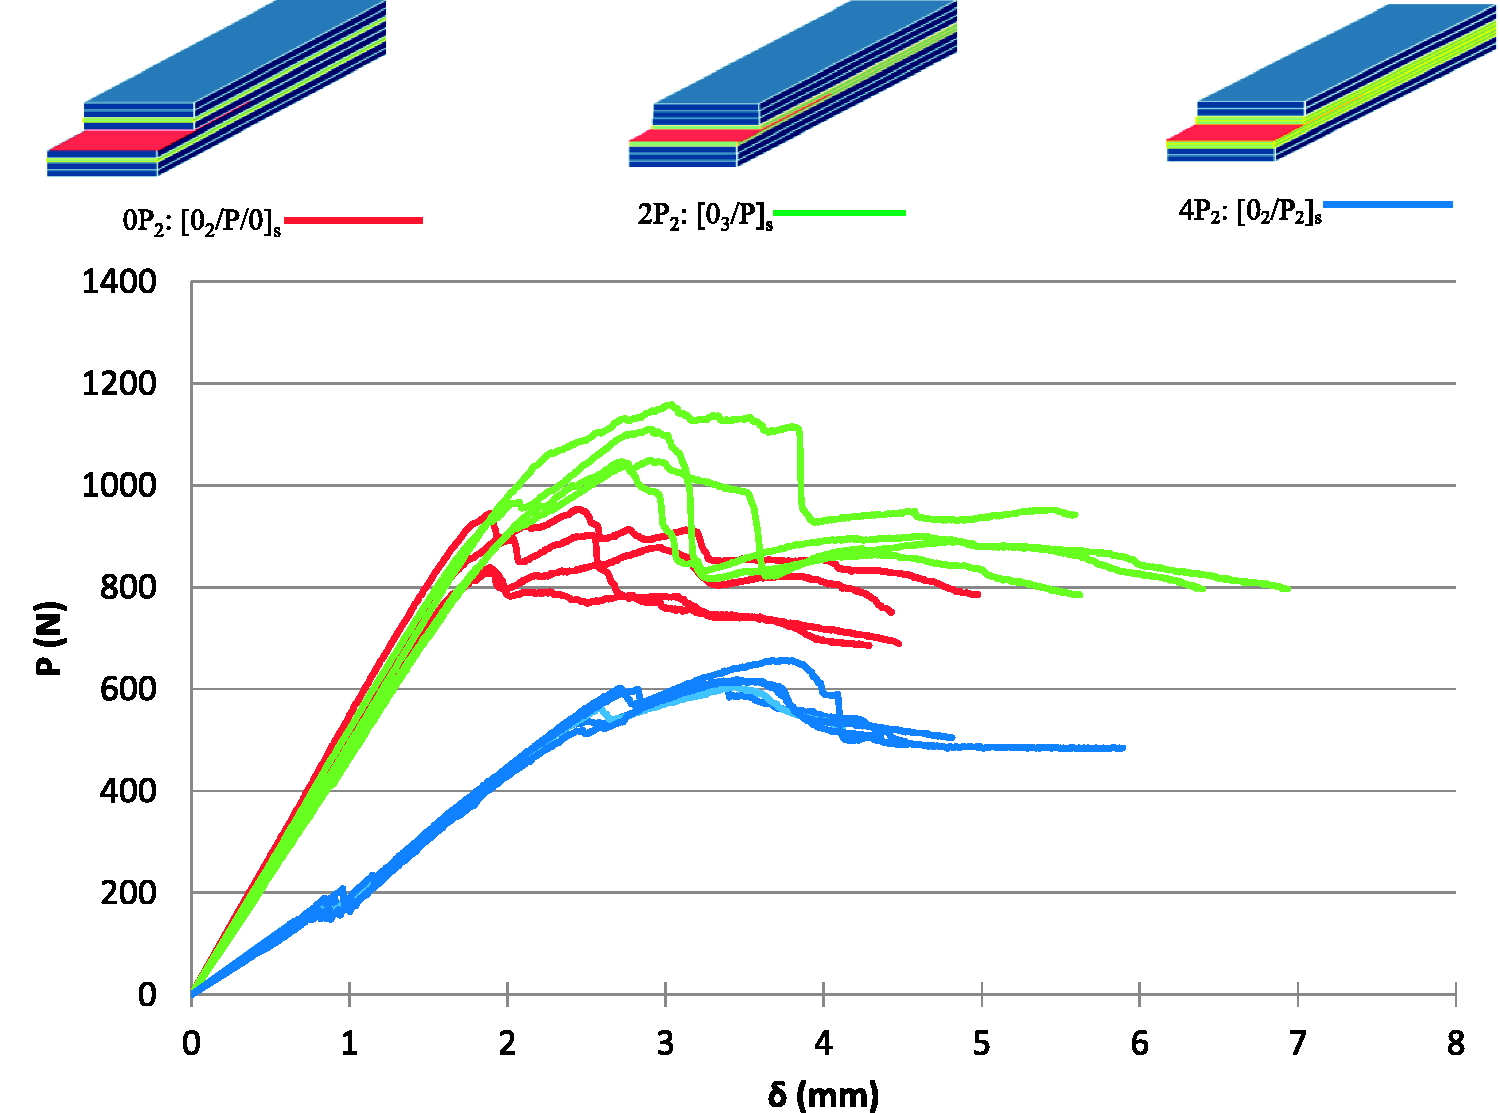
The ENF tests similarly compare specimens without polyester interleaf at the midplane, specimens with two polyester plies at the central interface, and specimens with four polyester plies at the central interface as seen in Figure 2. The notation scheme is the same as for the DCB specimens.
Interleaving at central interface for ENF specimens: (a) (0P) No interleaf, (b) (2P) 2 polyester plies, and (c) (4P) 4 polyester plies.
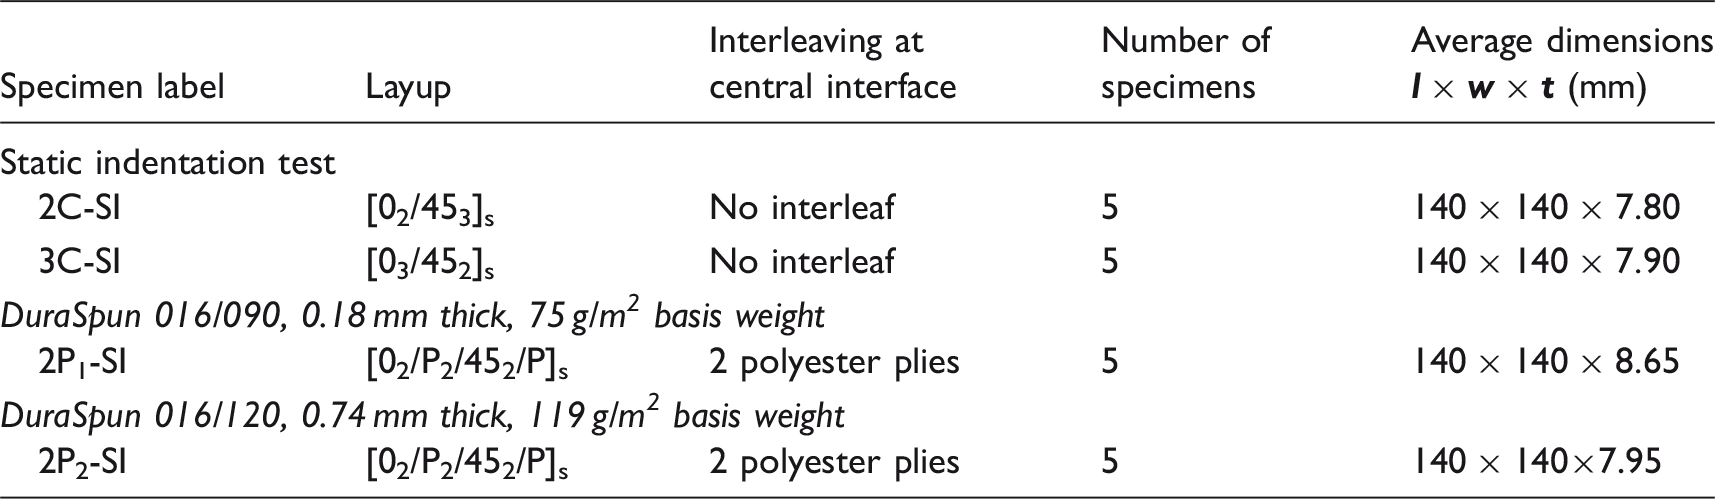
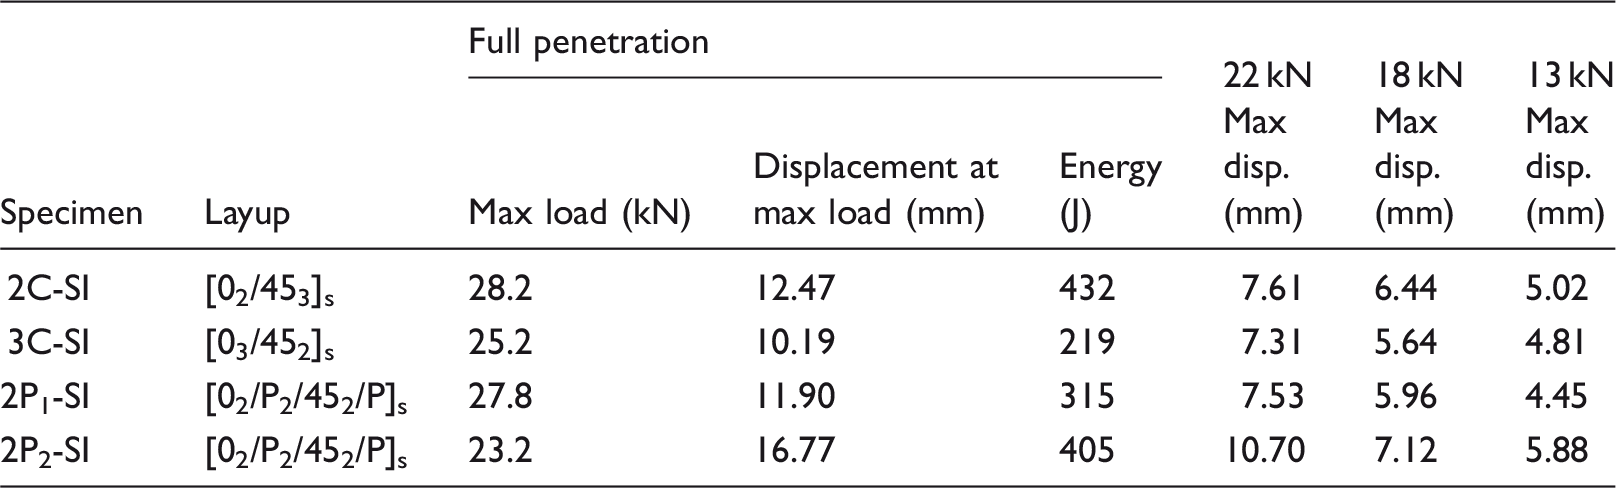
In the SI tests, all laminates approximately have the same thickness. Control specimens 2C-SI and 3C-SI have no polyester interleaf but have additional graphite material to maintain the same thickness as the interleaved specimens. 2P1-SI and 2P2-SI contain two polyester interleaf layers at the 0/45 interface, and two interleaf layers at the laminate midplane.
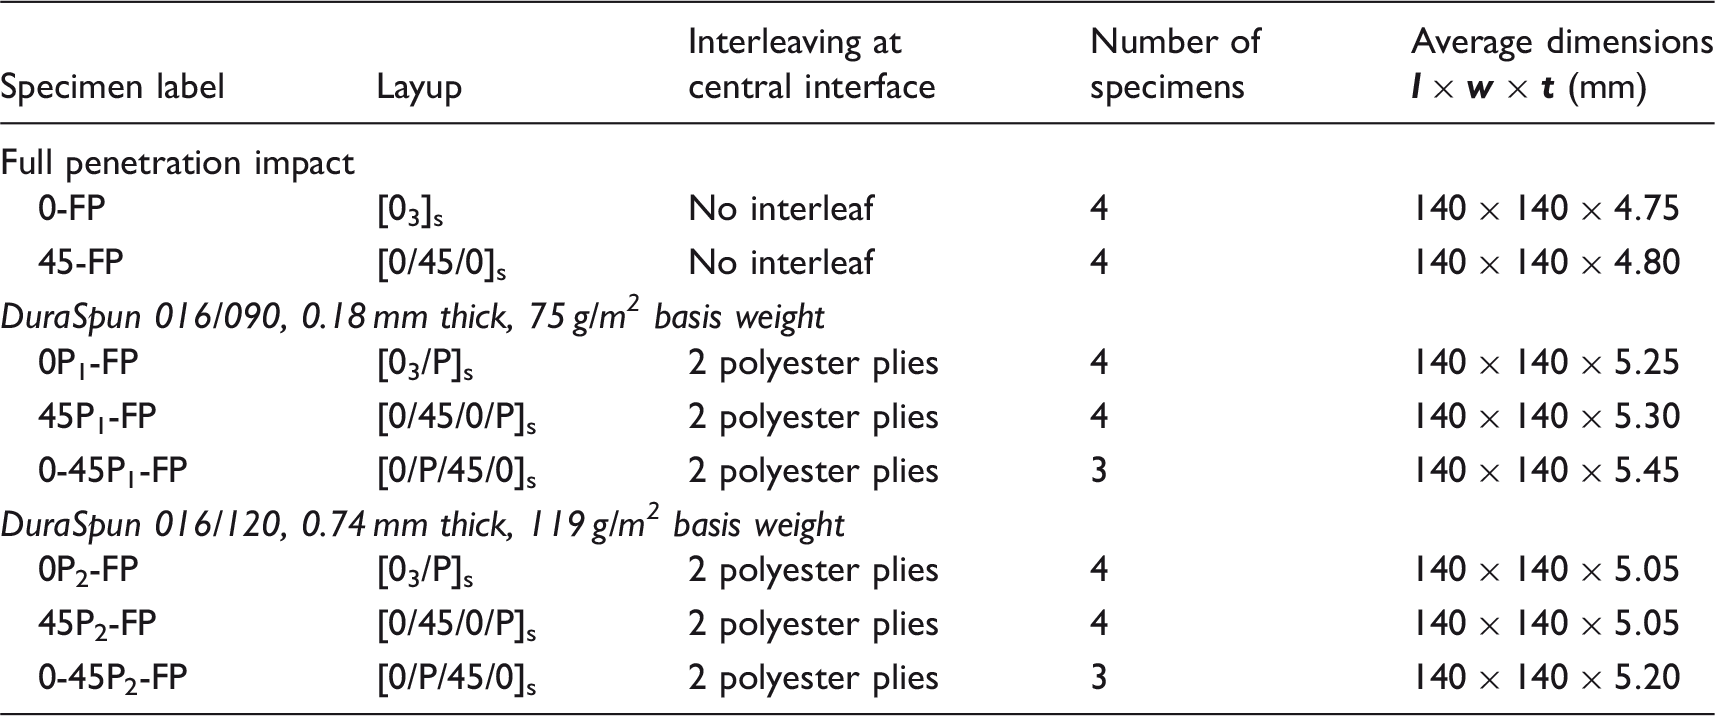
In the FP tests, control specimens (0-FP, 45-FP) have no polyester interleaf. (0P1-FP, 0P2-FP, 45P1-FP, 45P2-FP) contain two polyester interleaf layers at the laminate midplane. (0-45P1-FP, 0-45P2-FP) contain one polyester interleaf at the 0/45 interface and have no polyester interleaf at midplane.
Testing procedures
Performance of polyester interleafs for delamination suppression is evaluated using DCB, ENF based on four-point bending (4ENF), SI, and FP impact tests.
DCB
DCB tests are widely used to measure Mode I interlaminar fracture toughness (GIc) of laminates.14–16 The DCB test is standardized in ASTM D5528, 17 and the present tests were based on that standard, with some necessary modifications. Specimens have 160 mm length and 25 mm width. The thickness used for the woven fiber composites in the present study, about 14 to 18 mm, is larger than specified in the ASTM standard for unidirectional laminates. Preliminary test specimens made using the standard thickness suffered flexural fracture in the arms at or before initial delamination propagation. Simple beam bending analysis showed that the thickness should be at least 14 mm to prevent this failure. DCB testing was conducted using an MTS 100 kN (22 kip) uniaxial testing machine in the Florida Tech Structural Mechanics lab. Specimens were loaded through loading blocks attached to the DCB specimens with epoxy resin. The crosshead speed was set at a constant 1 mm/min. During loading, the load–displacement data were recorded and the onset and propagation of delamination were visually observed. Finally, each specimen was unloaded at a constant crosshead rate of up to 25 mm/min after delamination propagation reached 50 mm length. In addition to the geometry modification, some additional deviations from the ASTM standard were made. First, the unloading–reloading procedure was not followed and thus initiation fracture toughness values are associated with the insert geometry only. Second, the machine compliance was not measured. Thus, results generated should be used for purposes of comparison between specimens within this study only. The propagation energy absorbed during DCB tests was determined by calculating the area under the load vs. displacement curve from the nonlinearity (NL) point until 50 mm of crack propagation. Because of variations in specimen width and the exact stopping point of each test, the energy is standardized by dividing it by the area of propagation.
4ENF testing
Several different tests have been used by previous researchers to measure Mode II interlaminar fracture toughness including ENF tests based on three-point (3ENF) and four-point bending (4ENF).15,18,19 The 4ENF specimen was selected for the present research because previous researchers showed that it is capable of producing stable crack propagation.
20
The 4ENF test uses a four-point bending fixture as shown in Figure 3. No ASTM standard exists for a Mode II Interlaminar Fracture Toughness test; procedures used here followed those reported in the literature.15,18,19
4ENF test: schematic based on Ref.
20
(left), photograph of actual test (right).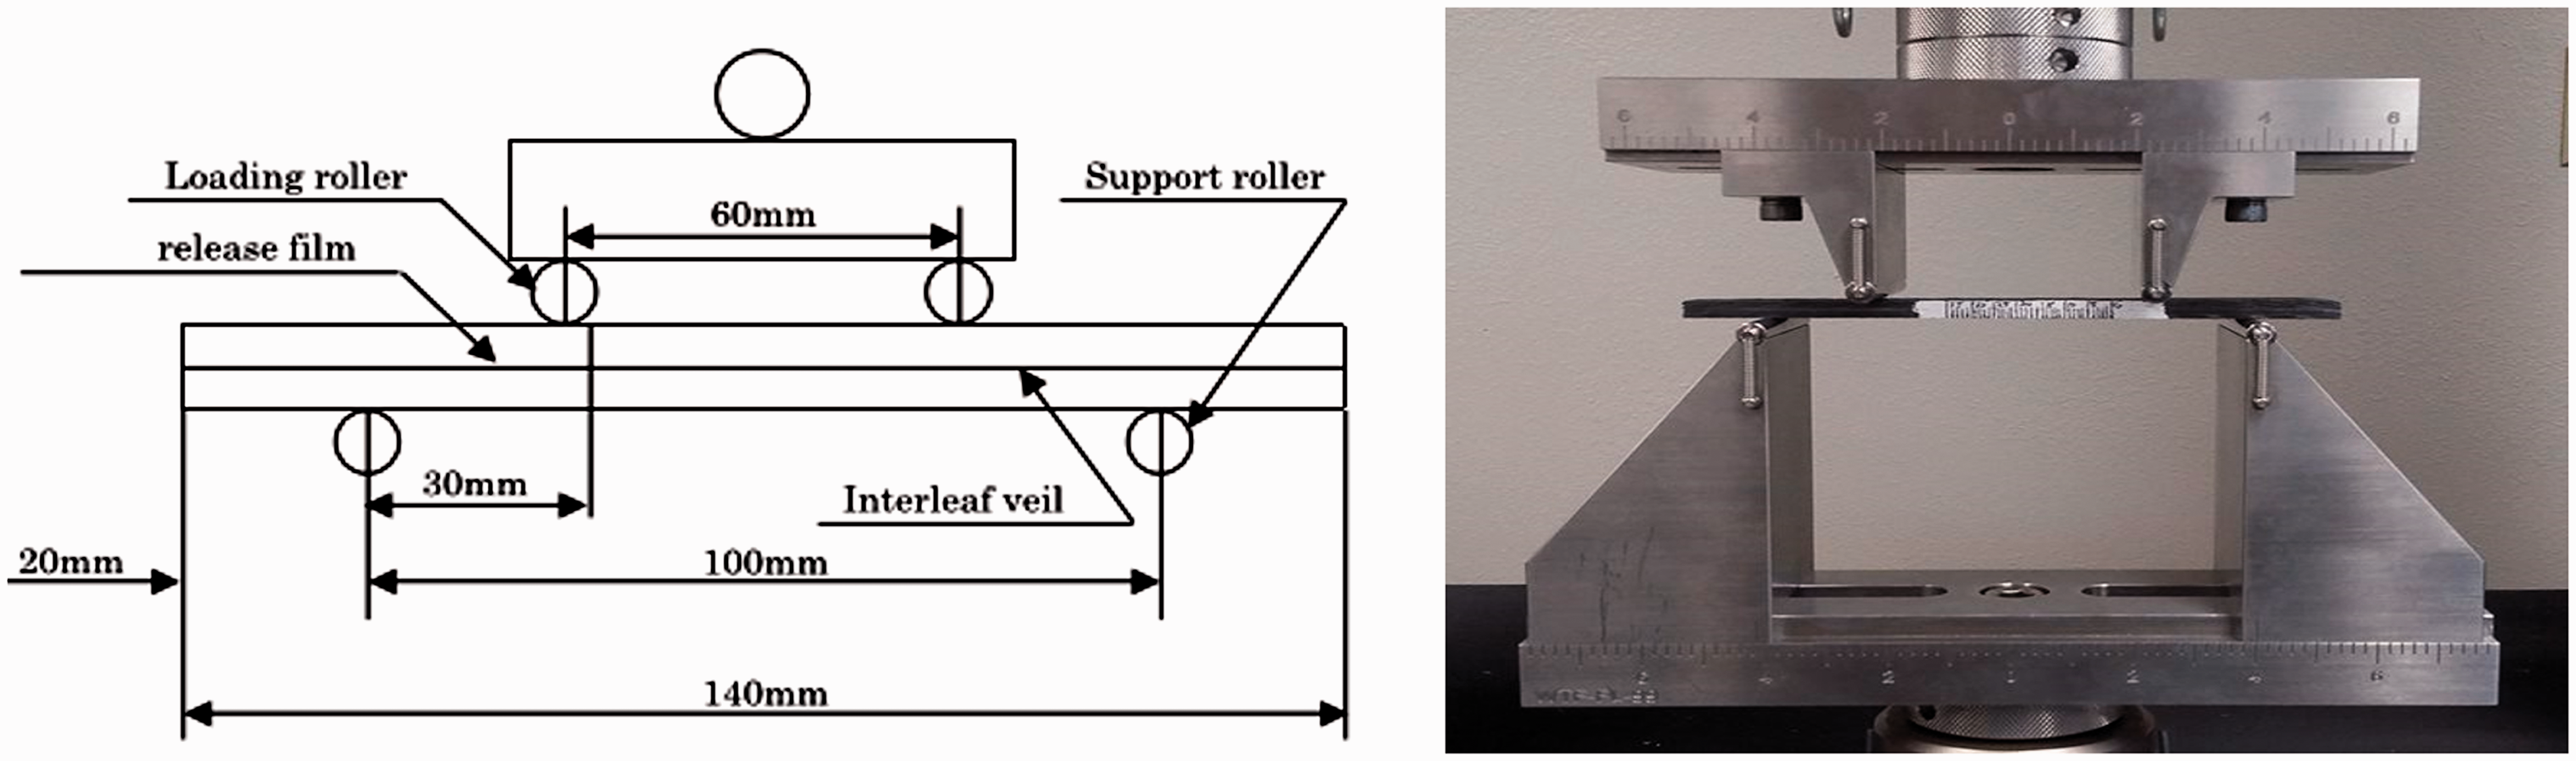
The 4ENF testing was conducted using a MTS 100 kN (22 kip) uniaxial testing machine. Specimens were rectangular in shape, nominally 140 mm in length, 20 mm in width, and 5 mm in thickness. The crosshead speed was set at a constant 0.5 mm/min. During loading, the load–displacement data were recorded and the onset of delamination crack propagation was visually observed using a USB microscope on the edge of the specimen. Finally, each specimen was unloaded at a constant crosshead rate of up to 25 mm/min.
The propagation energy was computed based on the area under the load vs. displacement curve from NL point until the maximum load point.
SI test
In SI tests, four types of specimens were used, two containing interleaves and two without. The thickness was approximately the same for all specimens. Control specimens 2C and 3C have the same number plies as each other but have slightly different layups. Neither control specimen type contains any polyester interleaving. Specimens 2P1 and 2P2 have the same fiber content as each other but use different polyester interleaf materials. SI testing was conducted using a Baldwin 270 kN (60 kip) uniaxial testing machine in the Florida Tech Structural Mechanics lab. The SI specimens were square in shape; 140 mm × 140 mm (5.5 × 5.5 in.), and 8 mm (0.31 in.) in thickness. The specimens were clamped on all sides in a support fixture as shown in Figure 4. The support fixture was square in shape with an unsupported region with dimensions of 127 mm (5.0 in.) square. The SI tests were carried out under displacement control at a loading rate of 2 mm/min. The indenter was a hemispherical tup of 12.6 mm diameter. The test was divided into five batches of four specimens. Specimens from each batch were loaded up to a certain load level: P = FP, 22 kN (5000 lb), 18 kN (4000 lb), 13 kN (3000 lb), and 9 kN (2000 lb), then unloaded. The load levels were selected based on preliminary full penetration testing that showed that FP happened at around 27 kN (6000 lb) and that the first audible damage occurred around 9 kN (2000 lb). After each test, specimens were sectioned through the center of the loading point and imaged using a scanning electron microscope (SEM). The SEM images are obtained from The High-Resolution Microscopy & Advanced Imaging Center at Florida Institute of Technology.
Static indentation test setup.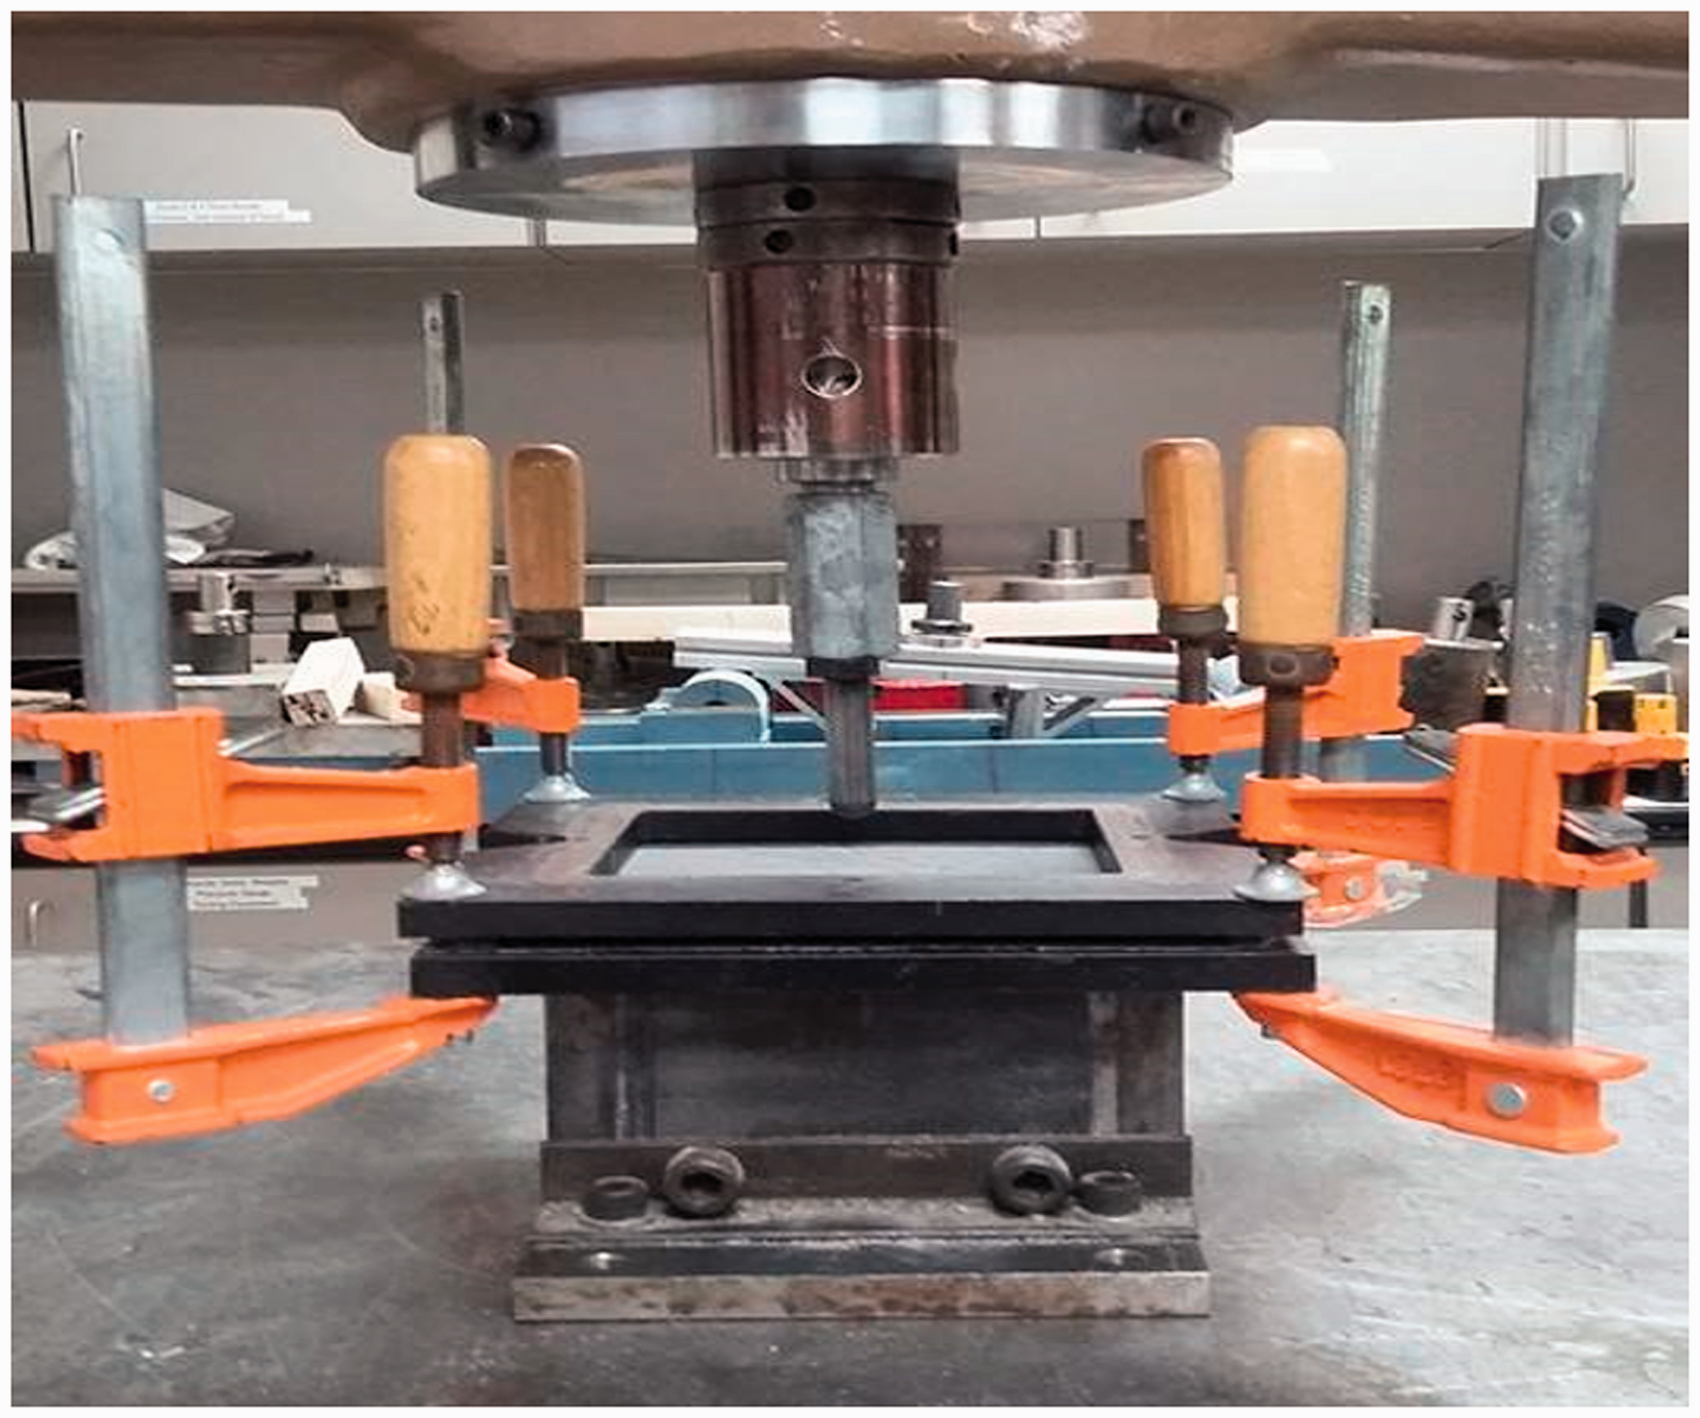
FP impact test
In FP impact testing, a mass is raised to a known height and dropped, impacting the specimens. The mass and drop height are selected to ensure that the specimen is completely penetrated by the tup. In the present study, eight types of specimens were used, two without polyester interleaving (0-FP and 45-FP) and others containing interleaves. Control specimens 0-FP and 45-FP have the same number of plies as each other with slightly different layups, as noted in Table 4. Specimens (0P1-FP and 0P2-FP), (45P1-FP and 45P2-FP) and (0-45P1-FP and 0-45P2-FP) have the same fiber content as each other but use different polyester interleaf materials. The FP test was conducted using a Dynatup 8250 in the Florida Test Structural Mechanics lab. Specimens were square in shape, nominally 140 mm (5.5 in.) square, and 5 mm (0.20 in.) in thickness. Specimens were clamped on all edges in a support fixture as shown in Figure 5. The support fixture was hollow square in shape; the external size was 203 mm (8.0 in.) square, and the internal size was 127 mm (5.0 in.) square. The tup was hemispherical with 12.6 mm diameter. All laminates were impacted using the same hammer weight of 22.5 kg (49.9 lbm) and the same impact velocity, 3.6 ± 0.1 m/sec (11.8 ± 0.3 ft/s). After each test, specimens were sectioned through the center of impact and imaged using a microscope.
Full penetration impact setup.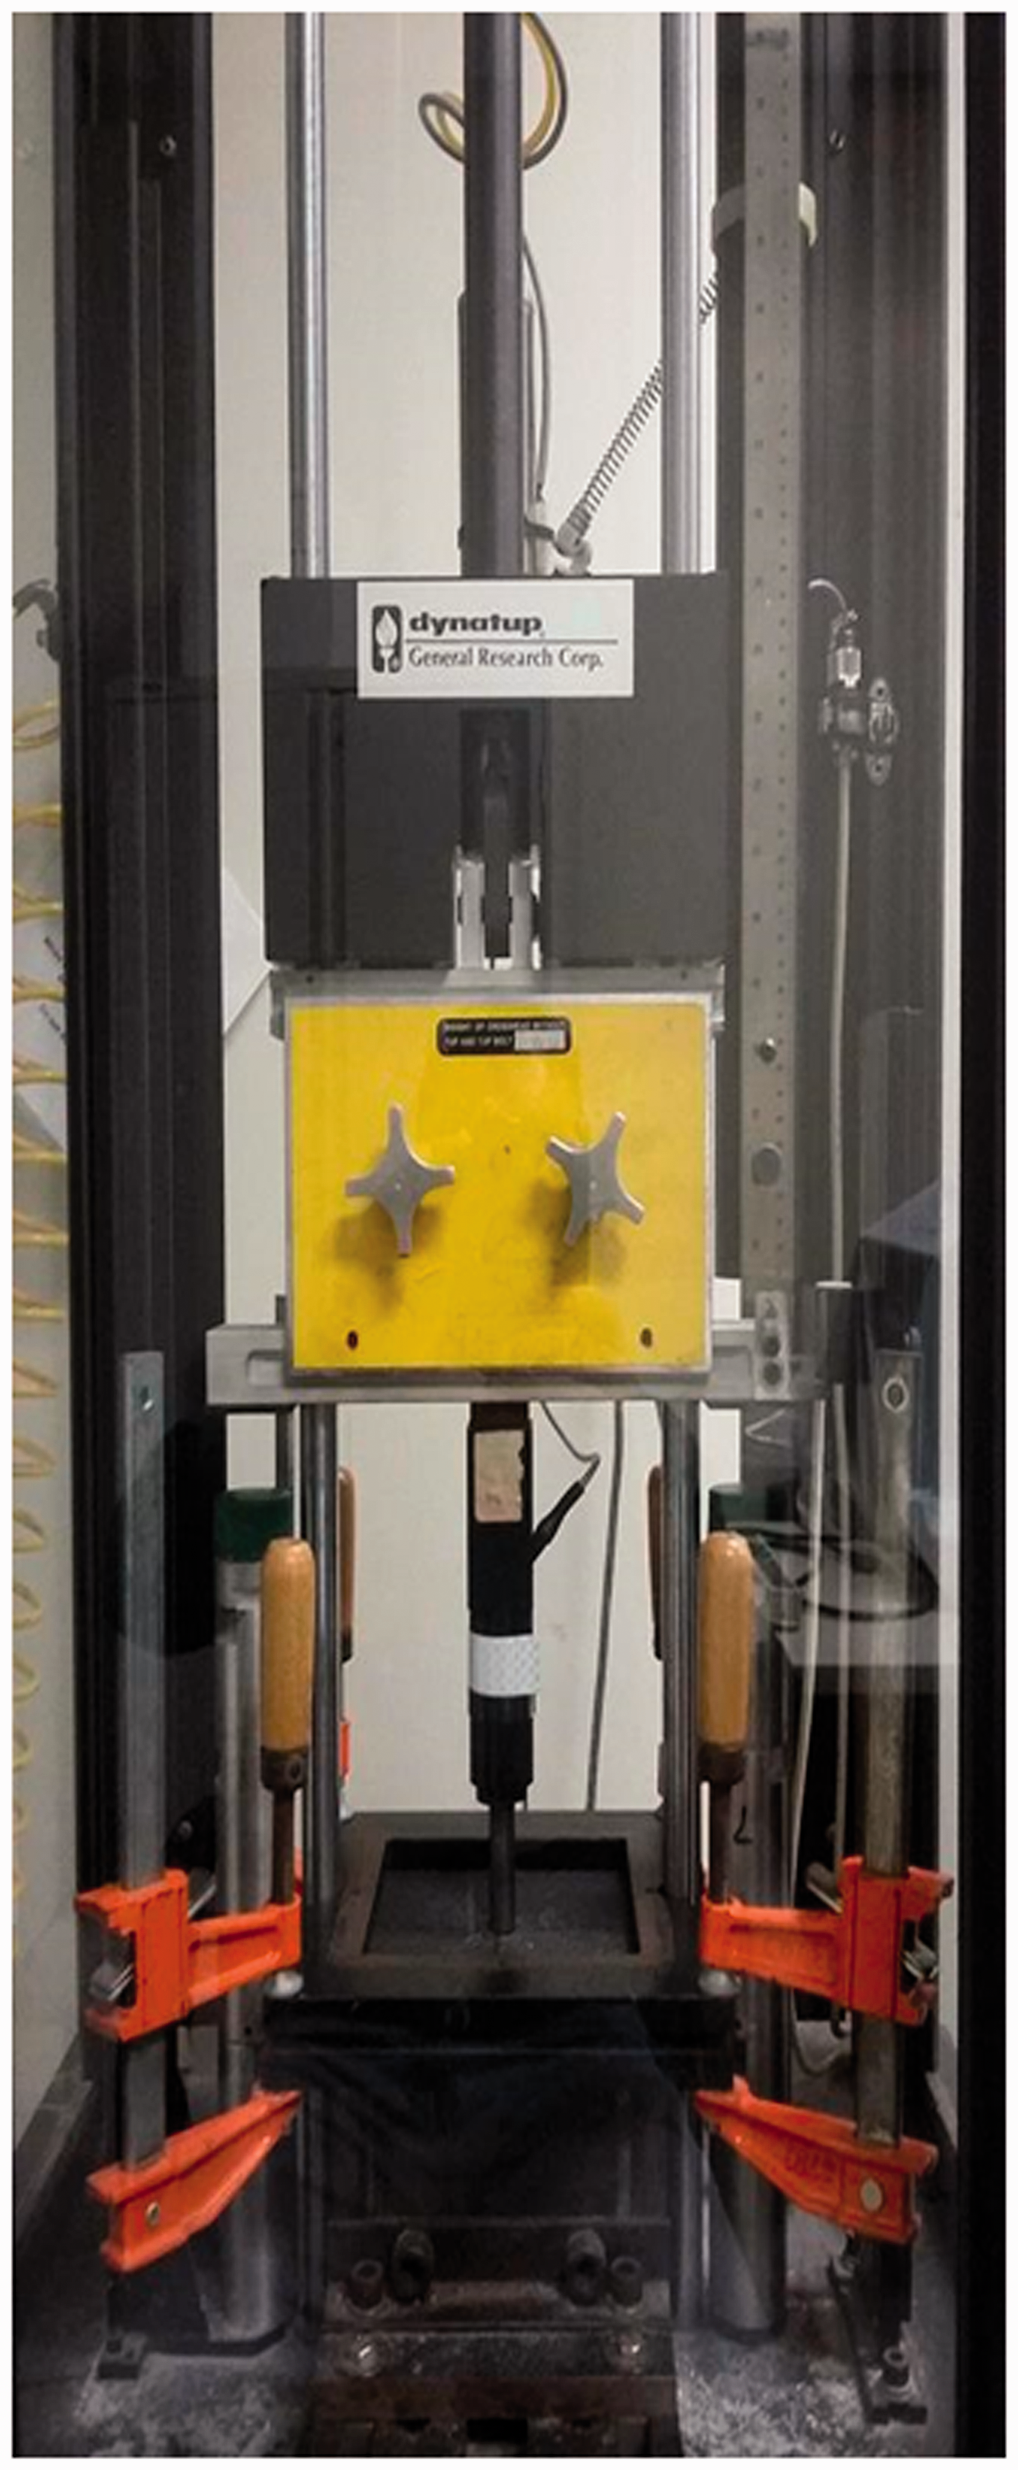
Results and discussion
DCB
Mode I fracture toughness was computed based on modified beam theory (BMT).
17
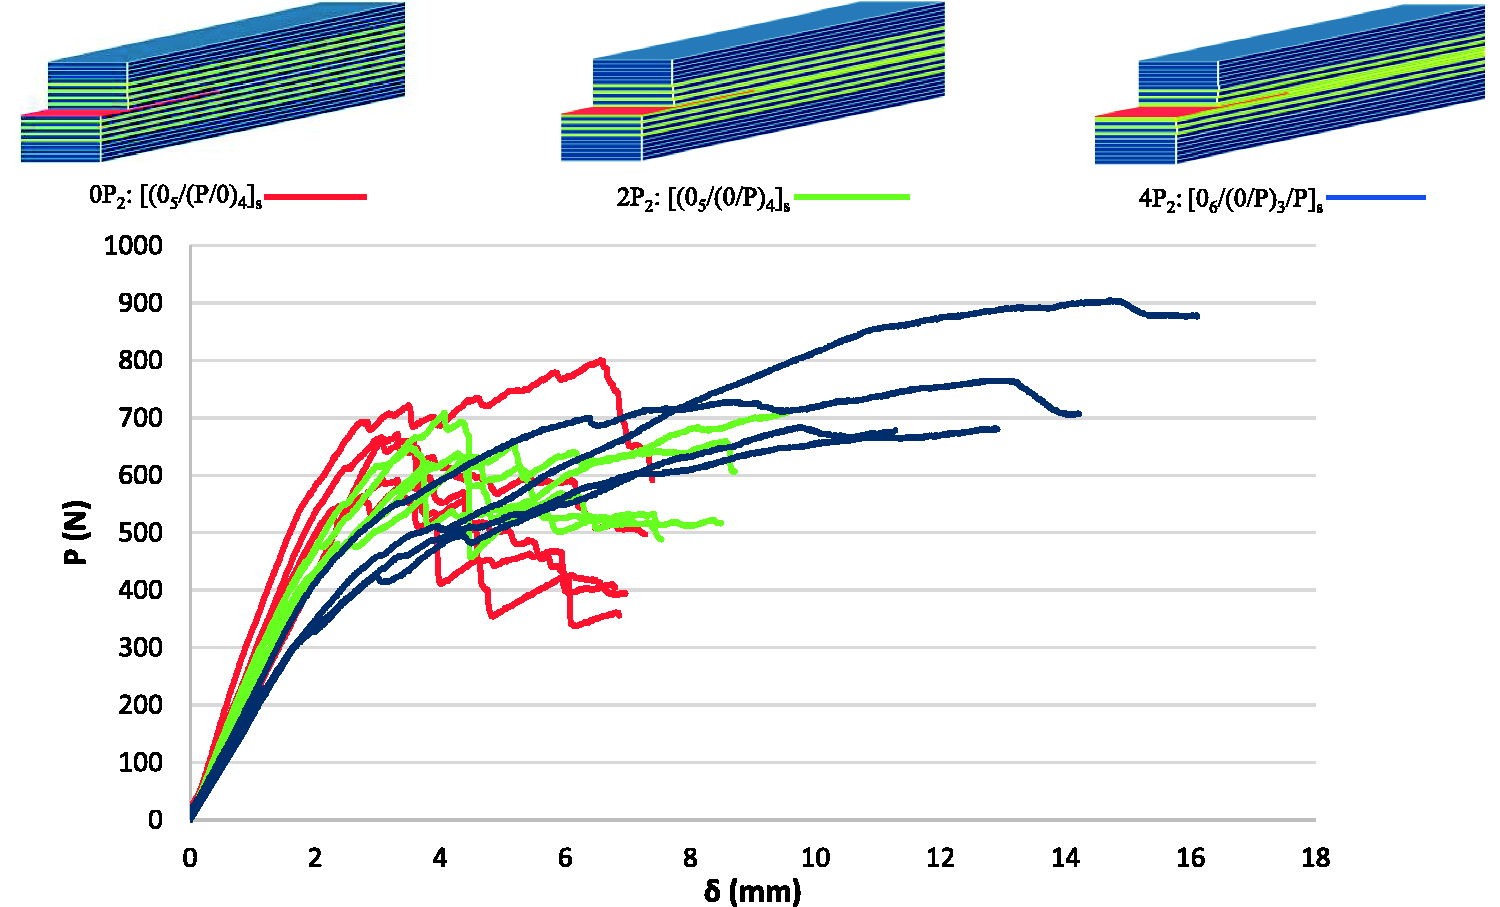
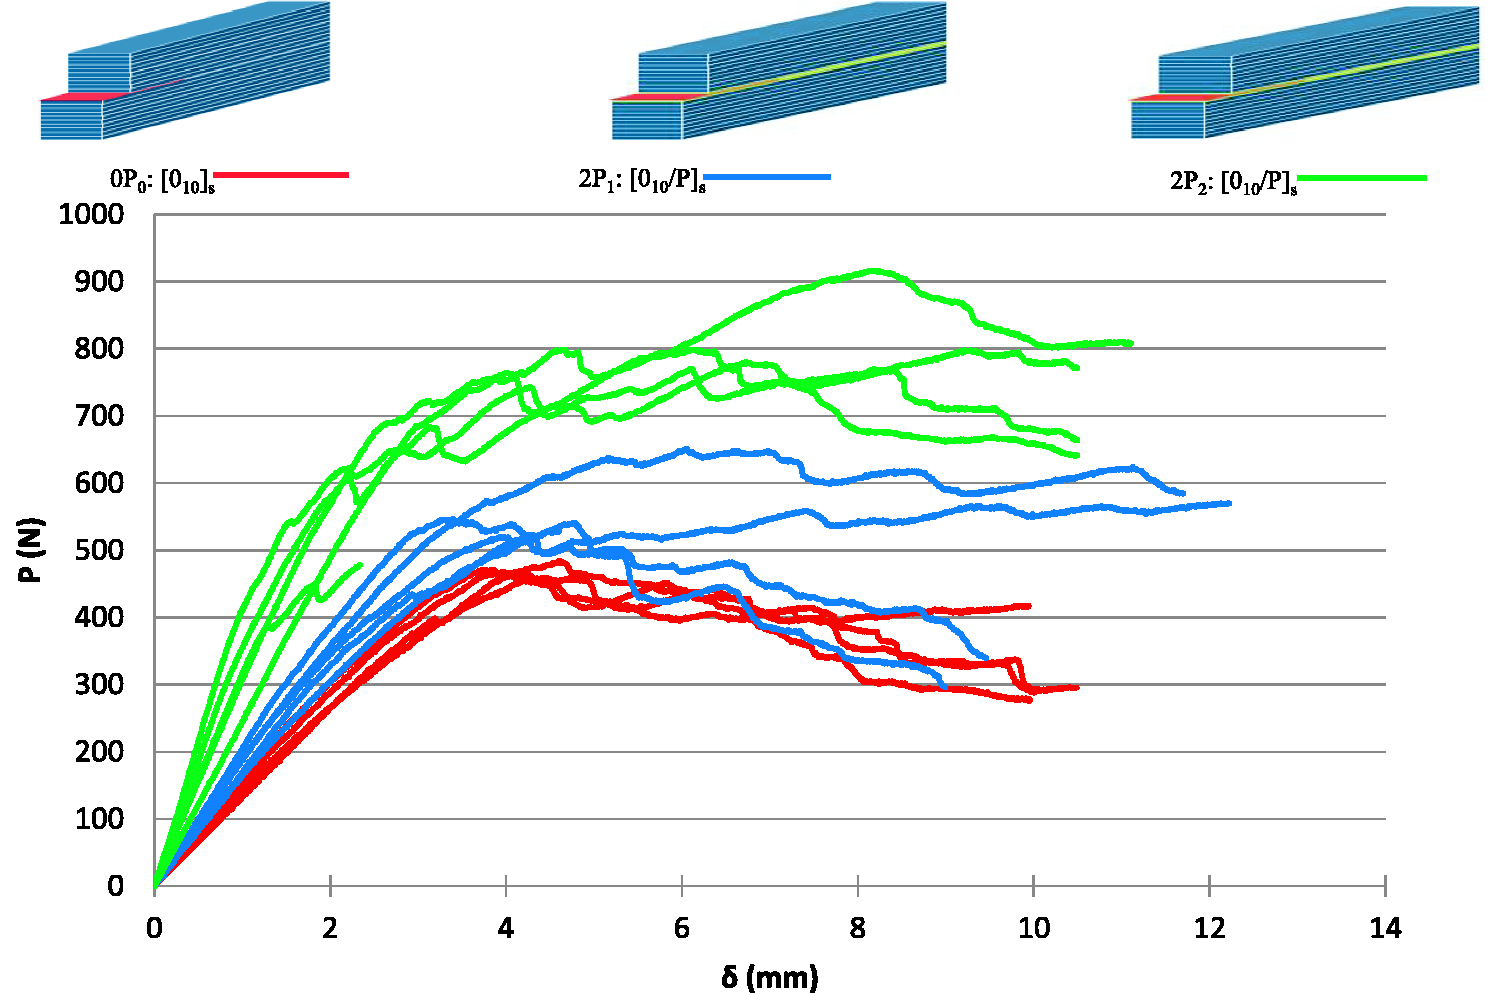
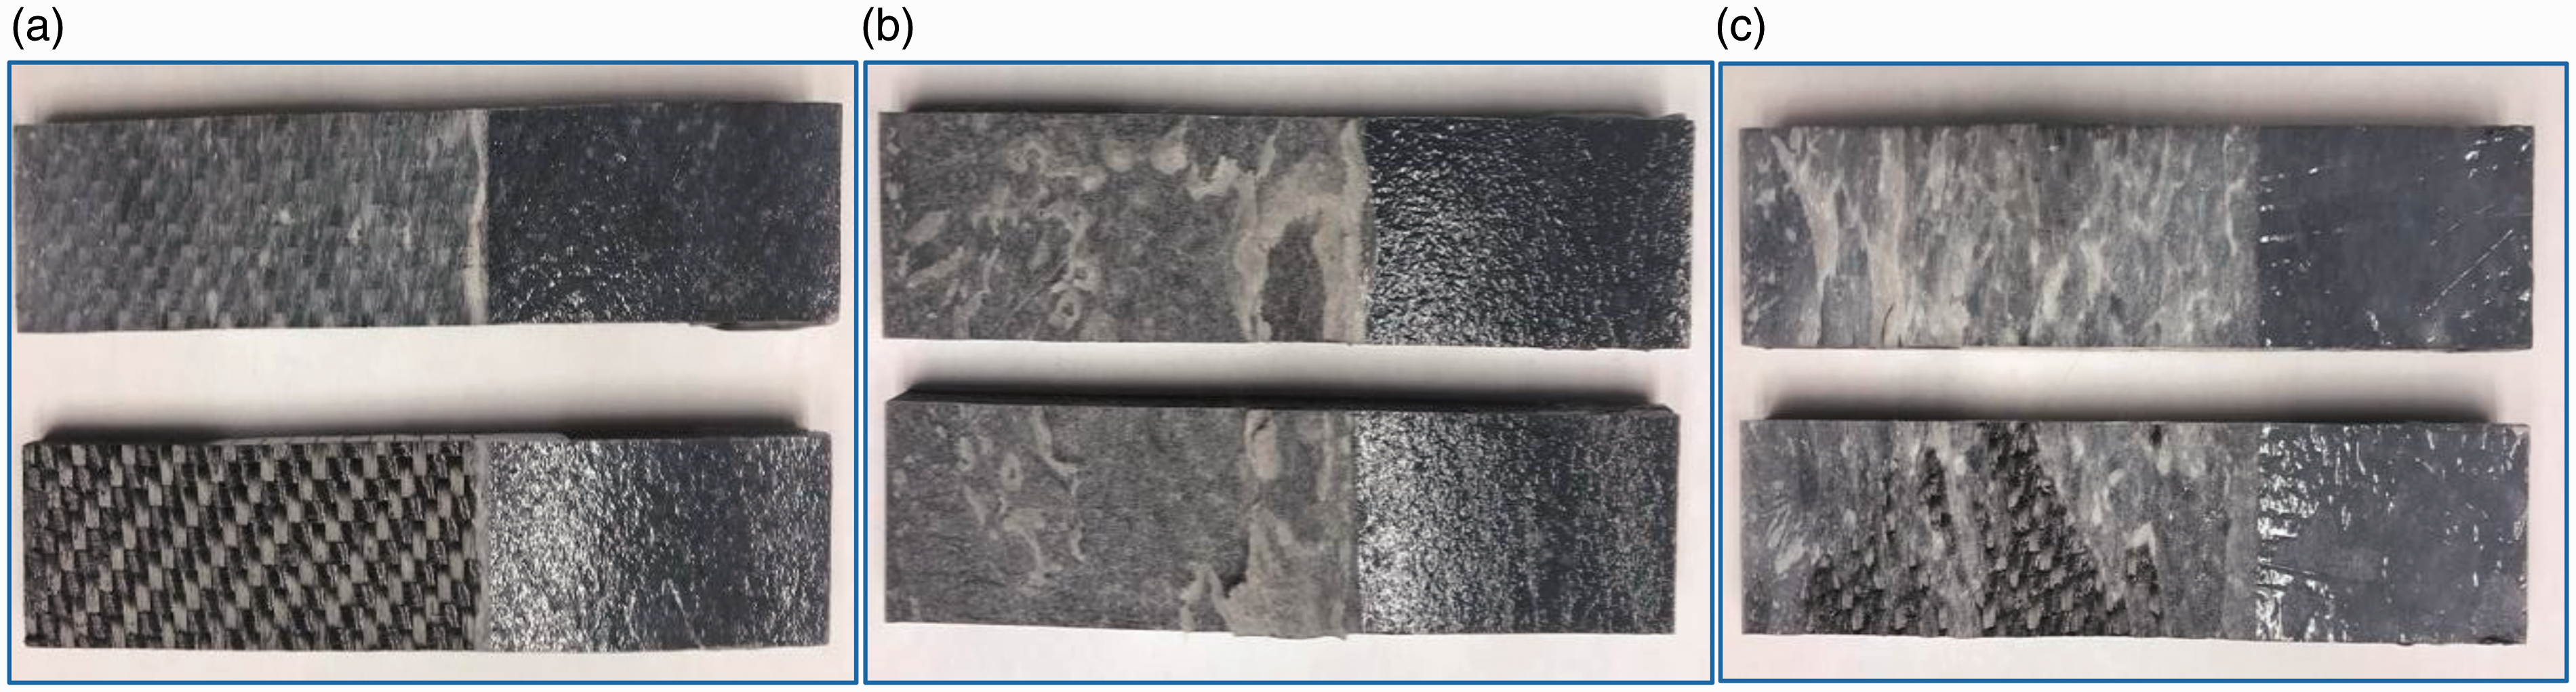
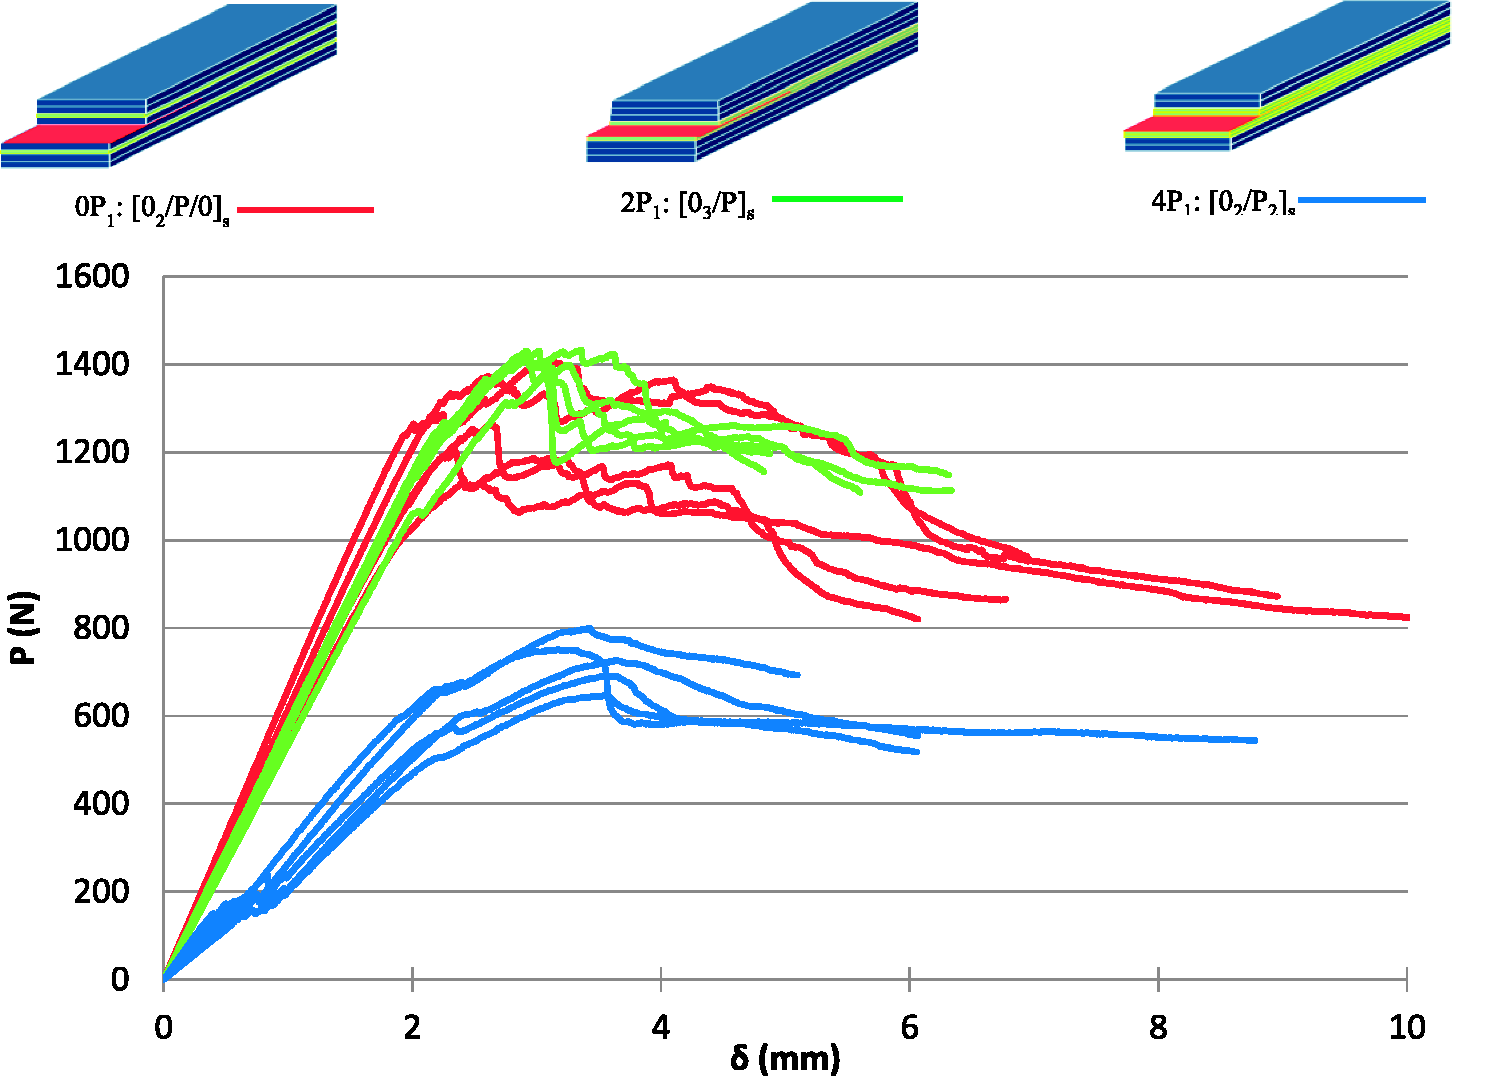
Figures 6 to 9 present force–displacement results for DCB specimens. Figures 6 and 7 show results for group A specimens using the two interleaf materials, “P1” and “P2” respectively. Significantly different behavior is observed in the specimens containing polyester interleaf at the interface. The “0P” specimens groups, with no interleaf at the pre-crack exhibit a decaying force following crack growth initiation, as is characteristic of conventional composite laminates. The “2P” and “4P” specimens containing polyester interleafs show some irregularities and a generally rising force following initiation. This is indicative of plastic deformations and crack jumps during delamination propagation. In some “0P1” specimens, a secondary delamination occurred at a different polyester interface away from the central pre-crack. Data from these tests are excluded after the secondary delamination started. Figures 8 and 9 show similar results for group B and C specimens, which have similar trends in behavior to the group A specimens. In Figures 8 and 9, the “0P” specimens with no interleaf show decaying force following crack growth initiation, while the “2P” specimens except “P3” show rising force following initiation crack. The “P3” specimens, with fine polyester, act similarly to specimens without interleaving. Due to the larger apparent toughness of the specimens “2P2-C-dcb” these specimens suffered flexure failure prior to completion of the test, therefore absorbed propagation energy is omitted from Table 2 for these tests. For all interleaf specimens, the delamination crack, which initiated at the insert at the middle of interleaf layers typically moved to the interface between the polyester and a carbon fiber ply (“adhesive failure”) as the crack propagated. The crack length at which this jump happened was different from one specimen to another, with some jumping to the interface within a couple millimeters while in others the crack remained within the polyester layer (“cohesive failure”) until near the end of the test. Failure surfaces of interleaved specimens “2P1-A-dcb,” “4P1-A-dcb,” “2P2-A-dcb,” and “2P1-B-dcb” show mixed surface failure where the failure alternated between failure within the polyester material and failure at the interface. Failure surfaces of interleafed specimens “4P2-A-dcb,” “2P1-C-dcb,” and “2P2-C-dcb” show cohesive surface failure throughout, and a few other specimens show mostly adhesive failure. Different failure surfaces pictures are shown in Figure 10. It can be noted that in Figures 8 and 9 that the initial stiffness of various specimen types is significantly different. This is because the specimen types had different pre-crack lengths; the initial stiffness is inversely proportional to the cube of the initial beam length. Specimens 2P2-B-dcb and specimens 2P3-C-dcb have shorter initial crack lengths, as is clearly seen in Figures 8 and 9, respectively.
Results of DCB tests for group A, P1 specimens: Load–displacement plot. The blue plies refer to the carbon fiber, the green is the polyester, and the red is Teflon. Results of DCB tests for group A, P2 specimens: Load–displacement plot. The blue plies refer to the carbon fiber, the green is the polyester, and the red is Teflon. Load–displacement curves for group B specimens. The blue plies refer to the carbon fiber, the green is the polyester, and the red is Teflon. Load–displacement curves for group C specimens. The blue plies refer to the carbon fiber, the green is the polyester, and the red is Teflon. Test matrix of end-notched flexure (ENF) tests. Test specimen layup, materials and dimensions summary. Test matrix of static indentation (SI) tests. Test specimen layup, materials and dimensions summary.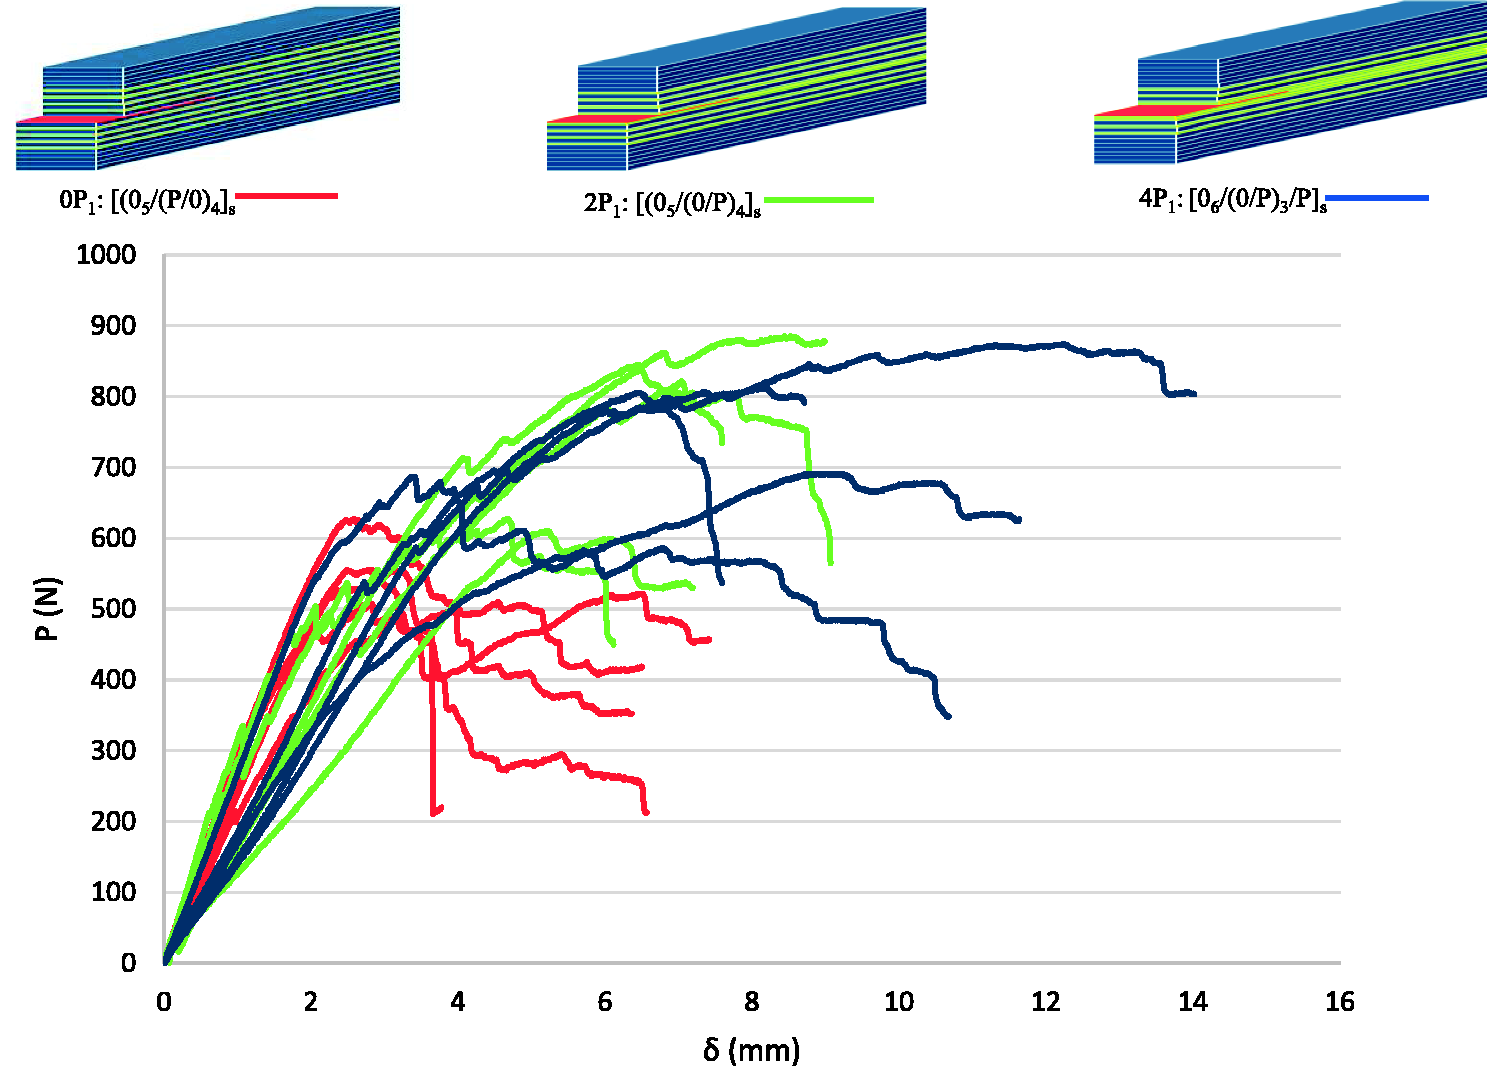
Test matrix of full penetration (FP) tests. Test specimen layup, materials and dimensions summary.
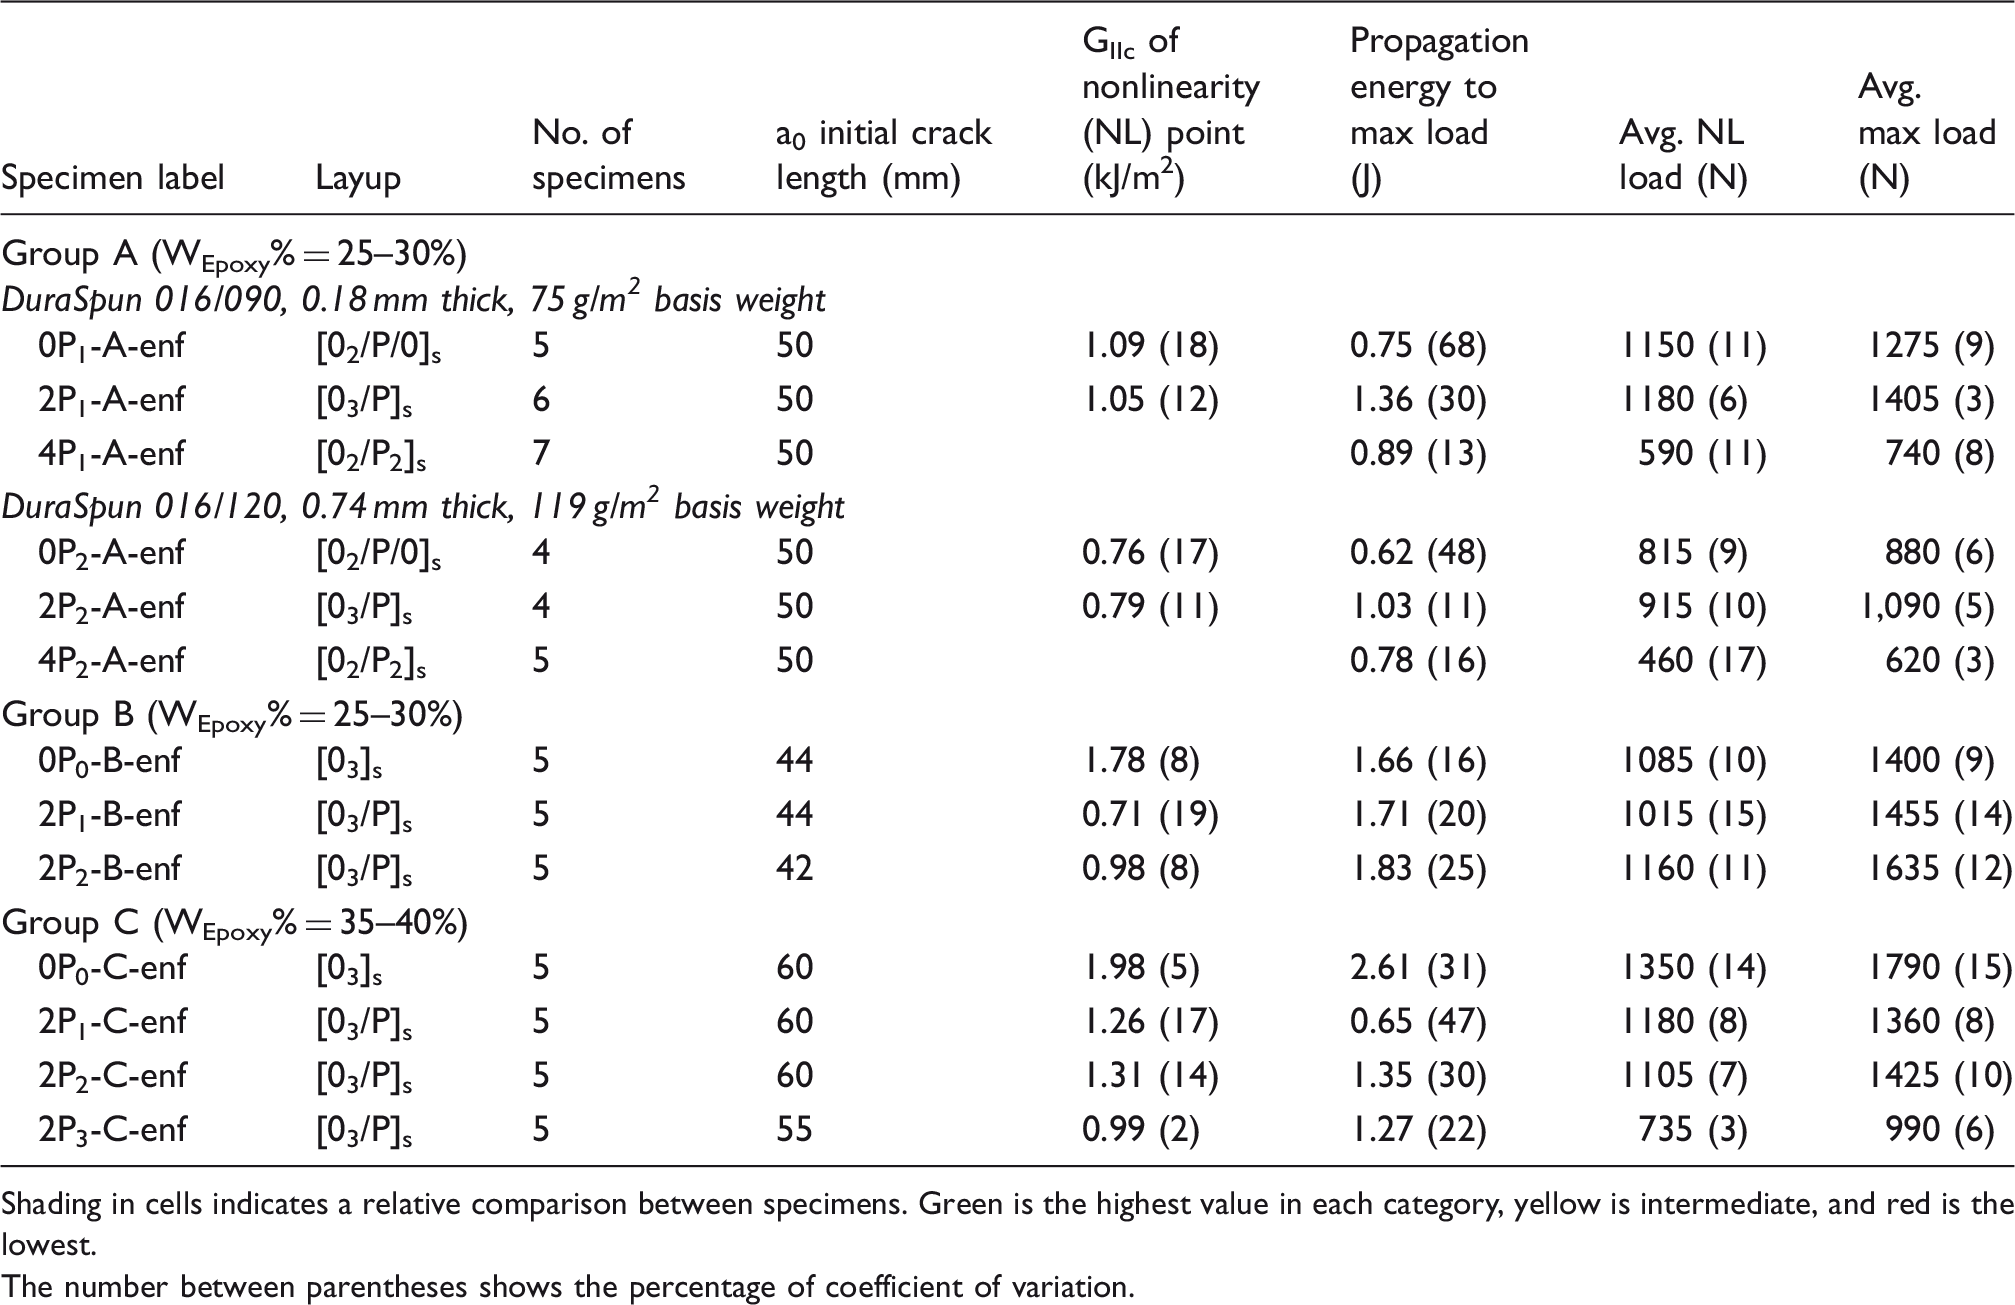
Summary of results from double cantilever beam (DCB) tests.
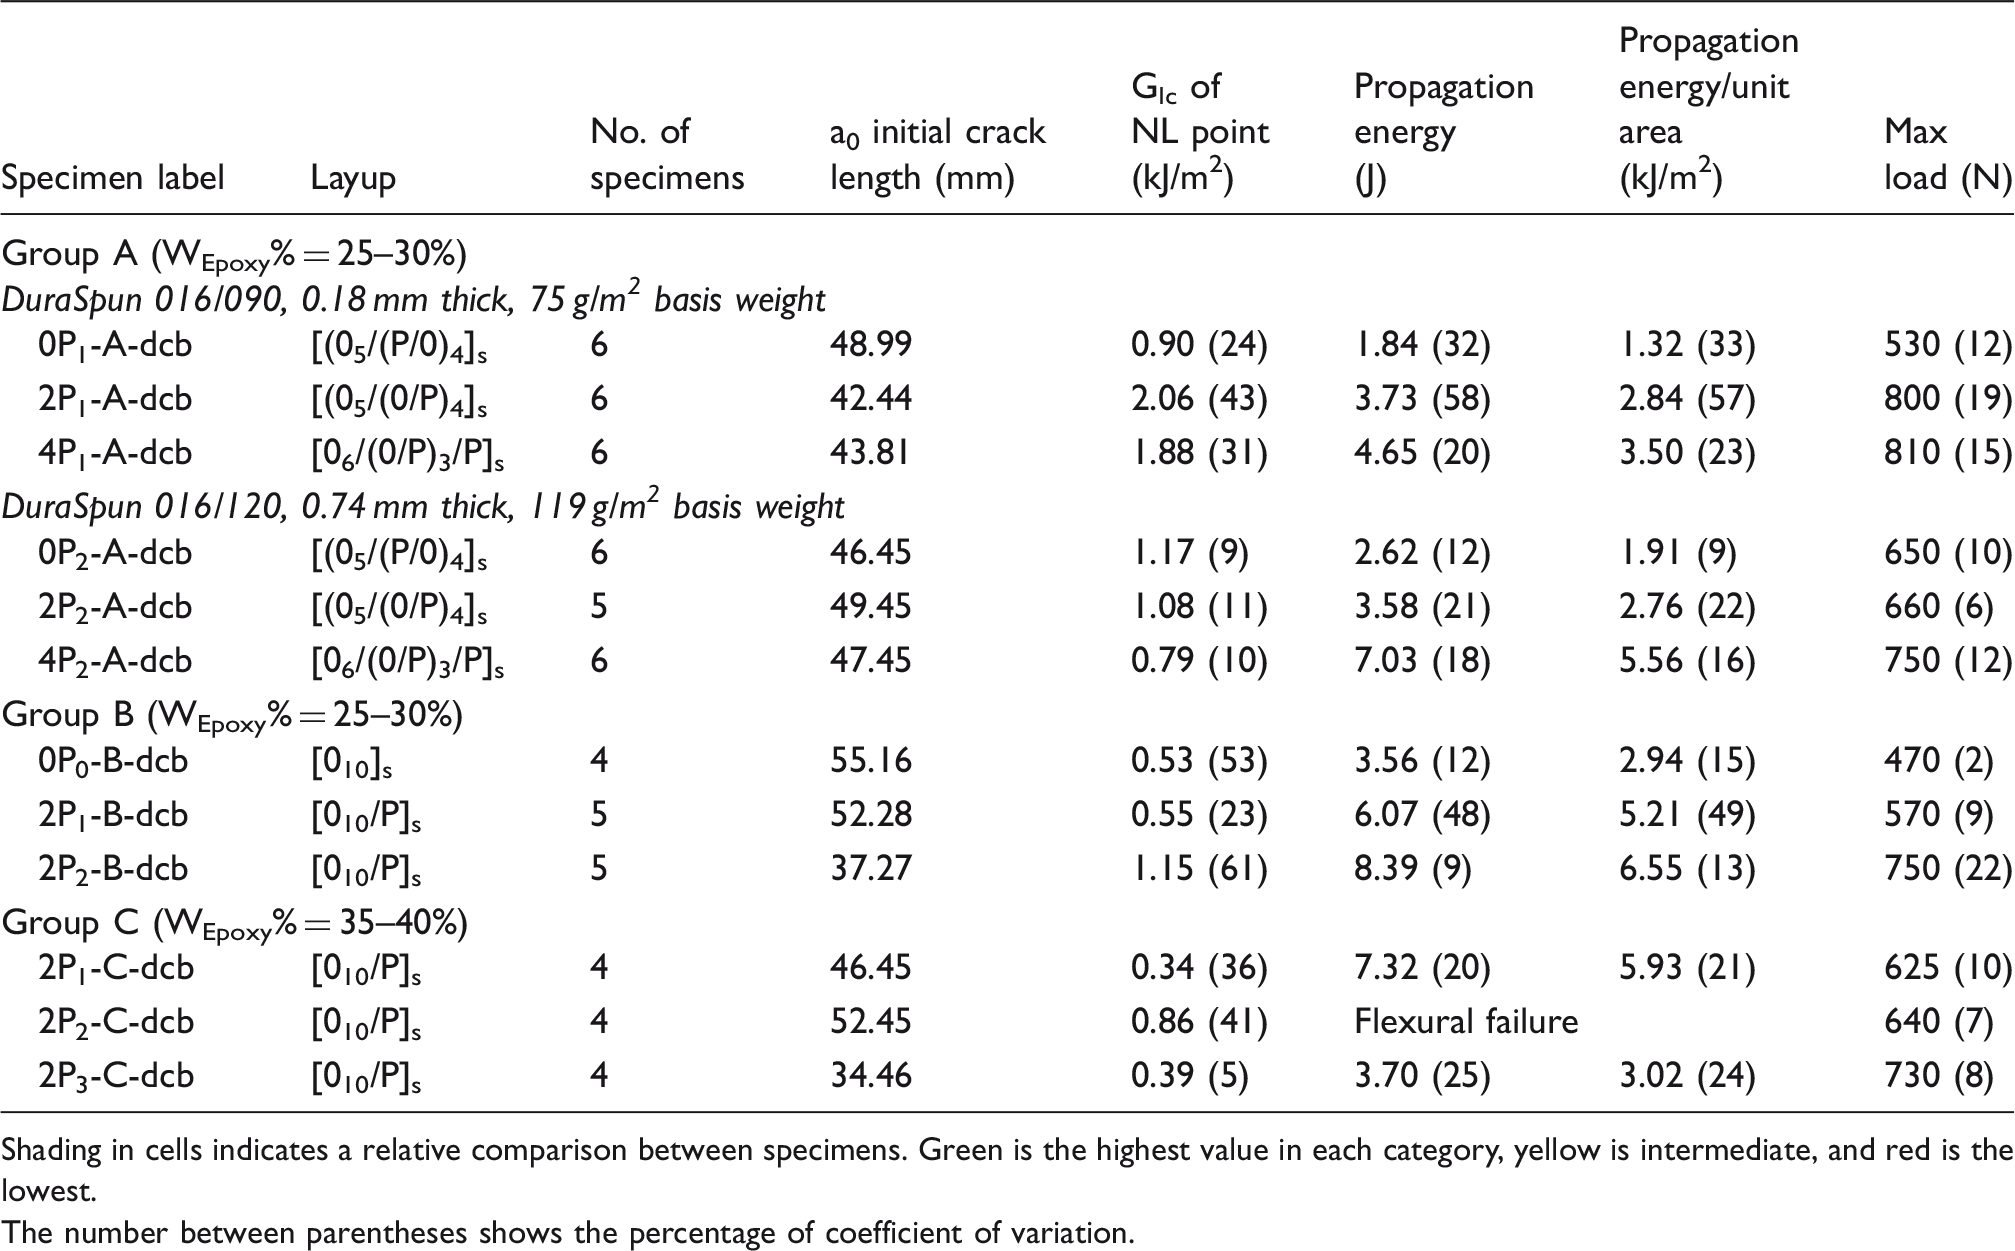
Shading in cells indicates a relative comparison between specimens. Green is the highest value in each category, yellow is intermediate, and red is the lowest.
The number between parentheses shows the percentage of coefficient of variation.
Overall, the DCB results demonstrate that the presence of the polyester interleaves improves the Mode I fracture toughness. The thicker interleaf layer shows a slight improvement over the thinner layer. Also, specimens with matrix weight fraction of 35–40% show a small improvement over the specimens with matrix weight fraction of 25–30%. There are apparent improvements in propagation facture toughness when the polyester interface is used, but these effects cannot be quantified precisely due to the difficulty measuring the crack length noted above.
4ENF testing
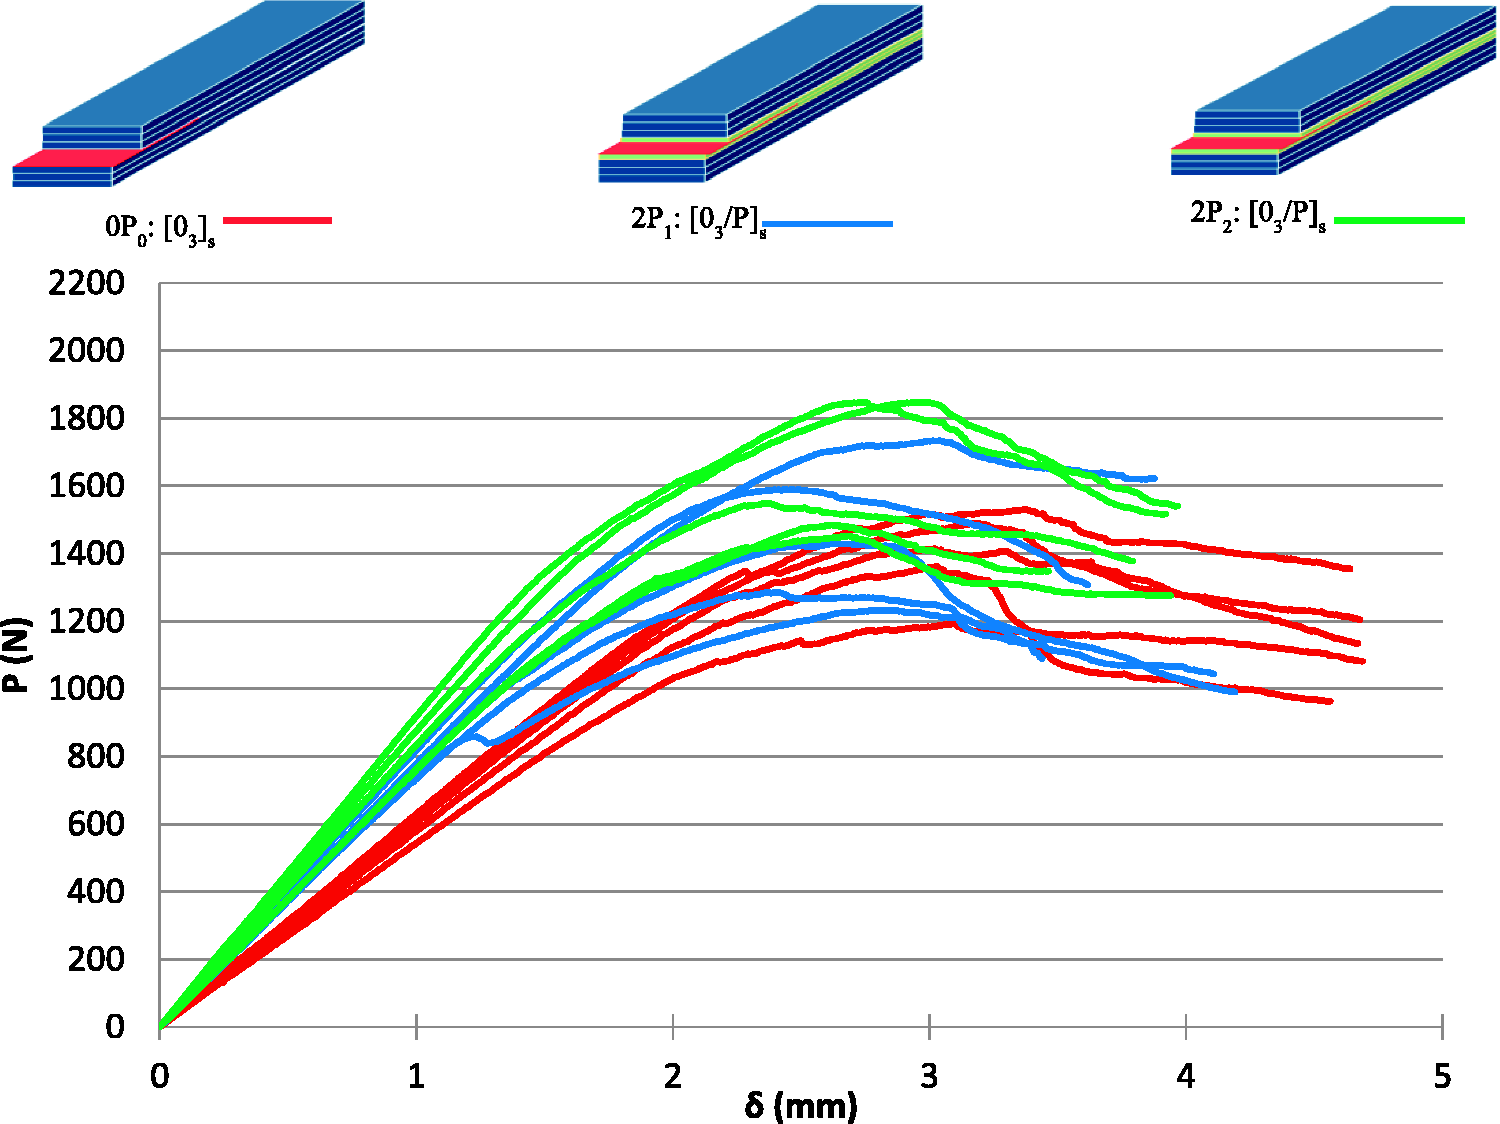
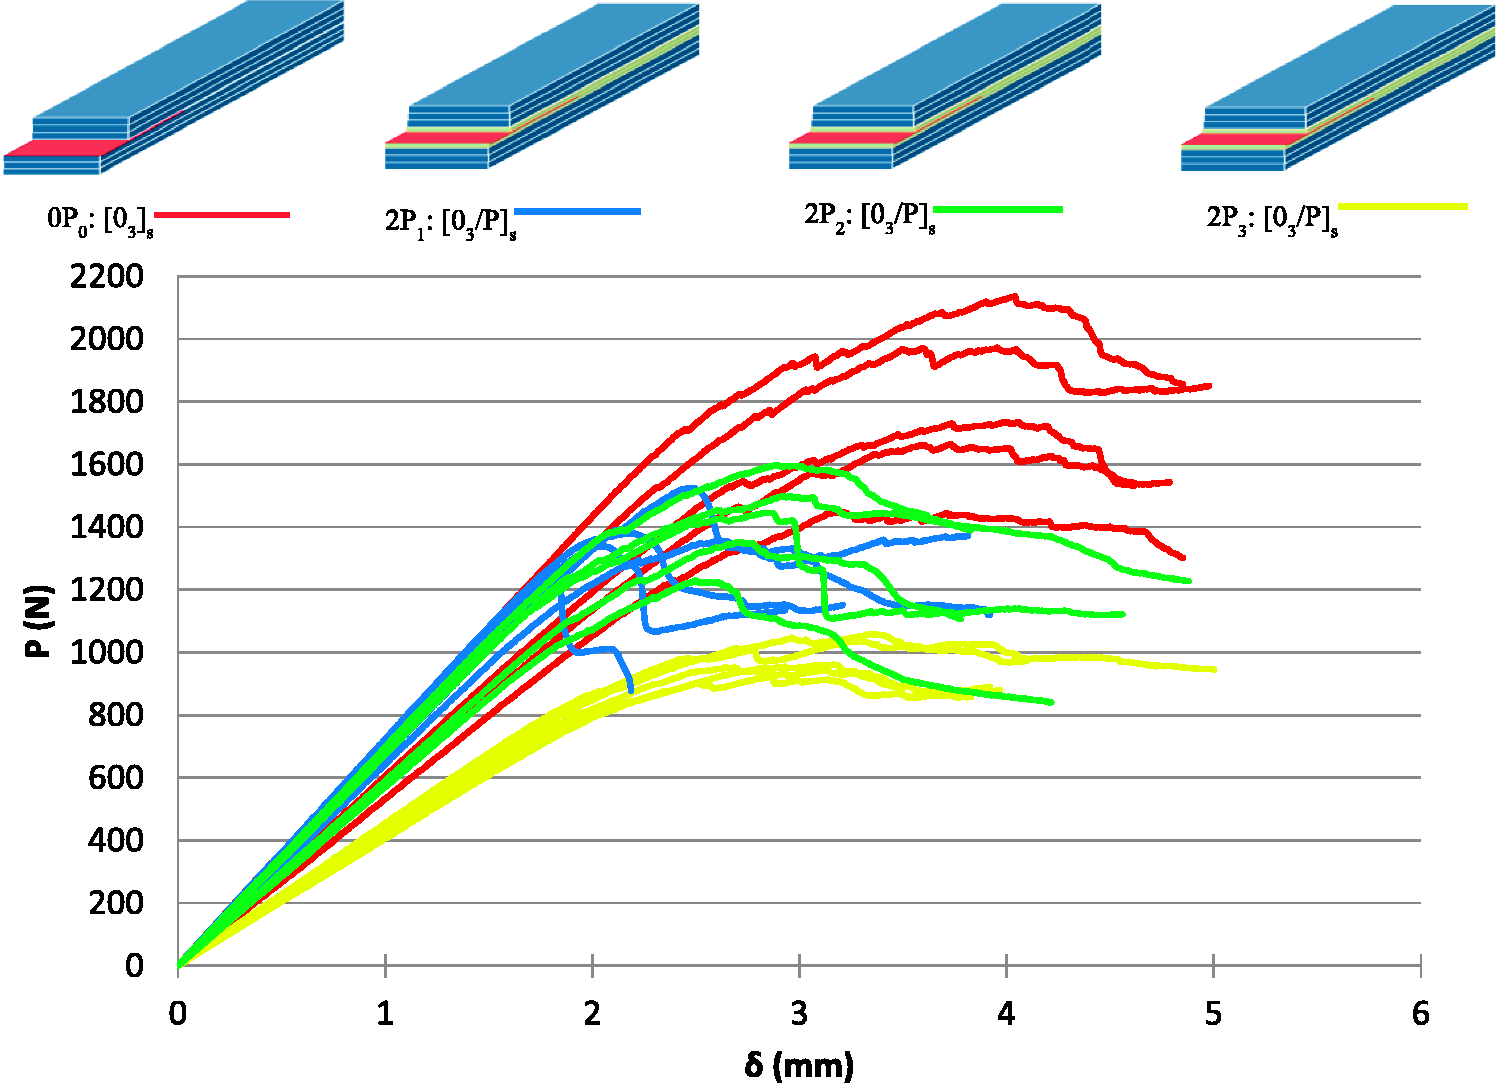
Load–displacement curves for the 4ENF specimens are shown in Figures 11 to 14. Figures 11 and 12 show results from Group A for specimens with each of the two polyester interface materials. It is evident that the specimens with the thick polyester interface 4P had a significantly reduced compliance compared with the other specimens due to its extremely thick polyester layer, resulting in poor performance. Figures 13 and 14 show results from Group B and C respectively for specimens with different type of polyester interleafs. Although it was anticipated that stable propagation would be observed in these 4ENF specimens, this was not the case. Crack propagation of only a couple of millimeters from the insert was observed before bending fracture started. The Mode II interlaminar fracture toughness GIIc can be expressed as
22
Surfaces failure types for DCB specimens: (a) adhesive failure, (b) cohesive failure, and (c) mixed failure. Results of ENF tests for Group A, P1 specimens: Load–displacement plot. The blue plies refer to the carbon fiber, the green is the polyester, and the red is Teflon. Results of ENF tests for Group A, P2 specimens: Load–displacement plot. The blue plies refer to the carbon fiber, the green is the polyester, and the red is Teflon. Load–displacement curves for group B specimens. Load–displacement curves group C specimens. The blue plies refer to the carbon fiber, the green is the polyester, and the red is Teflon. Summary of results from end-notched flexure (ENF) tests. Shading in cells indicates a relative comparison between specimens. Green is the highest value in each category, yellow is intermediate, and red is the lowest. The number between parentheses shows the percentage of coefficient of variation.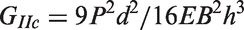
SI test
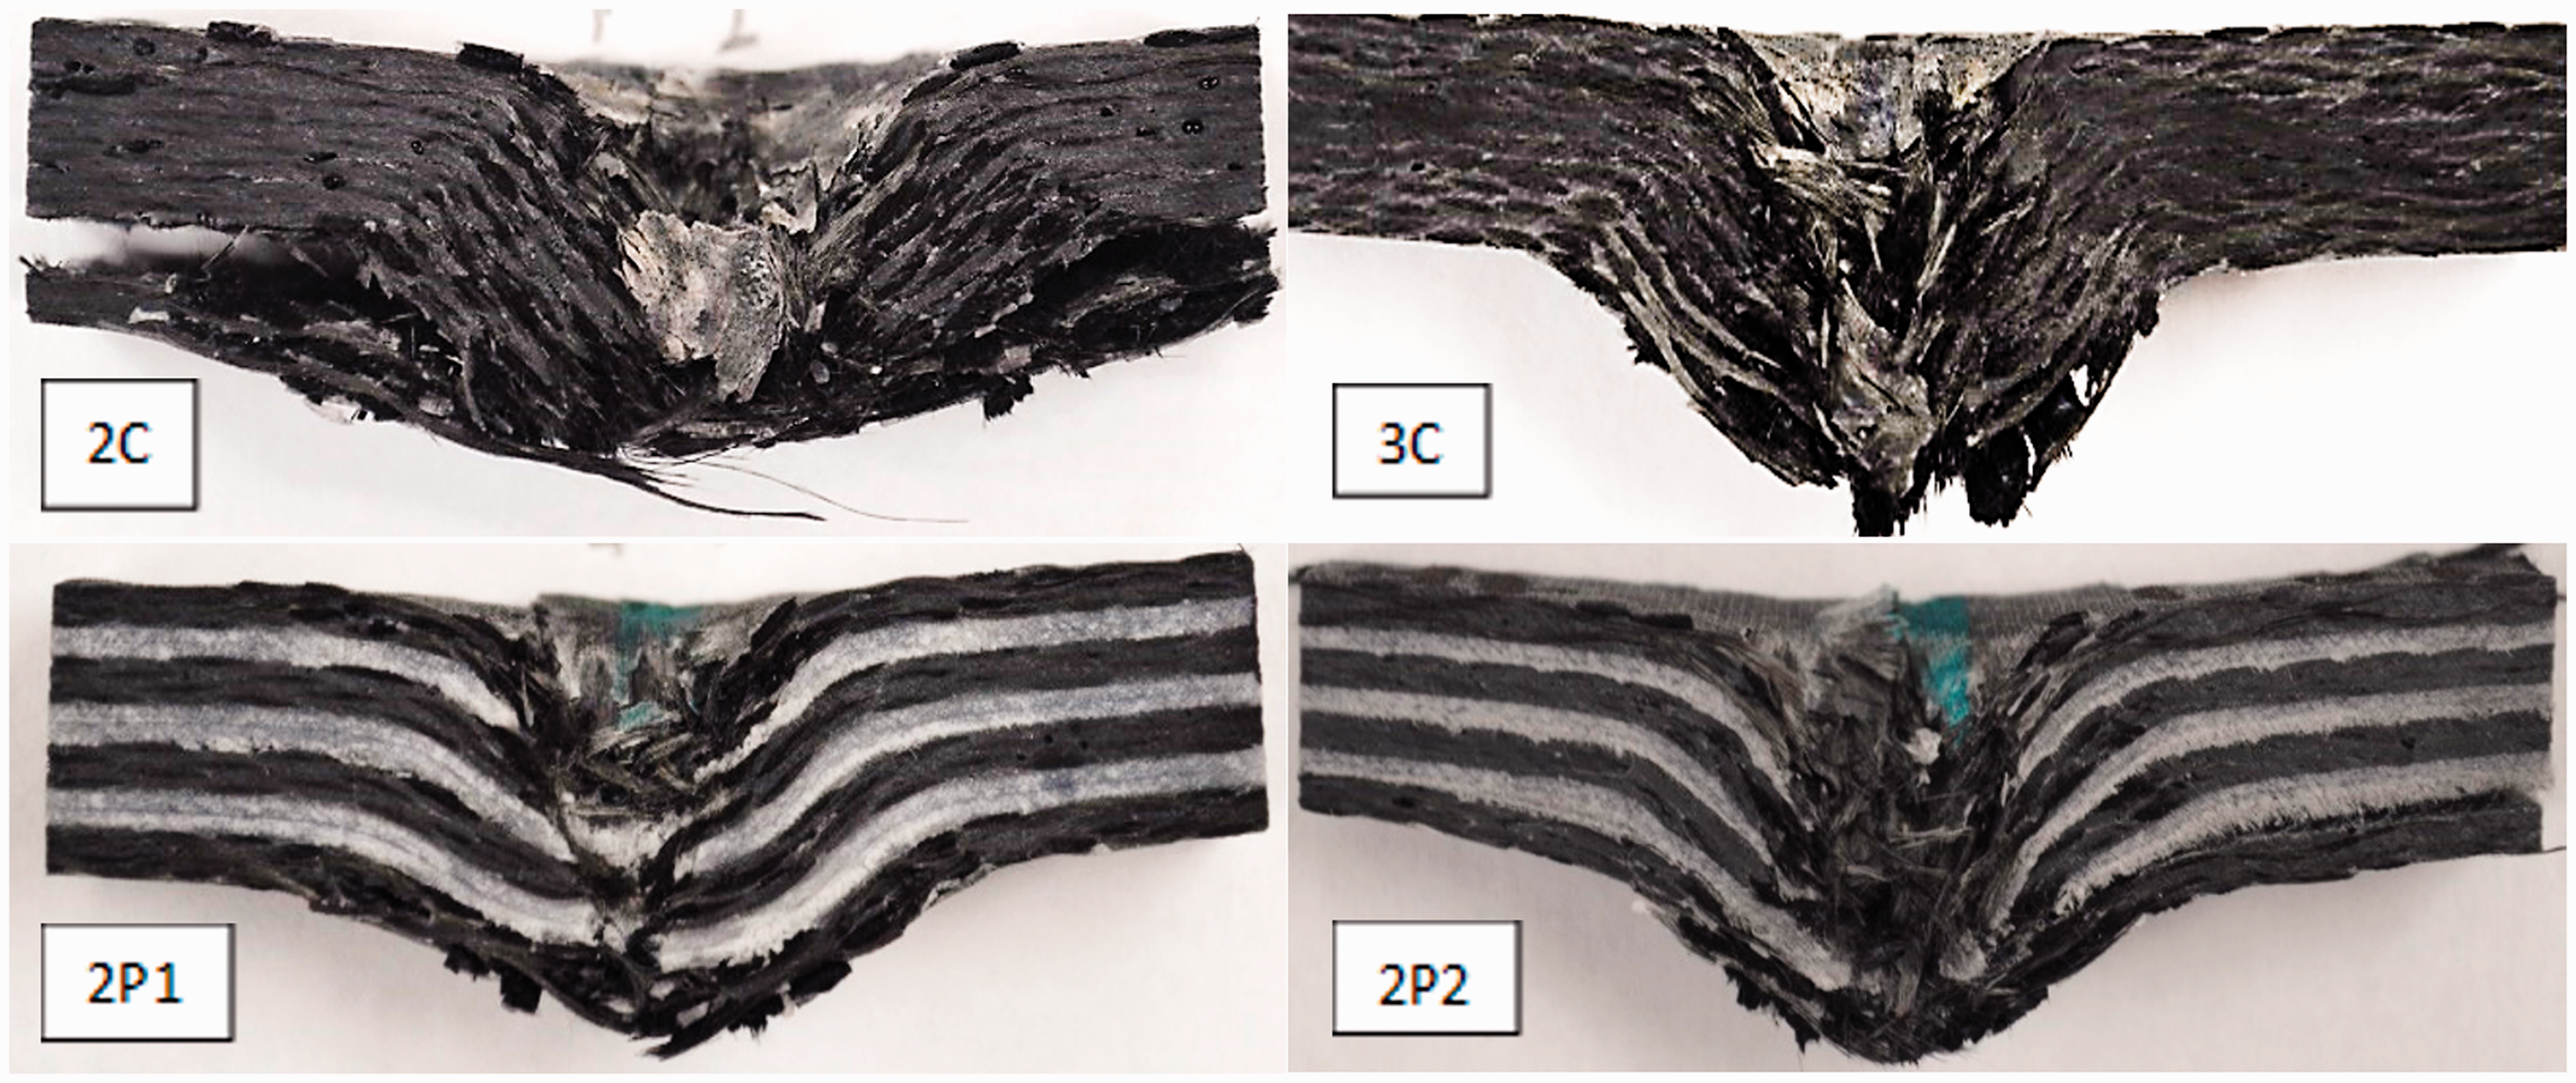
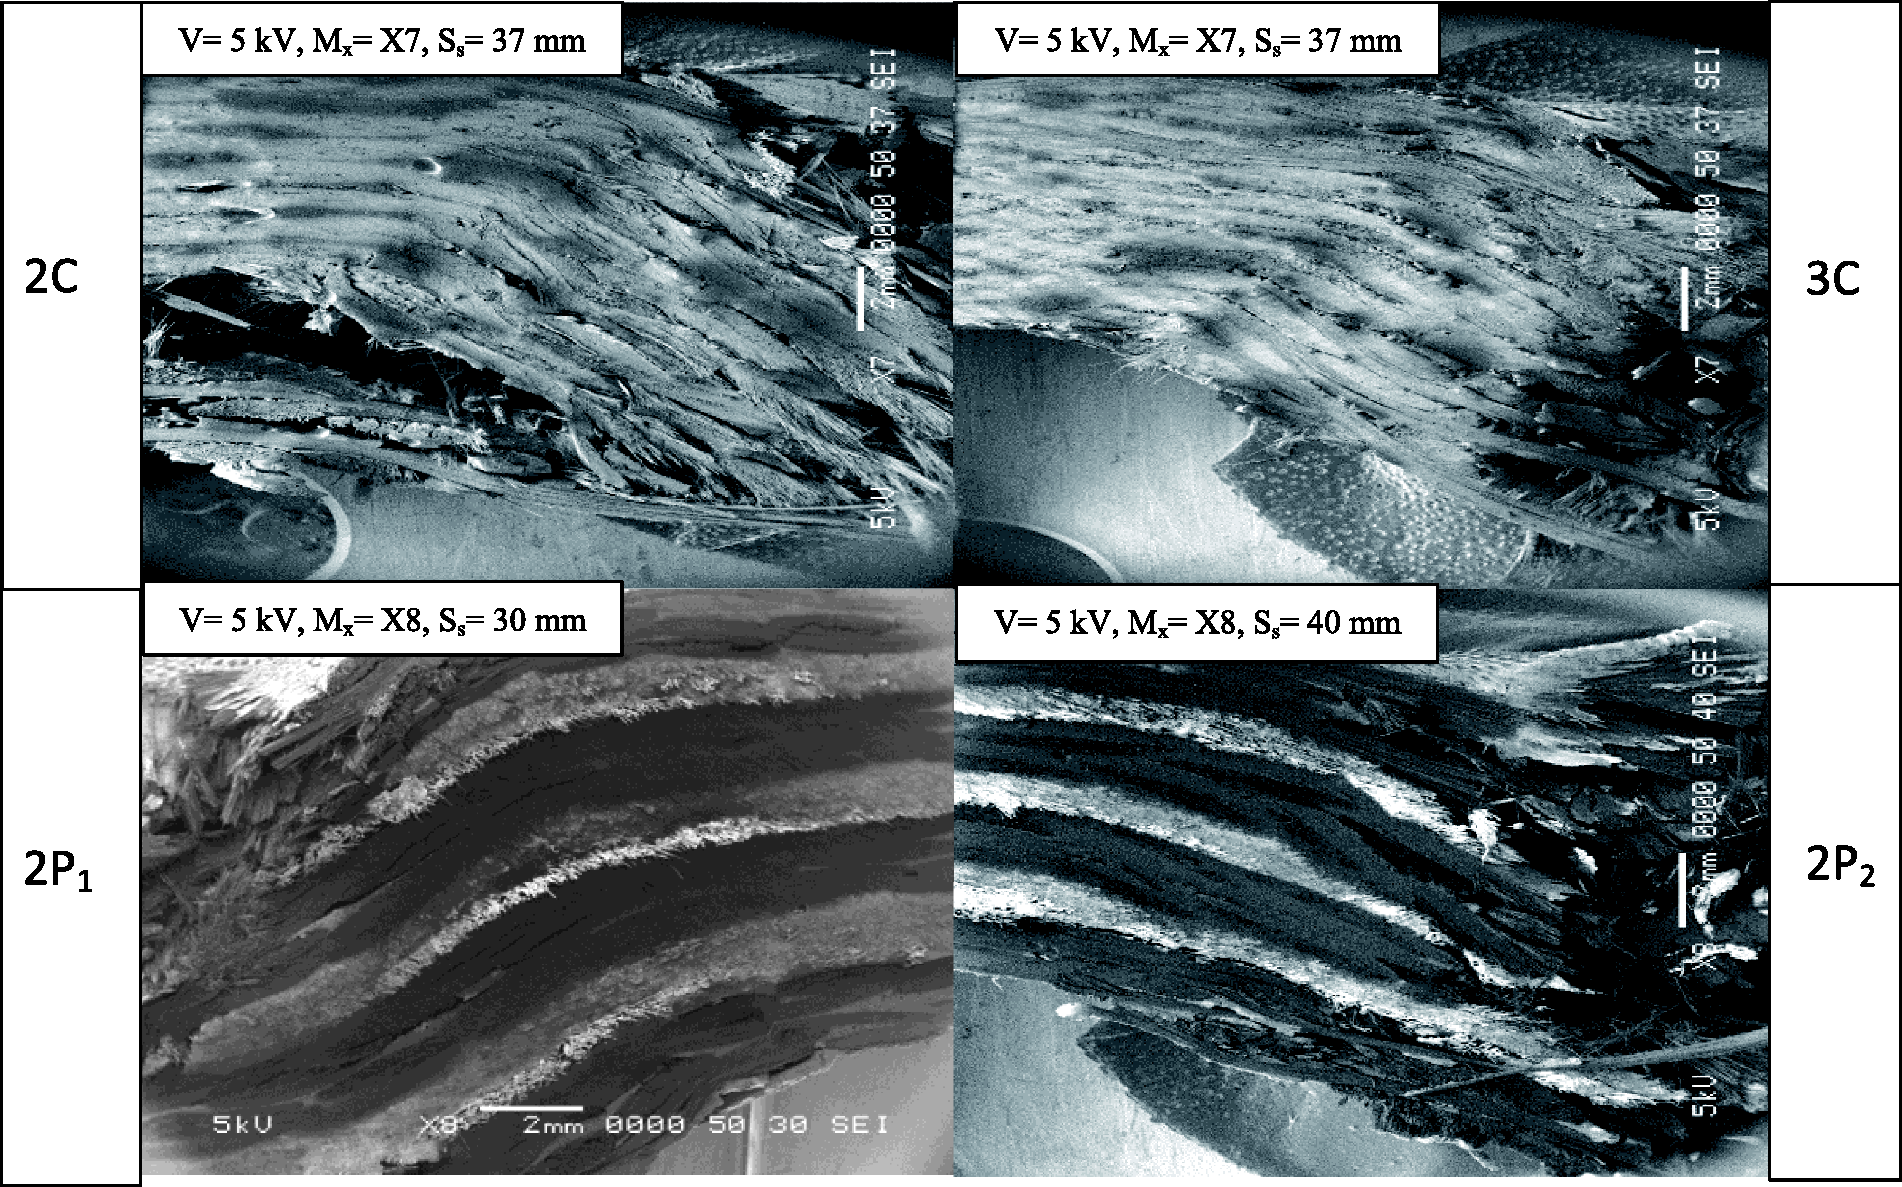
Four specimen types are compared, two control types (2C and 3C) containing no polyester interleaving and two specimen types (2P1 and 2P2) containing interleaves. Load–displacement curves for SI specimens subject to FP testing are shown in Figure 15. Table 7 presents results for several load levels: P = FP, 22 kN (5000 lb), 18 N (4000 lb), and 13 kN (3000 lb). Note that only one specimen of each type at each load level was tested. Not much difference in maximum load carried was observed between the four specimen types. The total energy under the load displacement curve up to the point of FP is reported in Table 7. Few consistent trends are observed among the specimens in Table 7, though the 2P2 specimens did show a larger displacement at each load level than the other types. Photographs of the damage at the penetration site were made by sectioning the specimens. For the FP tests, the damage states are compared in Figure 16. It is seen that the damage area is larger in some of all-graphite laminates than in those containing polyester. Large delamination and shear cracks are seen in the control specimens (2C and 3C), while the delamination is less in the interleaved specimens 2P1 and 2P2. SEM photos of these same specimens in Figure 17 show additional detail of the damage state. The lack of quantitative improvement in the specimens containing interleafs may be due to the fact that the total laminate thickness was kept constant in all specimens, thus a significant amount of graphite was ‘traded’ for polyester, reducing the strength of the laminate.
Load–displacement plots from full penetration static indentation tests. SI specimens after full penetration load. SEM for SI full penetration specimens. Where V is the voltage, Mx is the magnification, and Ss is the spot size. Summary of results from static indentation tests.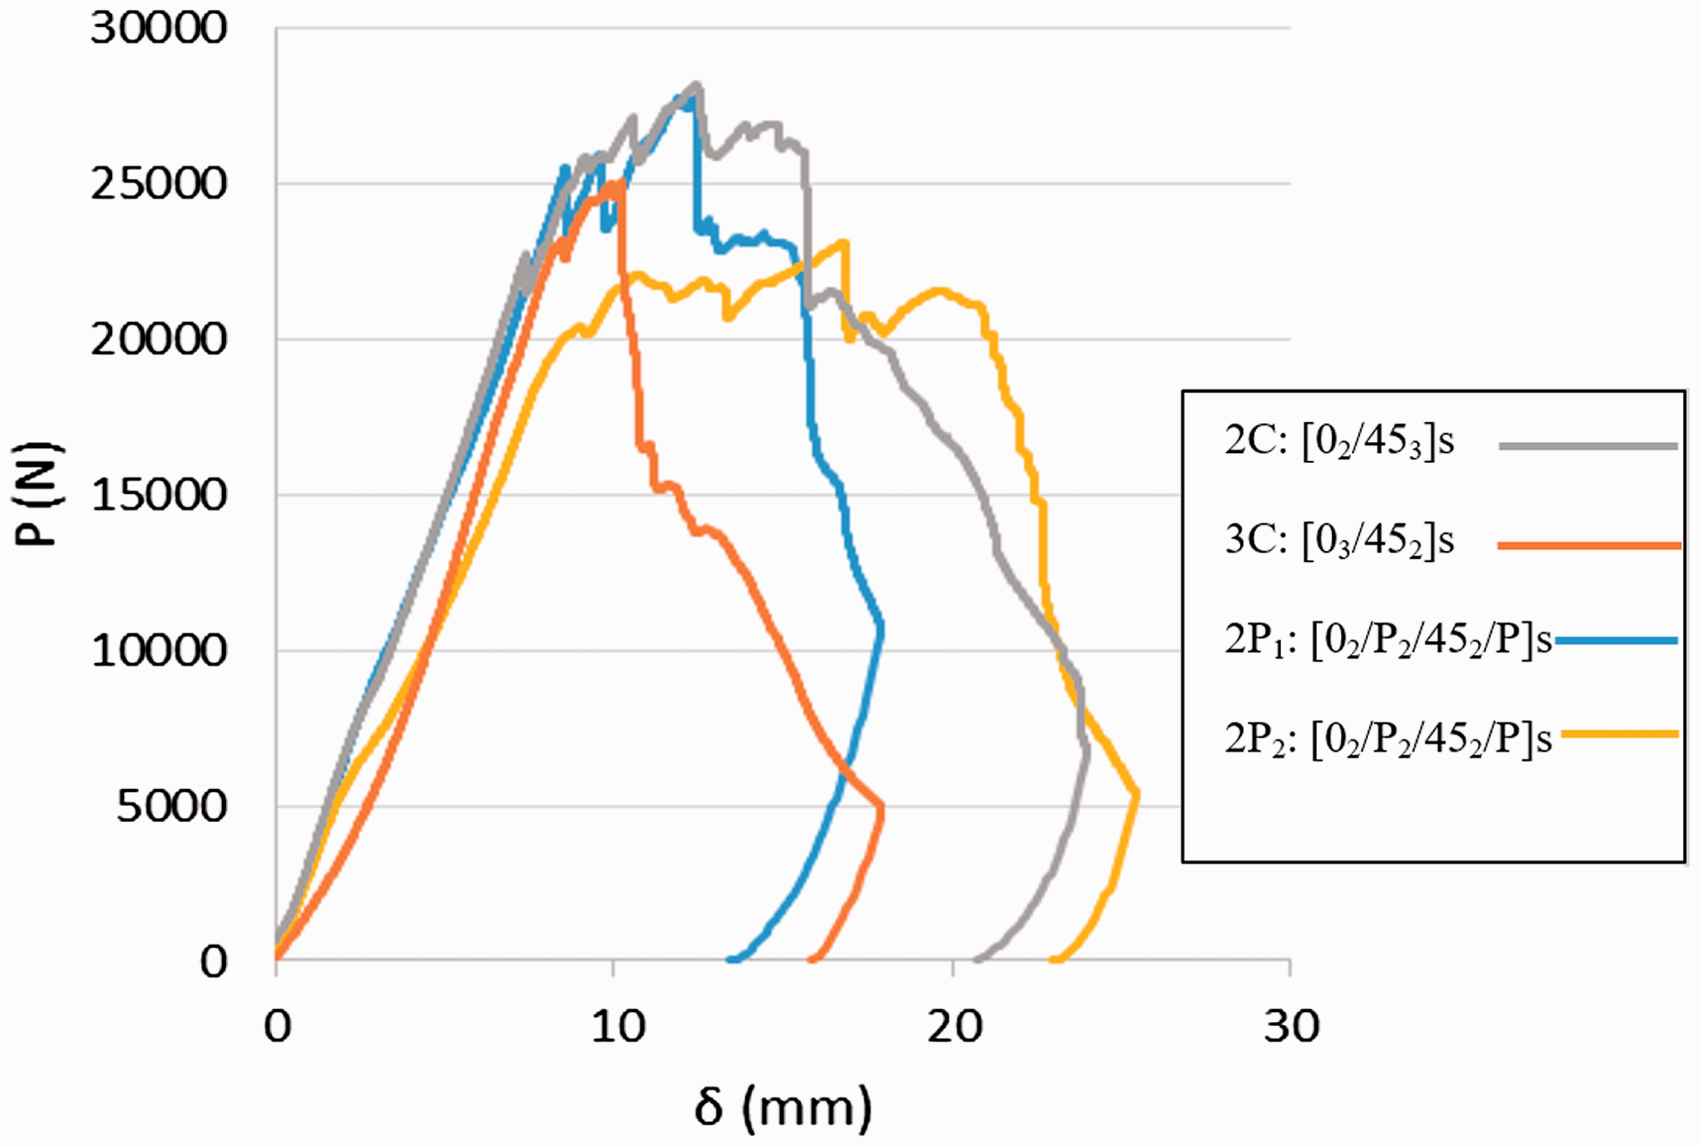
Additional understanding of the damage evolution during SI is found by inspection of sections through the load points in specimens where the load was halted prior to FP. Small cracks within the graphite plies are observed at lower load levels in the specimens containing interleaving than in the all-graphite control specimens as shown in Figures 18 and 19. Note that the vertical features seen in the center of these pictures is paint used to mark the center of the specimen.
SEM photographs for specimens loaded to 3000 lb. Red lines illustrate the location of cracks. Where V is the voltage, Mx is the magnification, and Ss is the spot size. SEM photographs for specimens loaded to 5000 lb. Blue arrows indicate larger scale damage while red lines illustrate the location of cracks. Where V is the voltage, Mx is the magnification, and Ss is the spot size.

FP impact test
Eight specimen types are compared, including two control types (0-FP and 45-FP) containing no polyester interleaving and other specimen types containing interleaves, as described in Table 4. Instrumentation on the impact test device allows the maximum load, the energy to maximum load, and total energy absorbed by impact event to be measured. The maximum load is the highest value of load during the impact. Key points are illustrated in Figure 20, which uses a sample load–energy curve from this study. The energy to maximum load is defined at the energy up to the maximum load point. The total energy is defined as the energy up to the point where the load returns to near zero. The initiation energy is defined at the energy up to the load point where the load varies from the linearity. The impact velocity (V), maximum load (Pmax), energy to maximum load (Epmax), and total energy (Etotal) can be found in Table 8.
Sample load–energy curve. Summary of average results from full penetration impact tests. Shading in cells indicates a relative comparison between specimens. Green is the highest value in each category, yellow is intermediate, and red is the lowest. Results for specimens 0P2-FP have been lost due to incorrect position for optical sensor device.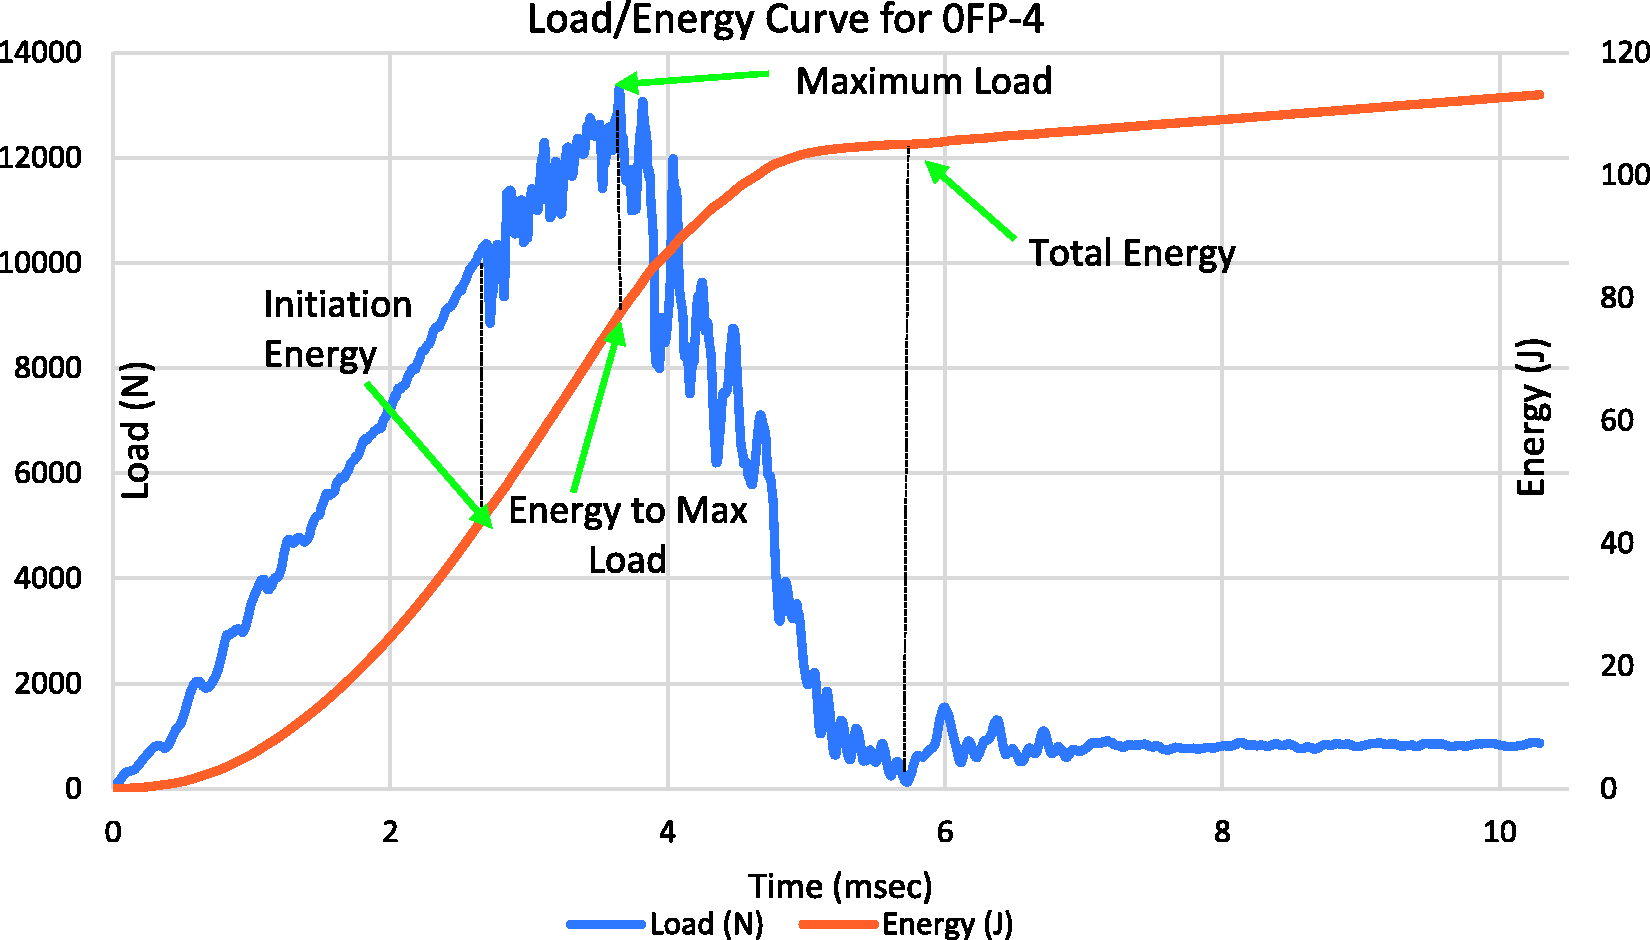
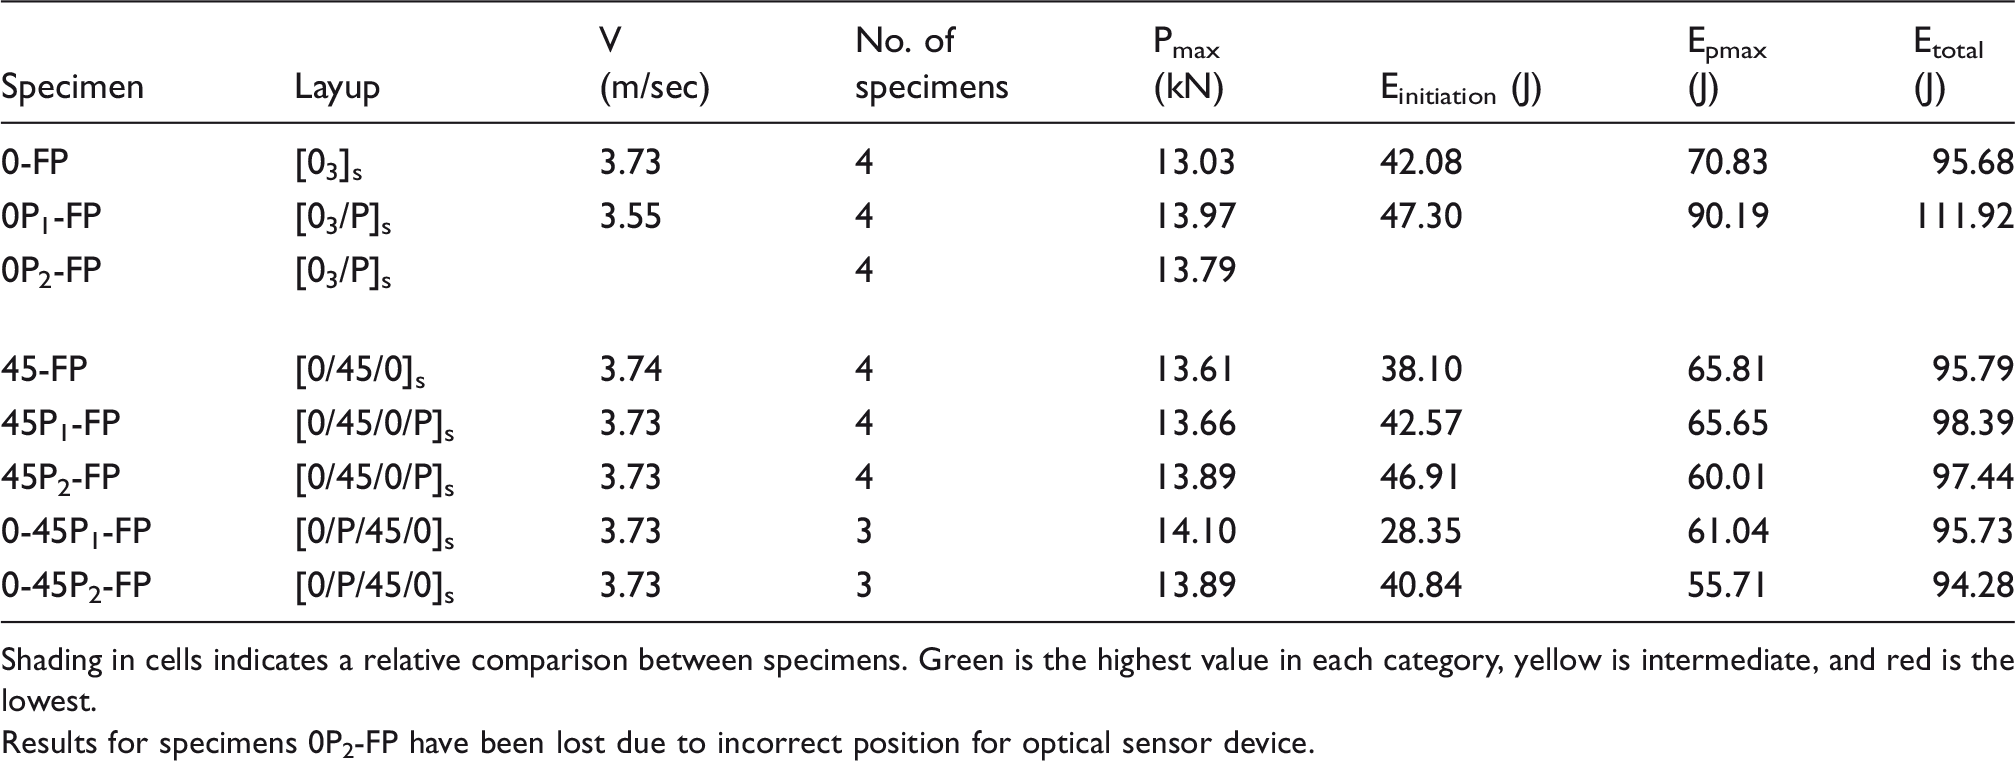
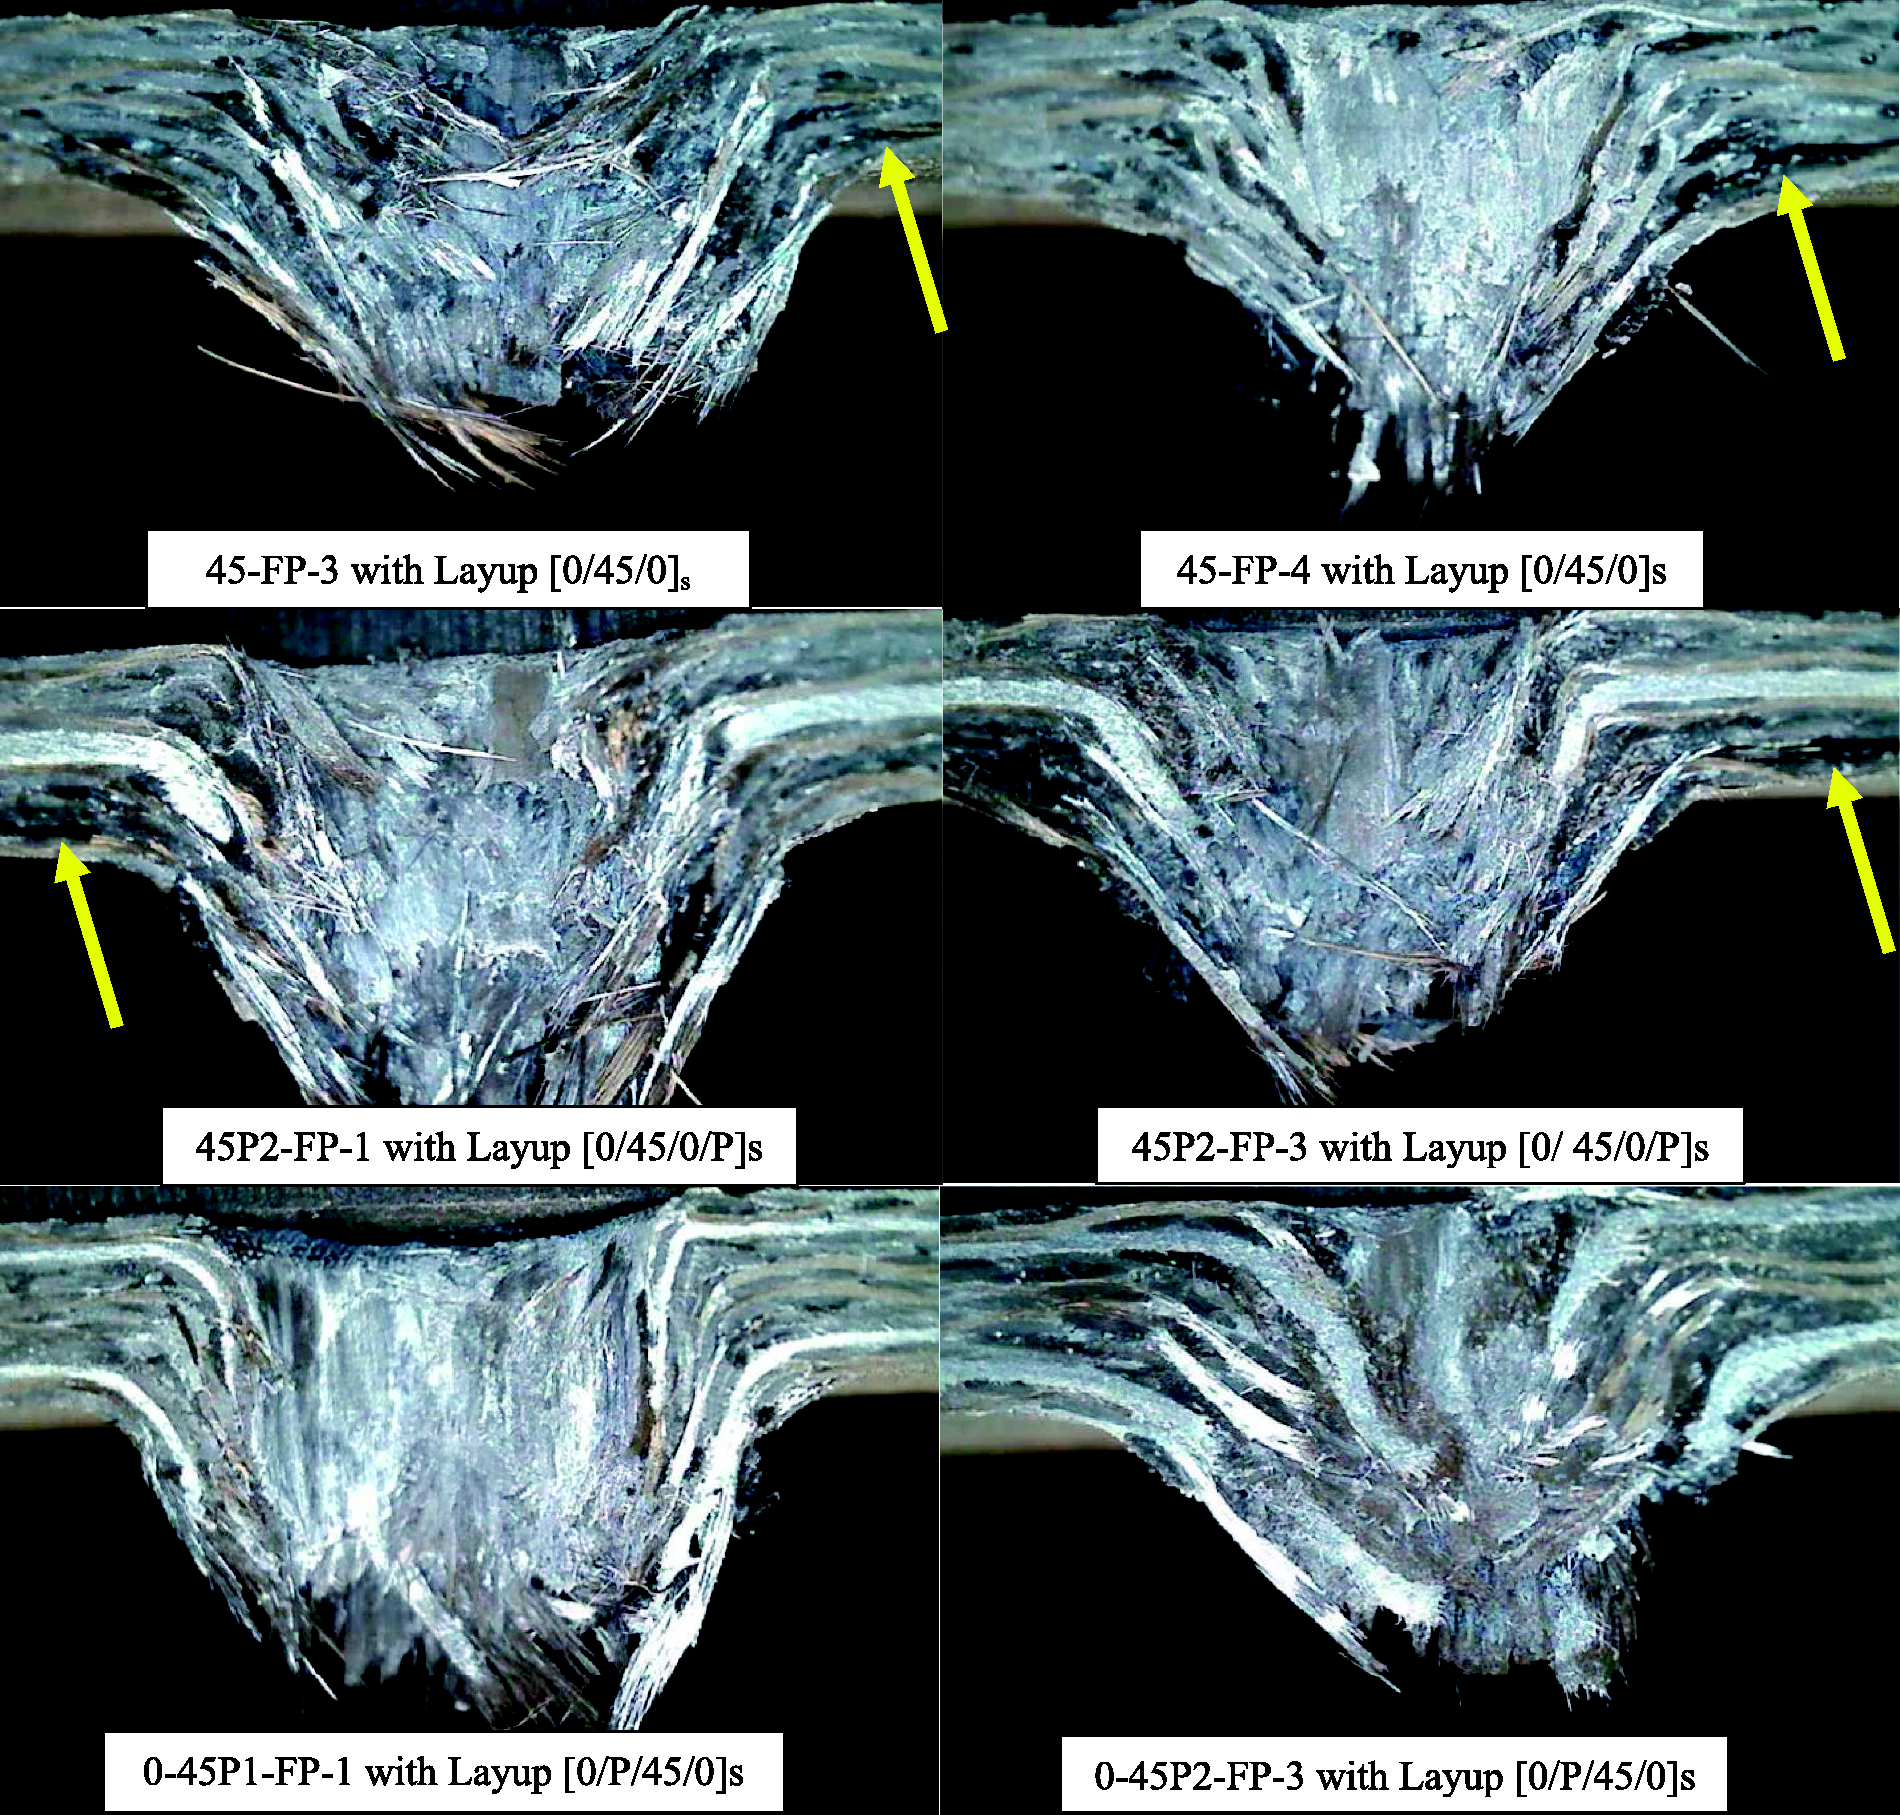
Damage is somewhat more compact near interleaving layers as seen in Figures 21 and 22. Large delaminations are seen on the tensile side of some control specimens. Similar delamination appears at the 45/0 ply interface in specimens where there was no polyester in this location on the tensile side, such as 45-FP and 45P2-FP specimens. With the polyester veil in more optimal places, such as specimens 0-45P1-FP and 0-45P2-FP, there is no evidence of delamination growth (Figure 22 bottom). While the damage observed in the FP impact tests shows a direct influence of the presence of interleaf materials, the trends in the quantitative data in Table 8 are somewhat ambiguous. The initiation energy is higher (up to 23%) for most specimen geometries containing interleafs as compared to their respective control specimens. Total absorbed energy, however, is relatively constant between control and interleaf specimen types except for one specimen geometry. This may be because there was little tendency toward delamination growth even in the control laminates, and as such little room for improvement due to the addition of interleaving layers.
USB microscope photographs of specimens with polyester and without polyester (first left). USB microscope photographs. Yellow arrows showing delamination in 45/0 ply. And showing no delamination growth where the polyester in optimal places for specimens 0-45P1-FP and 0-45P2-FP.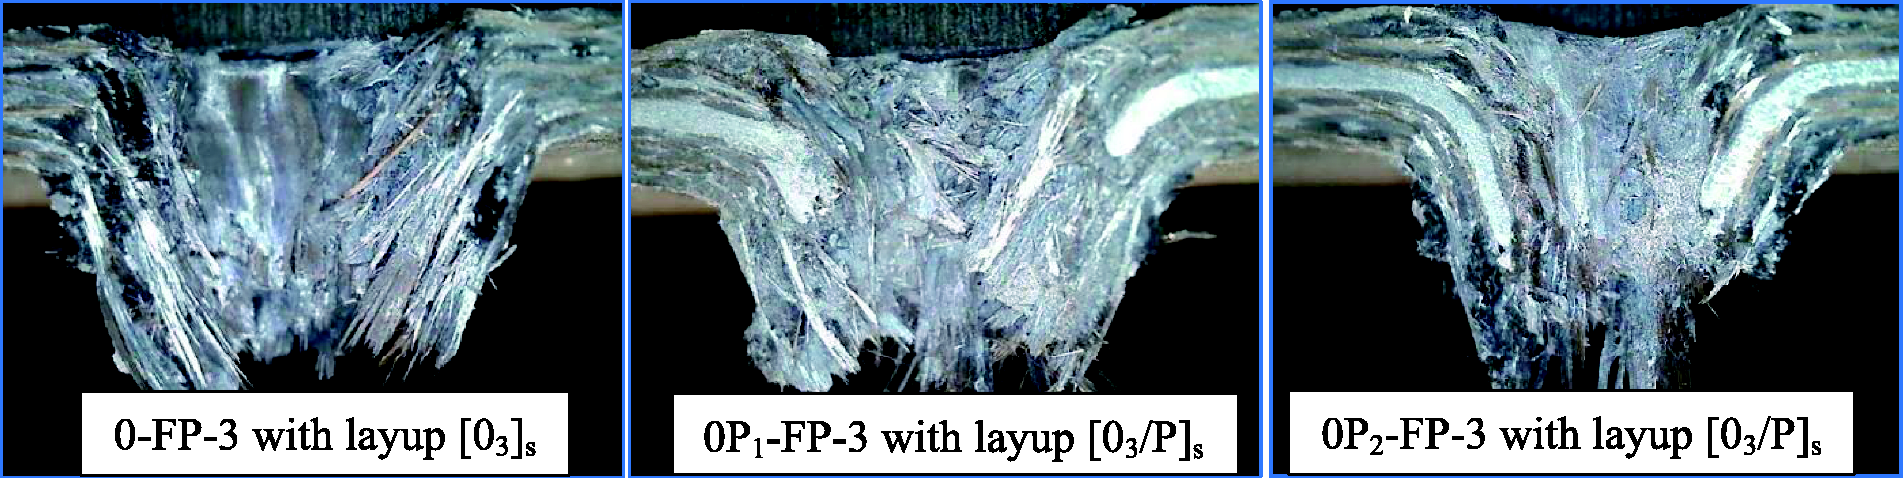
Conclusion
Tests demonstrate some improvements from using polyester as an interleaving material. The DCB tests show that the polyester interleaf materials significantly improve Mode I interlaminar fracture toughness and increases the energy absorbed during propagation. Using a thicker polyester interleaf at the central interface, either by using multiple layers or by using the thickest polyester materials within the range of conditions studied, results in a significant improvement over the thinner interleafs. Introduction of polyester interleaves into carbon fiber laminate for ENF test produced a slight improvement in energy absorbed during propagation. Specimens using an excessively thick interleaf layer suffered from excessive shear compliance that negatively influenced Mode II behavior. The SI tests demonstrate significant changes in the morphology of the damage region resulting from the presence of interleafs. At FP, the damage area is larger and more catastrophic in the control specimens than in specimens containing polyester interleaves. The FP impact tests show in all cases that the damage is highly localized around the tup. Some specimens showed delamination on tension side, which is reduced for specimens that contain interleaf material in that region. Improvements in the initiation energy were seen to result from the presence of interleaf material in FP tests, though total absorbed energy was not significantly affected.
Footnotes
Authors’ note
Based on a paper presented at SAMPE Seattle, with substantial additions and revisions (Gheryani, A., Fleming, D., and Reichard, R., “Nonwoven Polyester Interleaving for Toughness Enhancement in Composites,” SAMPE Seattle 2017, Proceedings of the 2017 SAMPE Conference, 22–25 May 2017, Seattle, WA).
Declaration of Conflicting Interests
The author(s) declared no potential conflicts of interest with respect to the research, authorship, and/or publication of this article.
Funding
The author(s) received no financial support for the research, authorship, and/or publication of this article.