






Abstract
In situ synchrotron radiation computed tomography (SRCT) was used to compare the fibre damage progression in five configurations of (902/02)s carbon-epoxy coupons loaded to failure. The effects of different sizing types, surface treatments and fibre diameters on the macroscopic properties, for example, ultimate tensile strength (UTS), and on the damage accumulation at a microscopic scale, for example, fibre break accumulation, were assessed. A semi-automated approach was adopted to process the large amount of data obtained from the SRCT scans and further method applicability areas can be envisaged. Single fibre break accumulation was seen to be influenced by the fibre type, while the formation of interacting fibre break groups by the surface treatment and the sizing type. For the materials presented, it can be suggested that an increased defect tolerance can be obtained by moving from stronger to weaker fibre-matrix adhesion, with sub-critical multiplet behaviour emerging as independent of the average UTS value.
Keywords
Introduction
Accurate prediction of failure behaviour in composite laminates remains a topic of ongoing research. 1 Tensile failure of longitudinal unidirectional (UD) layers often represents the limiting factor in the ultimate tensile strength (UTS) of multi-layered composites, and has been widely discussed within the literature. 2
Analytical, statistical and finite element (FE) models are reported3–12 that often use the concept of a localised critical damage site controlling final catastrophic failure.
Such a site is believed to be formed by a number of neighbouring fibres failing as a mechanically coupled group, guided primarily by the distribution of strength of the individual fibres and the stress concentration that occurs around broken fibres.
When studying the tensile failure of unidirectional composites, the strength of the fibres is recognised to have a stochastic distribution, related to the presence of flaws, as first identified by Griffith in the early 1920s. 13 Many studies have focused on the characterisation of the fibre strength, using different approaches mainly based on the Weibull strength distribution.14,15
The second key parameter in studying the longitudinal tensile failure of composites is the stress concentration around fibre breaks. When a fibre breaks, load is transferred onto the surrounding fibres, eventually leading to the formation of groups of interacting fibre breaks (multiplets). Failure is presumed to occur by a critical multiplet (cluster) acting as a crack unstably propagating and causing the failure of the component.1,2,16 When a fibre breaks, the matrix is primarily loaded in shear and transfers the stress back onto the fibre.3,17,18 The ineffective length is defined as the length over which the fibre carries a reduced stress either side of the break, and models exist in the literature to evaluate this length, such as Cox’s shear-lag model. 19 Many modelling strategies have been proposed: whilst some have considered fibre failure to be an essentially static problem, others have considered time-dependant aspects both in terms of (a) viscoelastic matrix behaviour,20–22 and (b) the dynamics of the fibre break.23,24
Previous synchrotron radiation computed tomography (SRCT) studies have adopted in situ testing to quantify the fibre failure progression in carbon fibre reinforced polymers (CFRPs),16,25,26 showing that the total number of breaks observed can be approximated by a power-law relationship and a significant numbers of interacting fibre breaks (multiplets) are associated with high stress levels, close to final failure of the coupons. Such experimental results have been compared to the model predictions and highlighted how the models commonly overestimate the stresses at which multiplets form,1,25 even when the effects of the dynamic stress concentrations are considered. 23 This emphasises the difficulties in predicting multiplet formation. Planar multiplets were seen to ‘pop-in’ and not increase in number of fibre fractures involved for higher stresses, 25 and this is shown up to 99.9% ultimate tensile strength (UTS) in. 26
In the current study, fibre break accumulation activity in different cross-ply prepreg laminate configurations has been explored, with the fibres being subjected to two surface treatment types and two sizing types, providing different levels of adhesion to the same matrix system. Differences in break accumulation between two different diameter fibres are also presented. A semi-automated approach is adopted to isolate specific regions of the coupons and to analyse within those the damage progression from low to high strains. The variation in fibre break accumulation within and between different coupons cut from the same composite laminate is also investigated. The differences among the tested materials are presented in terms of macroscopic (average UTS) and microscopic properties, with particular focus on the diffuse and planar multiplets; features that are closely related to the final failure events.
The significance of the planar multiplets with regard to tensile failure is not completely clear to the research community engaged in modelling fibre fracture and tensile strength, as represented in the published literature on the subject. While it is understood that single-fibre breaks are unlikely to be the controlling damage mechanism for tensile strength,1,2,27 it is contended that models for tensile strength, which explicitly include fibre failure should be able to predict the formation of singlets as well as the more important multiplets. The available model predictions of single fibre breaks, both individual and grouped, all show significant discrepancies from the experimental data. The present work is an original attempt to understand whether there are additional microstructural factors that should be considered to improve the modelling capability.
Materials and experimental procedure
Materials
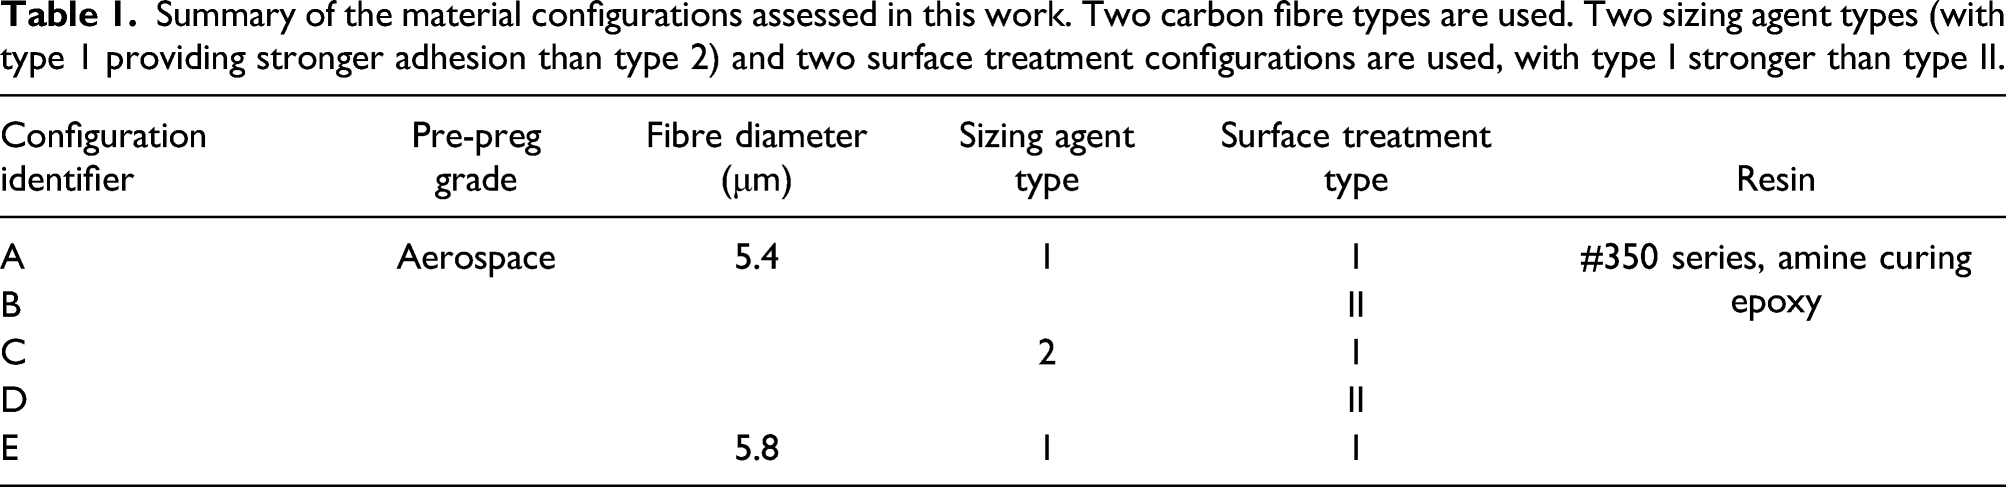
Summary of the material configurations assessed in this work. Two carbon fibre types are used. Two sizing agent types (with type 1 providing stronger adhesion than type 2) and two surface treatment configurations are used, with type I stronger than type II.
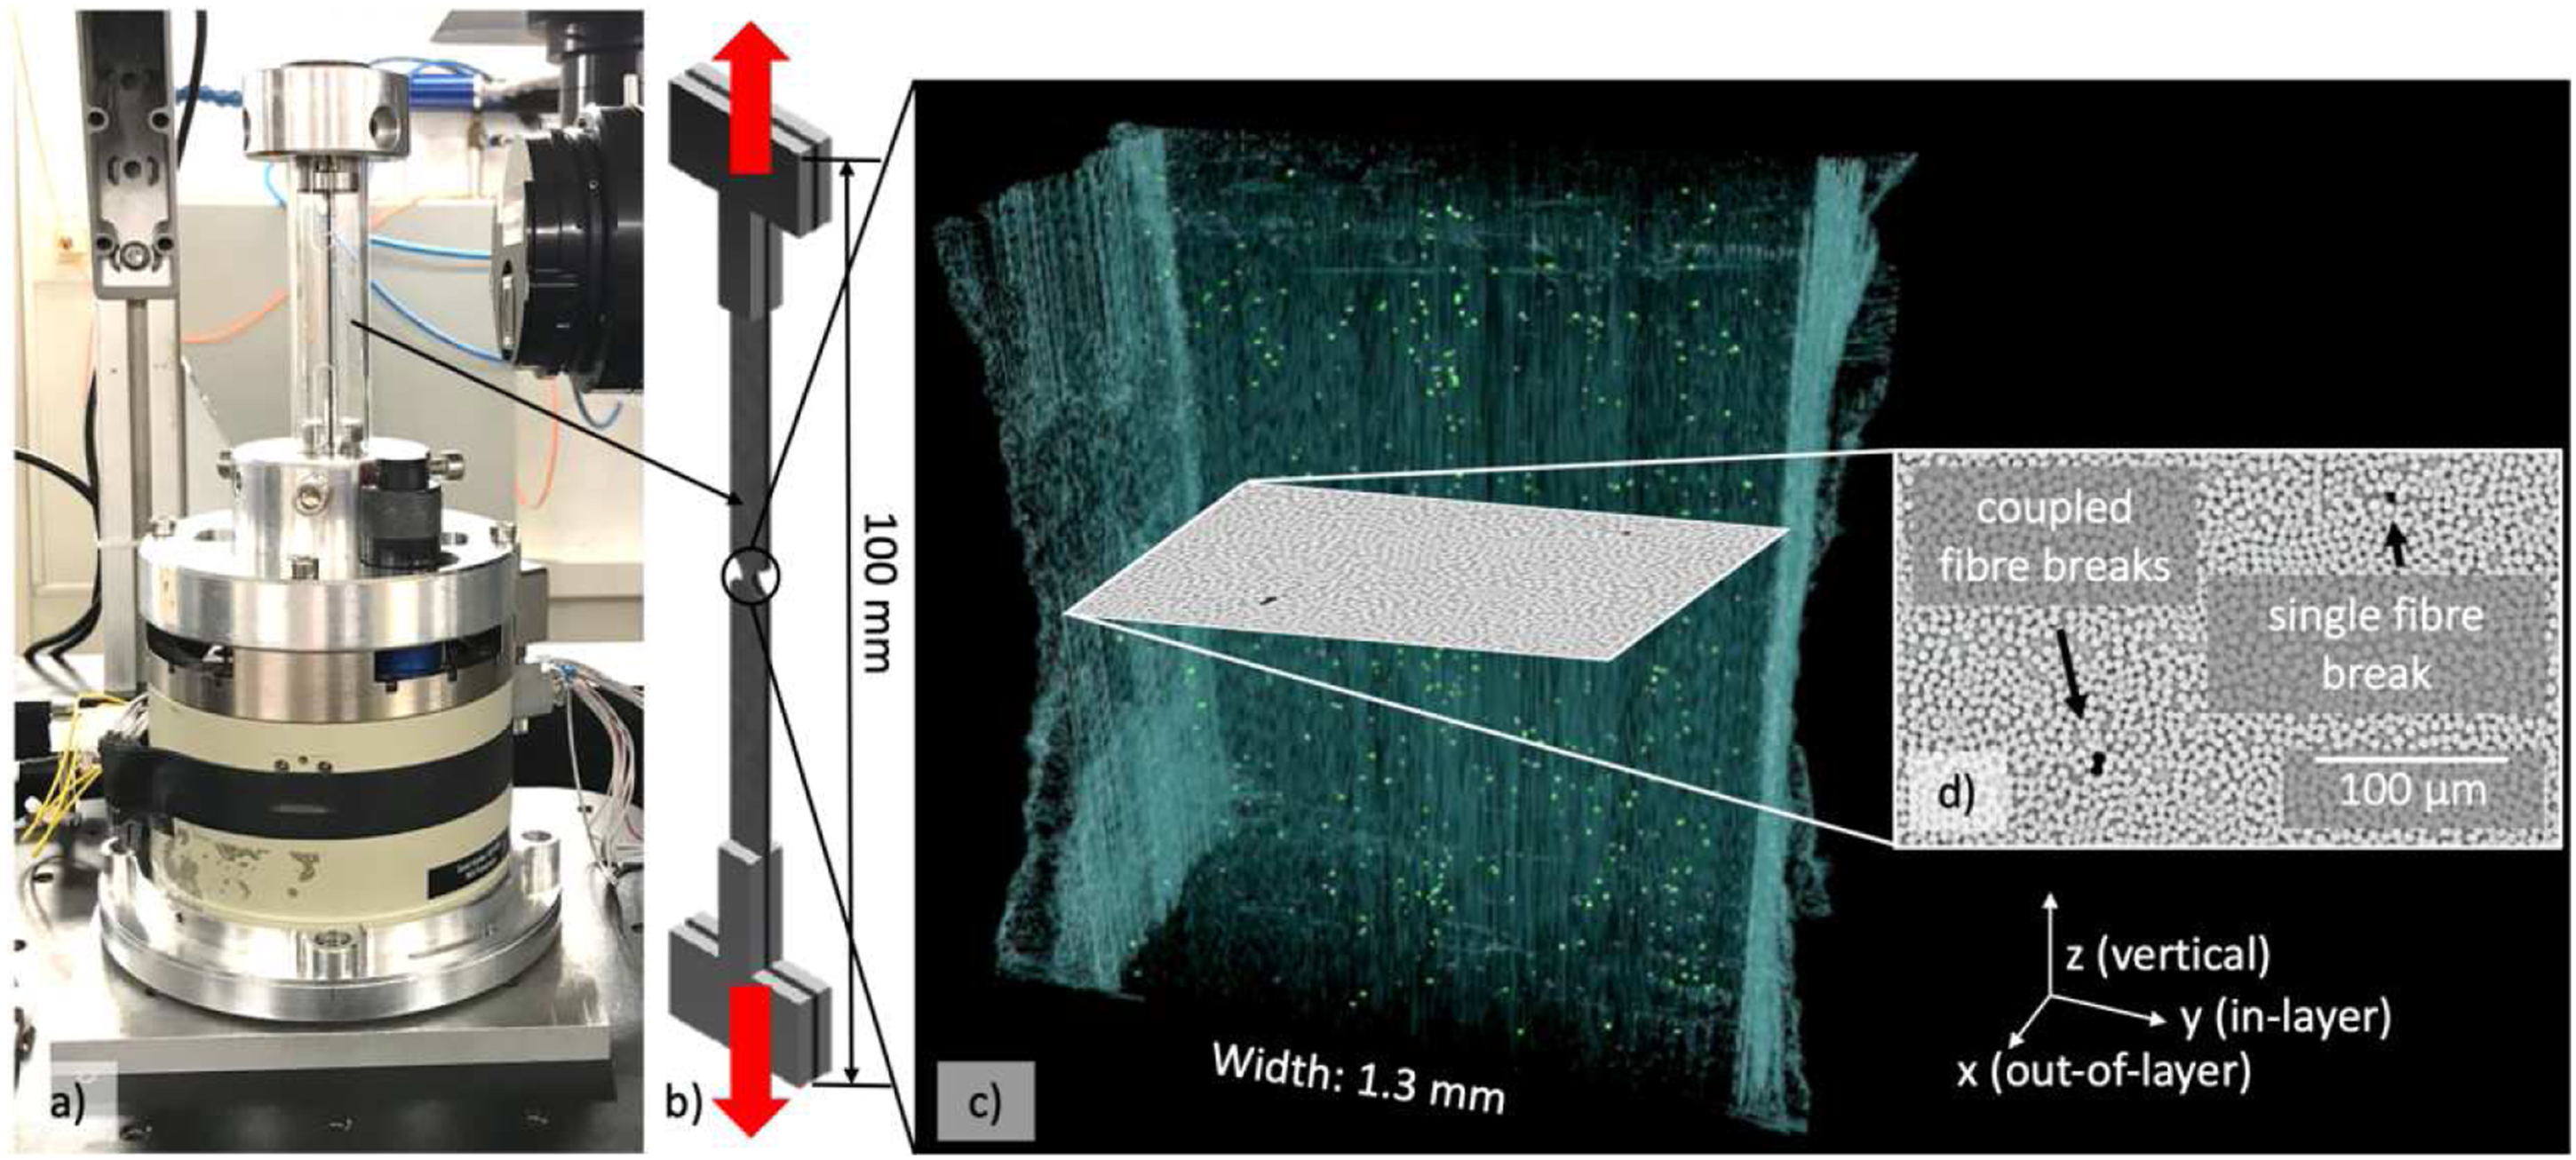
The data analysed in this study was obtained in the experimental campaign of, 29 from which this is extracted; (a) Illustration of the compact loading rig on the experimentation stage at the synchrotron facilities, (b) coupon geometry, (c) a 3D representation of the imaged volumes for all the scans and (d) a top view of the features detected within the volume (single fibre breaks or groups of co-planar fibre breaks. In this case, a singlet and a duplet are highlighted).
Experimental procedure
Progressive in situ tensile tests to failure were performed at the European Synchrotron Radiation Facility (ESRF) in Grenoble, France (ID19 microtomography beamline). Following, 21 tests have been performed using a modified DEBEN CT5000® tensile stage (Figure 1(a)). The central notched region of the coupons (see Figure 1(b)) was initially scanned at between ∼50 and ∼80% of the expected UTS, with an average of eight more scans being collected between ∼90% UTS and final tensile failure of the coupon. The number of scans collected per test varies somewhat due to the stochastic nature of composite strength. The individual scan duration was ∼2.5 min. A displacement rate of 0.2 mm/min was used between scans, with the tensile force on the coupon being reduced slightly (∼10%) while scanning, to promote sample stability during scanning.
To ensure crack opening displacements at fibre breaks were well in excess of the voxel size, whilst maintaining a field of view large enough to perform a reasonable statistical evaluation of the data, a resolution of 0.65 μm was chosen for this study. A representative transverse SRCT slice of a single and two adjacent fibre breaks is highlighted in Figure 1(d). 2996 projections were collected per scan with an exposure time of 50 ms. A near-field Fresnel/edge enhancement regime was adopted at a coupon-to-detector propagation distance of 50 mm, using a multilayer monochromator (ΔE/E ∼ 10−2) at an energy of 19.5 kV. In-house software from ESRF was used for the tomographic reconstruction.
In Figure 1(c), a scan collected immediately prior to macroscopic failure is shown (Coupon C 1), highlighting the number of break events (typically in the order of 300–500) seen at this point within a scan volume (light green points within the Figure 1(c)).
Notched coupons ultimate tensile strength evaluation
In order to obtain an average ultimate tensile strength (UTS), by which to guide the in situ tests, tensile tests were conducted on 10 coupons per material configuration on an INSTRON® servo-mechanical testing machine at a displacement rate of 0.2 mm/min. The UTS for each specimen was obtained by dividing the failure load by the cross-sectional area between the notches of each coupon. This was essential as waterjet cut notched sections achieved a tolerance of ±10% from the nominal width value of 1.0 mm. The cross-sectional area (CSA) value was obtained by the use of optical microscopes.
Image analysis
An automated image processing workflow was implemented in ImageJTM and MATLAB®. The approach adopted in ImageJTM for fibre break thresholding is shown in Figure 2. The user input time needed is on the order of minutes, while the processing time is on the order of 2–3 h to process ten scan volumes of the same coupon (2.2 GHz Intel Core i7 processor). When strain is applied at this relatively high resolution, it requires care to image accurately the same volume with the required precision of a few micrometres as the material in the intended scan volume is displaced due to the applied loading. However, by registering all the volumes to the same microstructural reference points within the actual coupon, fibre breaks appearing at low strains will keep approximately the same coordinates within volume collected right up to failure. The same feature (i.e. the pattern created by the fibre positions\on a transversal SRCT slice) is identified in all the scanned volumes—particle inclusions, voids, external peculiarities due to the manufacturing of the plates that are in the imaged area, as well as fibres in resin rich regions (for their misorientation with respect to the loading direction, represented by the z axis) are chosen. Accuracy in the use of such reference features is checked and is found to always correspond to less than three voxels in the fibre direction from low to high applied loads. A preformatted Excel® sheet is filled with the z coordinates of the fibre patterns; as output, the range of slices to which to crop each volume to the smaller portion of volume that is equal for all the scan volumes is obtained. This range of slices is transferred via the GUI of the ImageJTM script to allow user to crop the volumes. Flow chart of the scan volumes crop and registration (using ImageJTM) to the same region within the coupon from low to high strains, so that the fibre break evaluation is performed within the same volume from the undamaged to the most damaged situation.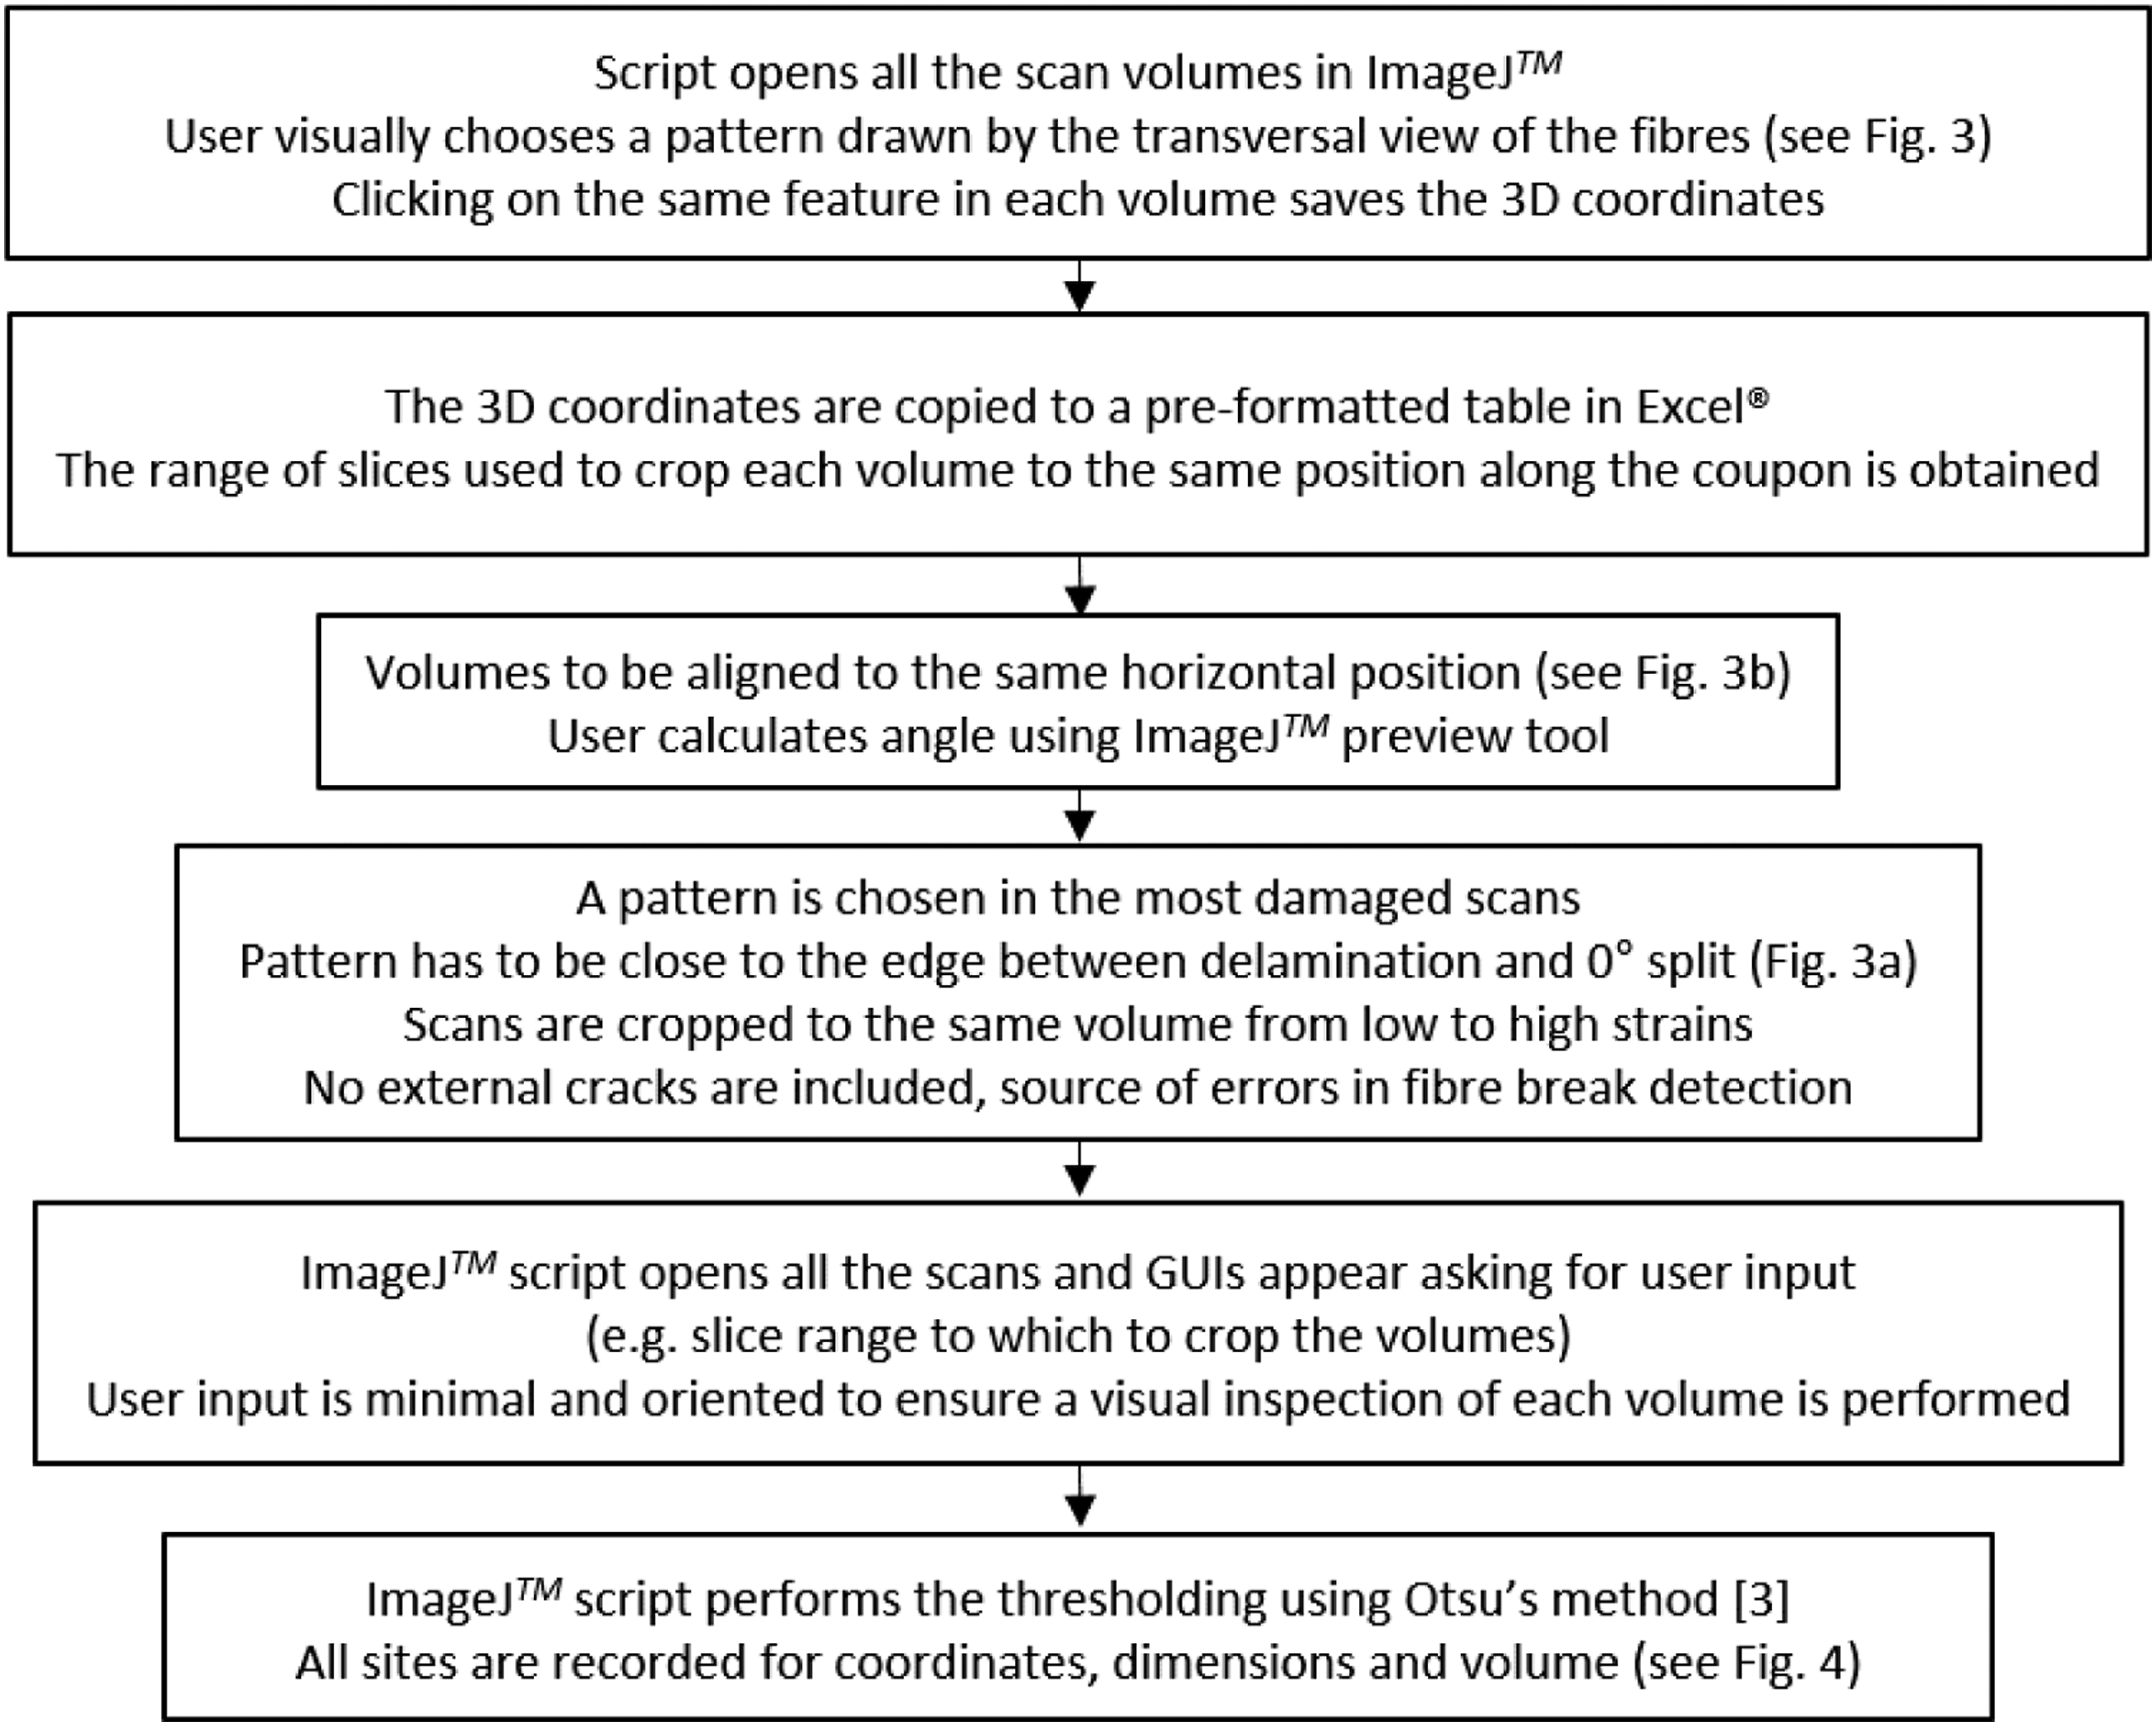
The last collected scan (most damaged situation) is analysed first: the whole volume is rotated so as to orientate the composite layers orthogonal to the image (see Figure 3(a), then rotated in Figure 3(b)). An identified fibre pattern is chosen, close to the edge between the delaminated area and the 0° split (more details on these damage modes for this coupon geometry can be found in
16
), as shown in Figure 3(c). A rectangular cropping selection is drawn, that contains the 0° layers and includes no delamination or 0° splits within the selected region (in green in Figure 3(b)), as such cracks could represent false positives in the fibre break detection. At the end of this process, all the collected scans are cropped to smaller dimensions to ensure from unloaded to prior-to-failure conditions the same volumes are analysed. The same dimensions are used for all the cropped scans to ease the processing: it is checked that from 80 to 99% UTS, this corresponds to less than 20 slices being lost (corresponding to less than 15 μm in the z direction) in the last captured scan, which represents the most elongated condition. However, this translates into an error of below 0.5% in the fibre break evaluation, due to the fact that the spike in the fibre break formation happens at very high load levels, when less than 20% of the total elongation is left before failure. This allows the multiplets to be followed accurately, according to their appearance and evolution from low to high applied loads. Cropping selection: (a) shows the typical damage modes in the analysed geometry (see
16
for more details); in (b), the 0° layers are rotated and the cropped selection is shown in green that will be used for an automated fibre break detection; in (c), an example of a pattern created by the fibre locations used to crop accurately all the scanned volumes to the same location within the coupon.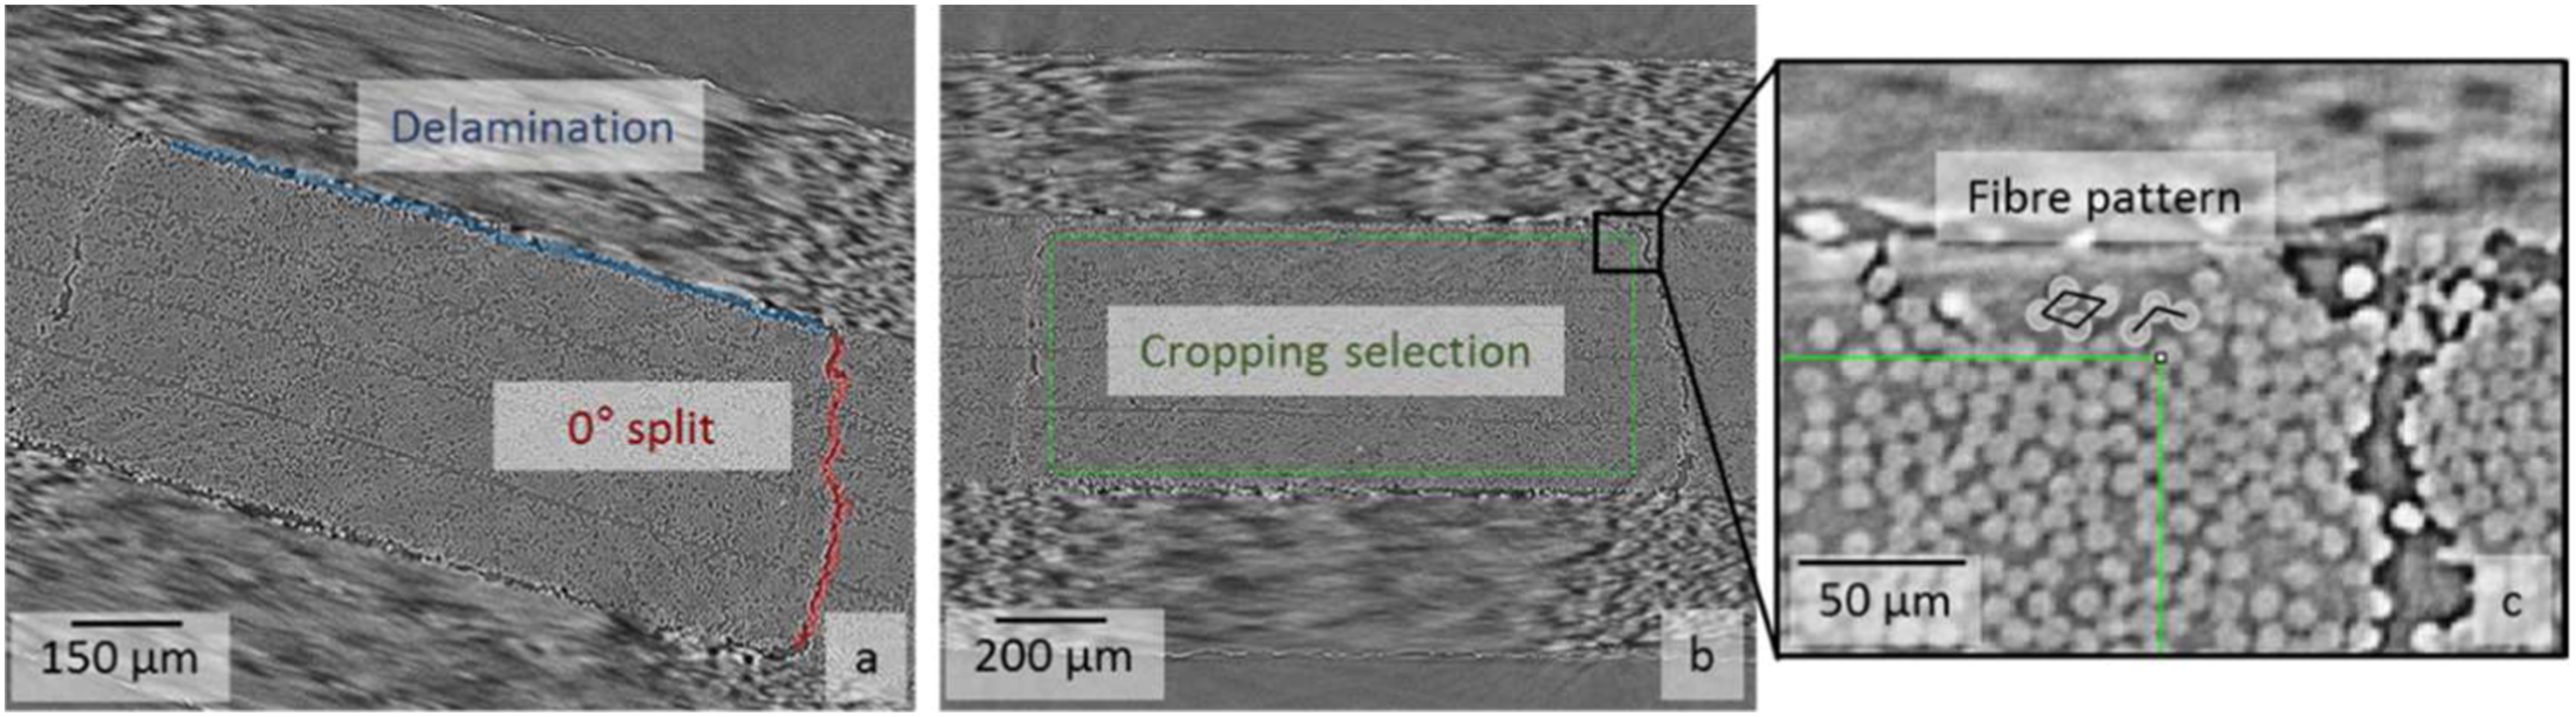
Volumes are binarised using Otsu’s method.
30
An example of a binarised image is shown in Figure 4, in which fibre break sites are identified, with data for their coordinates, dimensions and volumes recorded. Segmentation approach for the break formation/accumulation evaluation. Scripts have been developed, using Otsu’s threshold method.
30
From the binary images, all sites are recorded for coordinates, dimensions and volume.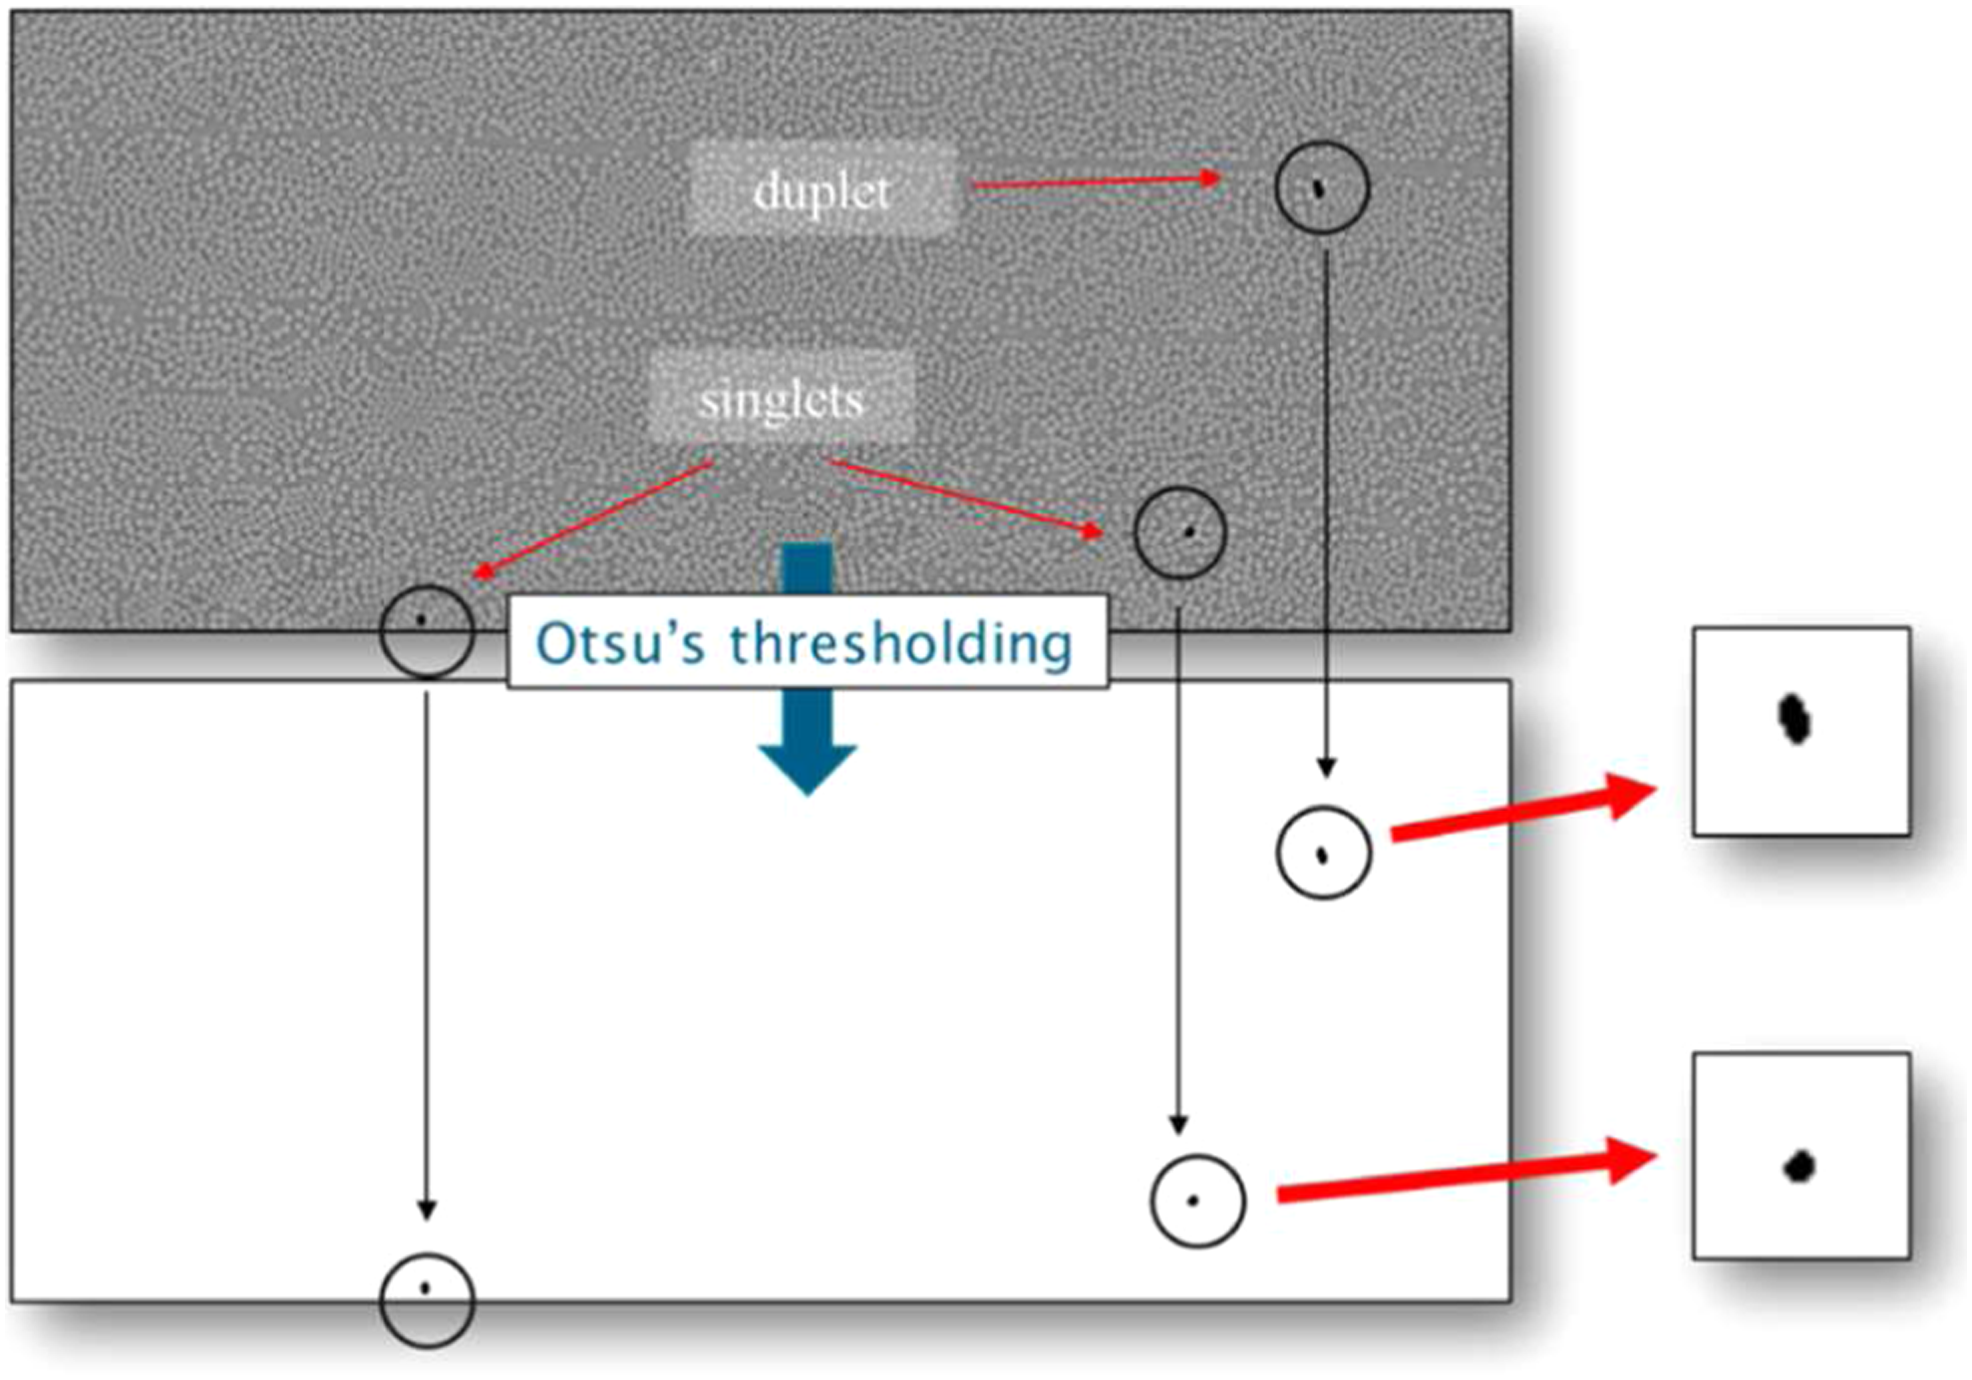
Single fibre breaks and multiplets are relatively easily distinguished by the feature volumes and linear dimensions. However, given: The low number of multiplets occurring within each volume (about 10–15 in scans prior to failure), The variation in multiplet geometry (for example a triplet can have a near-linear arrangement, or a more triangular geometry),
It was considered worthwhile for automated multiplet evaluation to be confirmed directly by visual inspection given that the script provides their accurate position within the volume. As such, a high level of confidence is achieved in the current measurements of multiplet character (number of fibres, local spatial arrangement), having been carefully checked/confirmed for any false positives/false negatives during image processing.
Fibre volume fraction extraction
A macro written in ImageJTM was adopted to extract the fibre volume fraction from the high-resolution scans. For each coupon, the scans collected at 100 N, that is, containing no damage, were examined. Five images showing the top view of the fibres, similar to those adopted for the fibre break extraction shown in Figure 4, were extracted from the main scanned volume at an axial distance of ∼250 μm from each other. From each image, all the fibre centres were extracted using the following image processing approach: A median filter was first used to reduce the general noise, followed by a sharpening to better define the edges of the fibres. An appropriate value for the thresholding was chosen to correctly binarise the fibres, followed by a watershed step to ensure that two fibres segmented as one (this is particularly likely to happen in highly packed regions), are divided into two entities; an eroding and dilating step is added to enhance the fibres separation. Following this, the ‘ultimate points’ function is adopted that provides the ultimate eroded points of the Euclidean distance map of the fibres in, 31 which translates into only the centres of the segmented fibre being kept. The number of detected centres is multiplied by the nominal individual fibre section value provided by the manufacturer. The result is divided by the examined area from which the fibre centres have been extracted. This provides an approximate value for the fibre volume fraction, affected by an error for the approach adopted in this study of ∼±1%, due to false positive and negative detection, and the omission in the centres count of the fibre centres at the edges of an image, centres that would have otherwise contributed with fractions of fibre sections.
Results
Macroscopic properties
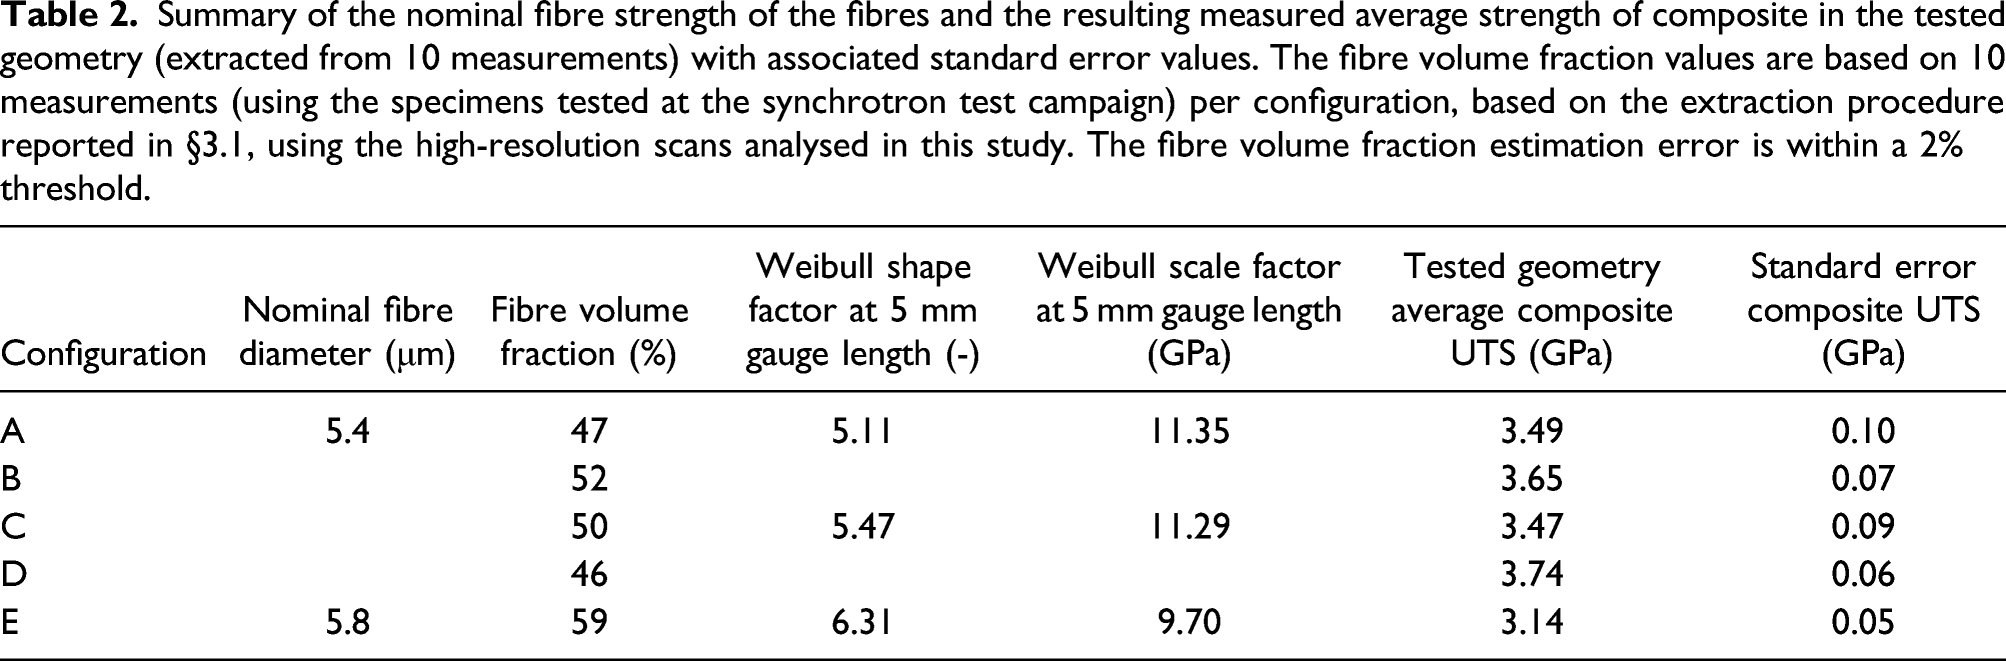
Summary of the nominal fibre strength of the fibres and the resulting measured average strength of composite in the tested geometry (extracted from 10 measurements) with associated standard error values. The fibre volume fraction values are based on 10 measurements (using the specimens tested at the synchrotron test campaign) per configuration, based on the extraction procedure reported in §3.1, using the high-resolution scans analysed in this study. The fibre volume fraction estimation error is within a 2% threshold.
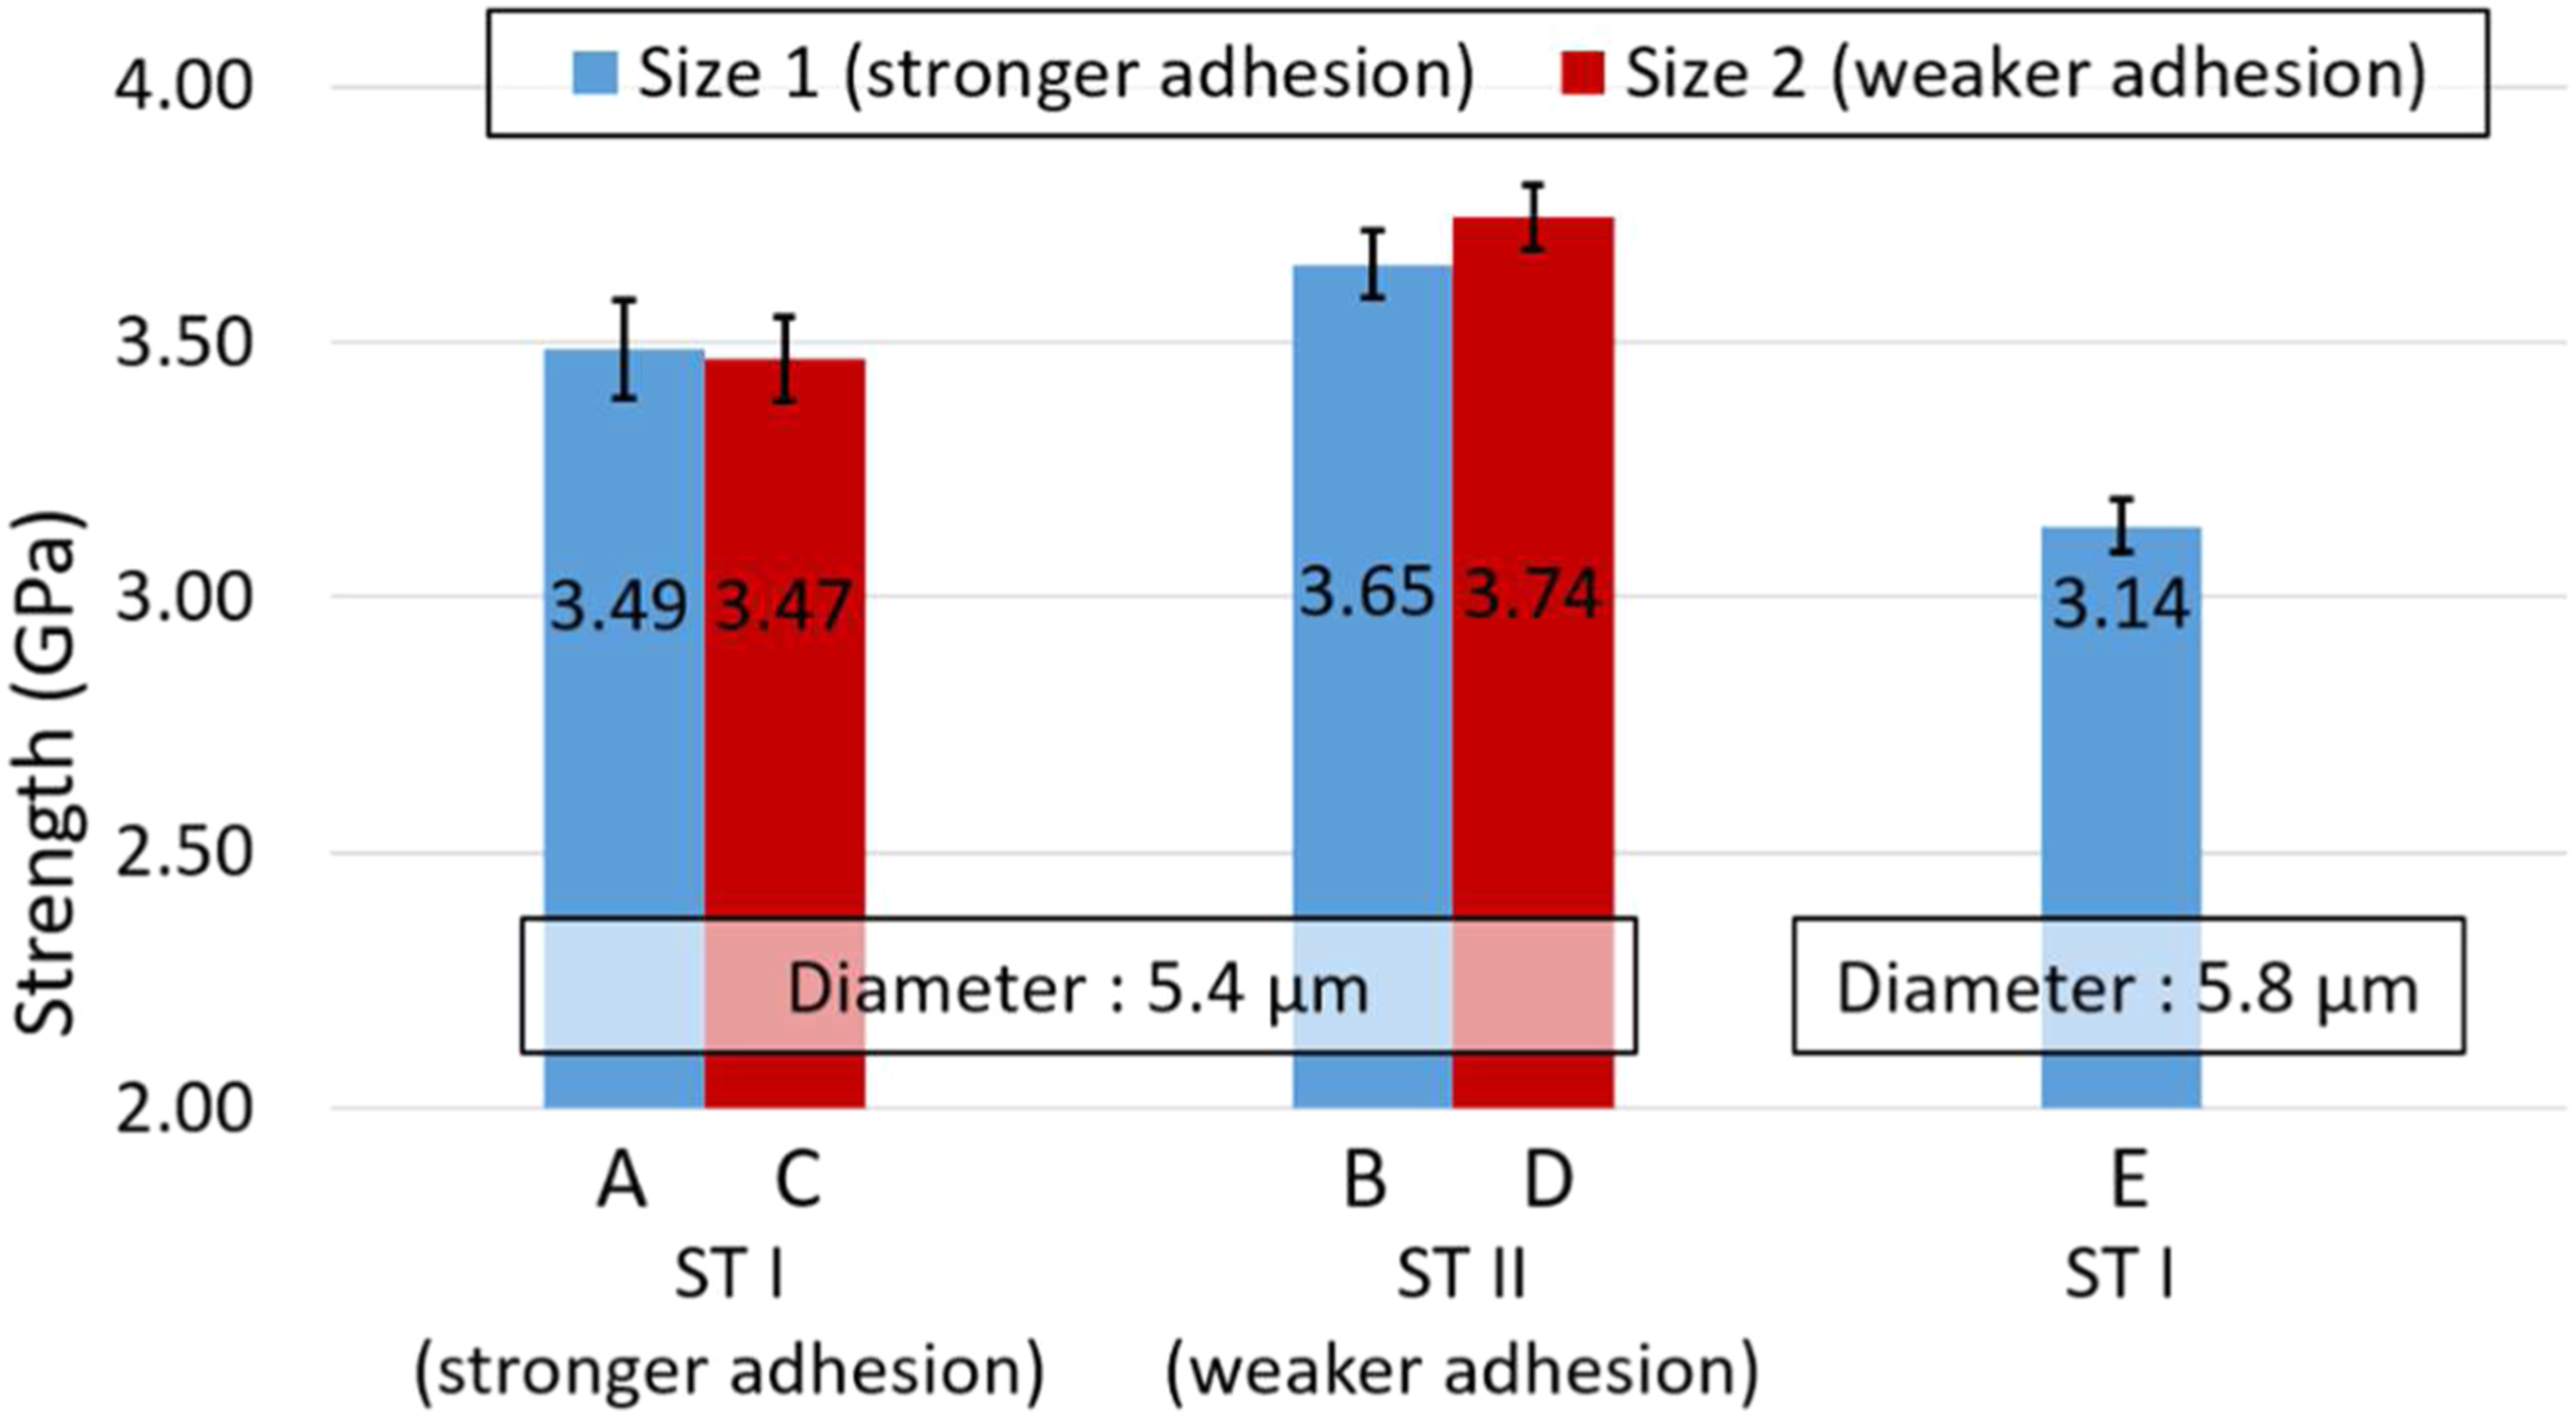
The average composite strength of the five configurations (based on 10 measurements per material) is reported. Materials are presented in order of fibre diameter (smaller to larger). The surface treatment (indicated as ST) has the greatest influence, with materials B and D (surface treatment II) being the strongest. As can be seen, the strongest adhesion (configuration A) did not result in the highest composite strength. Also, a limited influence of the sizing is observed.
Multiplet arrangements
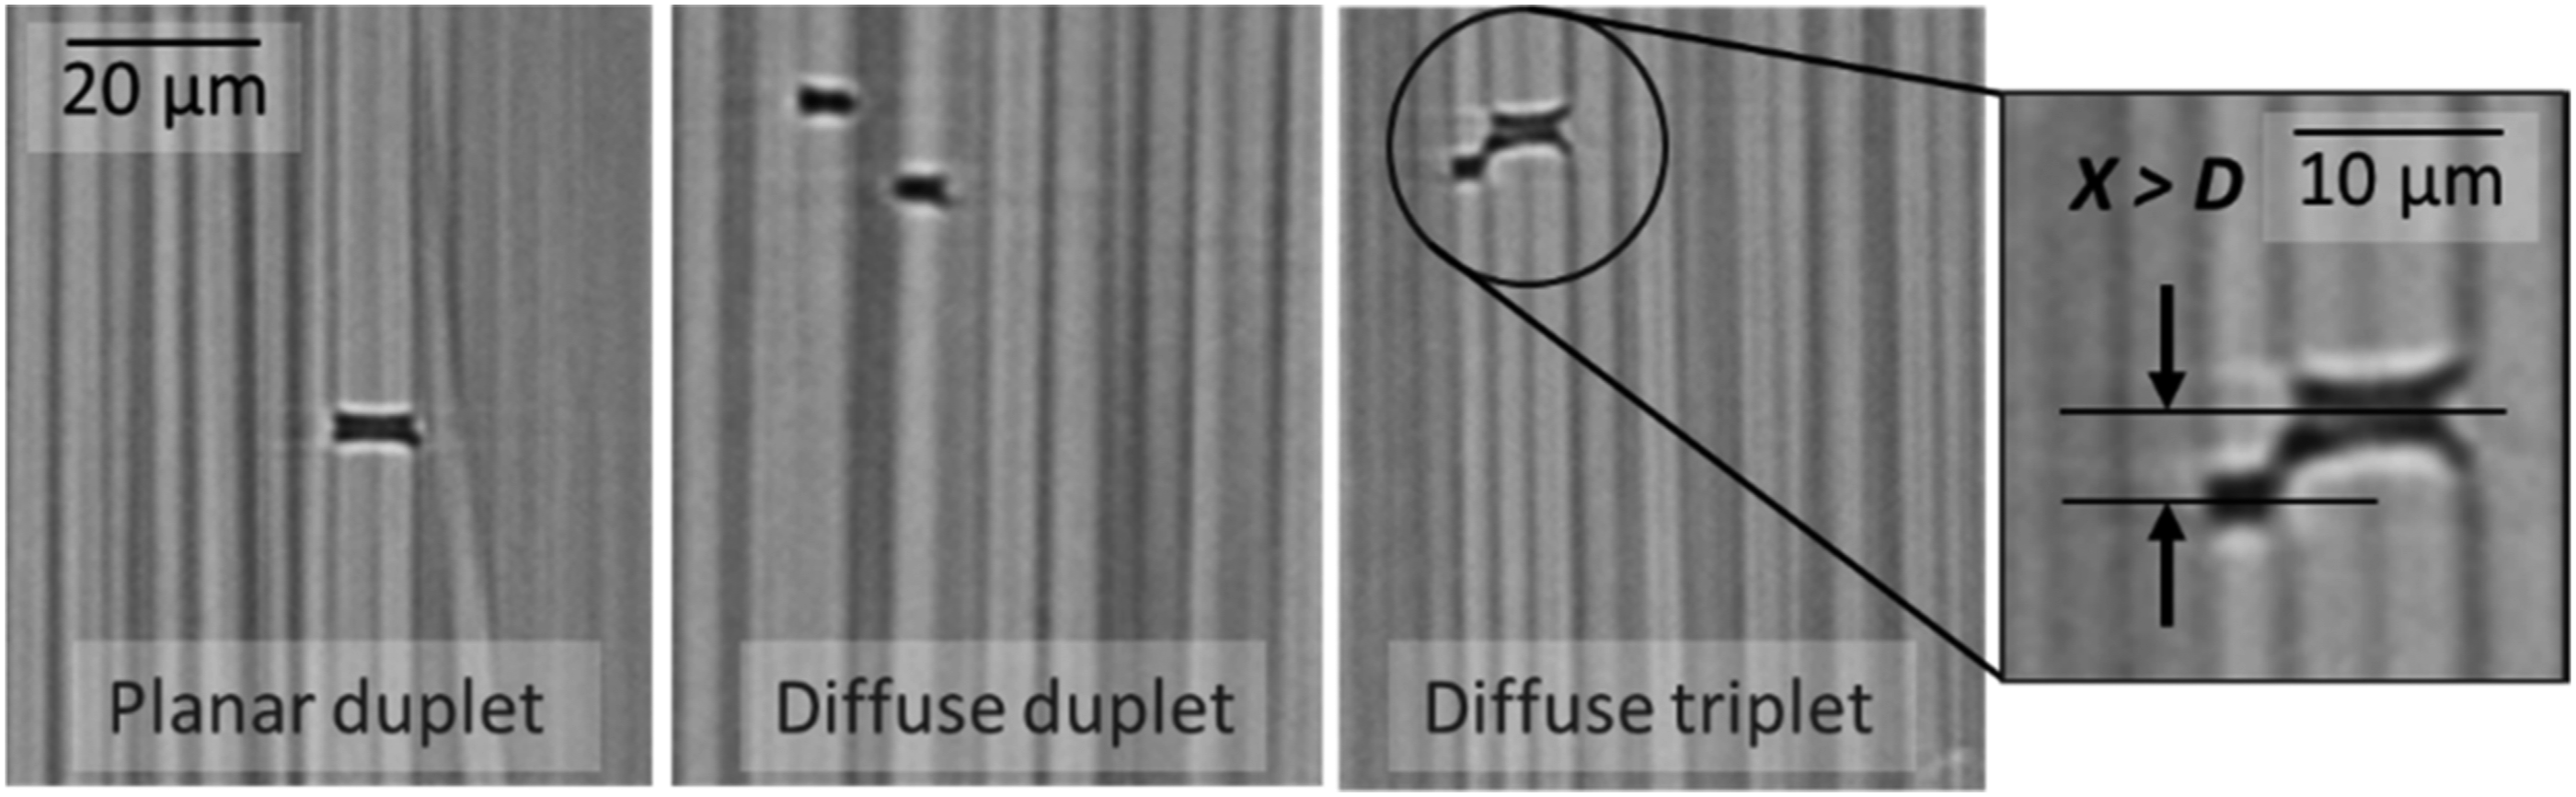
In this study, a distinction is made between planar and diffuse multiplets (see Figure 6). In the absence of a generally accepted definition, multiplet definition follows that reported in.16,25 Planar multiplets were defined here as those having an axial separation of less than a fibre diameter, whilst diffuse multiplets have an axial separation lower than the ineffective length of 70 μm experimentally estimated by Schöberl et al.
32
It should be noted that this value of the ineffective length for the material systems analysed here could differ, but it is adopted in this instance for fibre break count comparison purposes only. Example of planar and diffuse multiplets. Diffuse multiplets are defined as in.
16
The fibre break accumulation curves will be presented by separately plotting the total number of individual fibre breaks (including breaks that are part of diffuse multiplets and excluding breaks that are part of planar multiplets), and the number of planar multiplets, to better assess the differences among the materials tested in terms of groups of individual and interacting fibre breaks, their formation and evolution. 1
Variability between coupons
In assessing the damage formation and propagation within the small sampling volumes in SRCT there are statistical aspects of damage that must be considered. In this case, these might be identified with local microstructure variations, debonding between the plies and transverse ply crack (TPC) variability (damage modes extensively described in16,26). As reported in Table 2, a variation in the fibre volume fraction is observed among the five material configurations, with values ranging from 46 to 59%. In Figure 7, the number of fibre breaks as a function of the ply-level stress (the applied nominal stress in the reduced load-bearing section) is presented for Materials C and D, with C representing the material with the best sampling (at least 10 data points collected for both coupons) and D the worst (4 data points vs 10); this is associated with the stochastic nature of composite strength, as noted in §2.2. D 1, D 1 top and D 1 bottom indicate that the scans are collected at three different locations within the same coupon to assess levels of variability within individual coupons, as will be discussed in §4.4. For the material configurations tested in this study, variability between coupons has been estimated to be ∼30% in fibre break density (planar multiplets not included). The variability has been evaluated by assessing the difference of fibre break count at high stress levels (last scans captured before failure, collected at similar coupon UTS percentage levels) between the two tested coupons of each material configuration. An error of 5% in stress measurement is estimated. Comparison of Coupons D 1 (scanned in multiple regions: D 1, D 1 top and D 1 bottom, as explained in §4.4), D 2, C 1 and C 2. Planar mulitplets are not included in the count presented in this plot. Variability between coupons is estimated to be ∼30% in fibre break density. The error in stress is estimated to be ∼5%.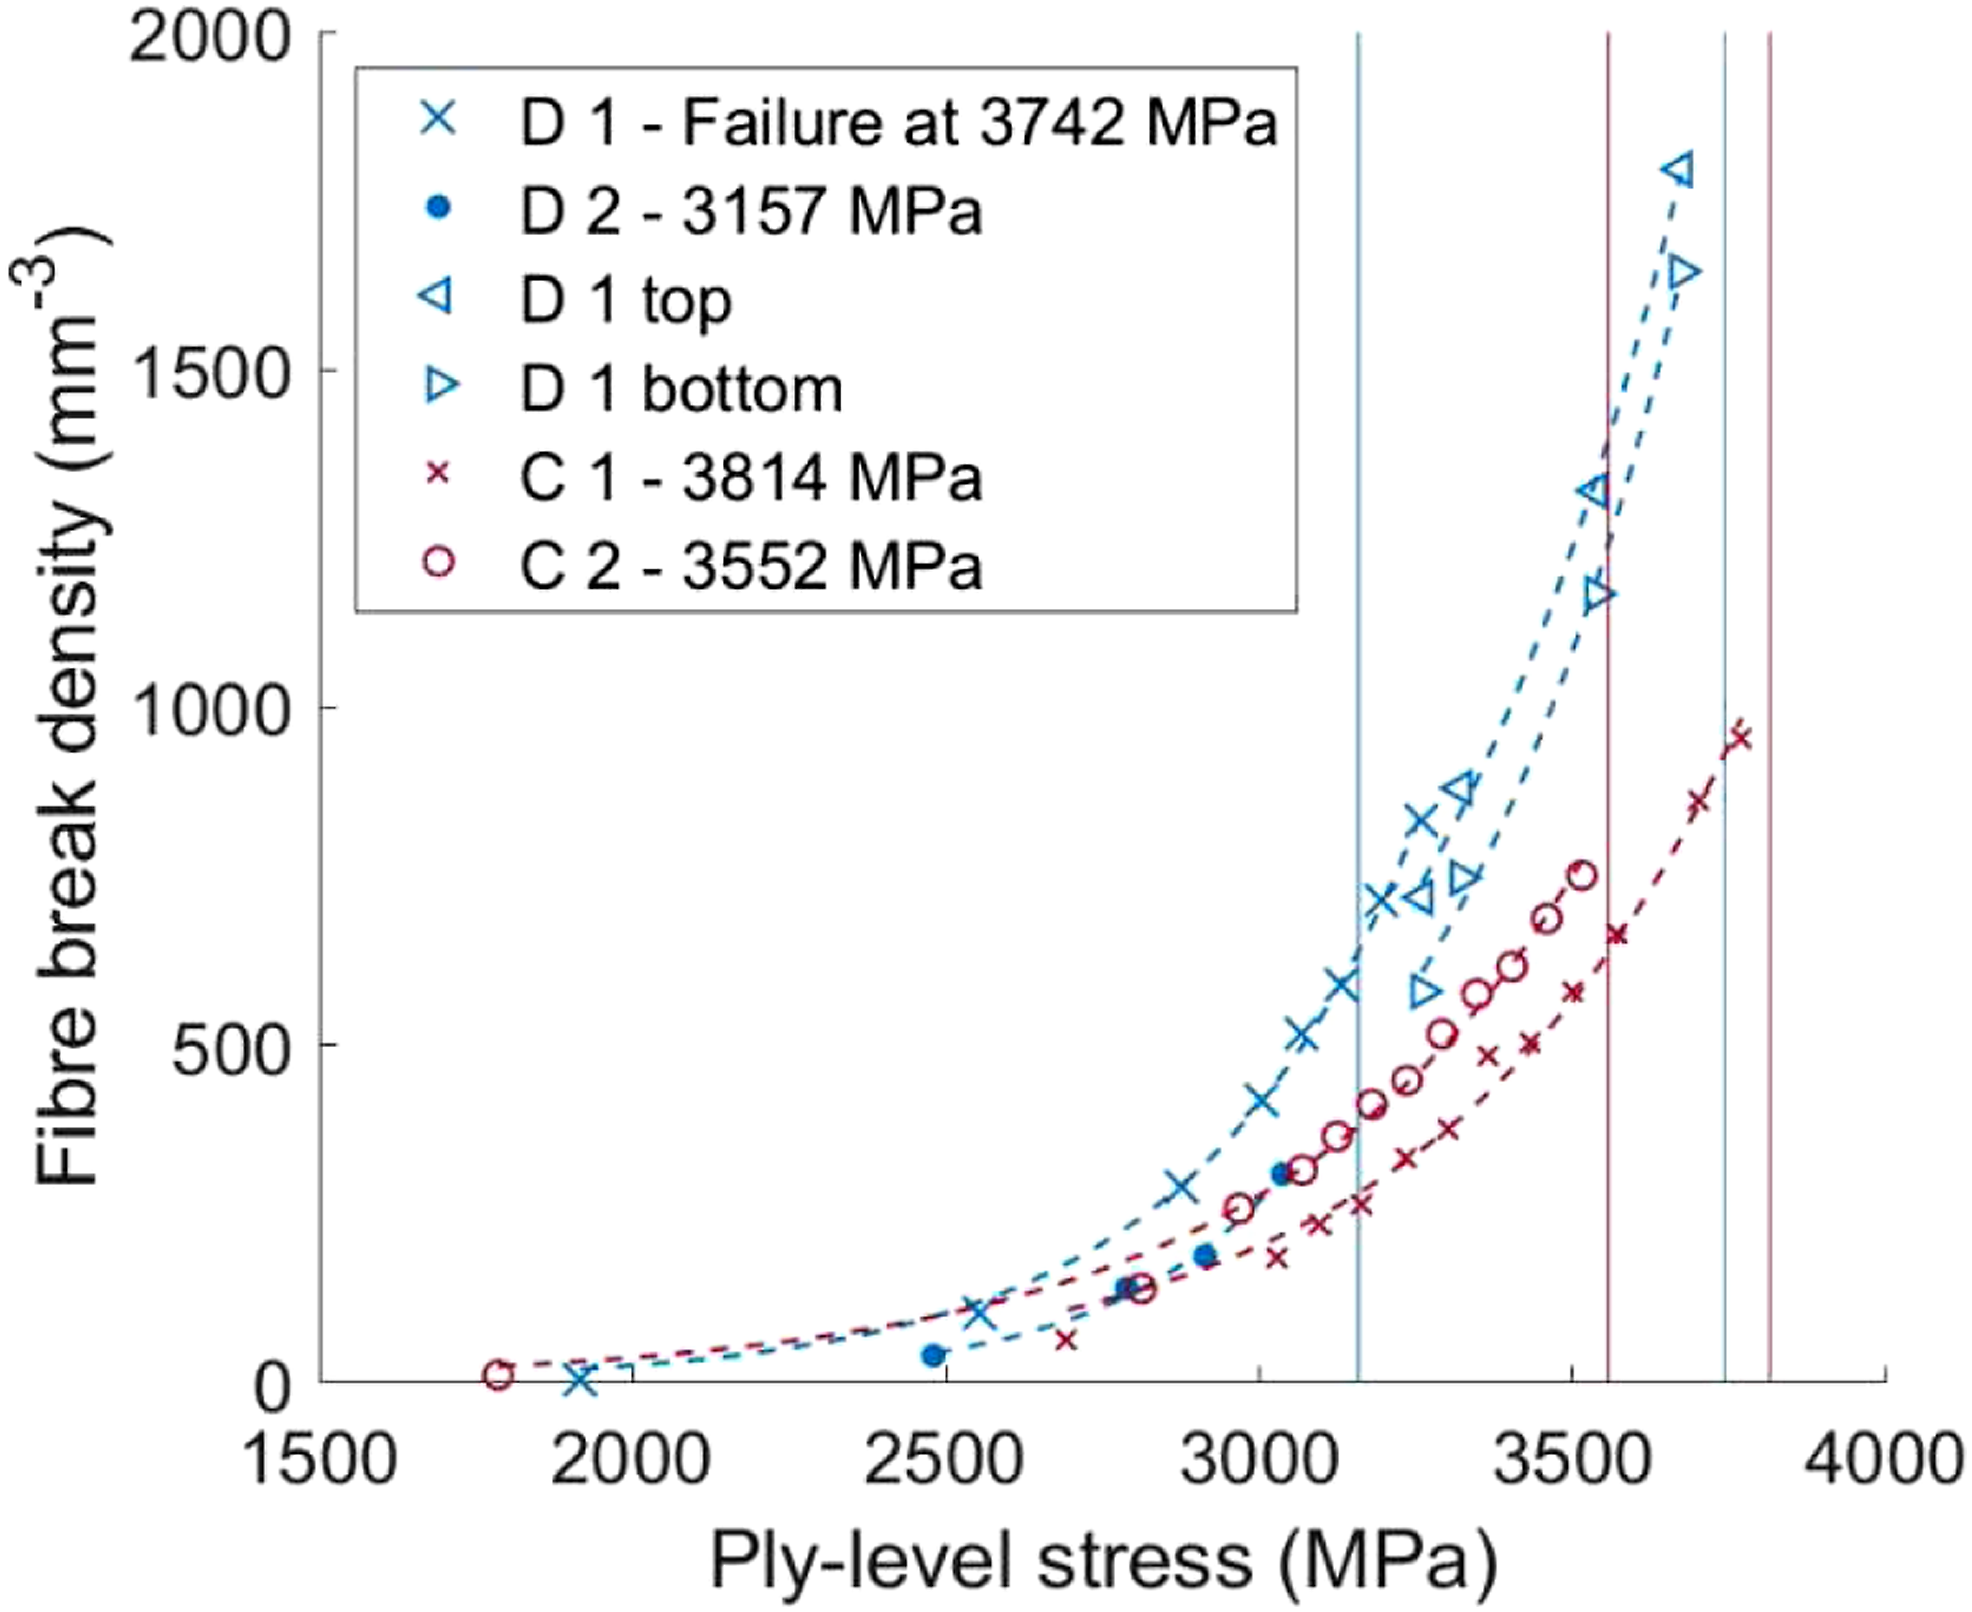
Variability within a coupon
In order to assess volume sampling aspects of damage measurements (i.e. recognising the limited sampling volumes inherent to high resolution SRCT), fibre break measurement variations were analysed. Notwithstanding limitations on synchrotron access, this was achieved within one of the test coupons, thereby ensuring equivalent sample/material preparation influence and load bearing cross-section. Three positions along the coupon length and close to the notched area have been imaged as indicated in Figure 8(a), in which the approximate position of final failure with respect to the imaged regions is identified with a dotted line. At these loads, 0° plies are extensively debonded and mechanically uncoupled from the notches, that is, equivalent and uniform loading is assumed for the three regions (observed 0° splits indicated in green in Figure 8(a)). The accumulation of fibre breaks with increasing ply-level stress is shown in Figure 8(b). For low stress levels, only the mid volume (in yellow) was scanned, as for all the other coupons imaged in this study. At a ply stress of 3259 MPa, the three regions were scanned, and for higher stress levels the top and bottom regions were scanned. Figure 8(c) shows the variability in break density for the three volumes at 3259 MPa. Variation between regions within the individual coupon is therefore in the range of ∼30% in terms of breaks, or ∼6% if considered in terms of stress (obtained observing the differences between the best fit curves of Figure 8(b)), which might be attributable to the estimated ∼5% error in stress measurement. Coupon D 1, (a) tested geometry and imaged volumes to assess variability in fibre break accumulation within a coupon, highlighting the extensive 0° ply splits, decoupling the central region from the initial notches; (b) the fibre break accumulation curves (planar multiplets not included); (c) the difference in breaks count at the same load level is assessed. Variation between different regions of the same coupon is ∼30%.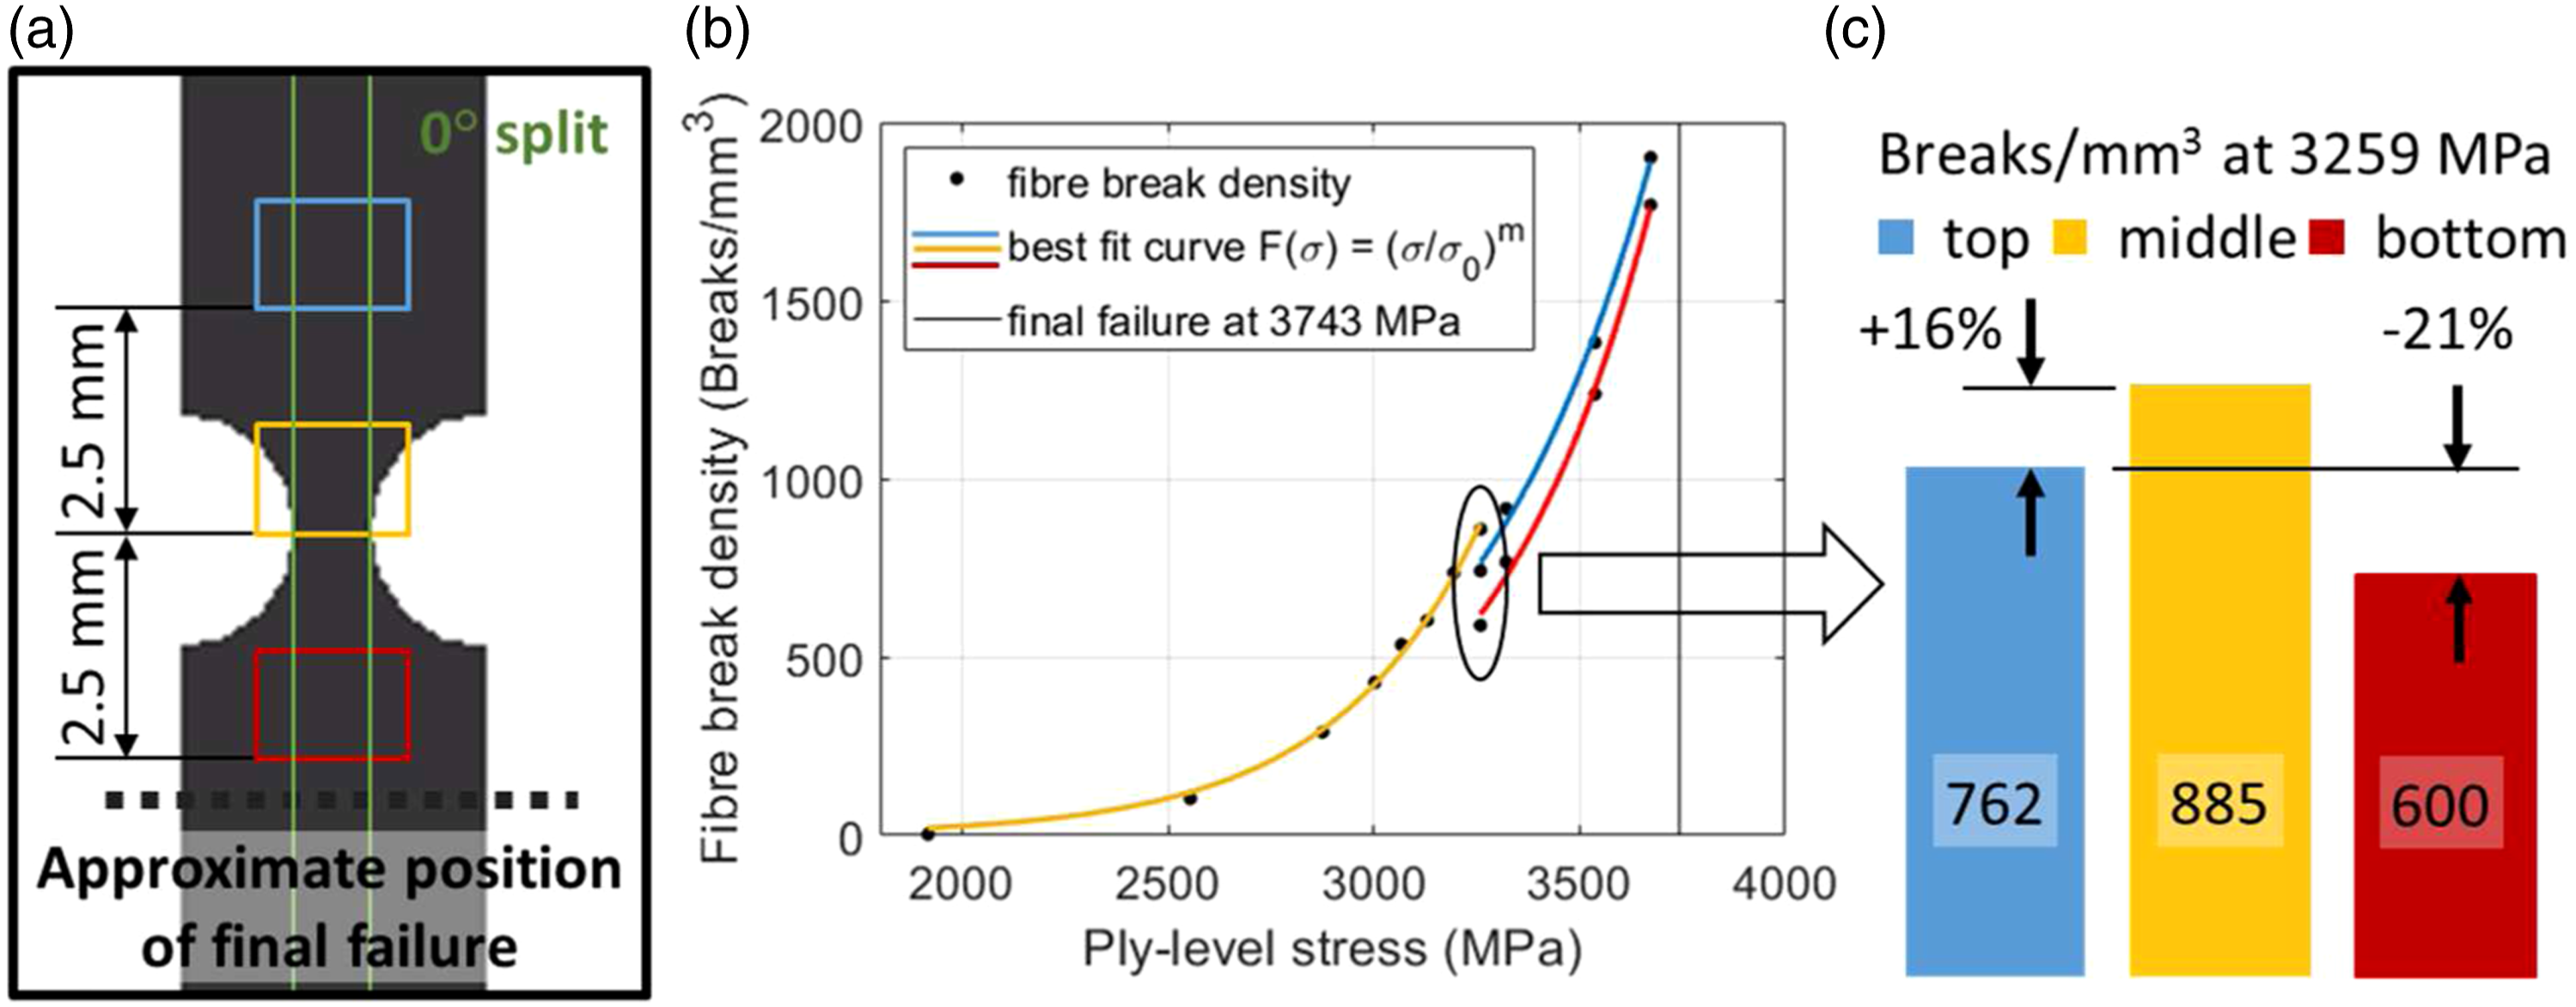
Comparison 1: Change in surface treatment (A to B)
In Figure 9, the fibre break activity of the coupons with the highest number of collected scans is presented. As n-plets, the sum of the diffuse and planar multiplets is indicated; one n-plet is counted as one entity. This comparison could be equally made between Materials A and B or C and D (sharing the same sizing type but adopting different surface treatments). However, although D 1 and D 2 exhibit a very similar singlet formation with stress, the truncation due to early failure of Coupon D 2 results in this material being not to most suitable for drawing conclusions regarding fibre break accumulation. Hence, this comparison will be focused on materials A and B (with the exemplary Coupons A 1 and B 1). Although the singlet formation with stress is very similar for the two materials, the higher average strength configuration (B) demonstrated a greater propensity for multiplet formation (particularly for n-plets with n ≥3). The last scan collected for Coupon B 1 appears at the final failure stress level (3629 MPa); this is due to the coupon being loaded to that level and the load (reduced by 10%) being held while scanning. When loading to the higher load step, the coupon failed before reaching the previous stress level, at 3606 MPa. The fibre break accumulation activity is shown for individual coupons of the materials assessed in the three comparisons. The sum of diffuse and planar multiplets is represented, as the total of n-plet sites, with a 2-plet counted as a single entity. In red symbols, the largest multiplets are represented, as they are believed to be the possible trigger for final failure.1,2 The red line represents the exponential best fit to the fibre break density data.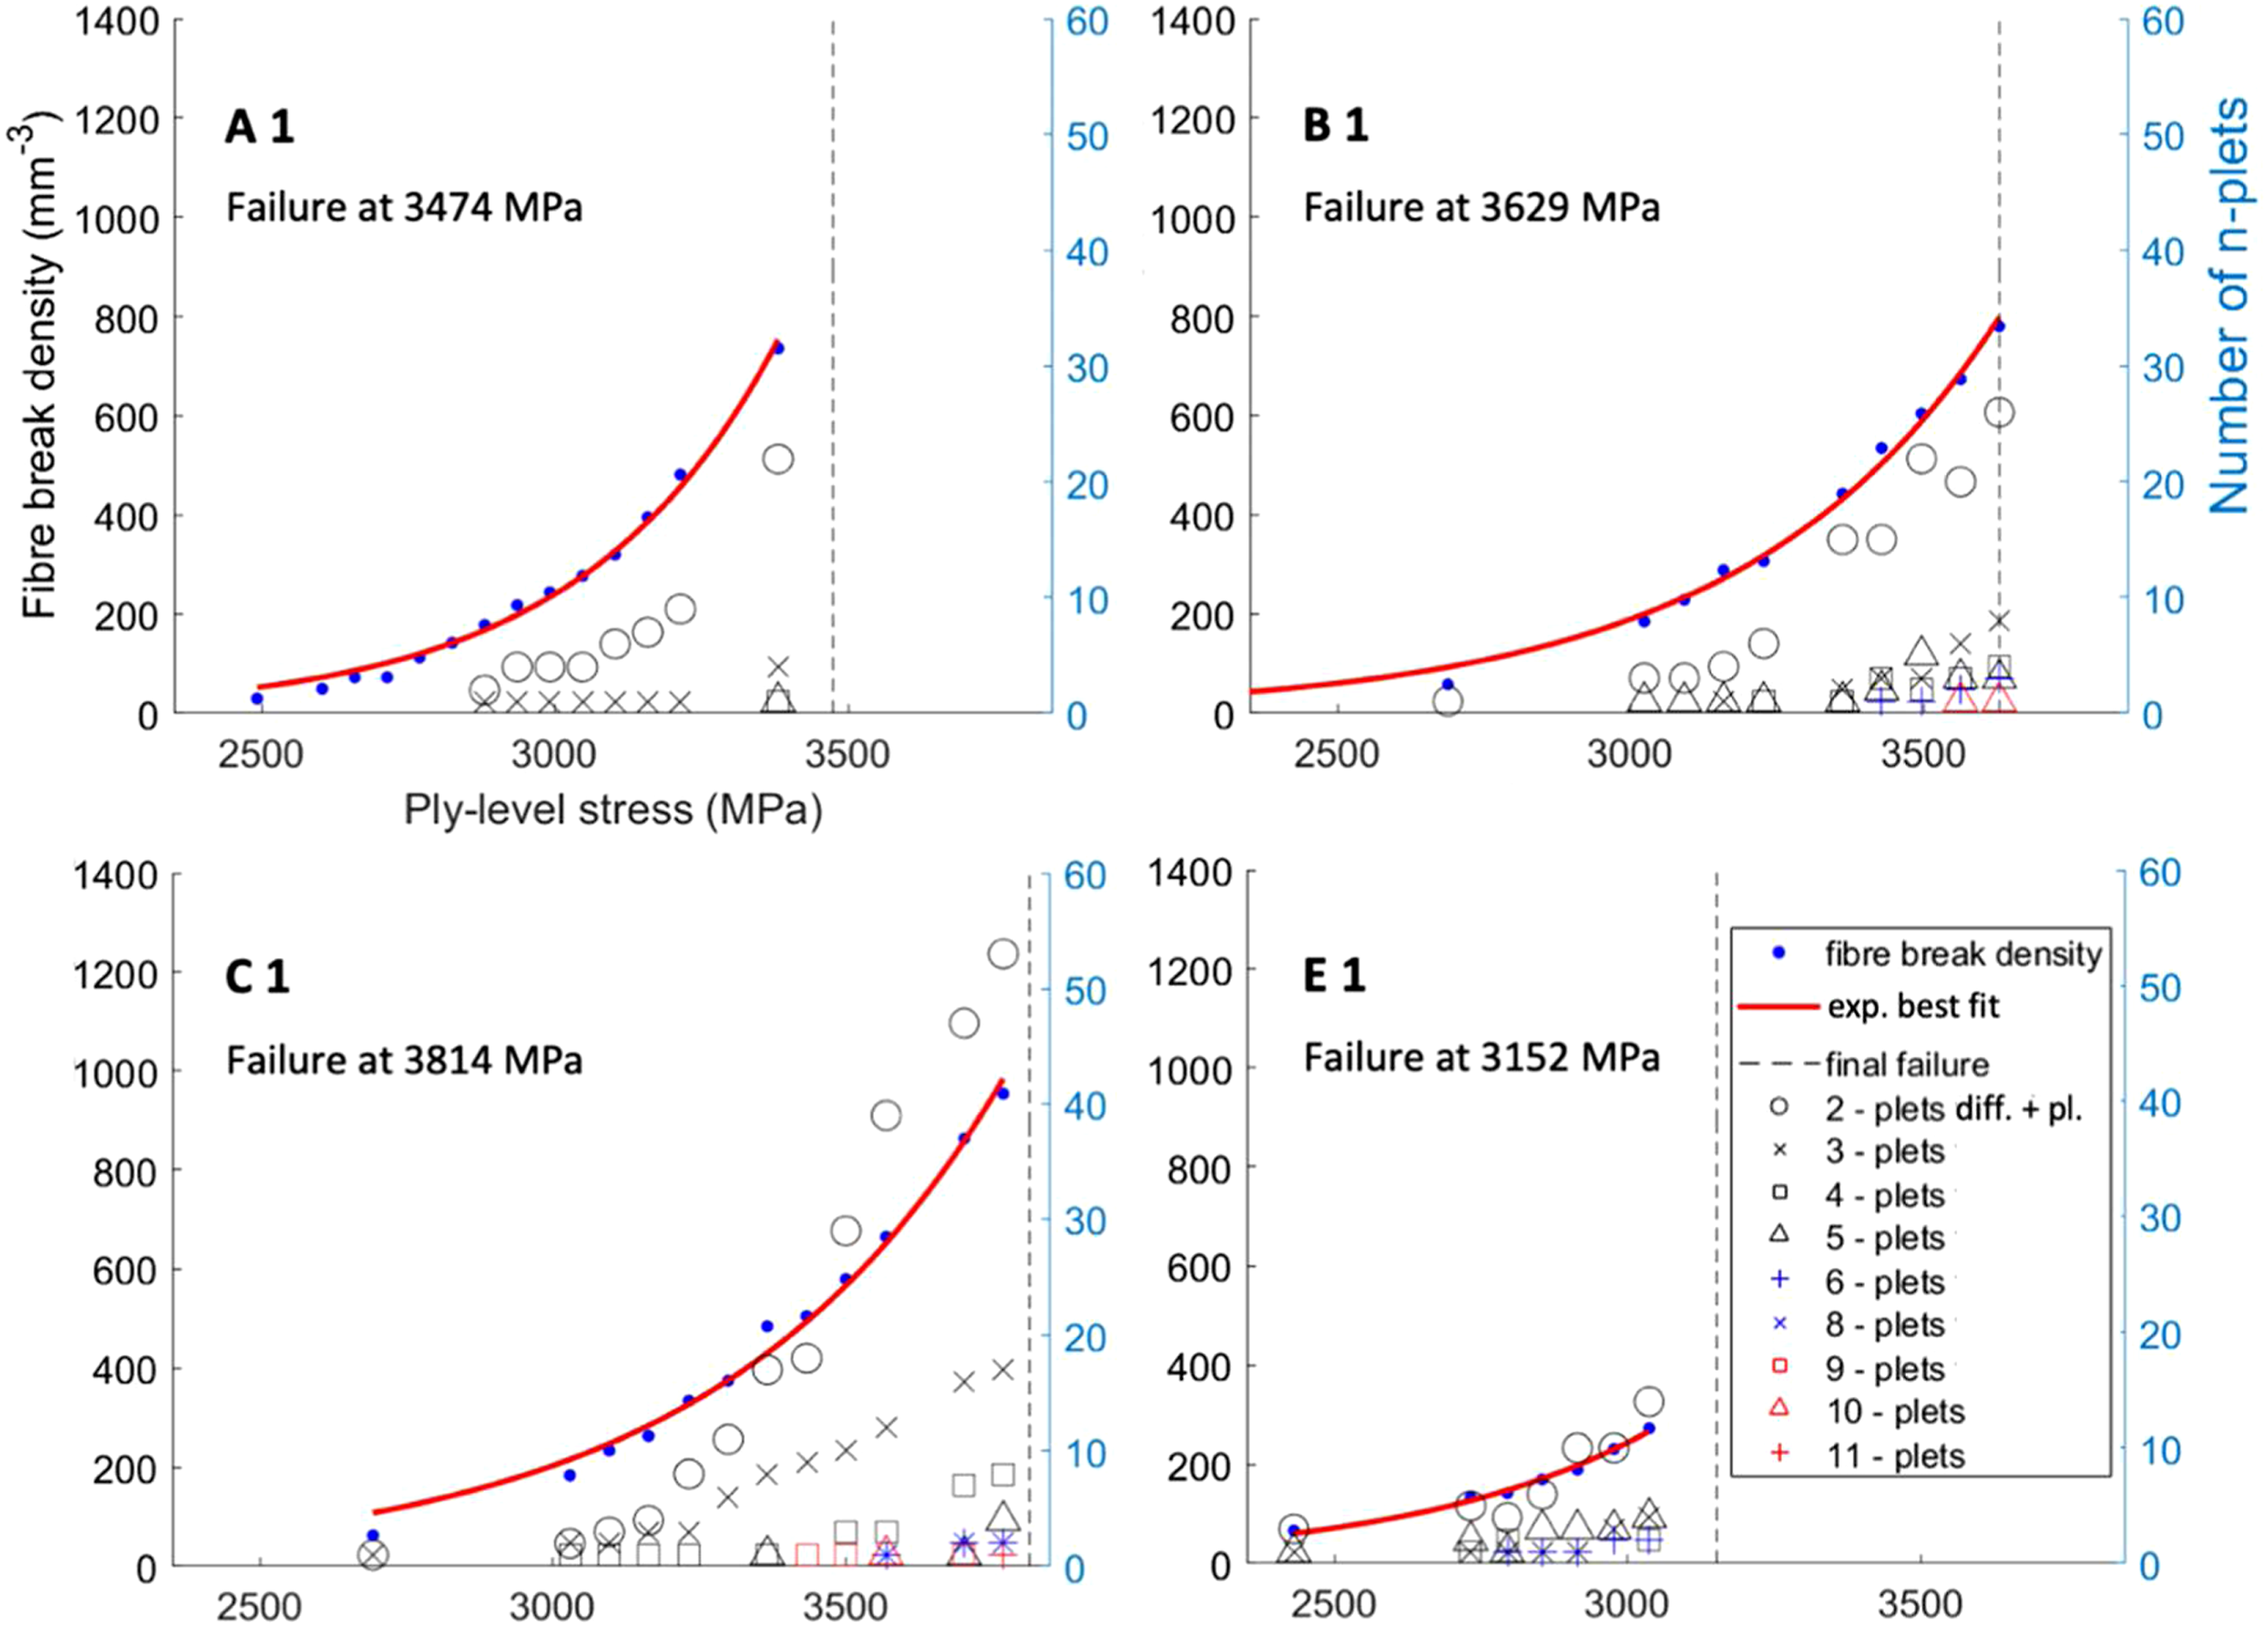
Modifying the surface treatment, obtaining a weaker adhesion, resulted in the coupons exhibiting a higher UTS (as shown in Figure 5), while allowing more damage to be tolerated before failure (see Figure 9). The size (n) of the largest observed multiplets doubled in Coupon B 1, with a 5-plet captured in A 1 at ∼98% UTS and a 10-plet in B 1 at a similar stress level. Between materials A and B, the small multiplet activity is similar (2-plets and 3-plets), but more larger multiplets were observed in material B.
A high multiplet susceptibility for a given stress level is evidently not a simple indicator of strength and the total defect content at failure is clearly material-dependent, with B being the more defect tolerant of the two materials compared here. As will be shown in §4.7 where a different fibre type is adopted, the reason for a similar single fibre break accumulation from low to high strains may be due to the fibre type that is kept the same for the two configurations A and B.
Comparison 2: Change in sizing (A to C)
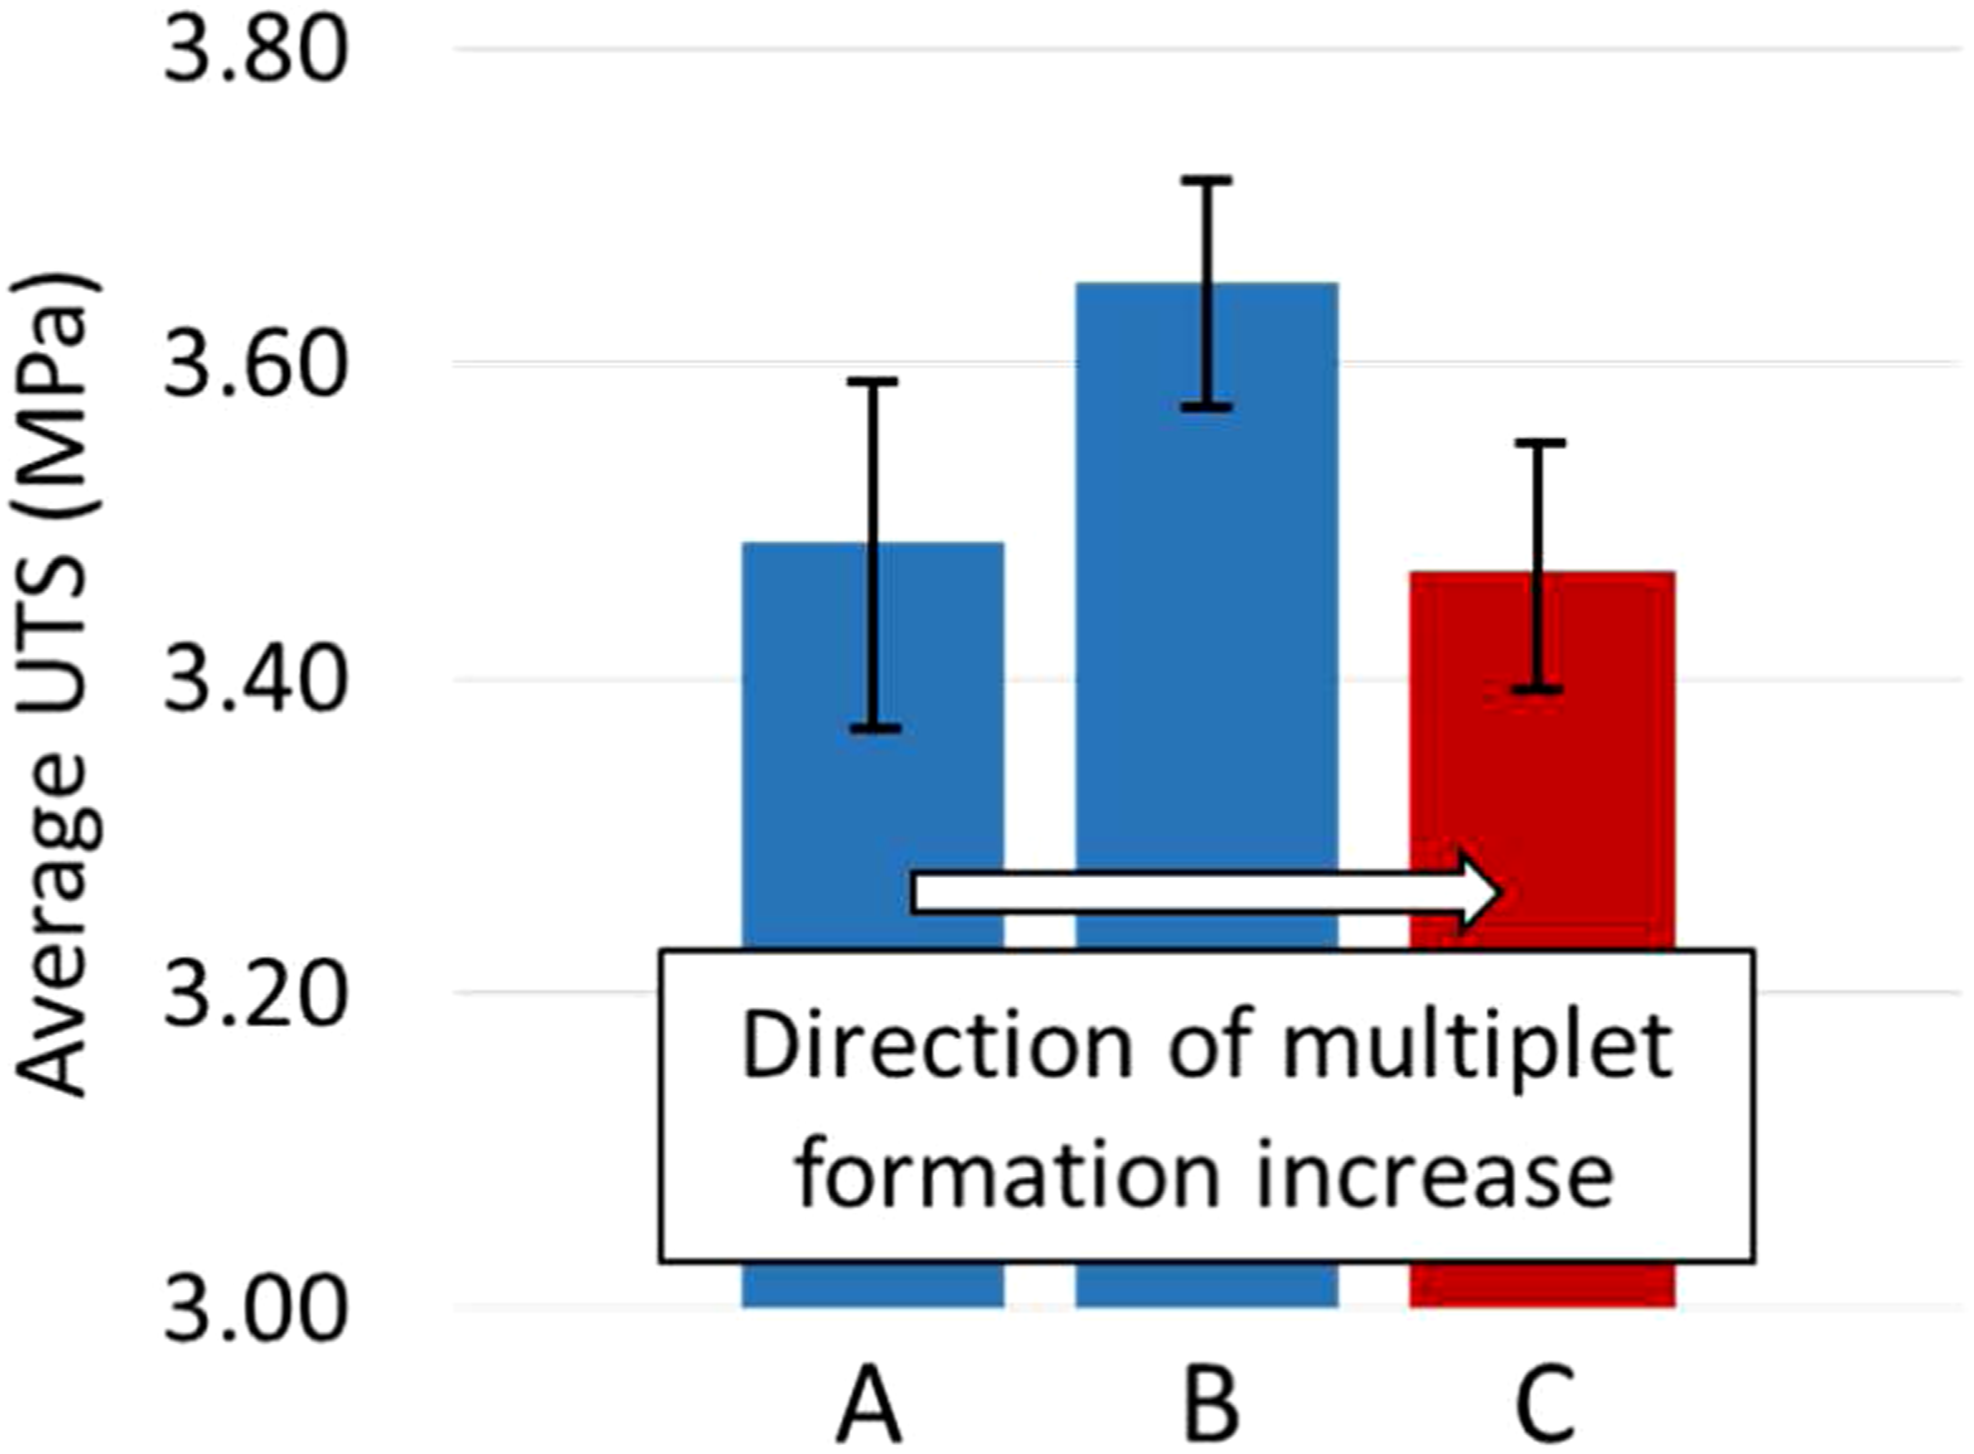
As for Comparison 1 of §4.5 between materials using the same fibre type, the singlet formation versus stress response is very similar. However, for an equivalent level of stress and immediately prior to failure, a very high susceptibility to multiplets for Material C, adopting the sizing type 2 (allows a weaker adhesion than sizing type 1) is observed. The largest multiplet captured before failure for high strains is a 5-plet in A 1 and an 11-plet in C 1. The number of 2-plets observed in C 1 is two times higher than A 1, with C being the material configuration with the highest number of small multiplets (2-plets and 3-plets) observed in this test campaign. The high number of multiplet sites is clear and consistent for repeat coupons and as the two configurations are characterised by a similar average strength (the two coupons presented in Figure 9 have different individual UTS values, but the average values are comparable, as shown in Figure 5), the multiplet build-up and final state cannot simply be linked to the average UTS. An increased defect tolerance is observed when a weaker adhesion is obtained by a change in sizing type.
Comparison 3: Change in fibre type (A to E)
Configuration E is characterised by a larger diameter and a lower nominal fibre UTS: 5.6 GPa of the fibres used in configuration E against 6.5 GPa of the fibre type used for the configurations A to D. The same fibre sizing and interface treatment are adopted as for both materials A and E. The average composite UTSs are 3.49 GPa for material A and 3.14 GPa for material E. As shown in Figure 9, the singlet formation with increasing stress in the two configurations is similar but different by coupon UTS level. However, a rapid onset of 2-plets/multiplets at low stresses as well as a truncation of the singlet accumulation curve by early failure can be observed for material E. In this case, susceptibility to multiplets is apparently coincident with a lower average UTS value. This is in accordance to the fibres of material E having a lower Weibull scale factor than the fibres of material A, and a higher shape factor, leading to higher chances of multiplets appearance.
Planar multiplets
Planar multiplets are best assessed in terms of 2-plets for the materials in this study as larger multiplets are too sparse for a simple comparison. The ratio of planar to diffuse 2-plets typically is in the 40–50% range, with the exception of material E as shown in Figure 10, in which comparison 4 (A 1 vs E 1 of Figure 9) is repeated for planar multiplets only: coupon E 1 appears to be particularly susceptible to planar multiplet formation. It can be observed that a higher number of planar 2-plets form in E 1 in Figure 10 in comparison to the number of total 2-plets of Figure 9. This is explained with the planar defects being also counted within the larger diffuse clusters. Planar 2-plets and n-plets increased rapidly, appearing to be fibre controlled, as the two configurations share the same sizing and surface treatment. Overwhelmingly, the planar multiplets observed in this study have been seen to form at different UTS levels but not grow close to macroscopic final failure (as reported in16,25,26,33). Materials A and E are compared in terms of single fibre break and planar multiplet accumulation. A certain degree of planar damage susceptibility is observed in material E. This phenomenon seems to be fibre controlled, as sizing type and surface treatment are unchanged between the two configurations.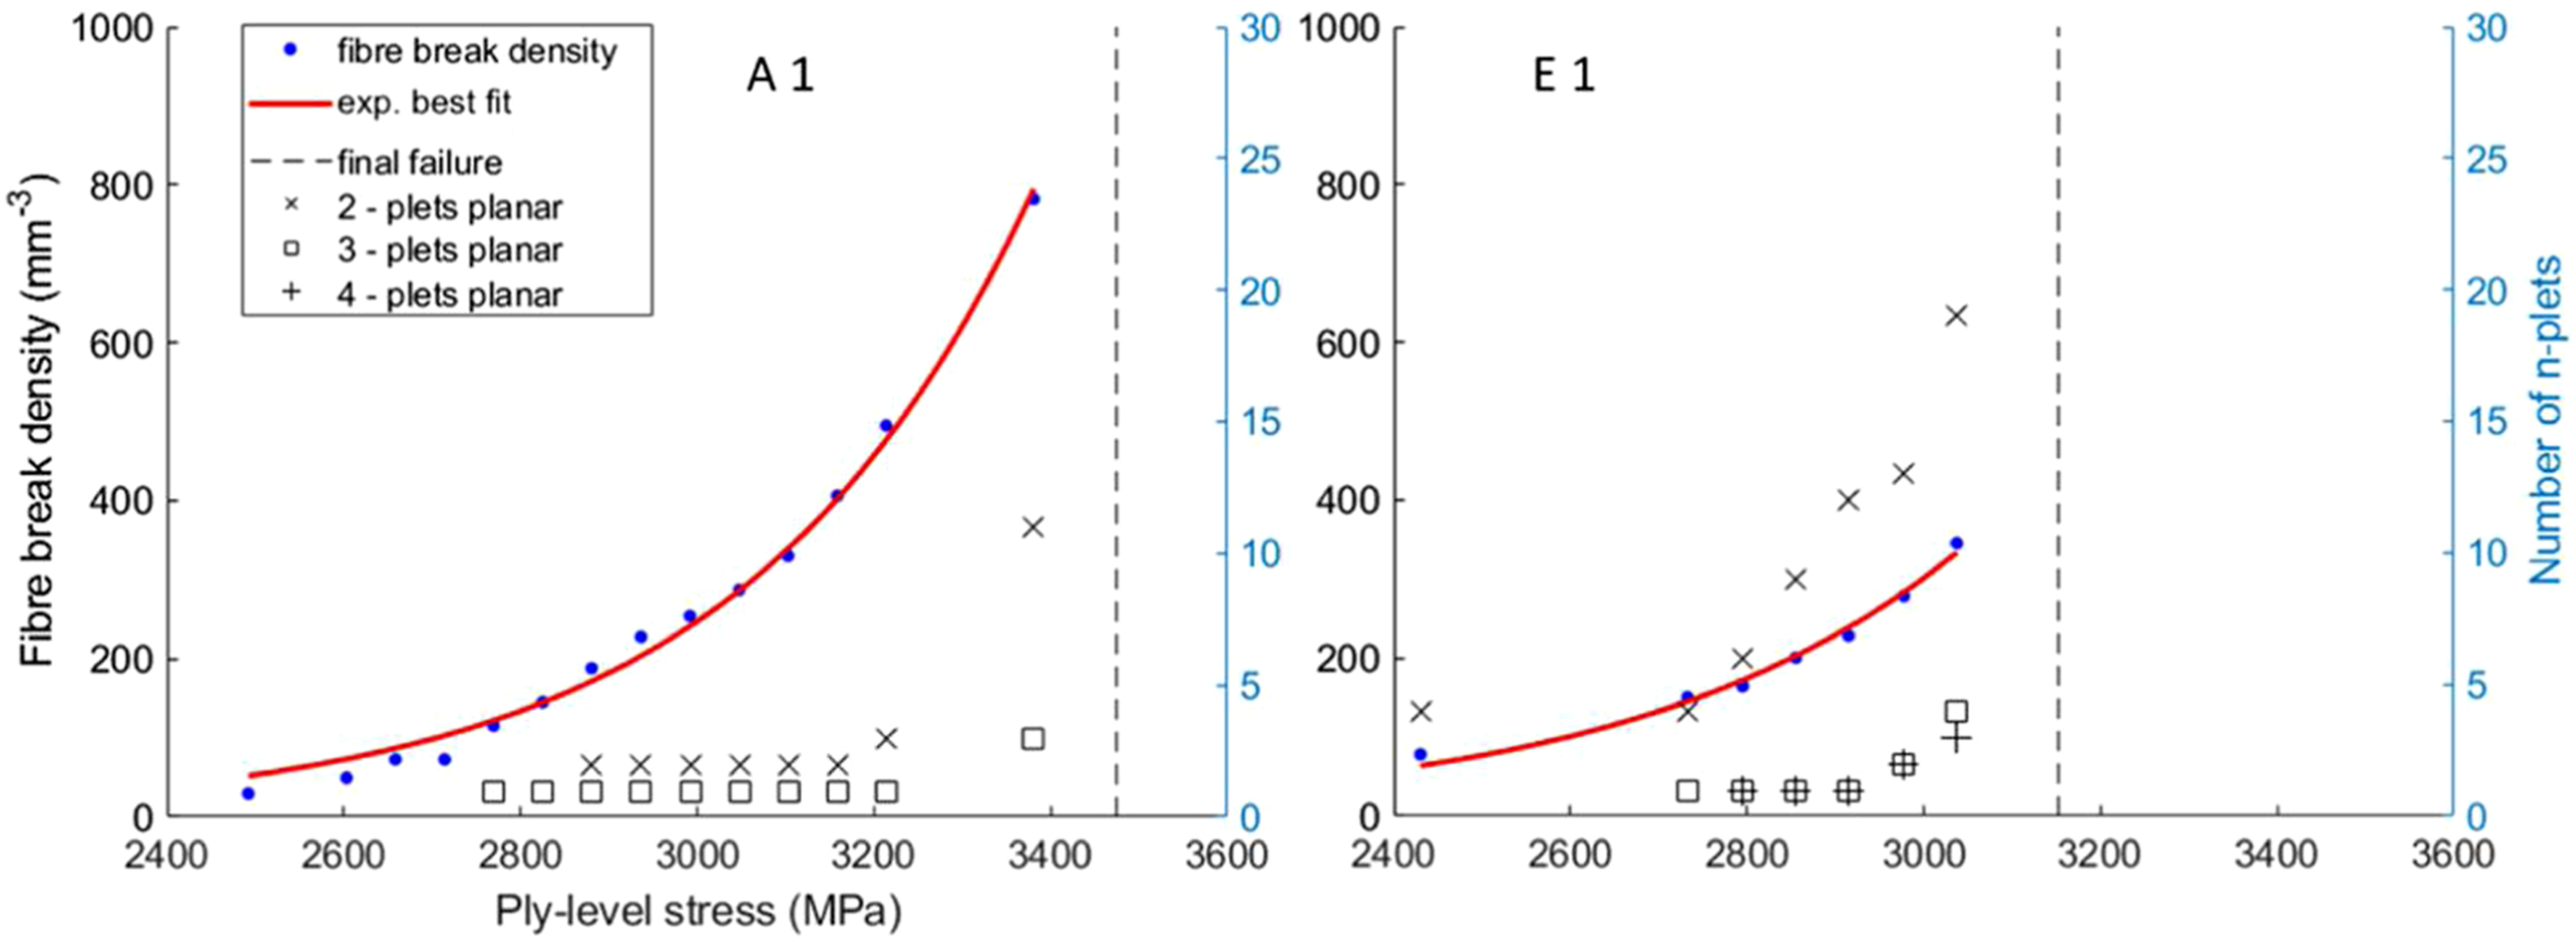
More details of the formation, evolution and local morphology of the planar multiplets observed in this study will be provided in a following publication.
Comparison summary
Across the supplied fibres, sizing and surface treatment types, a number of points are identified: The rate of singlet fibre break accumulation with ply stress appears relatively consistent for these composites (within the experimental scatter), and is independent of UTS and the multiplet behaviour (see Figure 11); The incidence (onset and rate) of multiplet damage accumulation with applied ply stress does vary significantly within the test group; For Materials A to C, the prevalence of multiplet formation increased from A to C, with B being the highest average UTS material and A and C having a similar level of average UTS (see Figure 11). A weaker adhesion obtained through different surface treatment (Materials A to B) led to a comparable number of small multiplets (2- and 3-plets), but a higher number of larger multiplets. An even weaker adhesion (Materials B to C) obtained by changing the sizing type led instead to a similar activity for large multiplets accompanied by a larger formation of small multiplets (see Figure 9). The average UTSs of the three materials which are the main focus of the comparisons, are represented in order of amount of multiplets accumulated before final failure (A to C). The multiplet behaviour appears to be independent of the average UTS value.
Conclusion
An extensive database of performance and damage behaviour at a deep micromechanical level has been generated in this study for a range of materials with different fibres, surface treatments and sizing, to an extent and detail the authors believe has not been achieved before. A semi-automated approach has been developed to precisely quantify the damage progression within in situ tested composite coupons and further areas of application can be considered (e.g. inter- and intra-laminar damage tracking). Automated quantification, repeatability and morphology measures (e.g. planar and diffuse multiplets) have been generated for a large number of SRCT scans. The following conclusions have been drawn from the results: The accumulation of singlets and multiplets indicates that single fibre breaks play no simple role in controlling the average UTS of the material; If a clustering behaviour is to be controlled, both surface treatment and sizing can be modified, consistently with some interface role in load shedding from break sites to intact neighbours; Current materials behaviour appears most readily interpreted in terms of combined influence of: The multiplet formation seems to be primarily influenced by the fibre type and the level of adhesion at the fibre/matrix interface, with the highest percentage multiplet susceptibility; The multiplet formation seems to be primarily influenced by the fibre type and the level of adhesion at the fibre/matrix interface, with the highest percentage defect resistance (maximum scale/frequency of multiplet site that can be accommodated before failure); The multiplet formation seems to be primarily influenced by the fibre type and the level of adhesion at the fibre/matrix interface, with the highest percentage of multiplets being observed in the material featuring the strongest fibre/matrix interface and the highest Weibull modulus fibres, which is consistent with the higher values of local stress concentrations expected on the plane of the fibre breakages and the fibres being more likely to break at closer stress levels to each other;2,34 Of the four configurations adopting the same fibre type, the configuration containing the strongest interface exhibits the highest level of multiplet formation at the lowest stress level, corresponding to its lower average UTS. It is shown that within the configurations tested, a change in fibre surface treatment is more critical than the sizing, in that for a given applied stress multiplets are less extended and larger multiplets are accepted without necessarily leading to final failure of the coupon.
This work represents an experimental effort that is only a first step in the on-going research to better understanding the key failure events in tensile-loaded unidirectional composites. Further comprehensive experimental campaigns are suggested that can provide a better insight into the statistical coupon-level variability as well as the higher level of detail as to the different mechanisms occurring when modifying the fibre/matrix interface.
Footnotes
Acknowledgments
The authors would like to acknowledge the European Synchrotron Radiation Facility for provision of synchrotron radiation facilities and would like to thank Dr Lukas Helfen and Ms Elodie Boller for assistance in using beamline ID19. The authors also gratefully acknowledge Mitsubishi Chemical Co for materials supply, the EPSRC for funding under grant EP/M508147/1 and the μ-VIS X-Ray Imaging Centre at the University of Southampton for provision of tomographic imaging facilities, supported by EPSRC grant EP-H01506X.
Declaration of Conflicting Interests
The authors declared no potential conflicts of interest with respect to the research, authorship, and/or publication of this article.
Funding
The authors disclosed receipt of the following financial support for the research, authorship, and/or publication of this article: This work was supported by the Engineering and Physical Sciences Research Council grant numbers EP/M508147/1.
