
Abstract
This work presents observations of fatigue damage in a quasi-unidirectional polymer reinforced composite made from basalt fibre non-crimp fabric and epoxy. Through observations over large areas, the study provides quantitative observations of the damage caused by the cyclic bending loads, with focus on the damage in the tension-tension loaded region of the specimens. The observations reveals that the fatigue damage mechanism that governs the stiffness degradation of the composite occurs only in regions subjected to tensile stresses. Damage incurred from tensile loads are governed by local interactions between transverse and longitudinal fibre bundles. It is determined that cracks in transverse bundles interact with longitudinal bundles to cause breakage of fibres. These fibre breaks are found to be the main driver for stiffness degradation of the material. Similar accounts exists in the literature based on qualitative observations. The current study provides evidence, in the form of quantifiable observations, to further strengthen the argument for considering the damage mechanism as the main cause of stiffness degradation in quasi-unidirectional non-crimp fabric composites.
Introduction
Cyclic loading is a common cause of failure for fibre reinforced composites, yet the contemporary state of fatigue life predictions are based on phenomenological models of the composite materials to which they are applied. A common type of reinforcement fabric for wind turbine blades are quasi-unidirectional (UD) non-crimp fabrics (NCF). This type of fibre fabric consists of combining a primary part of aligned fibre bundles that are sewn together with a set of smaller off-axis fibre bundles. The possible variation in fabric configuration for NCFs are endless, and there is no established method for assessing the fatigue performance of a fabric without manufacturing and testing the composite material. This is an expensive endeavour for manufacturers, who need to conduct expensive material tests to create phenomenological fatigue models for each type of fabric used in production. In order to move away from phenomenological models towards mechanism-based models, the micro-, meso- and macroscale damage mechanism must be observed and understood through experiments. Modern-day methods of Large-Field-of-View microscopy (LFoV) can enable such observations and assessments of damage mechanisms.
Stiffness degradation of fibre reinforced composites is directly linked to the development of cracks and fibre breaks in the material. 1 For cross-ply laminate composites, a number of researchers have reported links between fatigue damage and transverse matrix cracks.2–4 In uni-directional non-crimp fabric composites, the occurrence of transverse matrix cracking is also present. Still, simple rule-of-mixture calculations reveal that the stiffness loss in fatigue tested UD NCF composites cannot be accounted for by this mechanism alone.1,5 The nature of fatigue damage in composites is an inherently multiscale phenomenon, 2 and even for small-scale coupon tests the damage that causes fatigue can be observed on several scales in fibre reinforced composite materials. Delamination between layers and transverse matrix cracking of cross-ply layers can scale several millimeters, yet stiffness degradation can also be a product of debonding and fracture of individual fibres. The scale of concern in the latter of the mentioned damage mechanisms is in the order of 1–100 µm. Furthermore, the position and frequency with which fatigue damage occurs inside a fibre reinforced composite may be strongly influenced by parameters of the fibre architecture. The relevant parameters of the fibre architecture include fibre bundle tex values, bundle misalignment, angle of transverse bundles, local fibre volume fraction, etc. The fibre architecture is thus classified by the fabric type, and composite lay-up used to manufacture the composite material.
Recent studies of UD NCF composites with X-ray micro-tomography imaging by Jespersen et al.6,7 has shown that damage in the longitudinal bundles of non-crimp glass fibre fabrics often occurs in the vicinity of off-axis backing bundles. The observations made in these studies indicated that transverse matrix cracking in off-axis bundles triggers the initiation of fibre breaks in the longitudinal bundles. Jespersen et al. 8 also showed that the X-ray scanned material did have a significant amount of transverse matrix cracks that were not visible in the X-ray imaging due to the contrast and scale of the imagery. An important implication of the work of Jespersen et al.6–8 is that fibre breakage in longitudinal bundles of UD NCF glass fibre composites is not governed by the variability of the strength of single fibres, but rather by a specific damage mechanism.
The conclusions made by Jespersen et al.6–8 is mostly based on qualitative observations. By using LFoV micrographs, the current work aims to provide quantified observations and results that further proofs the existence of the damage mechanism. The LFoV microscopy method allows such analysis to be performed because the field of view of each of the 36 LFoV micrographs is 100 mm2 while retaining a 2D-resolution of 0.29 µm/pixel. This allows fibre breaks and fibre architecture features, such as transverse bundles, to be observed over the entire area of the LFoV micrograph. Comparison of the position of the fibre breaks and the transverse bundles allows for an assessment to be made on the potential interaction between fibre breaks and cracks in transverse bundles.
The hypothesis dealt with in this work is that in quasi-unidirectional non-crimp fabric composites, the driver for stiffness degradation of the material is fibre breaks, and sequences of fibre breaks, which are initiated by transverse tunnel cracks in the transverse bundles of the fabric (ie. the 90° sub-layers). To establish objective evidence for the hypothesis, locations of transverse fibre bundles, cracks in the transverse bundles, and location of the fibre breaks are quantified using both manual and semi-automated image analysis tools. The resulting quantified observations are used to show that fibre breaks are not randomly distributed in the load-carrying bundles of the composite, but are far more likely to occur near transverse fibre bundles that contain tunnel cracks.
The test method applied in this work is based on a fatigue 4-point bending test modified for cyclic loading. 9 The through-thickness stress variation caused by the bending loads allows microscopy specimens to contain areas where stress variation exists if the plane of observation is large enough to extend over the entire thickness of the specimen. Most works on bending fatigue have applied either 3-point10–12 or 4-point13–15 bending test methods as the basis for performing cyclic bending tests. Marsden et al. 15 successfully applied a 4-point bending test to investigate fatigue and matrix cracks in thin carbon fibre reinforced polymers (CFRP). Marsden et al. reported crack densities, measured as the length of transverse matrix cracks per area, in cross-ply CFRP but reported that the crack density were not a useful parameter for predicting residual fatigue life.
The observations made in the current study is based on nine specimens, all cut from the same plate of composite material, which were subjected to cyclic bending loads. All specimens have been tested with the same load level but subjected to a varying number of loading cycles. The fatigue tests have been stopped prior to the failure of the specimens. From each specimen, a 28 mm long centerpiece of the gauge area was cut out and further divided into five pieces by cuts along the (0°) lengthwise axis. Four of those pieces were cast into epoxy and polished for the LFoV micrographs to be obtained. The LFoV micrographs provided observations across the scales from macro to micro-scale. The macro scale is here defined as details and structures that can be observed by the human eye without optical enhancement, while the micro-scale is defined as features that can only be observed through optical magnification. Specifically, for the application in this study, the extended field of view created by LFoV micrographs is required when relating observations of individual fibre breaks in longitudinal bundles to the positions of transverse backing bundles. This requires a field of view where multiple transverse backing bundles are included but with level of details where the fracture of a single fibre of 15 µm with crack opening on less than 1 µm can be detected. This also defines the meso-scale in the current study; Observations of micro-scale events that are governed by architectural features that requires a field-of-view much larger than what can be achieved in a single micrograph of reasonable resolution.
The LFoV micrographs produced in this work are available online in accordance with the FAIR Guiding Principles for scientific data management and stewardship. 16 The data are published by Mortensen et al. 17
Materials and testing procedures
Composites made from uni-directional basalt fibre non-crimp fabric
The composite material used in experiments in this work is manufactured from quasi UD NCF made from basalt fibres. The matrix was a commercially available bisphenol-A epoxy system. Each non-crimp fabric consists of basalt fibres arranged with load-carrying longitudinal fibre bundles amounting to an area weight of 357 A schematic illustration of how the plane of observation of the 36 Large-Field-of-View microscopy micrographs looks like and how the respective layers are loaded by the normal stresses that are imposed by the bending moment.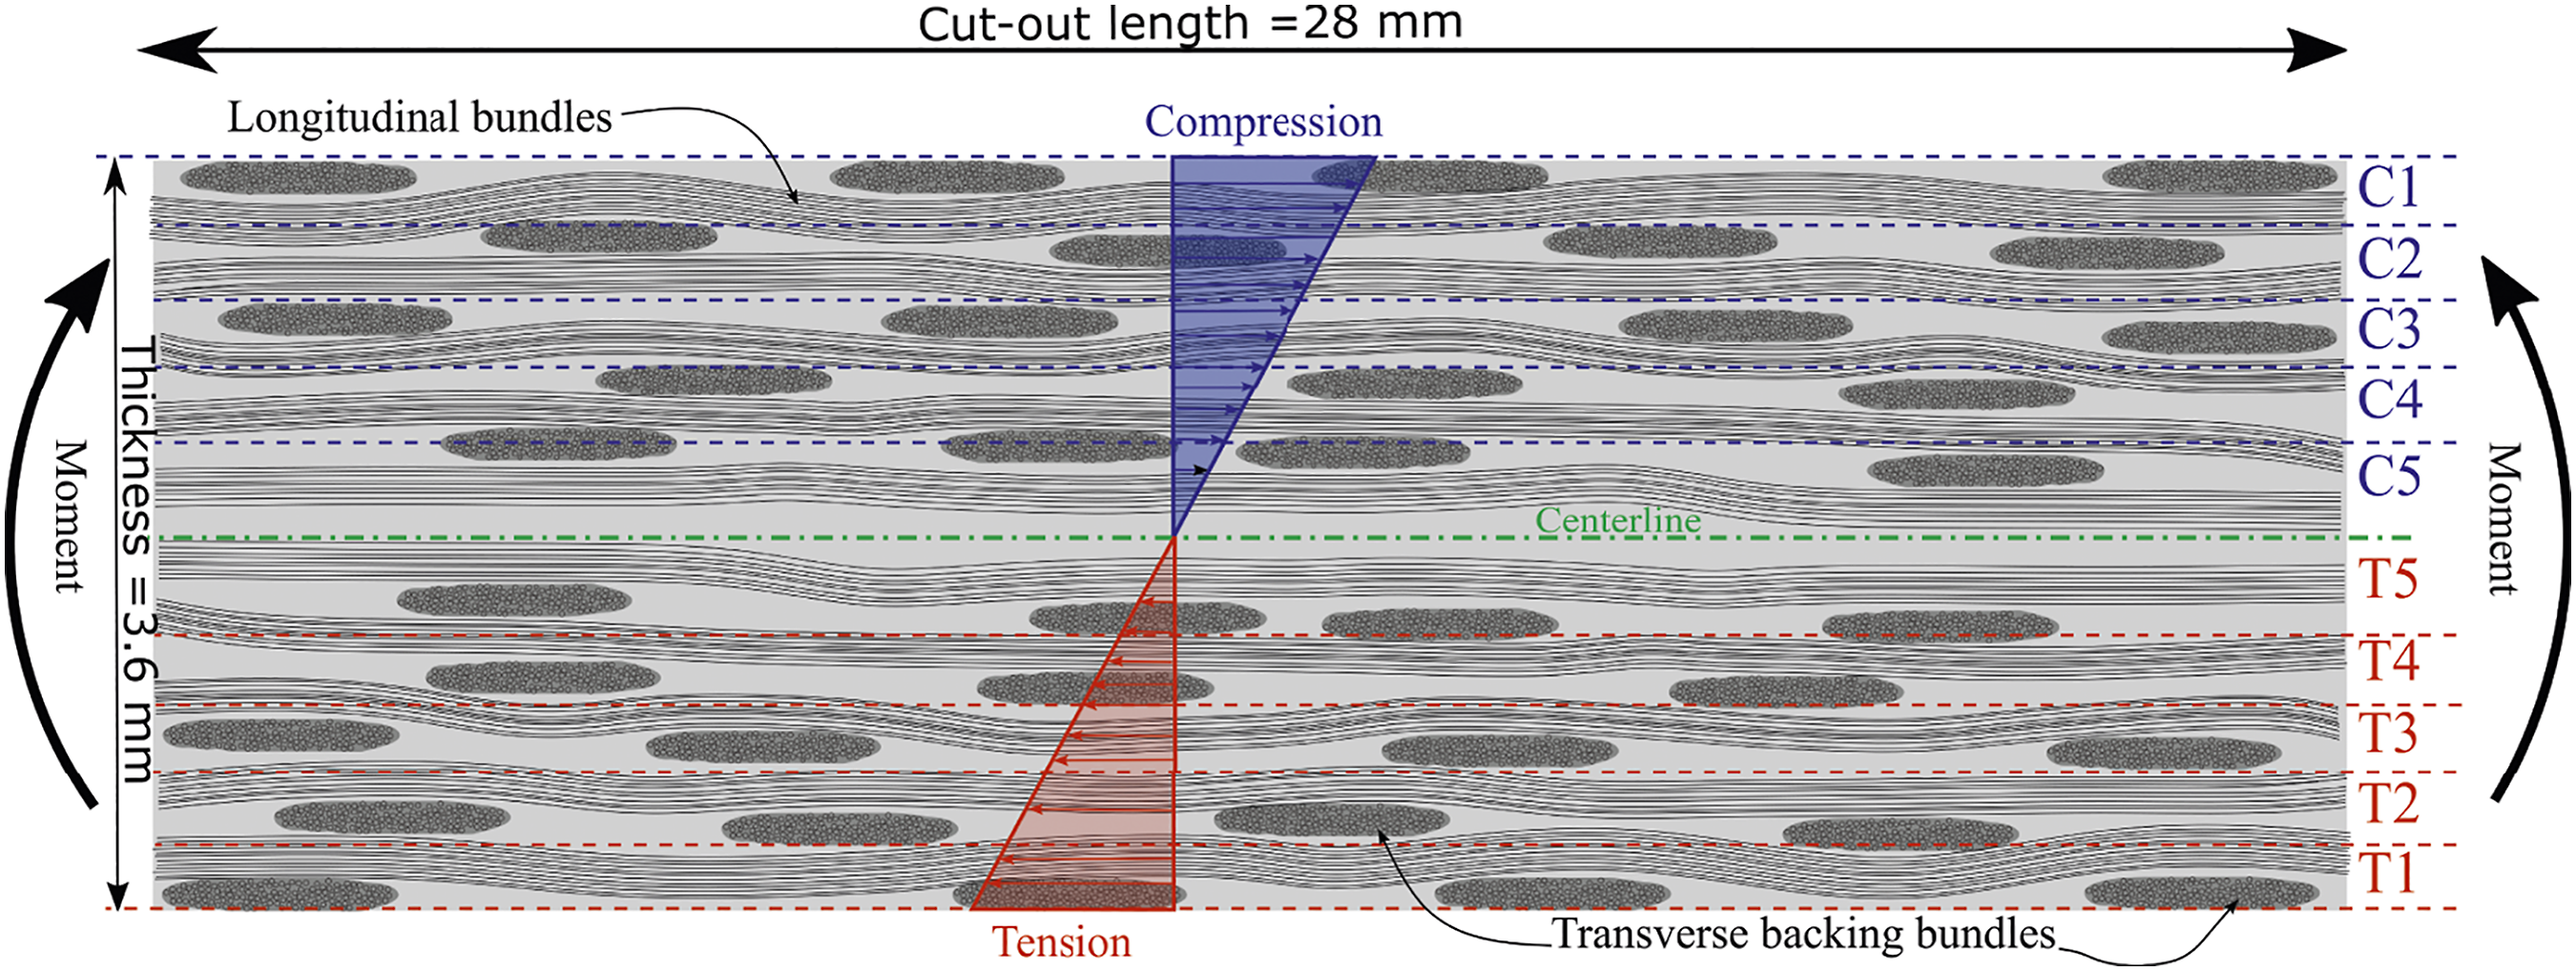
Figure 1 shows a cross-section of how the stacked laminate structure appears in the microscope. The backing bundles of the fabric are stitched to one side of the axial fibre bundles. A symmetric fabric lay-up was achieved by stackingthe fabrics with the backing bundles facing outward of the geometric center of thickness. The symmetry assures that, during bending loads, the neutral axis and geometric center of thickness are coinciding. The composite stacking sequence of the material is then
The basalt fibres used in the fabric have properties that are similar to those of commercially available glass fibres, and as such the results and conclusions presented in this paper should generalize to glass fibre reinforced polymers. Tensile strength and tensile moduli for basalt fibres are generally superior to E-glass fibres and comparable to S-glass fibres,19–21 although basalt fibres show larger variability. 22
4-point bending test
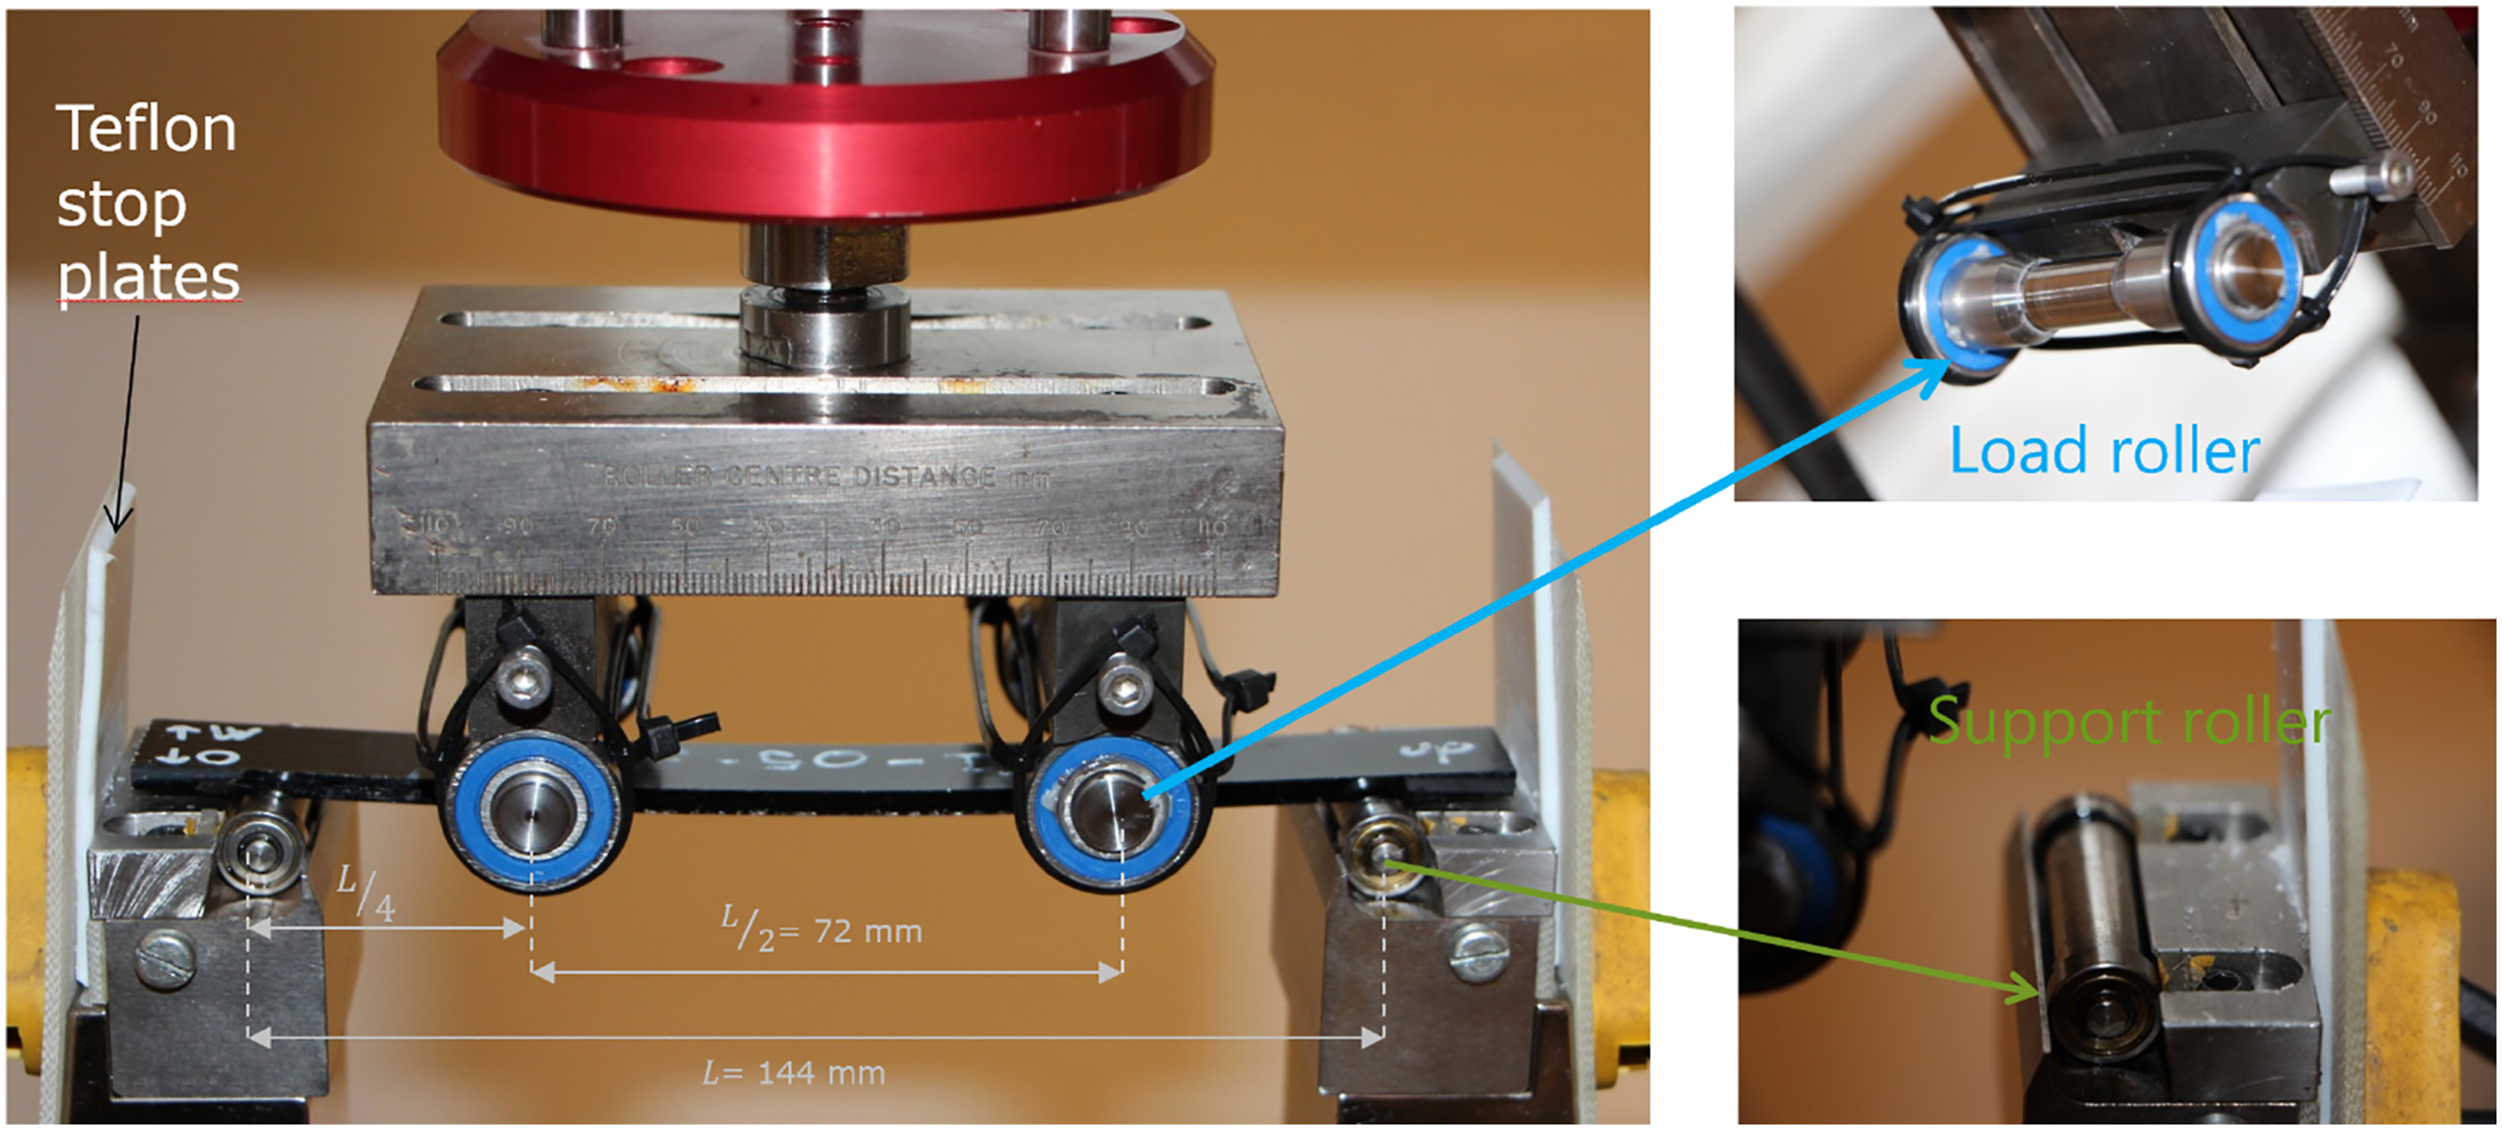
All mechanical testing was conducted on an Instron electropulse E3000 with a ± 5 kN load cell and was conducted in load control. The test machine was fitted with the four-point bending fixture depicted in Figure 2. The effect of friction from rollers and large deflection of specimens during testing are addressed in the work of Mortensen,
9
and the method suggested for correction in that work was applied to the results. Image highlighting the modifications made to the test-rig in order to perform bending fatigue experiments. Stop plates are made from Teflon sheets. The diameter of the load rollers are Ø10 mm where the rollers are in contact with the bending specimens. The support rollers are also of diameter Ø10 mm. A detailed description of the test set-up is availabe in Mortensen.
9
The fatigue resistance to bending loads of the basalt-epoxy composite are presented in the semi-logarithmic S-N curves in Figure 4. Each black square in the graph represents a specimen tested to failure, and the load level has been defined as the maximum stress occurring in the specimen (ie. the stress level at the upper and lower surfaces in layer C1 and layer T1). All stress calculations were performed based on the procedure suggested by Mortensen 9 with the assumption of no friction. 9 The point of failure for a given test specimen has been defined in this study to be the point at which the specimen had lost 15% of its original secant stiffness as defined in the ASTM 790 standard. 23
The nine specimens that were prematurely stopped for microscopy observations are marked by blue points in Figure 4. The applied load for all of these tests was 780 N, which imposes a maximum bending moment of 14 Nm during the fatigue test. The resulting maximum strains in the layers are shown in Figure 3. Global strain level (ɛ
x
) for the composite specimens during peak load during fatigue testing. The strain values listed in the graph is the strain in the center of each of the sub-layers.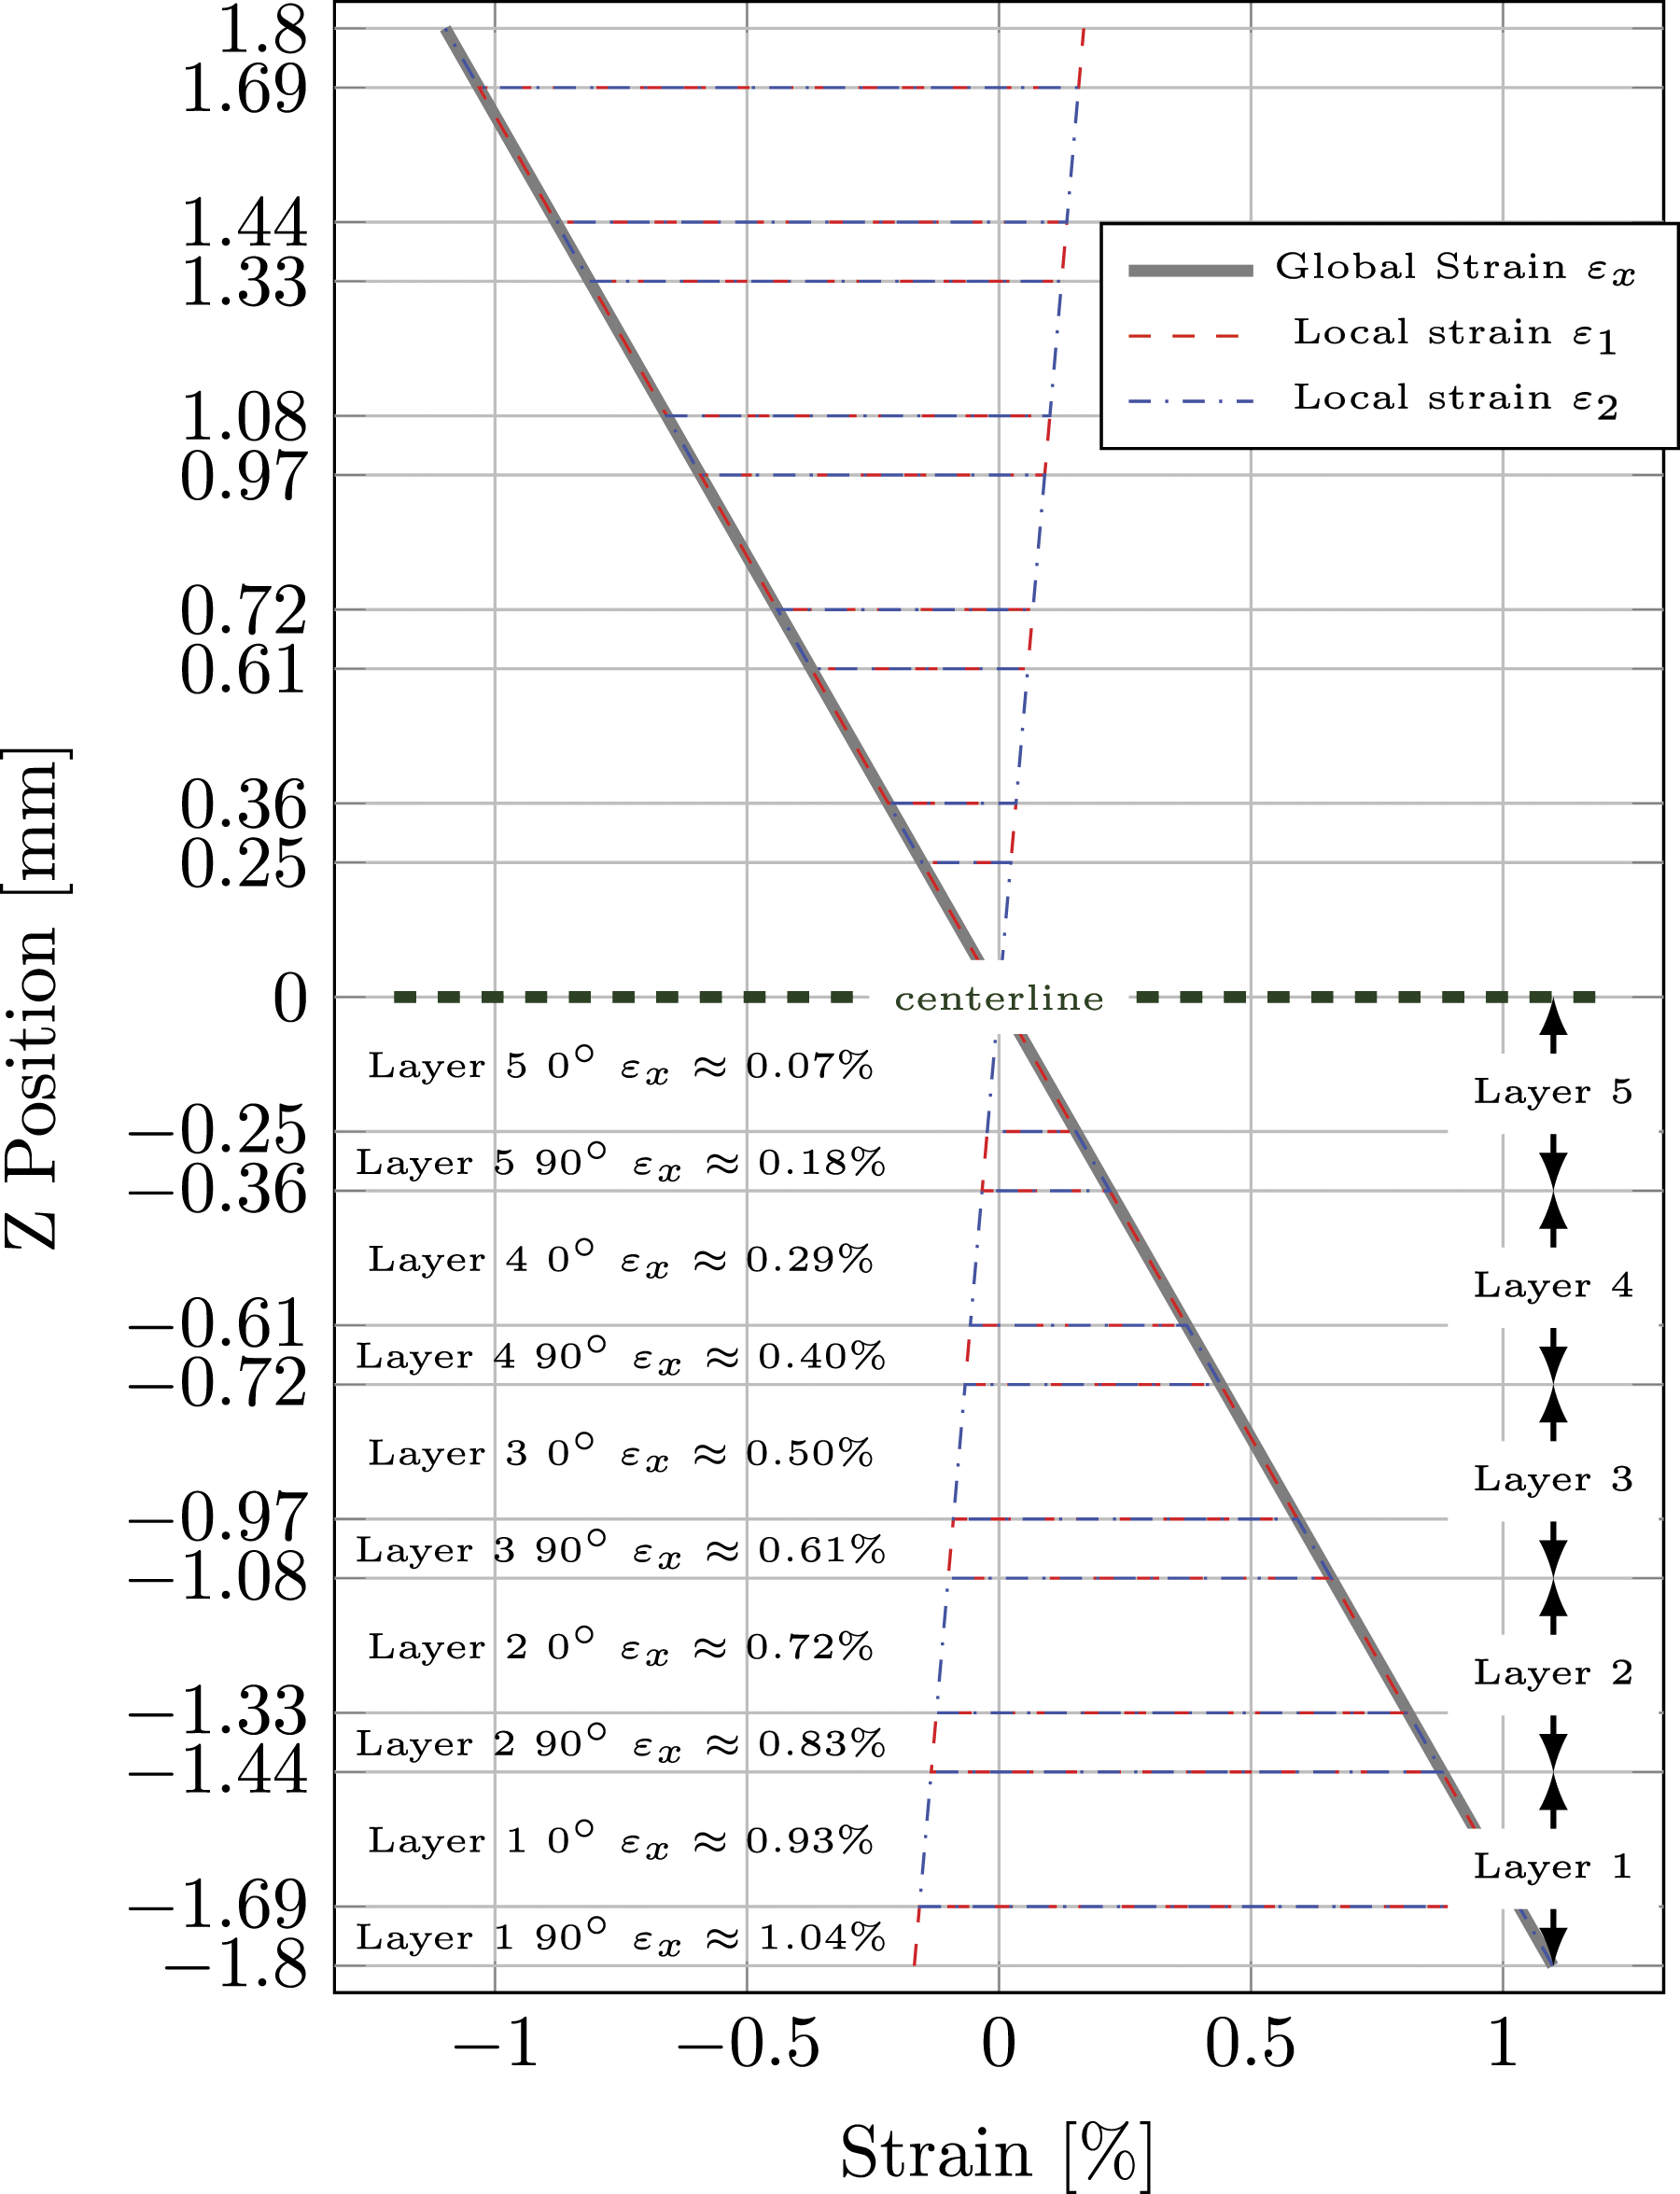
With the described loading, specimen failure was predicted to occur after approximately one Mill. load cycles. The amount of applied loading cycles for the interrupted test specimens were: 2,500; 5,000; 10,000; 25,000; 50,000; 100,000; 250,000; 500,000; and 1,000,000 as indicated with blue markings in Figure 4. The points of interruptions of tests were chosen to have three points for each decade (log-scale) of loading cycles. S–N curve for the bending fatigue of the Basalt/Epoxy material tested on the 4-point-bending-test equipment. The blue points represents the interrupted tests, and the labels near the blue points indicate the number of cycles before premature stoppage of the test for microscopy observations.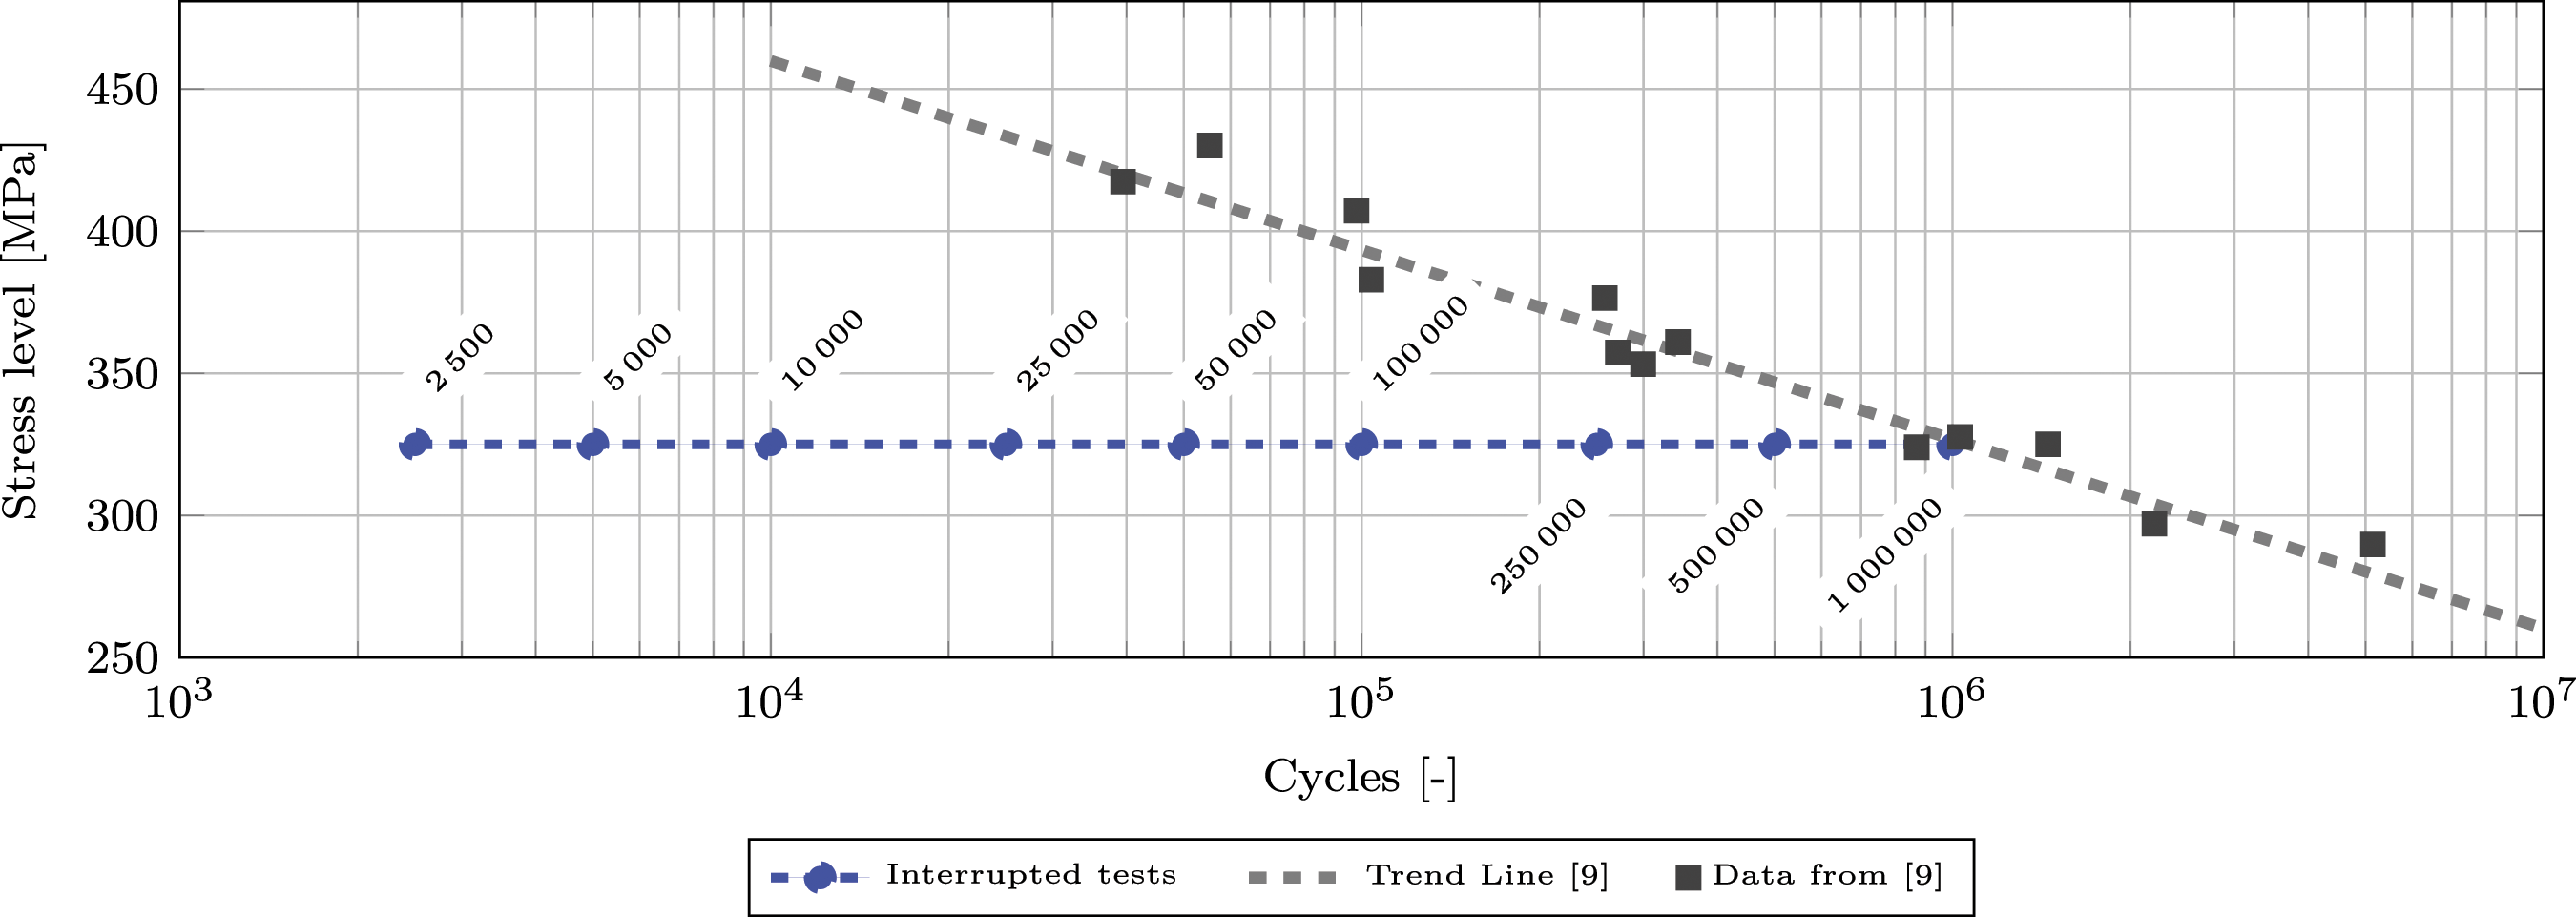
Large-field-of-view microscopy
`From each of these nine specimens, that were subjected to the interrupted bending tests, a central piece of length 28 mm was cut out and further divided into five pieces. A top-view schematic of where the incisions were made, is shown in Figure 5. Four of the pieces were mounted in epoxy and polished for LFoV microscopy. The observed surfaces of the LFoV micrographs were all chosen such that their normals were pointing in the direction of the width-center of the specimen. The surface area of each of the pieces was roughly 3.6 mm times 28 mm, resulting in ∼100 mm2. Schematic of cut-out pieces as they would be seen from a top-view of the full specimens. The dashed lines represents incisions, and the red dashed lines indicate the cuts that create the surface planes used for observations using Large-Field-of-View microscopy microscopy.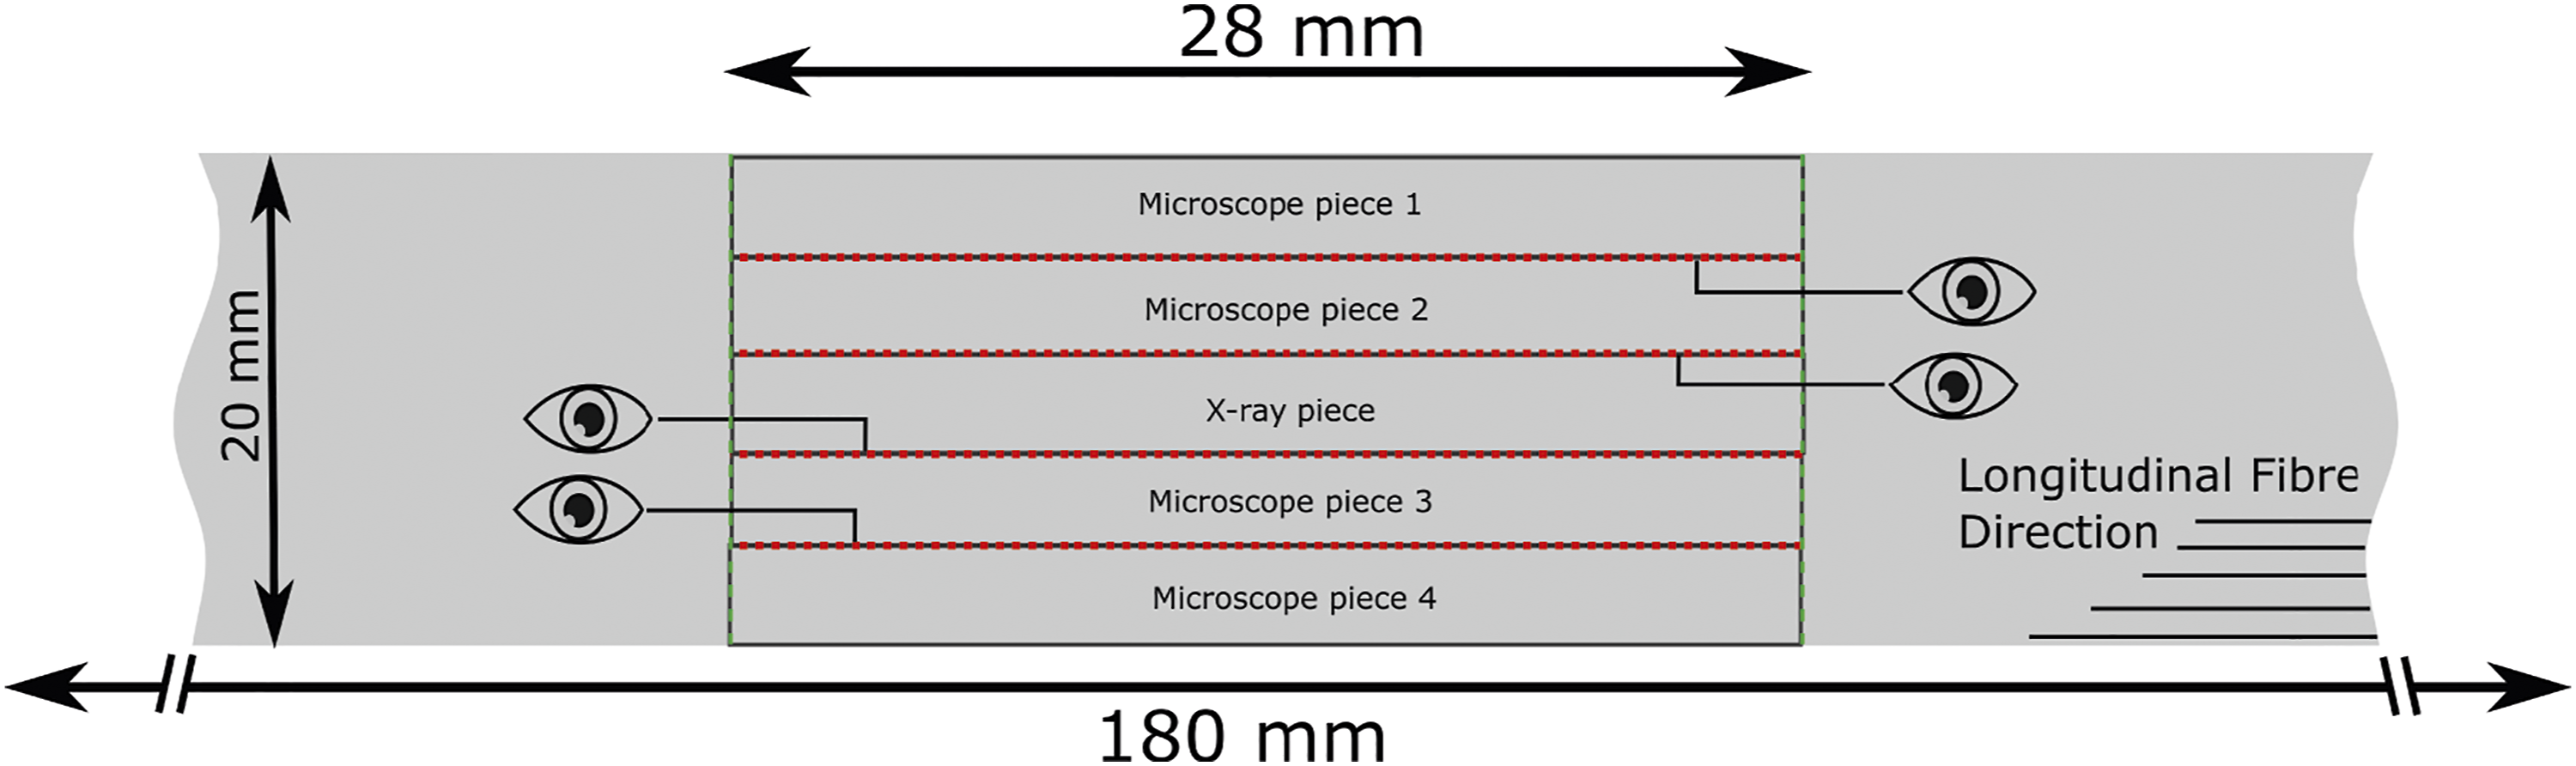
The main tool used for recording and observing micro-scale damage in this study was optical light microscopy. A Leica DMI5000-M microscope with an XY-stage capable of capturing images (micrographs) in an overlapping grid with a resolution of 0.29 µm/pixel was used. Grids of 700–800 images were captured and stitched together to create images with resolutions in excess of one gigapixel. These LFoV Micrographs provides ultra-high-resolution images that allow small details, such as single fibre breaks, fibre debonding, and micron scaled matrix cracks, to be observed over representative plane-of-observation covering roughly 100 mm2 each. Image stitching was performed using a MatLab routine where only rigid translations (i.e. no distortion transforms)
Figure 6 illustrates the scale of the applied technique in terms of image size and physical size of one of the 3.6 mm by 2.8 mm samples observed in this study. A total of 36 LFoV micrographs of similar size as depicted in Figure 6, as four LFoV micrographs were made from each of the nine different specimens tested for this study. All images in this study are oriented in the lengthwise direction of the bending specimens, meaning that longitudinal fibres run horizontally in the image, and the thickness of the composite plate material is oriented vertically in the image. All LFoV micrographs and images also follow a convention of orientation such that the lower half of the LFoV micrograph is always the part that has been subjected to tensional stresses, and the upper part is where compressive stresses have prevailed. Using the notation of layers described ealier in the materials section means that the layers designation from the bottom to the top is: T1,T2,..,T5,C5,C4,.., C1 for all images shown in this paper. As mentioned earlier, Figure 1 shows a schematic drawing of how the LFoV depicts the composite materials, how the load relates to the LFoV, and also the layer notation used in the article. Illustrations of an actual Large Field of View micrograph with detected transverse fibre bundles. The magnified rectangle shows a detected bundle (the blue circles enclosed by the black dashed line) and markings of nearby fibre break (the red circles).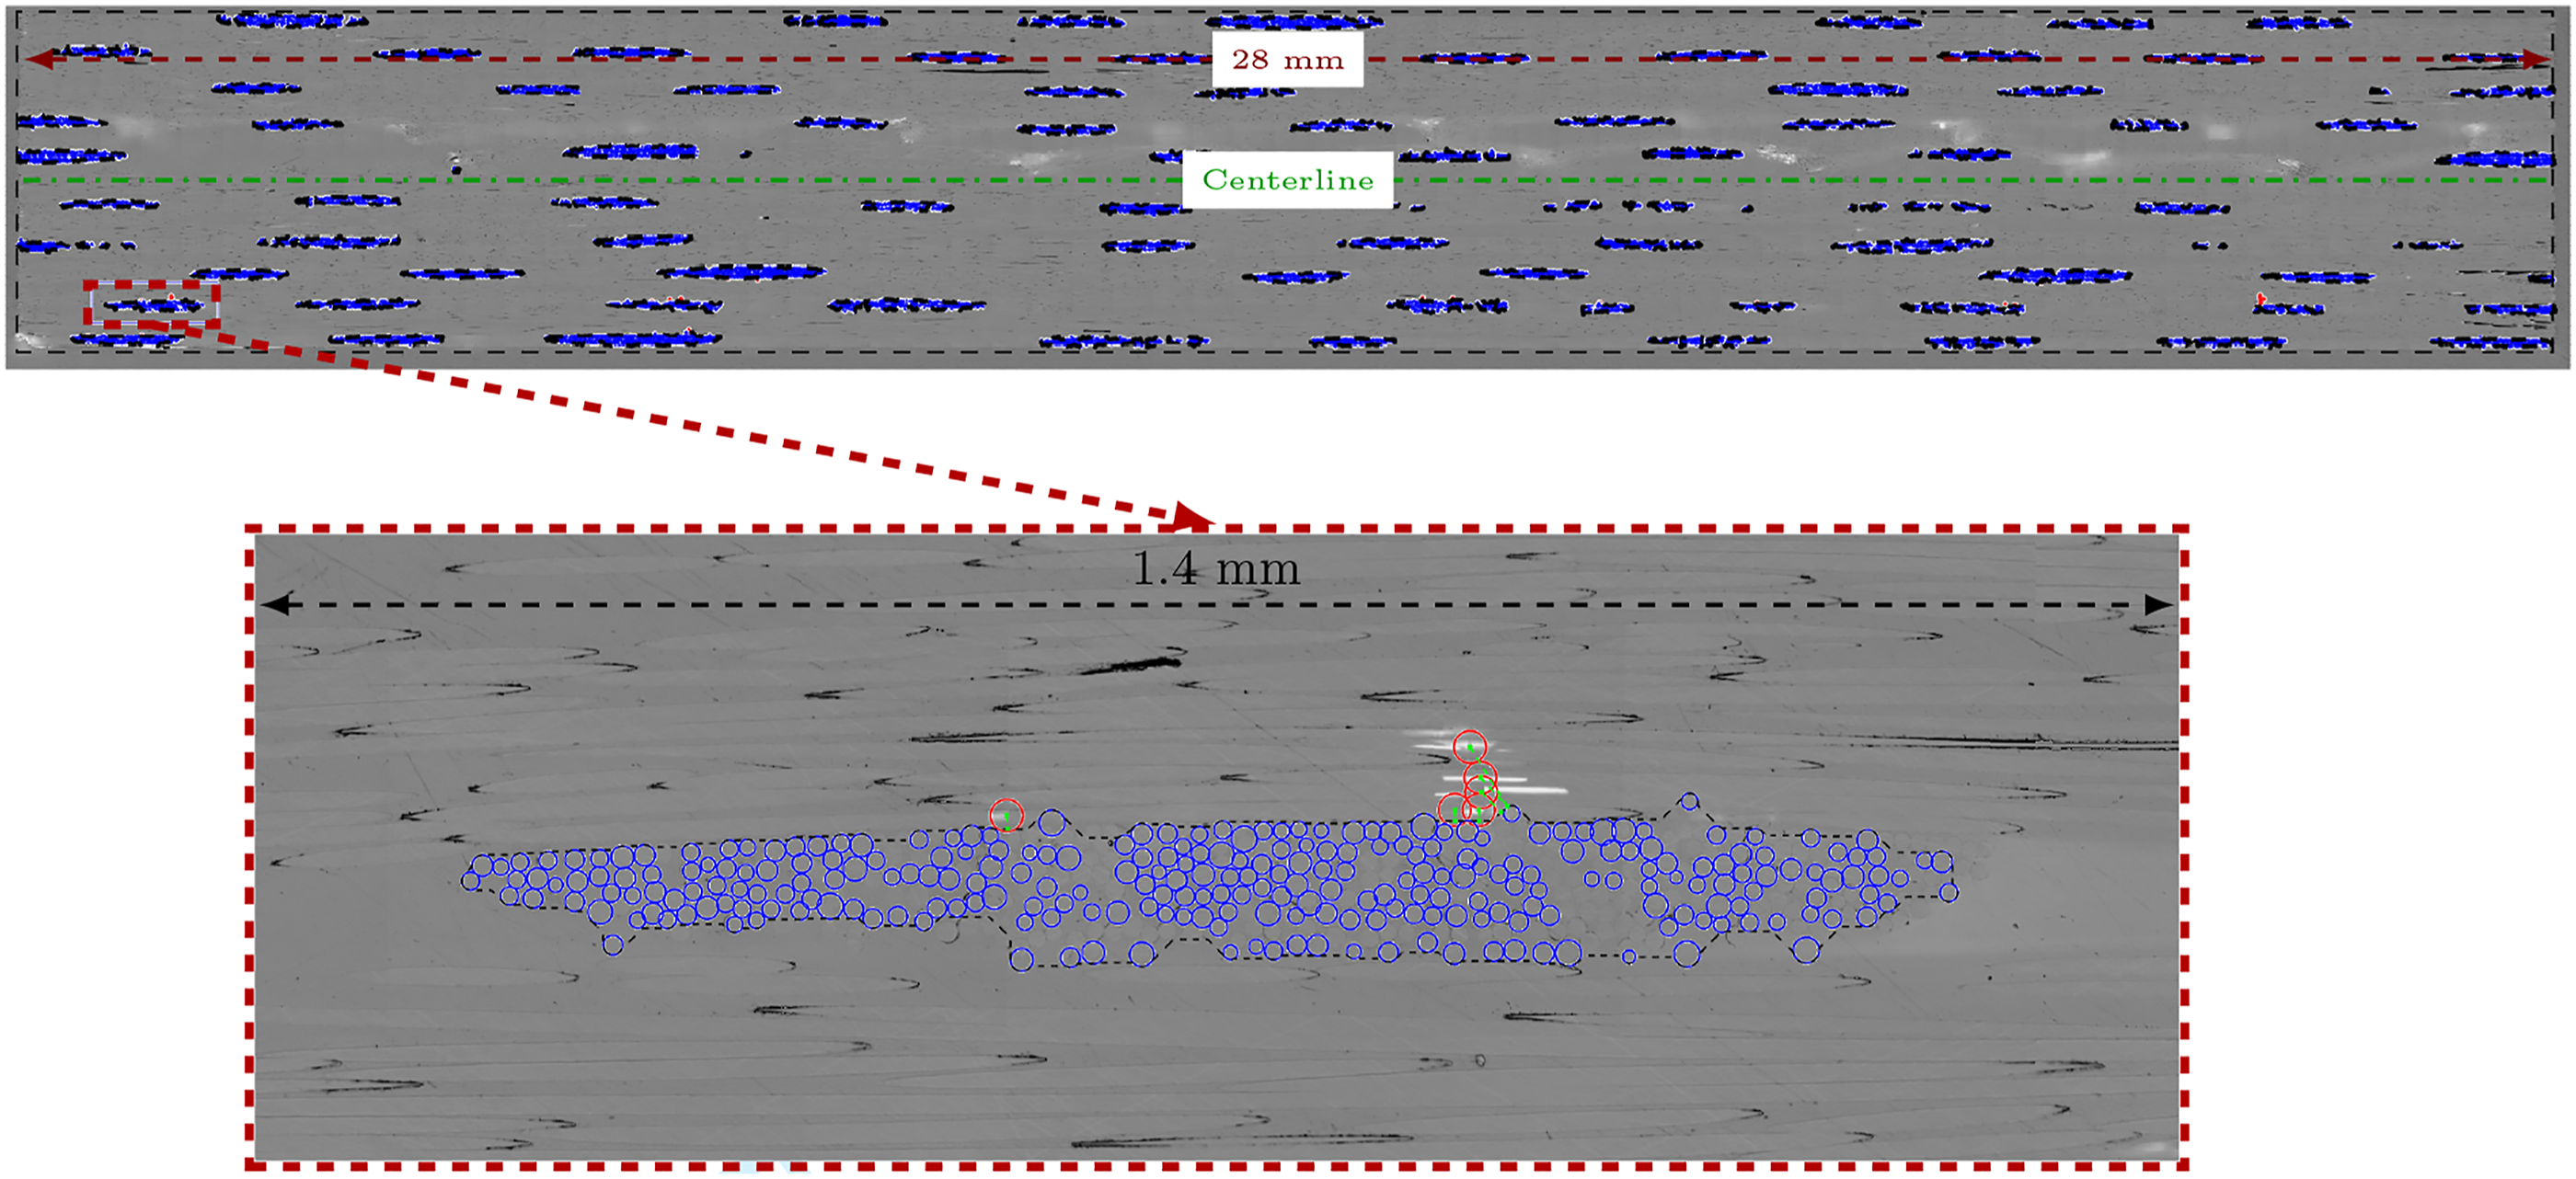
Image processing method for LFoV micrographs
An important use of the LFoV microscopy is the quantification of where, and how frequently, fibres in the longitudinal direction experience breakage. The position of fibre breaks relative to the neutral axis are especially important becauseo of the bending loads. This position determines the expected strain level of the material at the point of a fibre breaks. The position of fibre breaks and transverse cracks were manually annotated and recorded for all LFoV micrographs. Transverse backing bundles in the LFoV micrographs were located using a circle detection algorithm combined with a density-based clustering algorithm. The density-based clustering algorithm found clusters of fibres with at least five fibres where none of the fibres were further than four fibre radii away from the closest adjacent fibre. While the circle detection algorithm generally found a large number of false positives, almost all of the falsely detected transverse fibres were eliminated as they generally failed to encompass the criteria of the density-based clustering algorithm. The result of this procedure is shown in Figure 7: blue circles represent the identified circular fibres of the transverse bundle and the dashed black line around the bundle represents the contour that encloses the transverse bundle. The red circles in Figure 7 show the position of manually recorded fibre breaks. The layer separation is shown with the green opaque dashed line. With information on both boundaries and positions of the transverse bundles, as well as the position of fibre breaks, the relative distances from fibre breaks to bundles are intrinsically known. Due to a specific damage mechanism, which is discussed later in this paper, that distance constitutes a significant parameter. Furthermore, transverse cracks in the transverse bundles were also recorded manually. The characteristics of these cracks and the relevant quantified data are further detailed in the Micro-scale damage section. Extracted sub-images that illustrates the method of processing the positional relation between transverse backing bundles of fibres and the breakages of individual load carrying fibres. The blue circles are detected transverse fibres, the black dashed line shows the detected boundary of the transverse bundle. The red circles are areas of fibre break damage, and the green line represents the distance from broken fibre to transverse bundle. The transverse cracks in the bundle are indistinguishable in the image because the blue circles that mark the transverse fibres.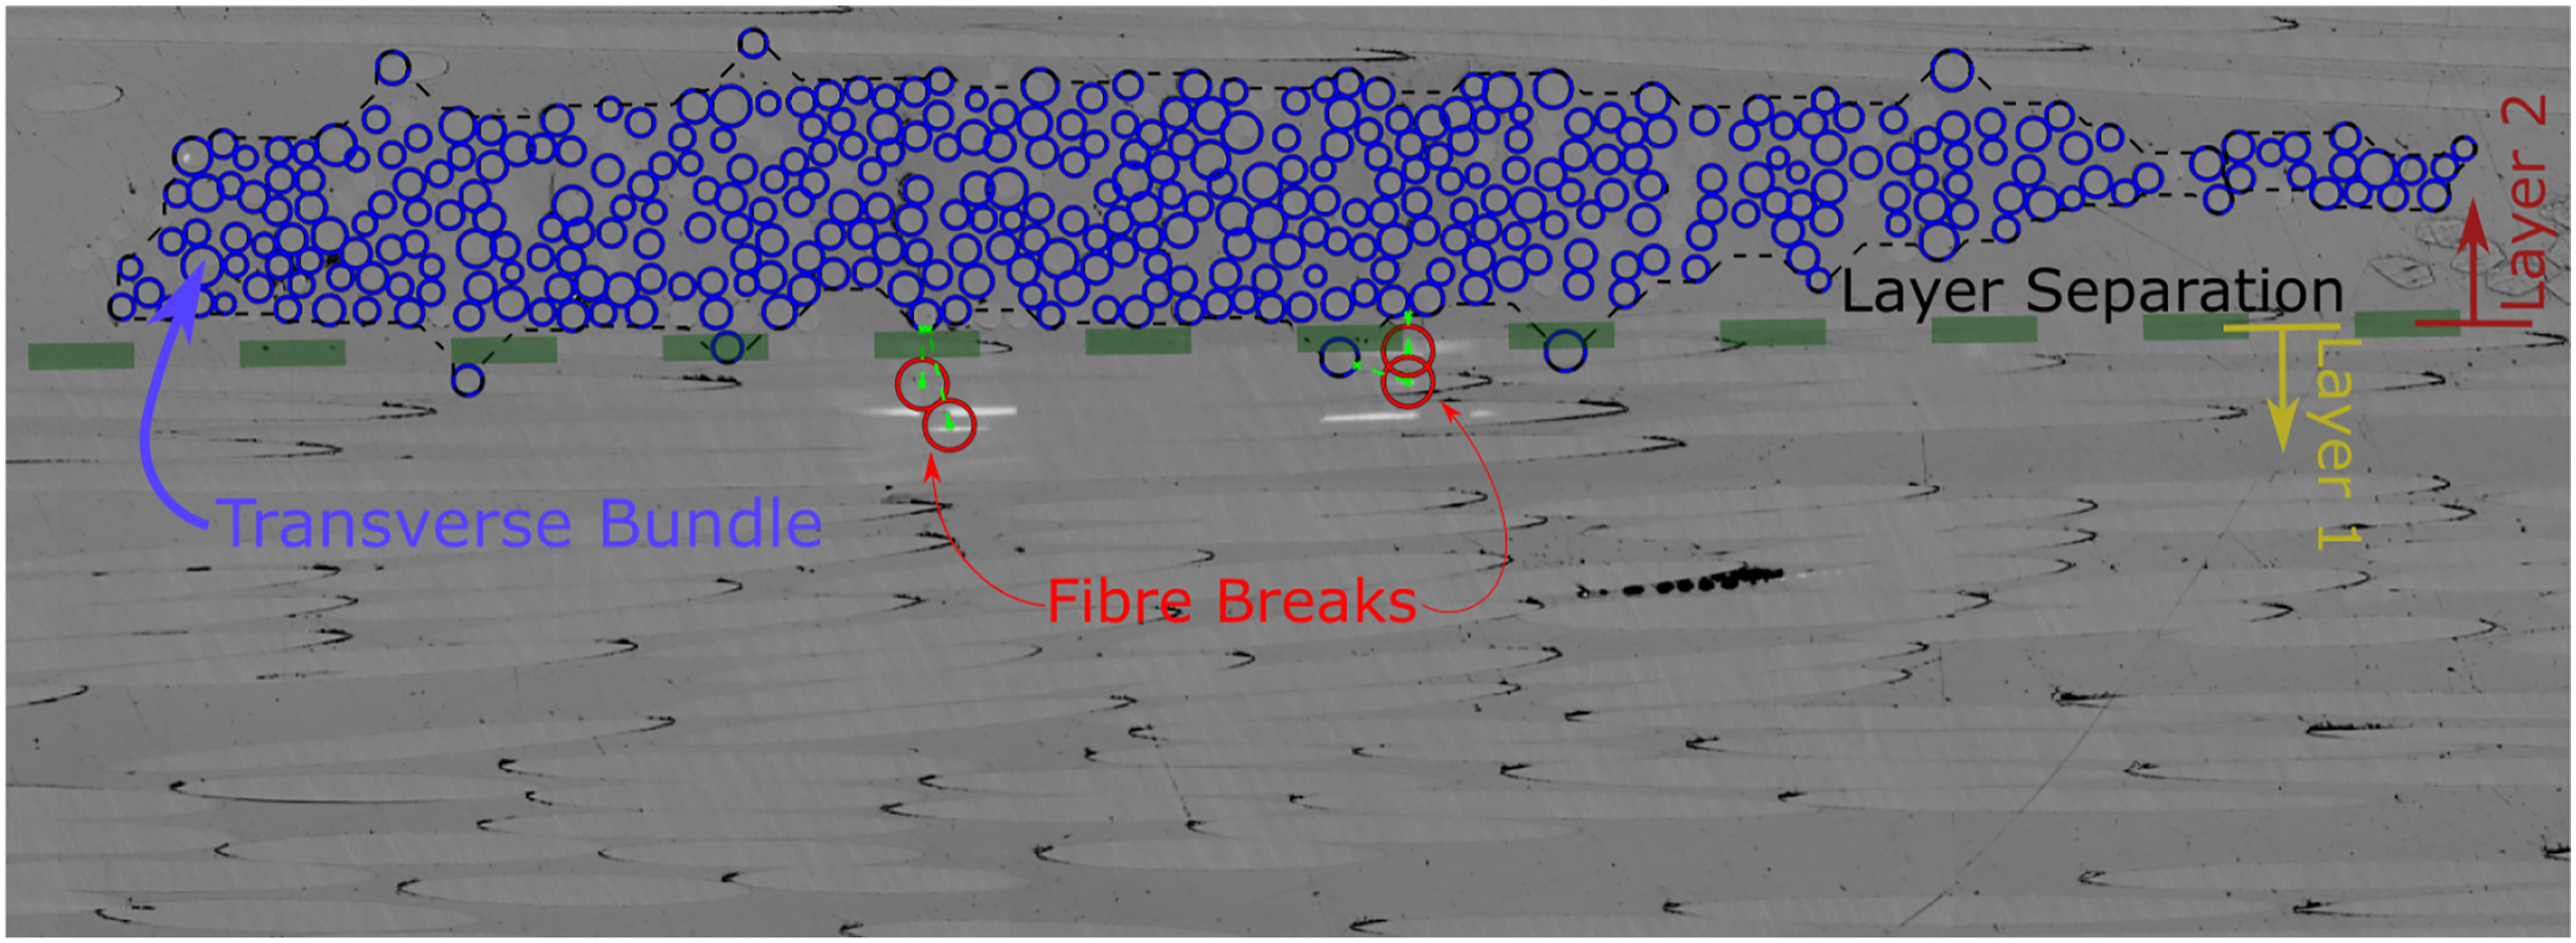
As earlier mentioned, the composite material used in this study is made from 10 stacked layers of non-crimp fabric, and each transverse bundle belongs to one of these layers. Based on the known position of the transverse bundles a clustering algorithm − k-means with k = 10 to classify to 10 layers − were applied to assign each bundle to the correct layer. The classification of the fibre breaks was conducted in accordance with their positions relative to the layer assigned to the nearest transverse bundles. The transverse bundles are stitched onto the longitudinal bundles from below, meaning that in the tensile loaded region a fibre break that is found to be below a transverse bundle of layer n is classified as belonging to layer n − 1, and a fibre break found to be above that bundle would be classified as belonging to the same layer n.
Results
Macro-scale damage
All tested specimens that were tested to failure show signs of damage at the macroscopic level. As seen in Figure 8, nearly all damage occurs on the surface of the specimen which is loaded in tension. Furthermore, the damage occurs predominantly in the region situated between the loading rollers (i.e. the gauge area). On the compression surface of the specimen, only minor abrasions are visible from the contact between specimens and loading rollers. The first damage on the tensile side is commonly visible early in the fatigue life, i.e. after less than 5% of the total fatigue lifetime. The damage that becomes macroscopically visible at this early stage of the fatigue life takes the form of light transverse stripes across the surface of the specimen that is subjected to tensile loads. The lighter stripes coincides with the position of the transverse backing bundles of the non-crimp fabric. The damage becomes gradually more visible on the tensile loaded surface until the specimen has failed, at which point the tension side looks as depicted in Figure 8. Transverse cracking in the transverse bundles is the most probable cause of damage in the early stages of fatigue testing. Spatial distribution of macro-scale visible damage on the specimen along the in-plane longitudinal axis of a specimen after failure.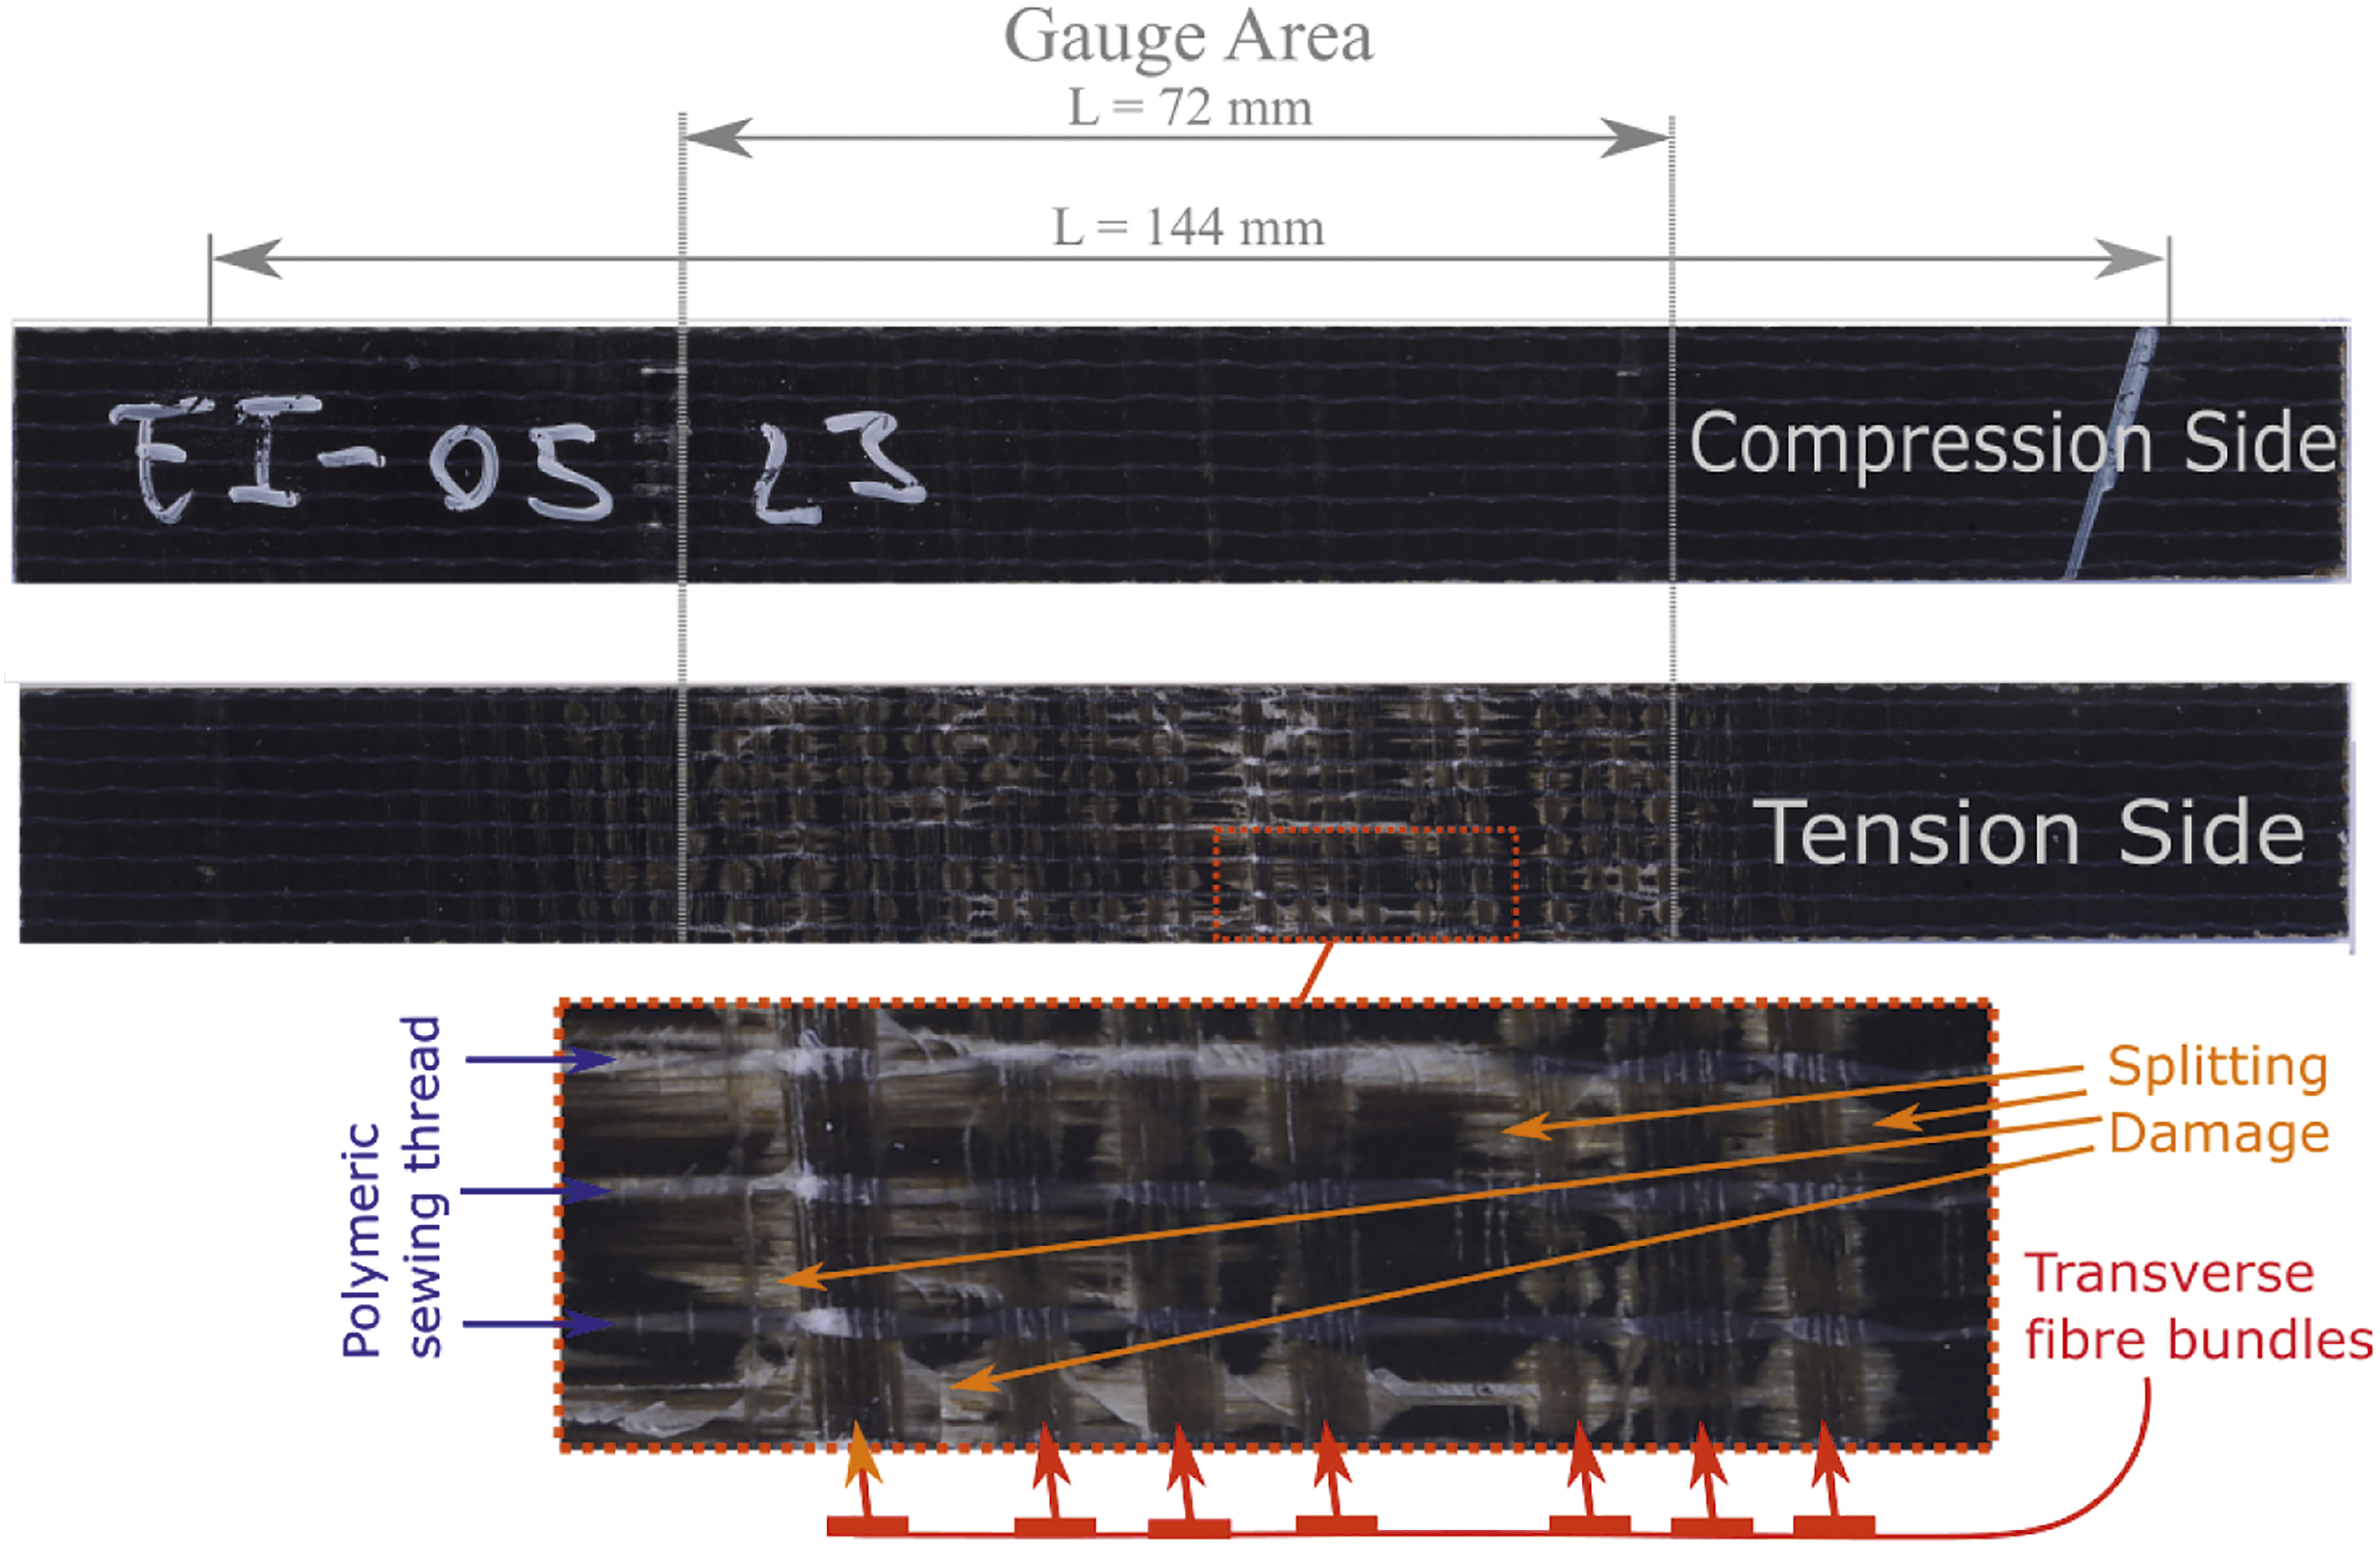
The transverse cracks are subjected to tensile load and are thus Mode I dominated cracks with some similarities to cracks in cross-ply laminates investigated by Hashin. 24 As can be seen in Figure 8, the damage at the tensionally loaded surface is not restricted to the areas of the transverse backing bundles. The damage that extents outside of the transverse backing bundles grow in the direction of the load-carrying fibres. The damage growth in the longitudinal direction is not observed in the LFoV micrographs as they run parallel to the cutting plane, meaning that the nature of this damage can not be verified on other scales of observation. The oberserved damage match with the damage type commonly denoted as splitting damage. Splitting is typically present in the final part of the fatigue life of composites. 25
On the surface subjected to compressive stresses, there are also signs of transverse backing bundles fading to a lighter color tone, but this trend is much more subtle than on the tension surface, and the change occurs much later in the fatigue test. At the edges of the gauge area (see Figure 8) markings from the load rollers are visible. These markings are the result of abrasions from the load rollers. The abrasions are small and situated on the compressively loaded surface making it safe to assume that the abrasions did not interfere with the dominating damage mechanism occurring on the tensile part of the specimen.
Since severe damage is generally only observed on the surface of the tensionally loaded region of the specimens, the neutral axis of the bending specimen is expected to have moved upwards from its original position which was aligned with the thickness center of the specimen. The change in neutral axis have not been measured during the testing campaign. Inspection of the LFoV microscopy images did, however, not show any sign that it was enough to cause tensile damage in layer C5 during testing.
Micro-scale damage
Micro-scale damage observed and shown here are image crops from the LFoV micrographs described in the Large-field-of-view microscopy section. Most observed damage occurs either as transverse cracking within transverse bundles or as fractures of fibres that are part of the longitudinal bundles. The following section provides a qualitative description of damage mechanisms observed at the micro-scale, including assessments of when the damage mechanisms occur in the material.
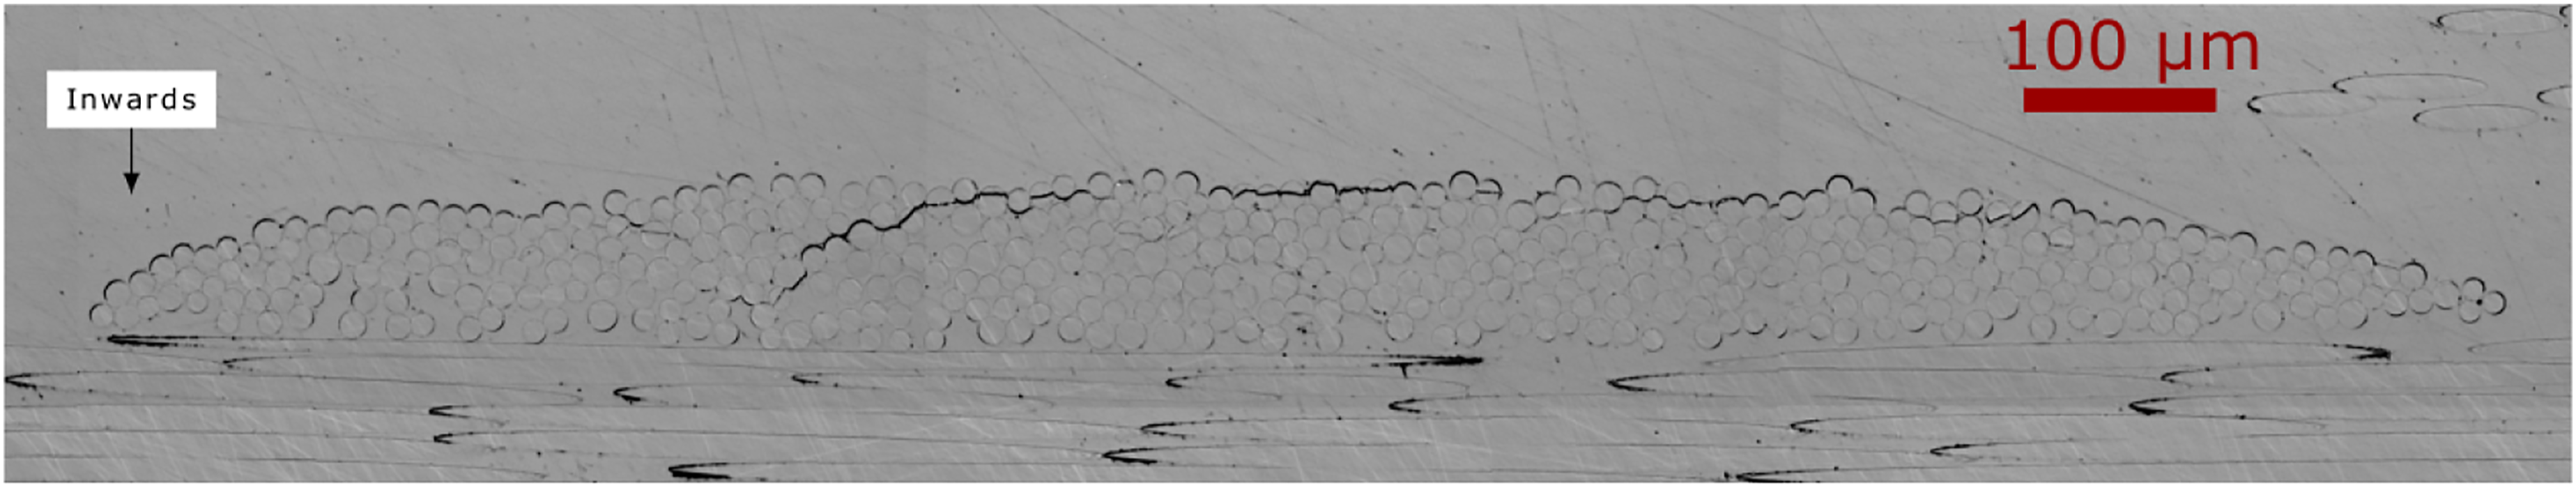
Figures 10 and 9 show typical examples of the types of damage that affect the transverse bundles. The micrographs were captured after 50,000 load cycles. The characteristics of the cracks that occur in the transverse bundles are different depending on the stress state that prevails for the bundle. Transverse bundles that are subjected to tensile loading produces mode I dominated cracks. Such cracks are shown in Figure 9 - and later in Figure 13 - and will generally be denoted as transverse cracks. The observation of the mode I dominated cracks is consistent with the damage described for the transverse bundles in the Macro-scale damage section. The lighter tone of colour observed in the section on macroscopically visible damage is caused by the same transverse cracks that are observed here. The transverse cracks in the tensile loaded bundles are most often spaced by 200–400 µm within the transverse bundles. The crack spacing is governed by the thickness of the transverse bundle in the same way as transverse cracks in cross-ply laminates are governed by layer thickness.
24
Crack saturation in most of the transverse fibre bundles is reached when 3–4 cracks have appeared because the width of the bundles is smaller than the length of 4–5 crack spacings. The transverse opened cracks were observed in the material after inspection of the first interrupted test (2,500 cycles), meaning that the cracks were formed after 0.25% of the expected fatigue life of the material. The microscopicically visible damage can be observed even earlier than the macroscopically visible damage. For this first observation, the transverse cracks were observed in layers T1, T2, and T3, and a very small amount was observed in layer T4. After 50,000 loading cycles some transverse cracks appeared in layer T5. It was furthermore observed that the number of transverse cracks in layers T1, T2 and T3 did not significantly increase after the first observations of them at 2,500 cycles of loading. The opening of the cracks did, however, seem to increase slightly as more load cycles were applied. The implication of this is that saturation of these transverse cracks is reached at the initial stage of the fatigue life of the bending specimens. Crack saturation will be further discussed with regards to the quantitative observations made in the paper. Typical example of transverse cracks in a transverse bundle formed by Example of mode II (shear) cracks in a transverse bundle (layer C1). The cracks are caused by shear stresses that rise in the compressively loaded region due to material heterogenities. The sub-image was extracted from a Large-Field-of-View microscopy micrograph captured after 50, 000 cycles.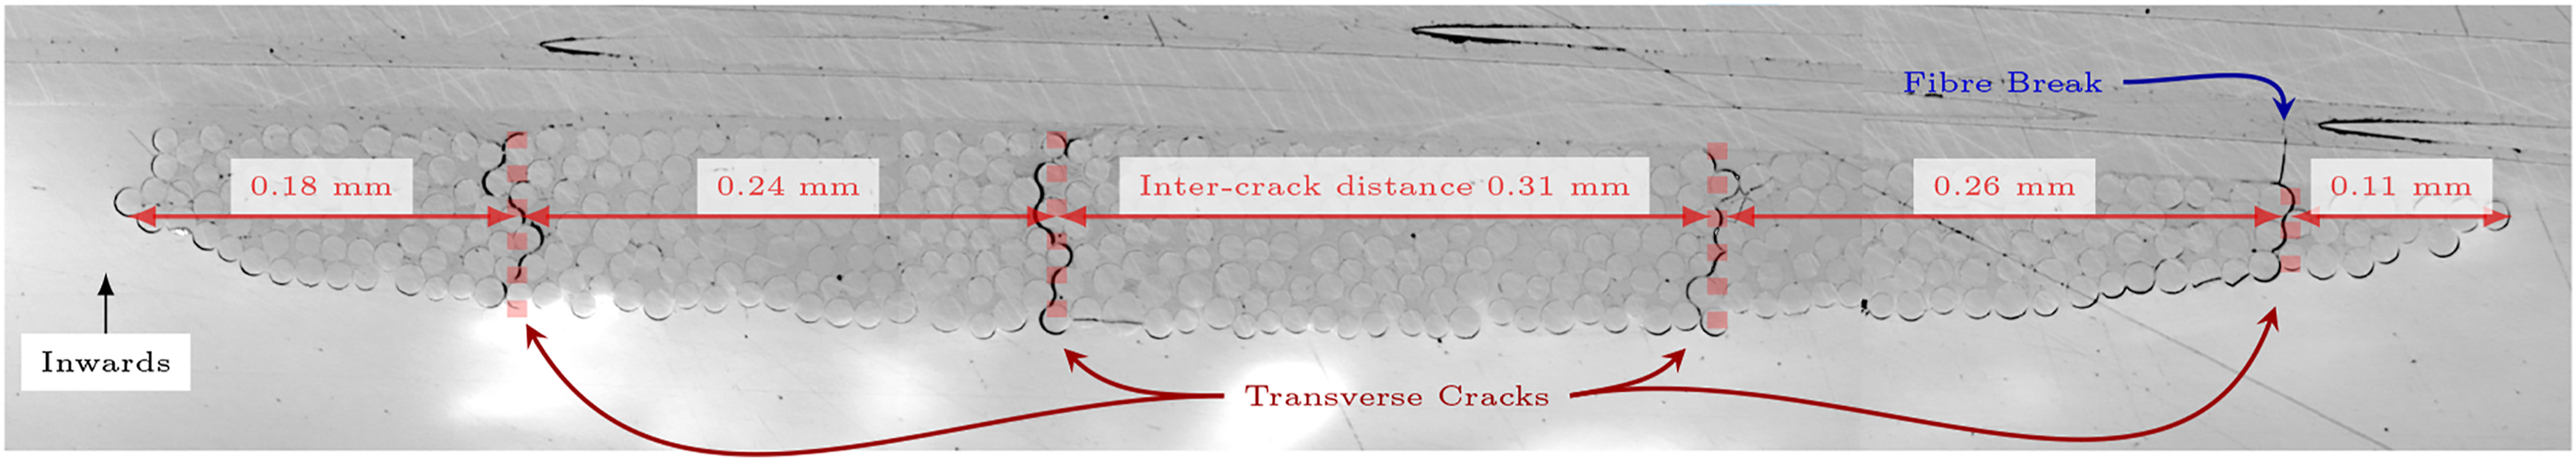
After 25,000 loading cycles the transverse cracks in layer T4 start to become more frequent, and the transverse bundles in the compressively loaded area start to develop damage similar to the example given in Figure 10. The damage in the transverse bundles of the compressively loaded volume appears only in layers C1 and C2. The cracks are generally growing in the longitudinal fibre direction of the material. Forming and propagation of mode II crack generally require the presence of shear stresses which could, in this case, be caused by the material heterogeneity combined with compressive loading.
Delaminations were observed in layer T1 after 500, 000 loading cycles, and an example of a delamination crack is depicted in Figure 11. The delaminations occur as an extension of severely opened transverse cracks in the transverse bundles of layer T1 as shown in Figure 11, which then starts propagating in the longitudinal direction, thus causing separation of the transverse bundle and the longitudinal bundle. Delaminations were only observed in layer T1, and only after 500,000 load cycles. Delamination observed in Layer T1 (tension load) after 500, 000 loading cycles.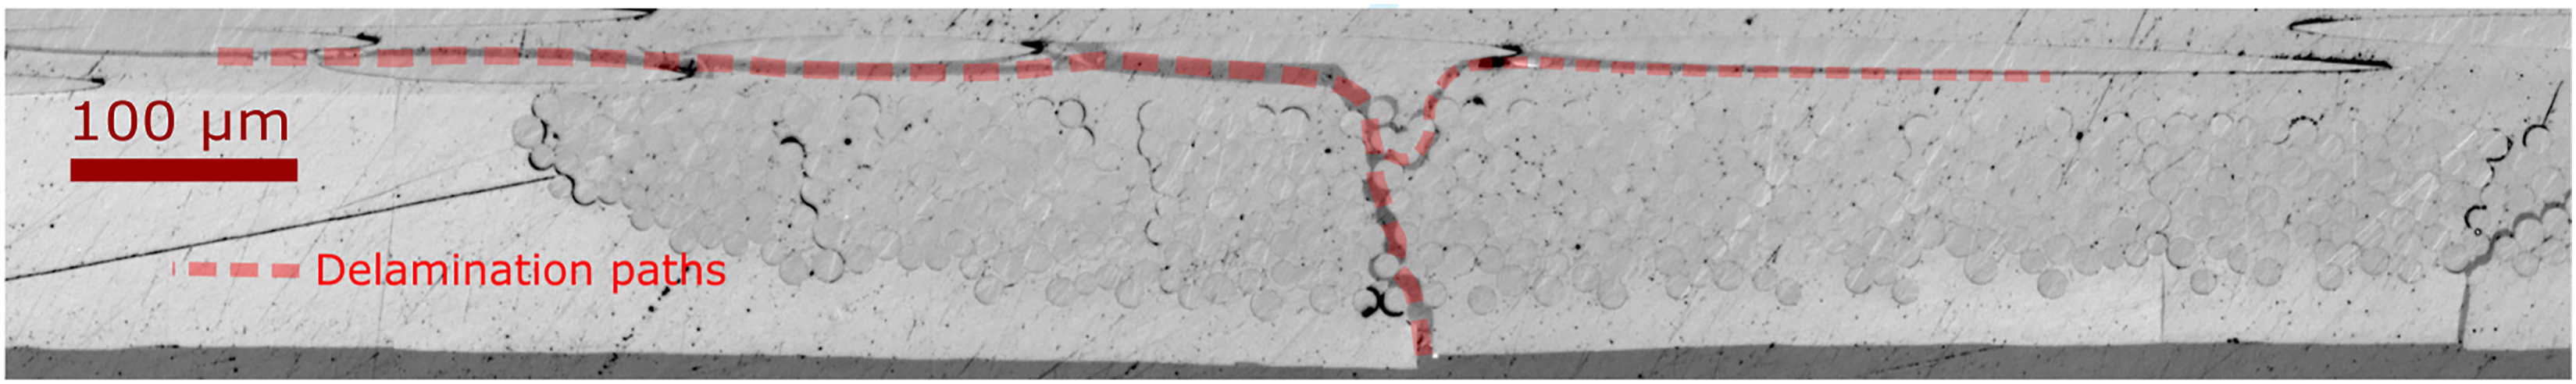
While transverse cracks contribute to the stiffness degradation of the material, the hypothesis in this work is that the main driver of the stiffness degradation stems from fibre breaks in the longitudinal fibres. The micro-scale observations include fibre-breakages of fibres in the longitudinal bundles. The first occurrences of these breakages were observed already after the first observation at 2,500 loading cycles. The fibre breaks have different visual characteristics depending on what caused them. Four typical appearances of the fibre breaks are depicted in Figure 12. Some fibre breaks, such as the one shown in Figure 12(a), are very distinctive. The small white patches in the vicinity of the fibre breaks can be interpreted as debonding between fibre and matrix beneath the observation surface. White patches of debonding can frequently be observed in the vicinity of broken fibres, and this artefact constitutes an important part of the damage mechanism related to fibre breakage. Debonding may also be observed as dark edges along with a fibre, as shown in Figure 12(b), where the debonding may be a feature that can indicate whether an abstruse feature in a micrograph is noise or a broken fibre. If a fibre break is only scantily visible, then the existence of debonding in close proximity to the damage is a helpful indication of a fibre break. In Figure 12(c) the white patch debonding is essential for observing an actual fibre break, while in Figure 12(d) the fibre break exists with no clear signs of debonding directly adjacent to the fibre break. Most observed fibre breaks are more distinctively visible than those shown in Figure 12(b) and 12(c), and the fibre breaks may combine several of the features explained. Data that substantiate the significance of the fibre breaks contribution to the global stiffness degradation are provided later in the Quantification of transverse cracks and fibre breaks section, and the raw image data is available from the online repository.
17
Typical examples of observation of fibre breaks extracted from Large-Field-of-View microscopy micrographs.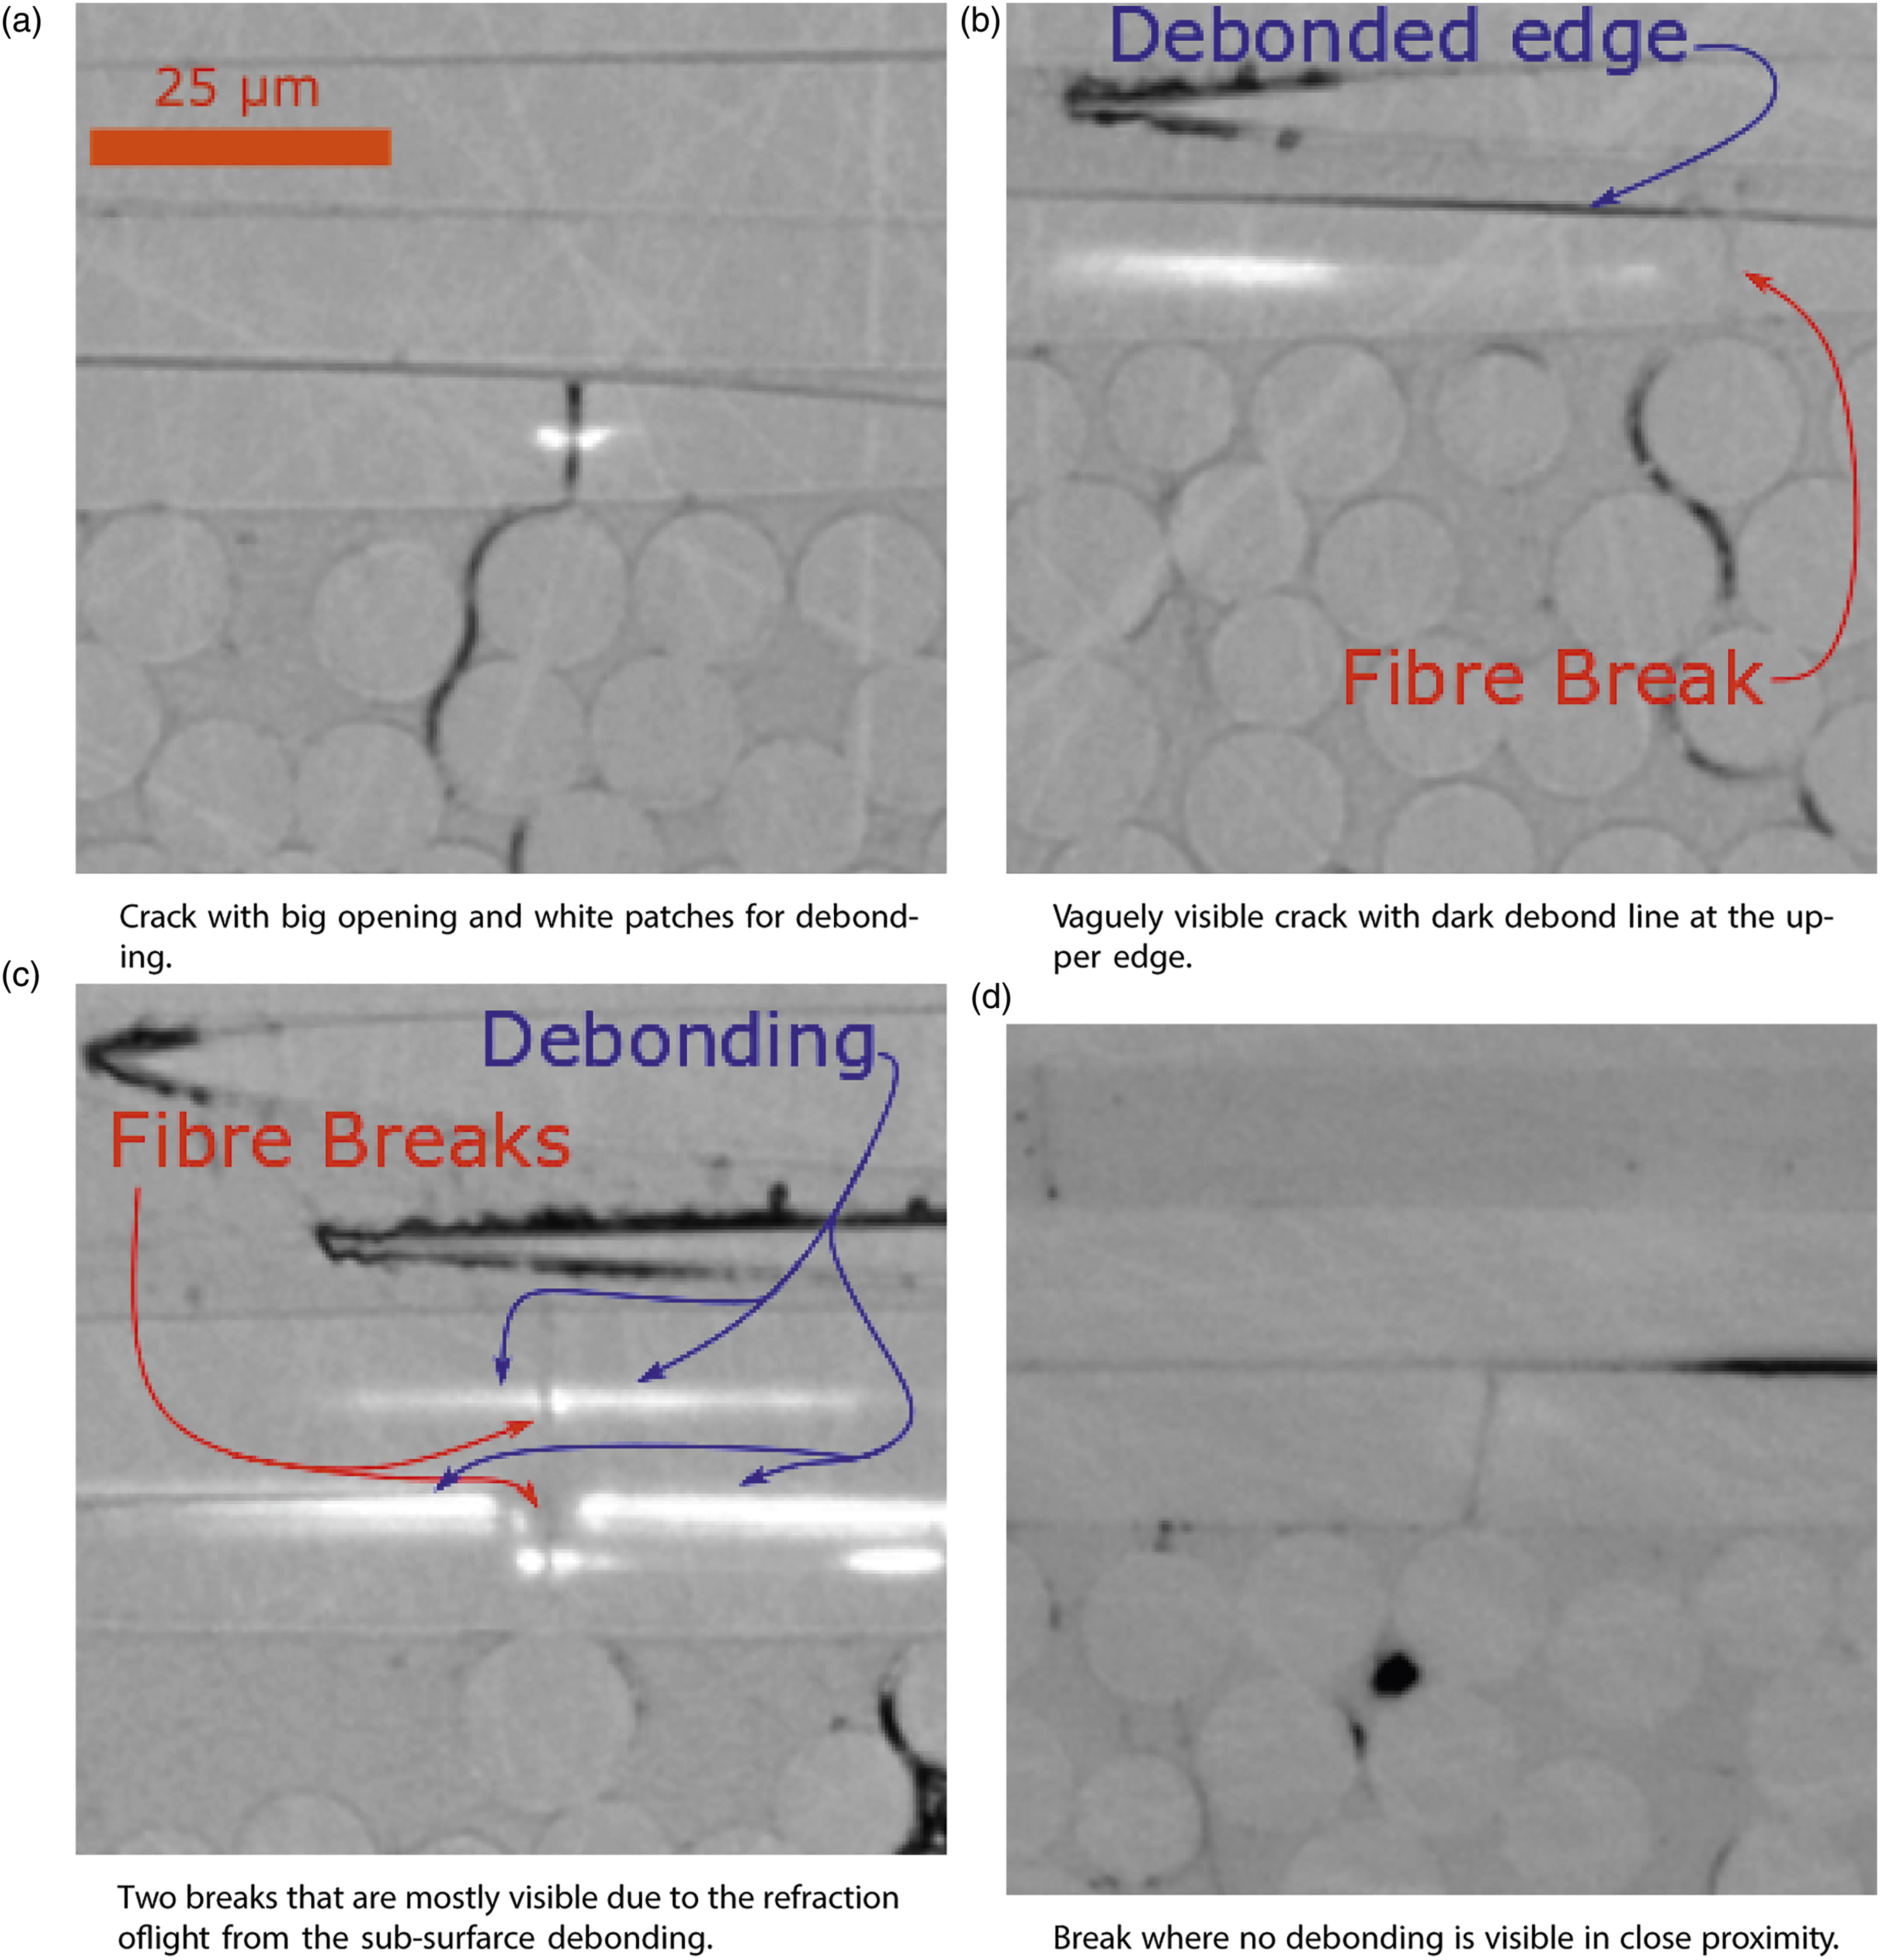
All the examples of fibre breaks shown in Figure 12 are situated in the presence of transverse fibre bundles. This position is a result of the governing damage mechanism observed in the non-crimp fabric composite used in this study. Figure 13 shows two typical examples of how the transverse matrix cracking influences the breakage and debonding of fibres in the longitudinal bundles. The breakage of the longitudinal fibres are marked with green in Figure 13, and are often observed near a transverse matrix crack, or near fibre debonding that results from transverse matrix cracking. Transverse cracks form as a result of fibre debonding and matrix cracking. When a transverse crack spans the full thickness of a transverse fibre bundle the crack tip interacts with longitudinal fibres near the crack tip. Two typical examples of how transverse cracking influences the damage that occurs in the longitudinal fibres after only 2,500 loading cycles which is less than 1% of the total fatigue life of the specimens.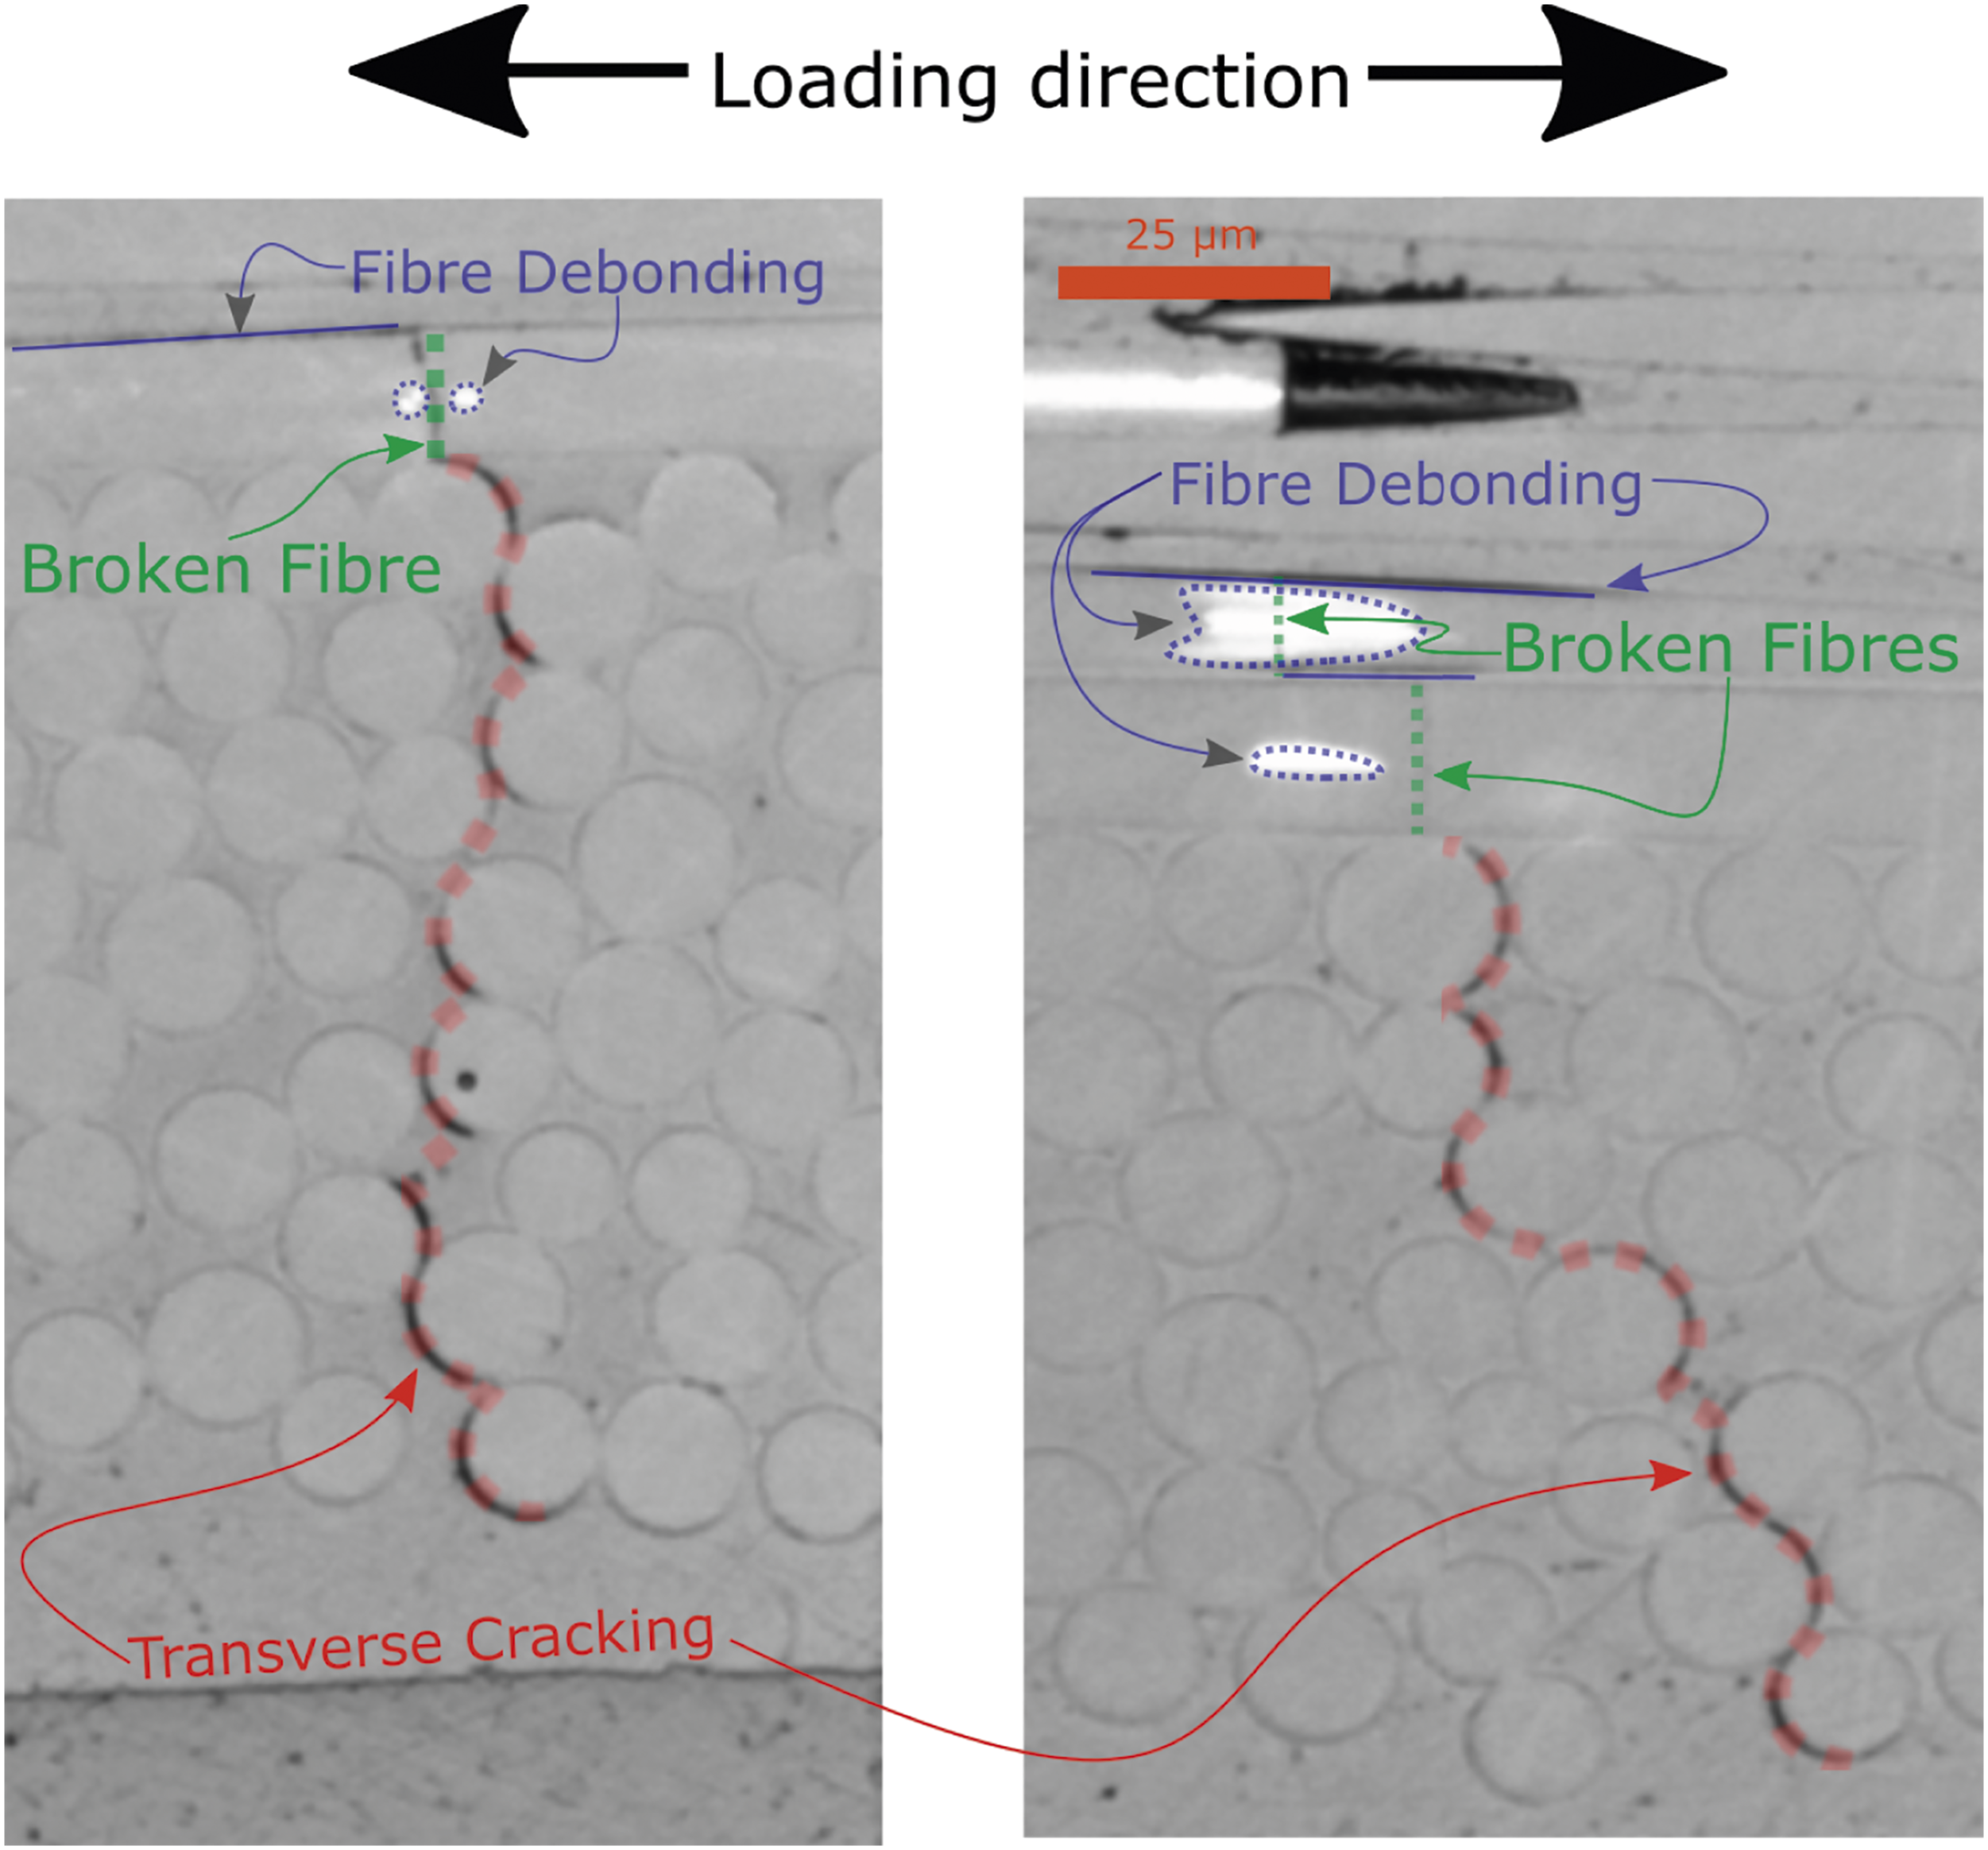
The interaction either results in a longitudinal fibre breaking immediately near the crack, otherwise, it results in crack growth in the longitudinal direction which causes debonding along the nearest longitudinal fibre, which eventually leads to breakage of the fibre. The fibre breackage is followed by fibre delamination as indicated by the blue markings in Figure 13. When the stress singularity generated by the tip of the fiber delamination reach a weak point on the neighboring fibre, it will lead to a new fiber breakage. The mechanism of progressive fibre breaks due to cyclic loading is described in detail in a recent work by Sørensen et al. 26 In other words, once a longitudinal fibre is broken it causes fracture or debonding of the adjacent fibres. Once longitudinal debonding along a fibre occurs, it is likely to cause break of that fibre after some length of debonding. The debond-breakage interaction repeats with the next adjacent fibre, resulting in clusters of broken fibres. This mechanism, which is active throughout the fatigue life of the observed specimens, is also consistent with descriptions and observations made by Zangenberg et al, 1 Jespersen et al 6 and Wang. 27
Quantification of transverse cracks and fibre breaks
The micro-scale observations have revealed two types of damage in the composites; transverse cracks and fibre breaks. The LFoV micrographs hold enough data in the form of fibre breaks and transverse cracks that the observations can further substantiate the assertions that transverse cracks in the transverse bundles cause fibre breaks. The data used in this section is mainly positional data of fibre breaks, transverse bundles and transverse cracks. The Image processing method for LFoV micrographs section described the method applied for extracting the positions of fibre breaks, transverse bundles and transverse cracks. For the analysis presented in this section, only data from the layers loaded in tension (i.e. layers T1-T5 cf. Figure 1) are used. The reason for omitting data from the compressively loaded layers (i.e. layers C1–C5) is that the damage in those layers is not expected to influence the global stiffness degradation or the final failure of the test specimens to any significant extent, as was explained in the Macro-scale damage and Micro-scale damage sections.
Figure 14 shows that for the first 250,000 load cycles the degradation of the global stiffness happens at a steady rate. Between 250,000 and 500,000 cycles there is a significant drop in stiffness. The stiffness degradation rate then returns to the same steady level as it was prior to reaching 500, 000 load cycles. The stiffness degradation between 250,000 and 500,000 cycles is unlikely to be a result of small fibre breaks and transverse cracks. The delaminations that occur in layer T1 after 500,000 load cycles - depicted in Figure 11 - could constitute a damage mechanism that may account for the stiffness loss between 250,000 and 500,000 cycles. The loss in normalized global stiffness 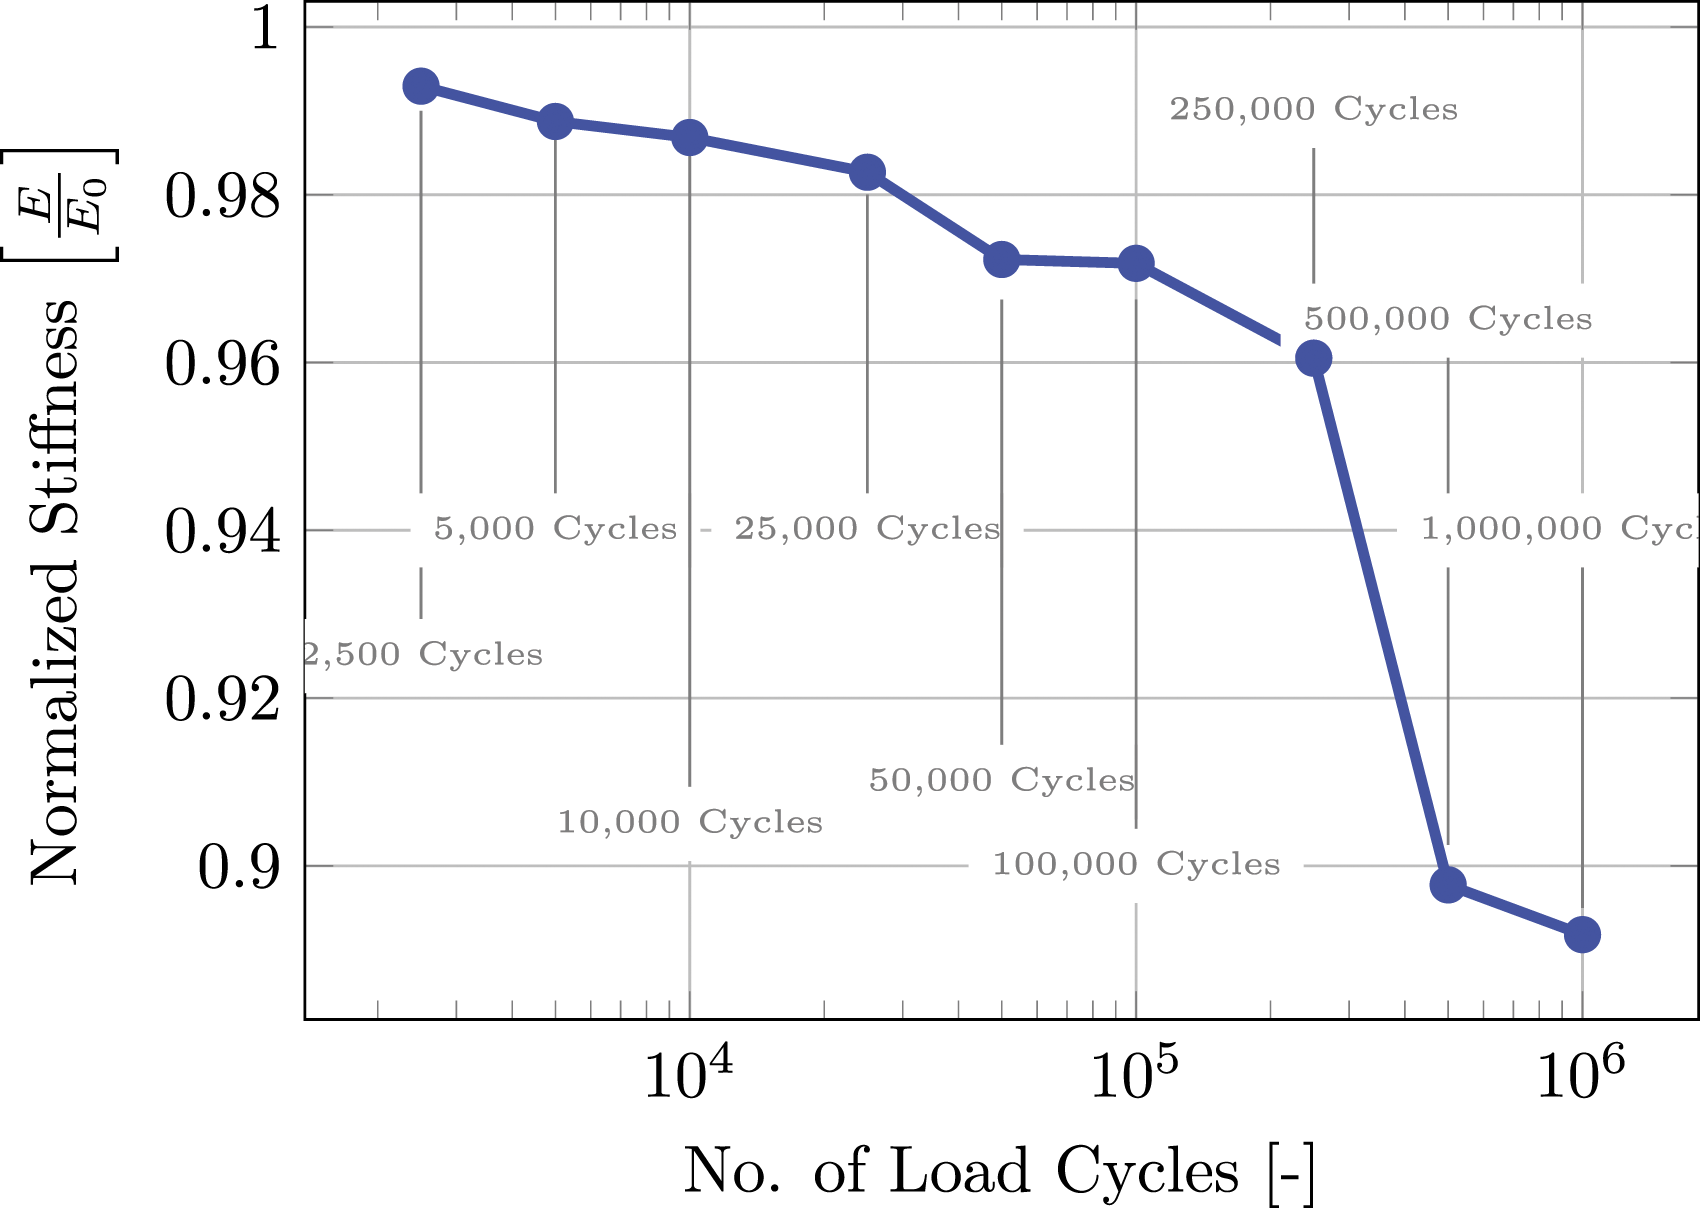
Overview of the number of discrete cracks counted in each layer. The observed area for all specimens are nearly identical, so scaling with the area would produce the same scaling factor for all numbers in the table. Note that the number of cracks are proportional to the number of bundles in a given layer in the case of crack saturation. The number of bundles in a given layer can vary from 6 to 12.
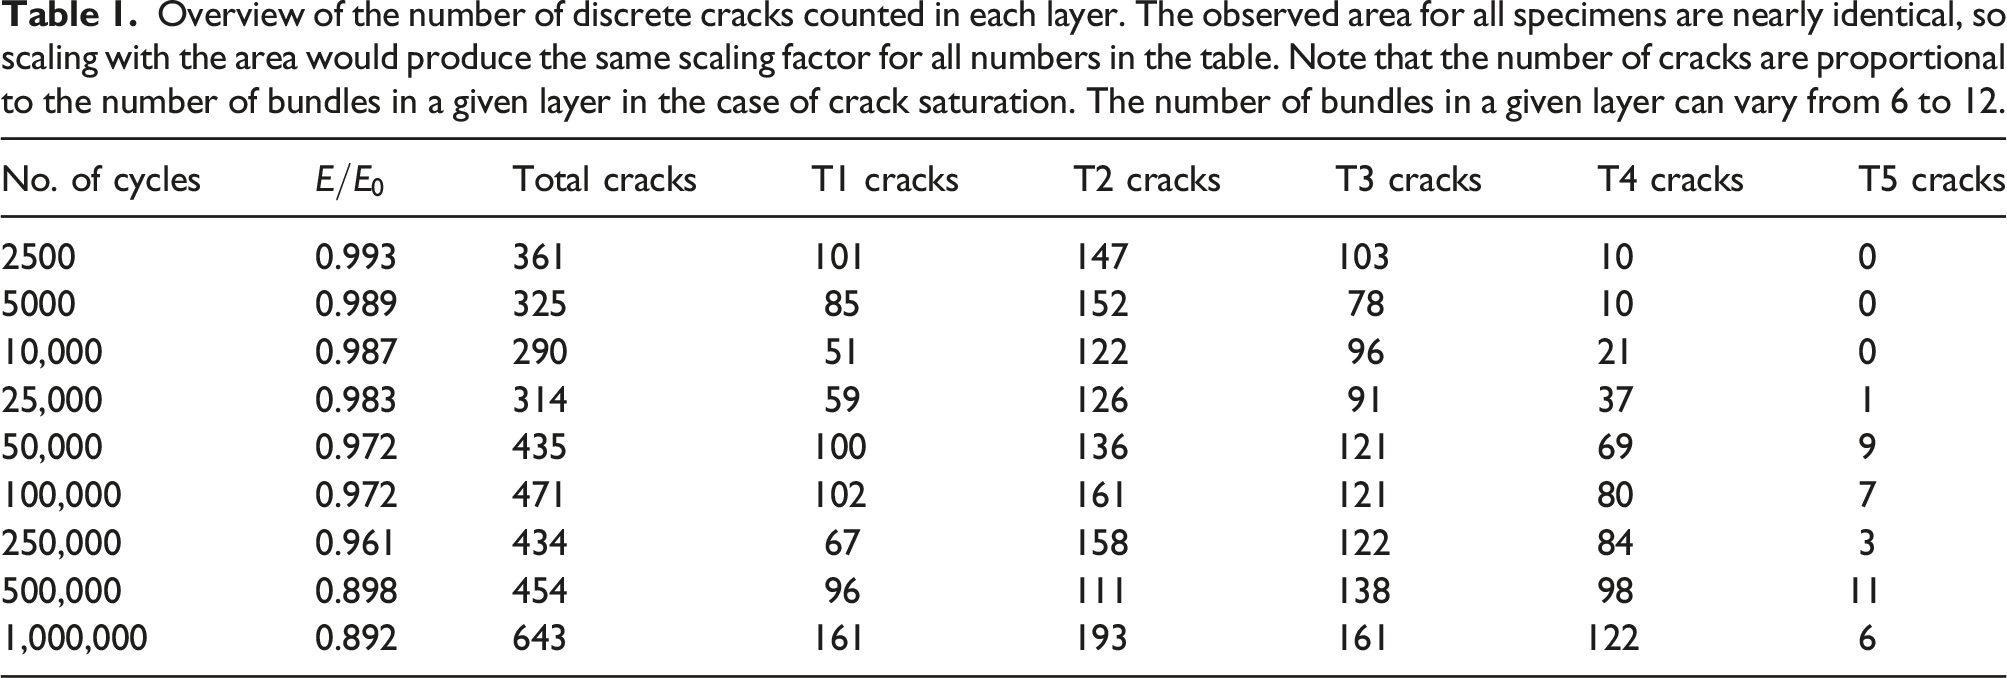
The stagnant number of cracks in layers T1, T2, and T3 suggest that cracks saturation in the transverse bundles are reached already after 2,500 to 5,000 cycles. A good measure of when crack saturation is reached is a crack density measure. Figure 15 shows the inter-crack distance, which will be used as a measure for the crack density. The definition of the inter-crack distance is the measurement from the position of one crack to either the nearest crack or to the boundary of the transverse bundle in which the crack is situated in. An example of how these distances are measured is depicted in Figure 9. The crack density measure provides both a mean value and a variance of the measure. The mean value of the inter-crack distance is defined such that when crack saturation is reached, then the mean inter-crack distance equals the characteristic crack distance. The notion, that crack saturation is reached in layer T2 already after 2,500 loading cycles, is supported by the data shown in Figure 15 since the mean value and SD remain unchanged throughout the loading history. The same observation is valid for layer T3 which - except for the data point for 5,000 loading cycles - closely resembles the data for layer T2. The inter-crack distance plotted as a function of the number of sustained loading cycles. The lines with marks indicates the mean inter-crack distance and the bars indicate the standard deviation of the inter-crack distance measure.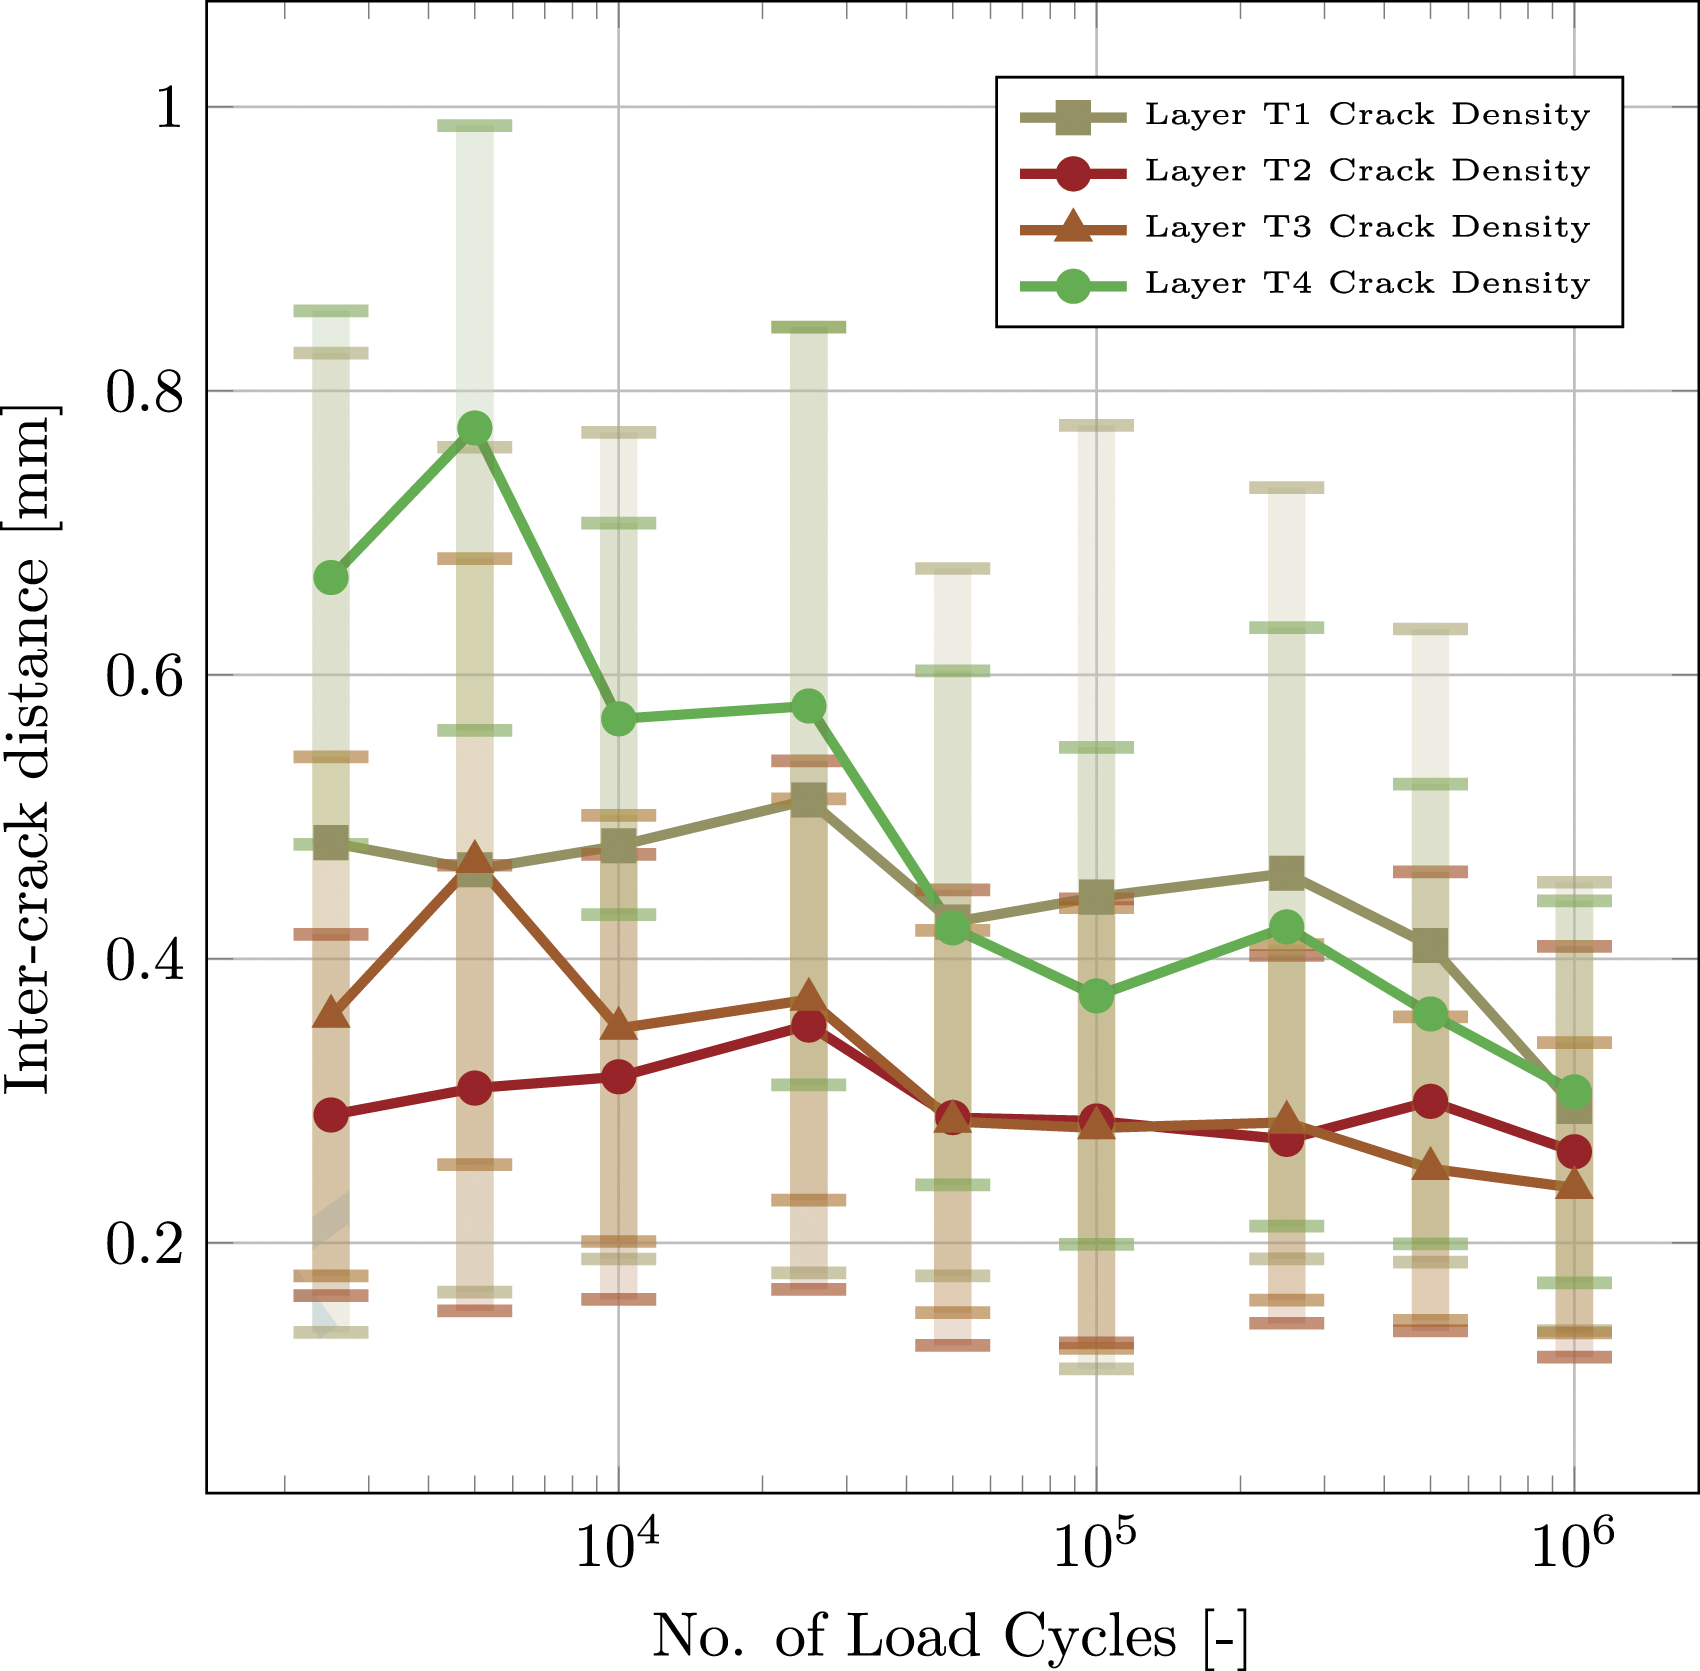
The inter-crack distance of the transverse bundles of layer T4 starts at a relatively high level. Still, it falls to the same level as the inter-crack distance of the rest of the layers, suggesting that transverse cracks are propagating in this layer throughout the load history until crack saturation is nearly reached after 1,000,000 load cycles. It should here be noted the observation from Table 1 of fewer cracks in layer T1 than in layers T2 and T3 is also reflected in the mean crack density shown in Figure 15. This is observed for both the inter-crack distance and the SD of the inter-crack distance. It is furthermore notable that the SD of the inter-crack distance is generally larger for layer T1 than layer T3. The higher inter-crack distance - ie. lower crack density - in layer T1 compared to layers T2 and T3 is related to the fact that while layer T1 is strained to higher level, the layer is not constrained on the lower side. This means that the cracks in the transverse bundles of layer T1 can be described as channel cracks. Conversely, the cracks in the transverse bundles of the other layers, T2 and T3, are tunnel cracks. Treatment of crack spacings for channel cracks and tunnel cracks are available in the literature (see e.g. 28 ), and in general the crack spacing is higher for channeling cracks than for tunneling cracks. The crack spacing for both channel and tunnel cracks are directly related to the layer height. The data shown for the transverse cracks supports the notion that the layers with the highest contribution to the stiffness - layers T1, T2, and T3 - are saturated with cracks before 0.5% of the projected fatigue life. Furthermore, steady stiffness degradation continues long after crack saturation of these layers.
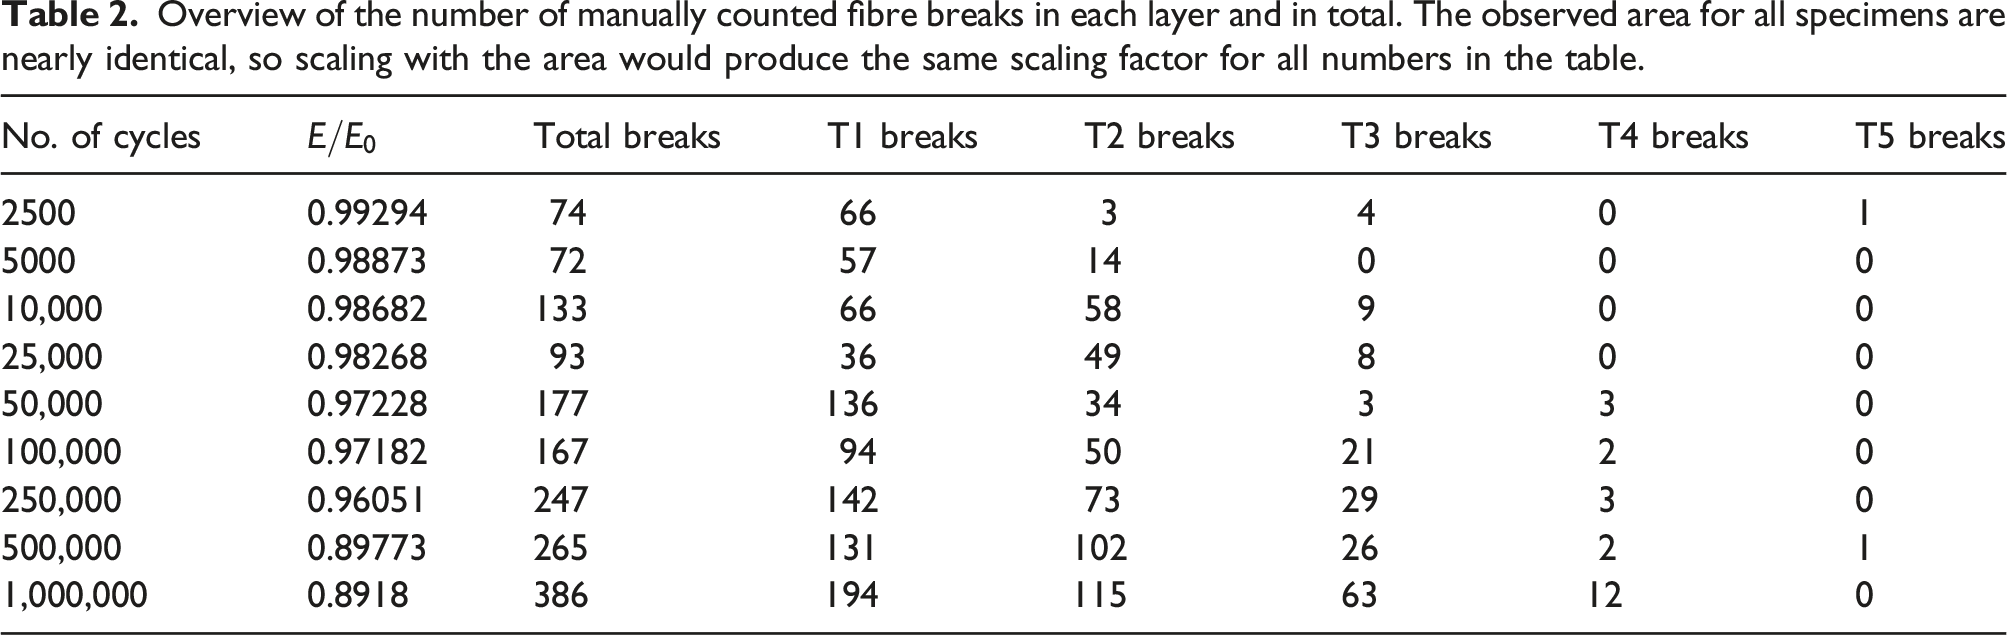
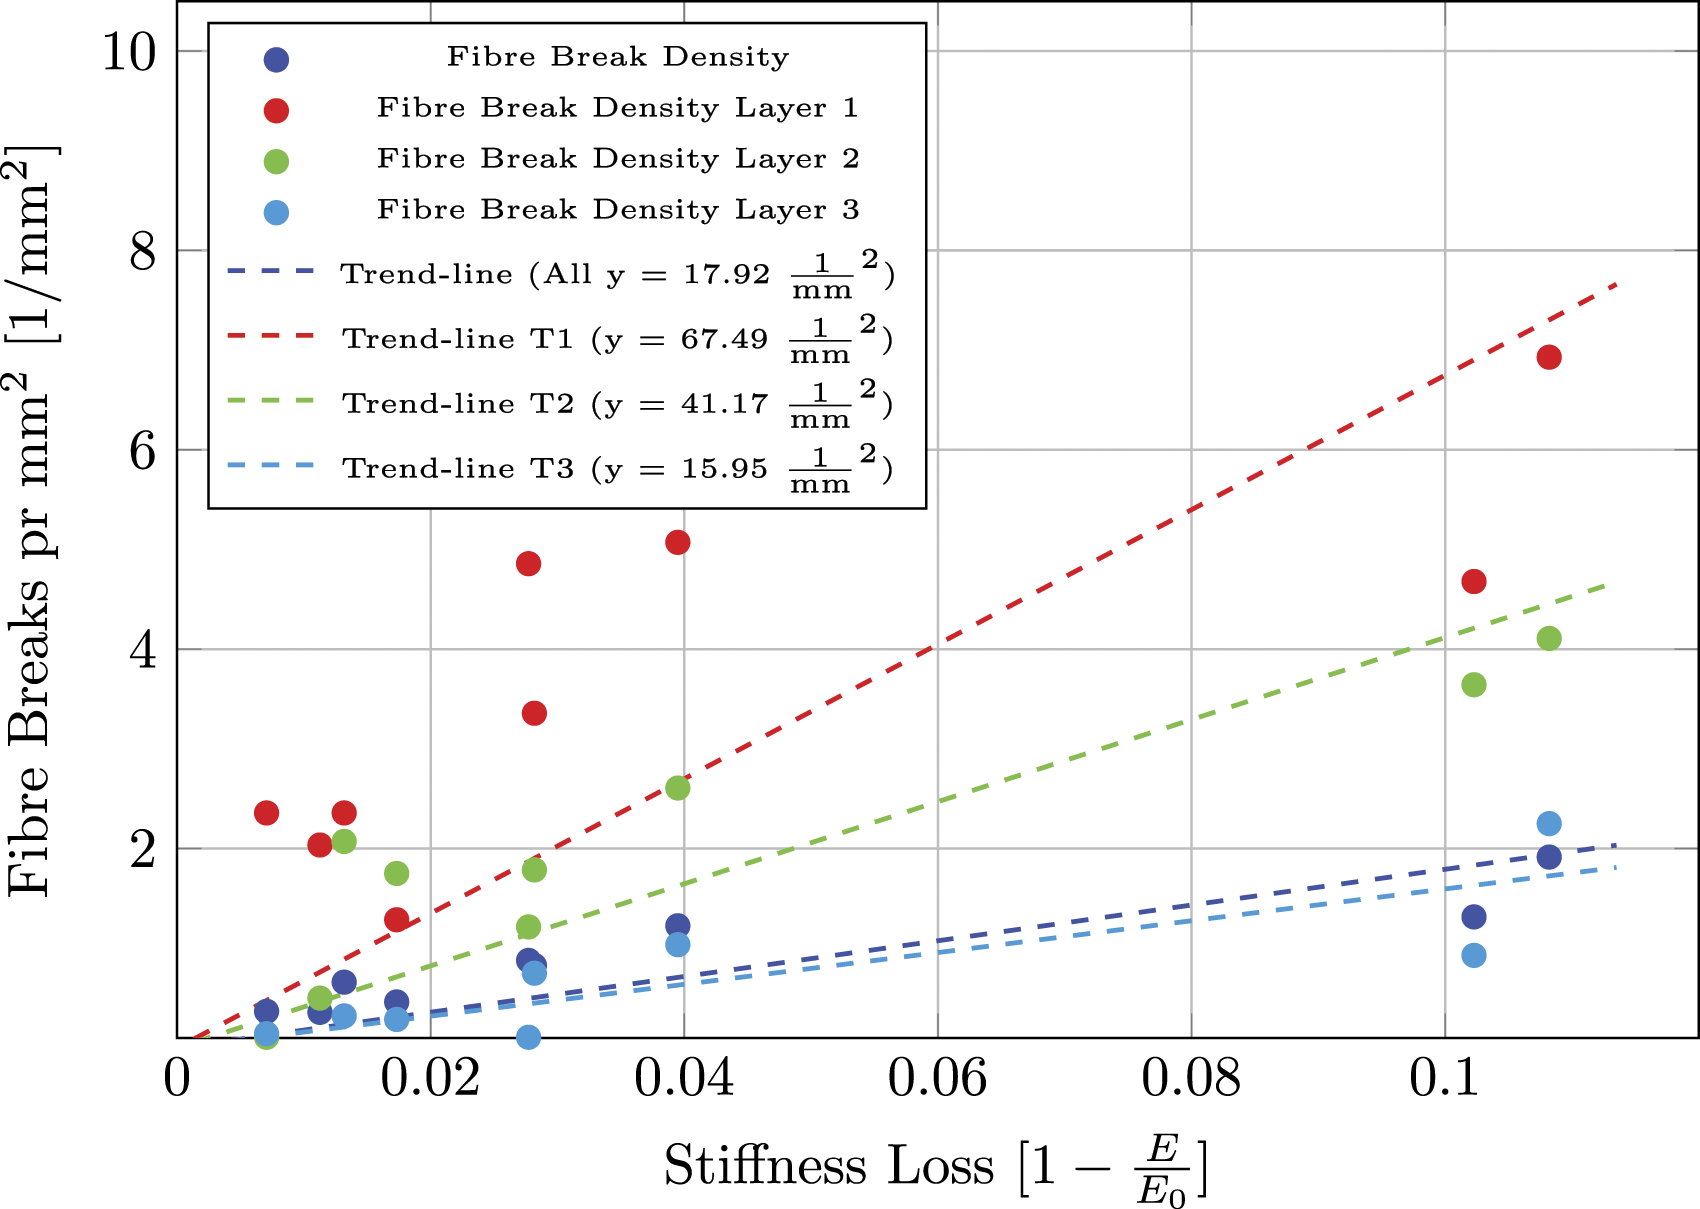
The development of fibre breaks pr. mm2 is displayed in Figure 16, and the nominal amount of fibre breaks during fatigue testing is printed in Table 2. The loss of global stiffness - displayed in Figure 14 - correlates with the number of fibre breaks in the first half of the fatigue life, ie. from 0 to 500,000 load cycles. At 500,000 load cycles a significant loss in the global stiffness is recorded, but only a relatively subtle increase in the number of fibre breaks is recorded. After 1,000,000 load cycles there is a sharp increase in the number of fibre breaks, yet the relative loss in stiffness from 500,000 cycles to 1,000,000 cycles is small. Furthermore, in Figure 17 the stiffness loss is correlated with the fibre break density over the observed area. While the data shows significant scatter, there is clearly a positive correlation between the fibre break density, both overall and for the individual layers. Conclusively, the data indicates that fibre breaks - not tranvserse cracks - are the main driver of stiffness degradation when delaminations are not present in the material. Transverse cracks serves to initiate sequences of fibre breaks which eventually lead to material failure, but transverse cracks are not the main driver of stiffness degradation. The amount of fibre breaks per square milimeter (mm2) plotted as a function of the number of sustained loading cycles. Overview of the number of manually counted fibre breaks in each layer and in total. The observed area for all specimens are nearly identical, so scaling with the area would produce the same scaling factor for all numbers in the table. The amount of fibre breaks per square milimeter (mm2) plotted as a function of the stifness loss.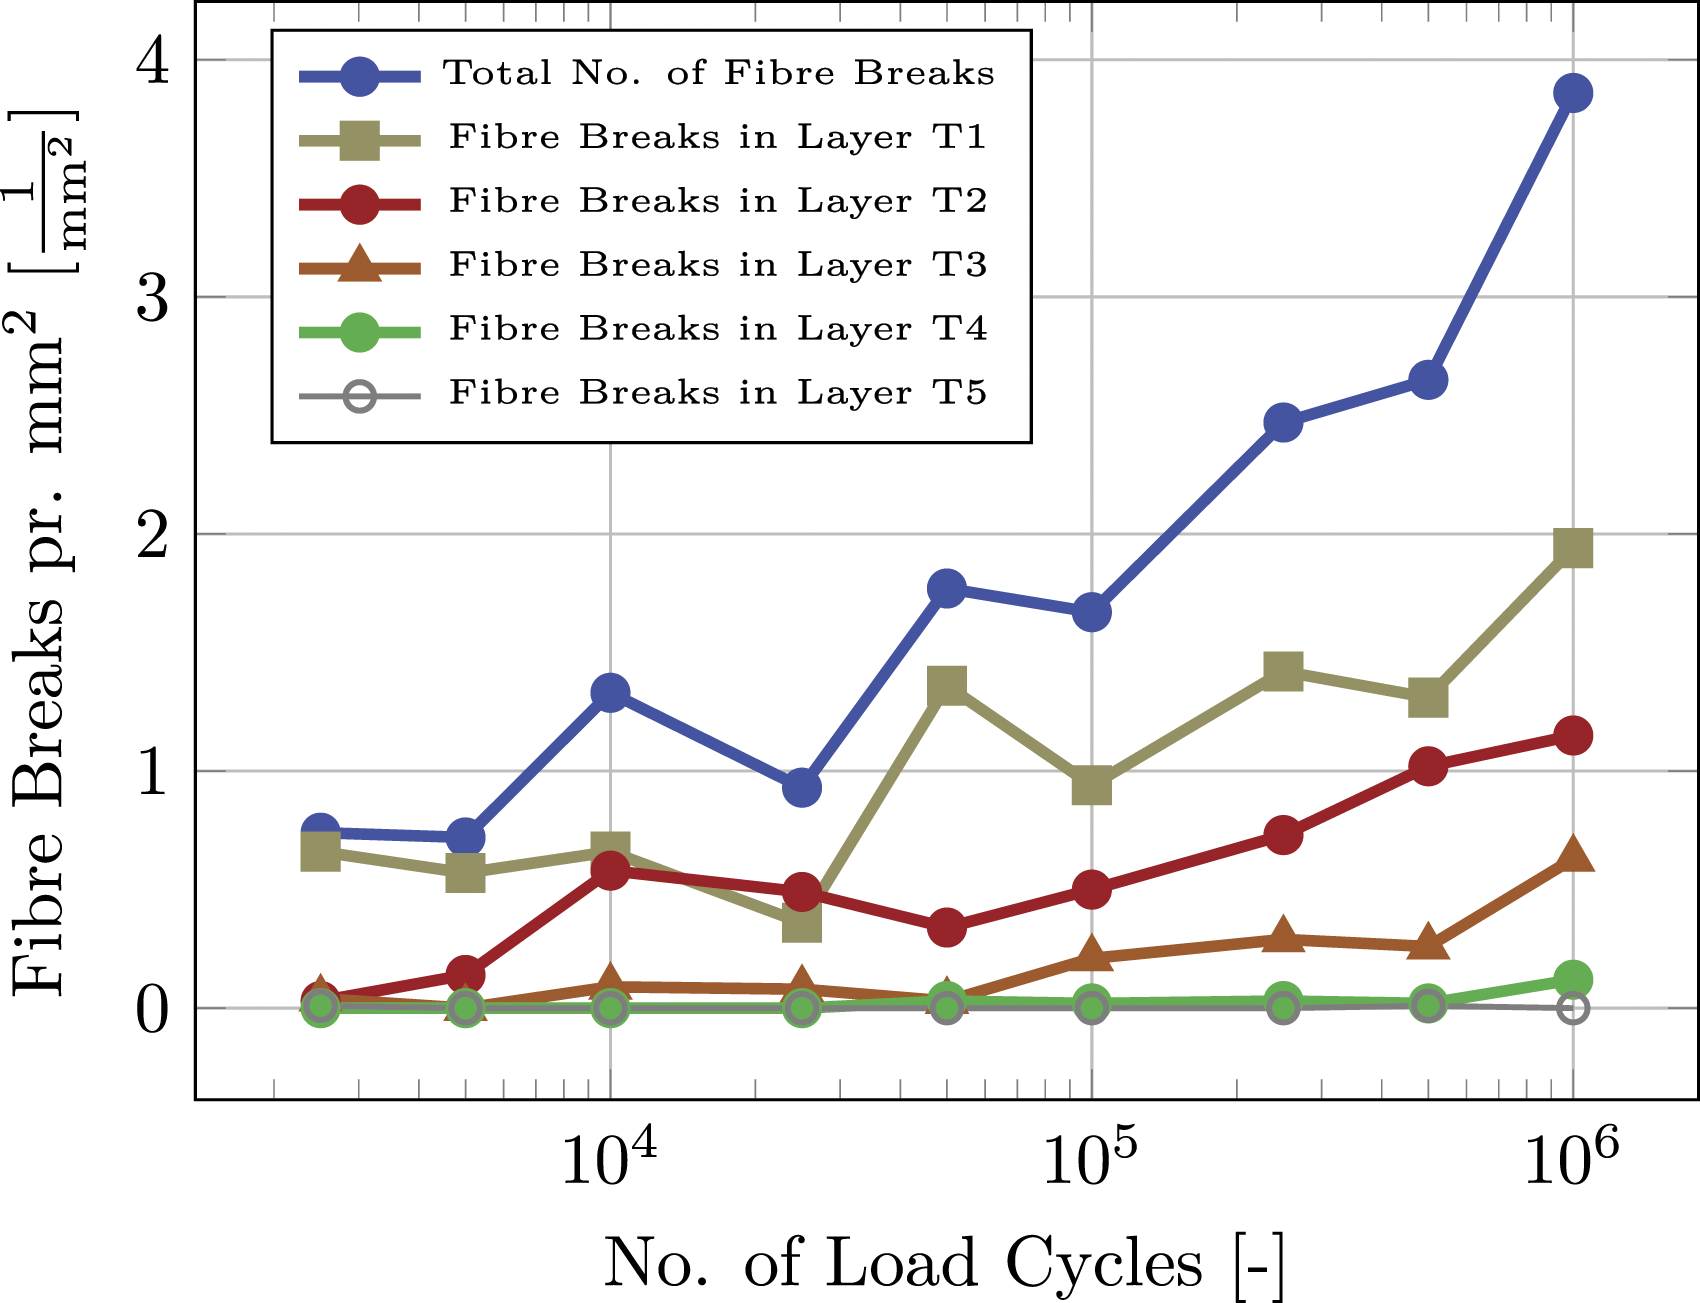
Position of fibre breaks and transverse bundles in the thickness direction
The qualitative analysis indicated that fibres do not break in random positions, instead, fibre breaks occur near transverse fibre bundles. This effect can be found when inspecting the data that quantify the position of the fibre breaks of longitudinal fibres. The thin blue bars in Figure 18 is histogram data of the thickness position of all recorded fibre breaks, from all 36 LFoV micrographs. The thickness position d is here referred to as the right angle distance from the geometric thickness centerline of the tested bending specimens to a fibre break. Note that the distance d indicated by the first axis in the plot decreases from the left towards right. The graph shows an overall decreasing probability of fibre breaks occurring when the distance to the centerline decreases. The decay is, however, not smooth and the distribution is multi-modal with several peaks (P1, P2, .., P7). The peaks marked in the graph are not a result of a simple fibre strength distribution. Instead, the peaks indicate that the fibre breakage is controlled by local features in the material. The local features that govern the peaks in the graph are the position of the transverse bundles with respect to the distance d. The position of the transverse bundles with respect to the distance d is indicated by the larger colored pillars, each with a schematic of a transverse bundle atop. The darker part of the colored pillars shows the mean outer boundary position of the transverse bundles. The lighter part indicates the extended possible position by adding or subtracting the SD of the transverse bundle boundary position to the upper or lower mean transverse bundle boundary value with respect to the distance measure d. The boundary of all transverse bundles was found using the methodology described in the Image processing method for LFoV micrographs section, and depicted in Figure 7. The distribution of fibre breaks through the half of the thickness going from the thickness center (ie. the centerline) to the surface with the highest strain.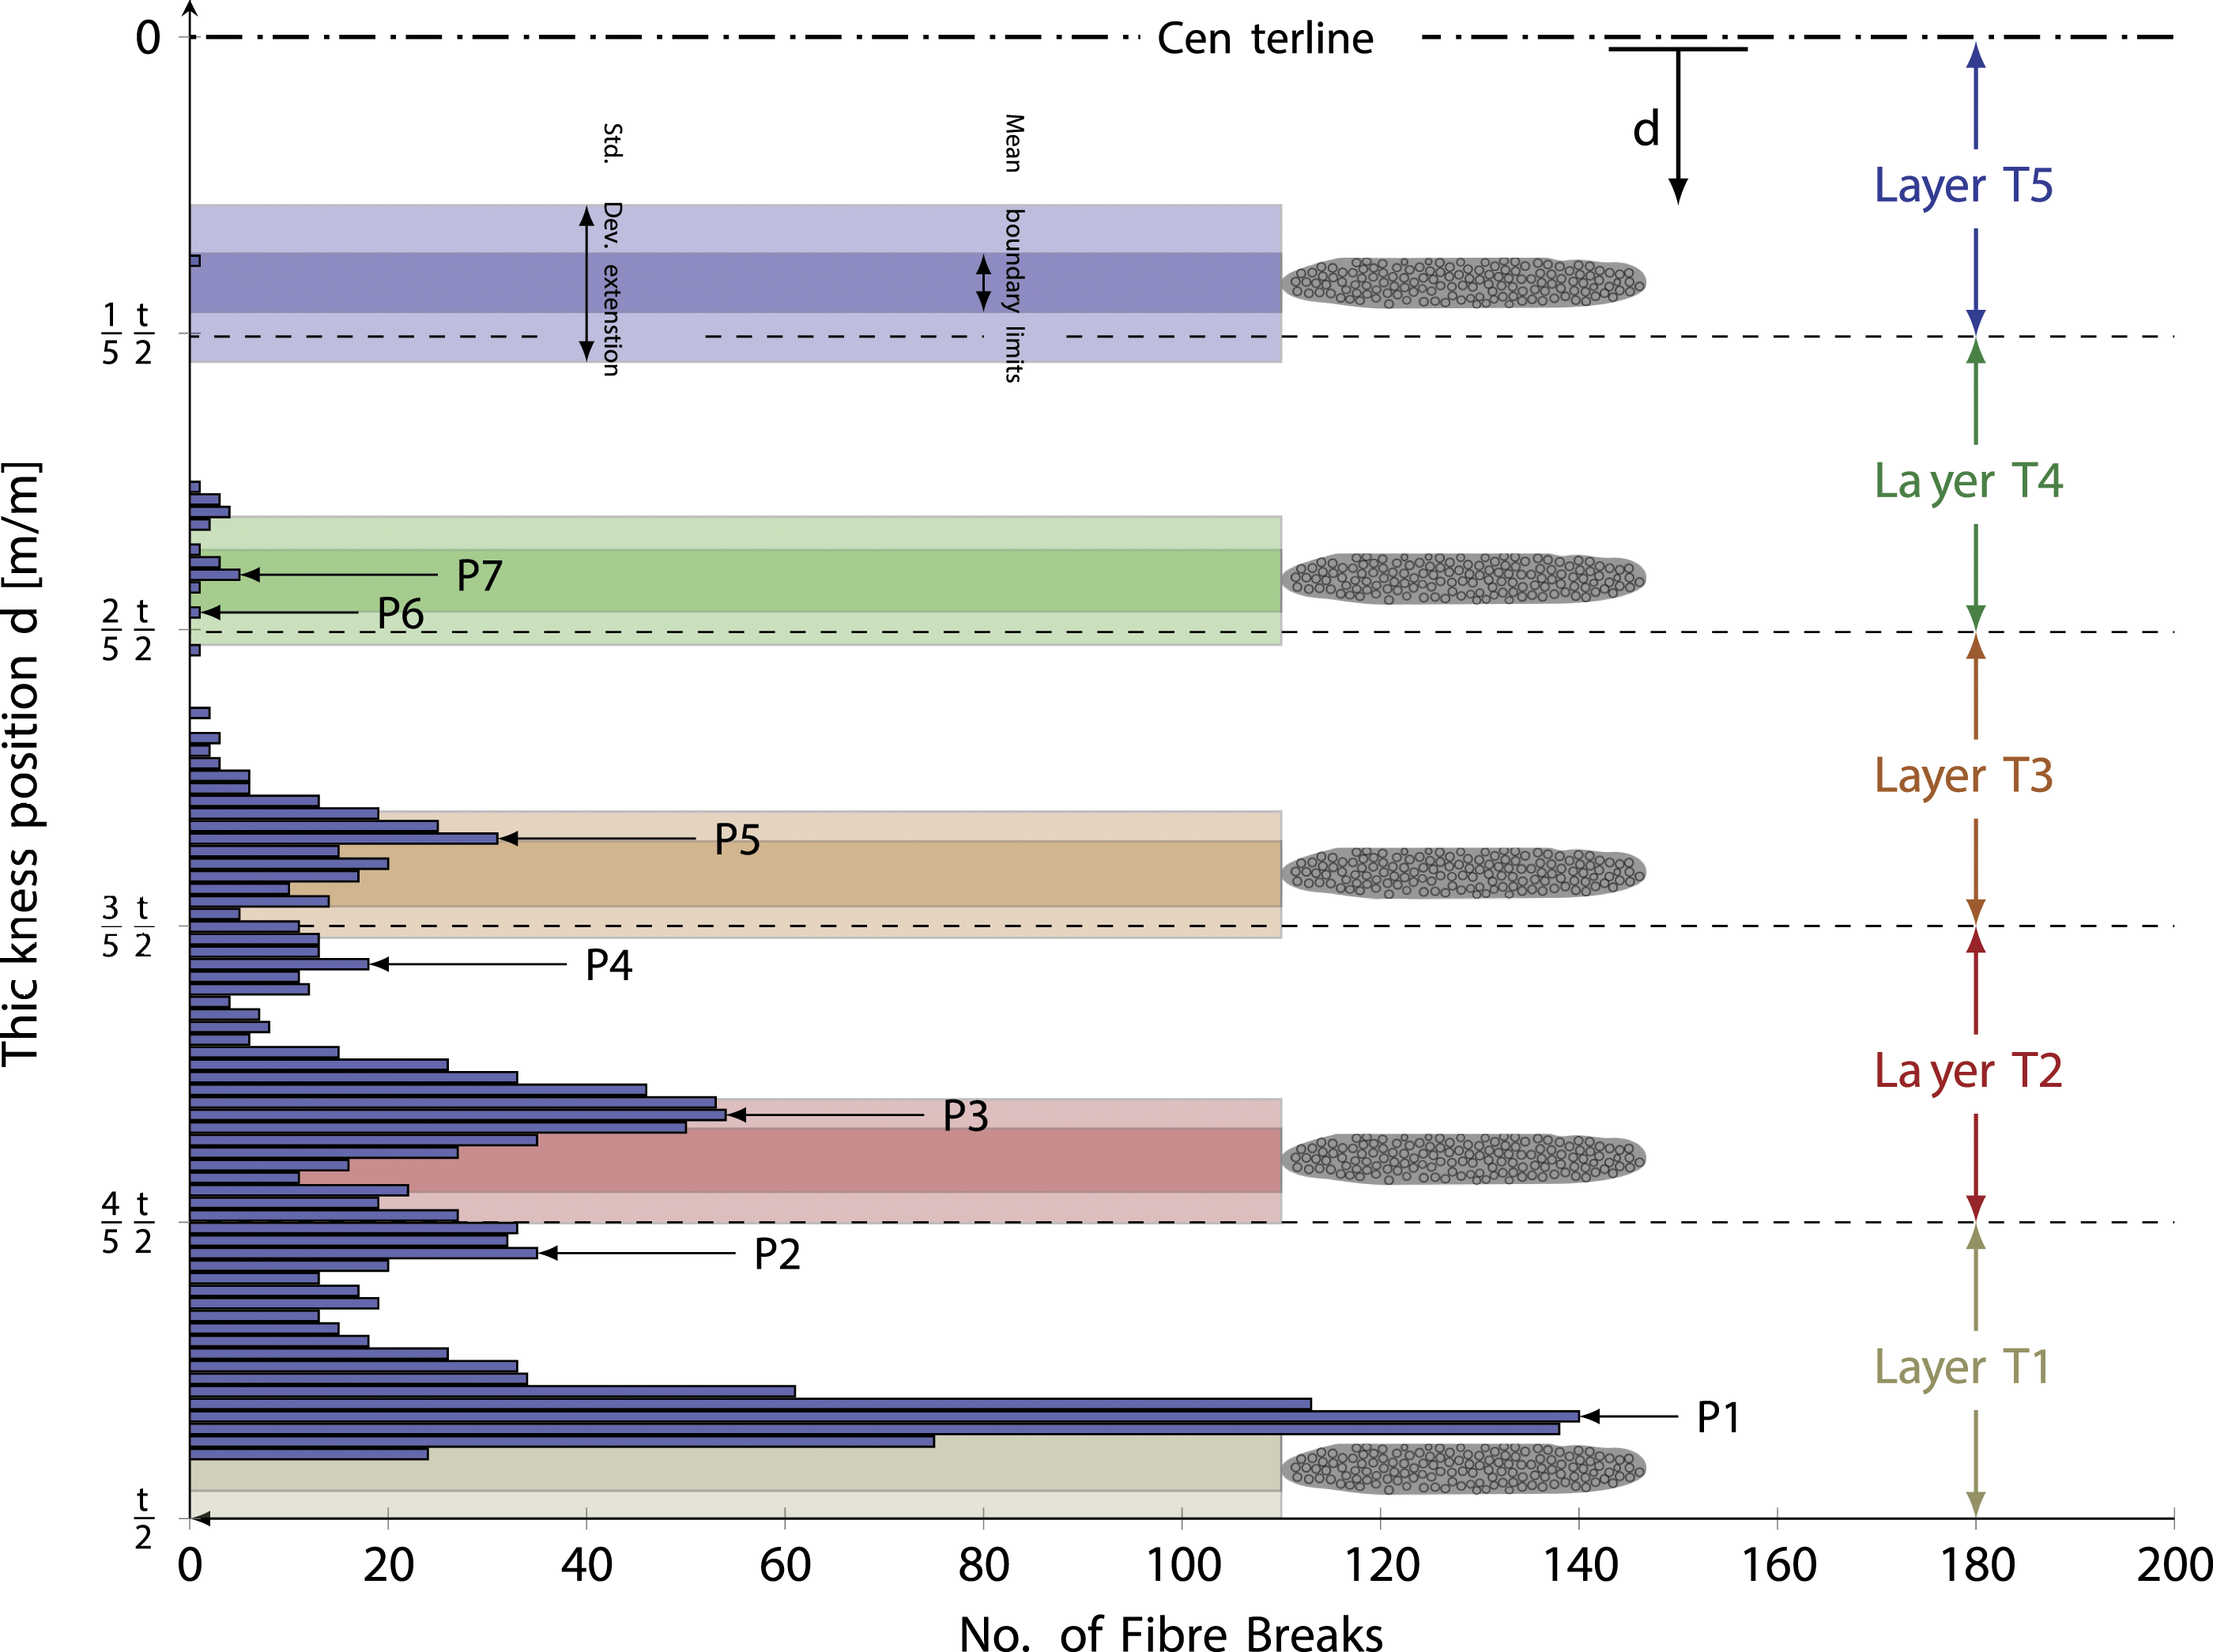
The position with the largest number of fibre breaks is indicated in the histogram by peak P1. This position is found at a significant distance away from the material position that is subjected to the highest magnitude of stress
In a related work by Mortensen et al 29 fibre breaks were also observed on a free polished edge of specimens like the ones used in the current work. In that study it was found that a significantly larger number of fibre breaks could be observed on the free polished edge than could be observed inside the specimens. Notably, when applying the method outlined in this work on the free edge observations, the position of the fibre breaks are not related to the position of transverse bundles in the same ways as has been shown in this work. This suggests that on a free edge, fibre breaks are far more likely to occur due to free edge effects compared to the effect of transverse fibre bundles, since the free edge effect essentially drowns out the effect of the transverse fibre bundles.
Discussion & conclusion
The most important conclusion that can be deduced from the presented work is that of the damage mechanism for fibre breaks, and the impact of fibre breaks on the fatigue degradation of the material. Investigation of micro-scale damage identified a key damage mechanism in which intrabundle cracks in transverse fibre bundles are the initial damage that leads to debonding and breakage of longitudinal fibres. A broken fibre often causes debonding of one or more adjacent fibres which then risk breakage. If one of the adjacent fibre breaks, then the sequence continues with more debonding and subsequent fibre breaks of nearby fibres. The quantitative analysis of fibre break positions and transverse fibre bundle position indicates that fibre breaks generally occur near transverse fibre bundles, which is where the transverse cracks are generally present. From these observations, the inferred conclusion is that transverse cracks in transverse fibre bundles are the main cause of fibre breaks. The ramification is that while transverse cracks in transverse bundles only affect the stiffness degradation of the material to a very limited degree, the secondary effects - ie. fibre breaks - significantly affects the material stiffness degradation.
Furthermore, macroscopic observation of the fatigue damage at the end of life of the tested specimens were able to determine that the main source of fatigue damage was caused by tension-tension cyclic loads and that relatively low amounts of damage were caused by cyclic compresion-compression loads. This observation was confirmed by the assessment of the LFoV micrographs. Macroscopic observations of damage that was caused by tensile fatigue loads also identified splitting damage as a possible cause for final failure of the composite specimens. Selected representative sub-images of the LFoV micrographs have been displayed in the results of this article and the full data-set with all 36 LFoV micrographs is available online. 17
Qualitative and quantitative observations of the LFoV micrographs leads to the following observations: • Saturation of transverse cracks in the three most severely loaded layers is reached after less than 1% percent of the full fatigue life of the tested specimens. This suggests that the continued global stiffness degradation throughout the full fatigue life time can not be driven by the transverse cracks. Conversely, the continuous increase in the number of fibre breaks suggests that fibre breaks are the cause for stiffness degradation. • The main cause of stiffness degradation can be attributed to a damage mechanism in which transverse cracks in transverse fibre bundles are the precursor for fibre breaks in the load carrying longitudinal fibre bundles. The damage mechanism is not a direct result of the transverse fibre bundles, but of the mode I cracks that occur in the transverse fibre bundles. The reason that the fibre breaks can be shown to occur in close proximity to the transverse fibre bundles is that these bundles are the location of the mode I cracks. • The fibre breaks that are caused by cracks in transverse bundles are more likely to occur in the longitudinal bundle to which the transverse bundle is attached to by polymeric thread. Close contact between transverse bundles with cracks serves as a better predictor for breakage of fibres than global variations in the stress level. • The transverse bundles of the outermost layer (T1) suffers less transverse cracks than the layers closer to the thickness center of the material (ie. layers T2 and T3). The reason is that the cracks in layer T1 acts as channel cracks rather than tunnel cracks. • Damage in the transverse fibre bundles are present as mode II cracks in the volume of the material where compressive stresses prevail, but do not cause damage that appear to influence the fatigue life of the tested specimens.
It should be noted here that the statements made above are based on observations of quasi-unidirectional non-crimp fabric composites with off-axis bundles oriented 90° relative to longitudinal fibre direction. Other researchers have made similar findings based on NCF with different orientations of the off-axis bundles. The observations made here are in agreement with the damage mechanism postulated by Zangenberg et al 1 on tension-tension fatigue, as well as conclusions and observations made by Jespersen et al.6,8 The novelty of this work lies in the quantification of the damage features - transverse cracks and fibre breaks - over large representative areas. The quantitative data supports both the qualitative observations in this work and the conclusion made by Zangenberg 1 and Jespersen.6,8
Footnotes
Acknowledgments
The authors gratefully acknowledges the financial support from Civilingeniør Frederik Leth Christiansen Almennyttige Fond.
Declaration of conflicting interests
The author(s) declared no potential conflicts of interest with respect to the research, authorship, and/or publication of this article.
Funding
The author(s) disclosed receipt of the following financial support for the research, authorship, and/or publication of this article: This work was supported by Civilingeniør Frederik Leth Christiansen Almennyttige Fond.