
Abstract
This paper presents a novel and efficient micromechanical framework for finite element simulation of damage and failure in 3-D printed aligned discontinuous fiber-reinforced composites. The framework can predict the initiation and propagation of different types of damage in the composite under tensile loading along the fibers’ axis. The micromechanical framework includes the microstructural representation of the composite with explicit fibers and matrix in addition to linear expansions at the ends. Accurate constitutive equations are utilized for fibers, matrix, and fiber/matrix interfaces in the microstructural representation. Fibers’ locations and lengths are generated randomly; based on a target distribution for the fibers’ aspect ratios measured experimentally; within the microstructural representation. Optimal microstructural representative dimensions for reliable investigation of the mechanical response are computed by conducting sensitivity analyses. The accuracy of the micromechanical framework is validated versus the experimental results of a 3-D printed aligned discontinuous fiber-reinforced composite as the composite of interest. It is shown that the proposed framework can simulate various aspects of the mechanical response, including the failure pattern and stress-strain behavior. Subsequently, the sensitivity of the mechanical response of the composite to a few constitutive equation-related parameters, including the strength and fracture toughness of the fiber/matrix interfaces and the matrix strength, is investigated. The correlation between the studied parameters and the composite’s strength and failure pattern is also analyzed and discussed. This paper delivers valuable guidance on the mechanical response of printed aligned discontinuous fiber-reinforced composites, eventually resulting in the paradigm-shifting design, manufacturing, and analysis of such advanced composites.
Keywords
Introduction
Additive manufacturing (AM) has become popular due to its ability to construct complex geometries at high speed without direct human supervision. The feedstock materials (resin) and printing techniques have been the subjects of several research studies, aiming to improve the mechanical performance of printed objects. To this end, AM of fiber-reinforced composites was the objective of several studies (e.g.).1–6 The mechanical performance of these printed composites are greatly improved if the fibers are aligned. Hence, new printing techniques were developed, enabling the injection of discontinuous carbon fiber-reinforced composites (DCFRCs) such that the fibers are highly oriented.2,7–9 In the printed aligned DCFRCs, the fibers’ alignment takes place during the injection process when fibers are passed through the micronozzle, and the larger the fiber aspect ratios (FARs), the higher the degree of alignment. FARs, on the other hand, cannot be too large since the printed feature resolution decreases as FARs increase. Hence, intermediate FARs (i.e. approximately between 20 and 200) are suitable for printed aligned DCFRCs. 8
Printing such composites requires a matrix with an optimum viscosity level to facilitate the injection process through the micronozzle. At the same time, the matrix must have high shear stiffness and strength to maintain its shape upon injection. Moreover, the matrix must have an optimum curing rate to enable rapid construction while not preventing adequate adhesion to the adjacent layer of resin deposited on its top. As a result, thermoplastics were used as the matrix in the printed DCFRCs with aligned fibers.2,7 Such composites, however, lack the desired mechanical performance to be used in high-performance applications due to lacking desirable resistance to high working temperatures. Only recently, a few researchers were able to develop fast-curing thermosetting matrices and injection technologies to enable the printing of high-performance structures with remarkable mechanical properties.6,8,9
The recent advancements in manufacturing high-performance printed aligned DCFRCs necessitate exhaustive investigations into the micromechanical behavior of these new composites. In order to better understand their micromechanical behavior, special efforts should be undertaken to understand the effective parameters in various aspects of the mechanical response. In particular, the impacts of the constitutive behaviors of matrix and fiber/matrix cohesive interfaces on the failure mechanism and strength of the composite demand meticulous investigations. Studying these phenomena requires developing robust finite element (FE) frameworks for simulating damage propagation and failure in the composites’ microstructure. These numerical studies are crucial for optimizing the engineering design and providing insight into the future direction of possible manufacturing improvements.
The existing numerical frameworks for studying the mechanical behavior of discontinuous fiber-reinforced composites have been primarily developed for composites with short, randomly oriented fibers.10–14 These frameworks simulated a 3-dimensional (3-D) representative volume element (RVE) of the microstructure in which the fibers and matrix were explicitly modeled. Hindered by the requirement of extremely high computational power, these frameworks were used mainly to study homogenized elastic constants. A few studies proposed micromechanical frameworks to investigate the elastic properties of conventional injected aligned discontinuous carbon fiber-reinforced thermoplastics with large FARs
The numerical models investigating the damage propagation and failure of aligned DCFRCs through simulations of 3-D RVEs have seldom been found in the literature. In addition to the consideration of various geometrical simplifications, these simulations either incorporated narrow RVEs with small cross-section
17
or only were applied to composites with small FARs
To accurately simulate damage propagation and failure, a volume element of the composite should contain an optimum number of fibers along every dimension and take into account the distribution of FARs to be a suitable representative for the microstructure. In summary, accurate numerical analysis of damage propagation and failure of aligned DCFRCs requires full 3-D FE simulations, where the fibers, matrix, and fiber/matrix interfaces are explicitly considered within a sufficiently large RVE that can capture the significant geometrical features.
Objectives and contributions
In this paper, a novel and efficient micromechanical framework for the prediction of damage propagation in the 3-D representations of aligned DCFRCs is proposed. The micromechanical framework includes the microstructural representation of the composite with explicit fibers and matrix in addition to linear expansions at the ends. Accurate constitutive equations are utilized for fibers, matrix, and fiber/matrix interfaces in the microstructural representation. Fibers’ locations and lengths are generated randomly; based on a target distribution for the fibers’ aspect ratios measured experimentally; within the microstructural representation. The goal is to capture the initiation and propagation stages of different types of damage and eventual failure in such composites’ microstructure due to loading along the fibers’ axis. We also aim to pursue mesoscale modeling instead of a concurrent or non-concurrent multi-scale modeling methodology to prevent high computational costs and modeling complexities.
Therein lie the novel features of our proposed numerical framework: • An effective micromechanical model is established. The model utilizes linear matrix expansions at the RVE’s ends that minimize the impacts of the imposed boundary conditions and prevent undesired failure. The micromechanical model also eliminates the need for periodic boundary conditions and multi-scale modeling. • A robust algorithm for the random generation of fibers’ locations and lengths is developed, and an optimum RVE for the studied composite is selected. • Accurate constitutive equations are utilized to simulate the mechanical response of each constituent (i.e. fibers, matrix, and fiber/matrix interfaces).
This paper provides critical guidance on the mechanical response and failure behavior of additively manufactured aligned DCFRCs, eventually leading to innovative design, manufacturing, and analysis of such composites.
The rest of this paper is organized as follows. We first present the proposed micromechanical model. Then, we present the constitutive equations for simulating fibers, matrix, and fiber/matrix interfaces and validate the accuracy and robustness of the proposed micromechanical model. Finally, the micromechanical model is used to study the impacts of a few constitutive equations parameters on the composite’s mechanical response. The proposed micromechanical model’s material and geometrical parameters are defined based on a 3-D printed aligned discontinuous fiber-reinforced thermoset developed by as the composite of interest. 9
The micromechanical model
This section proposes a full 3-D micromechanical model for simulating aligned DCFRCs on the microstructure level. The overview of the proposed micromechanical model is illustrated in Figure 1(a). The micromechanical model contains an RVE of unidirectional and discontinuous fibers with varying aspect ratios embedded within a matrix. Inside the RVE, the fibers and matrix are explicitly considered. A periodic boundary condition was not imposed on the RVEs, and instead, the RVE dimensions were selected to be large enough to minimize the inaccuracies associated with this simplification. Moreover, the micromechanical model includes two types of expansions at the ends. First, fibers are considered within the matrix, but the matrix is assumed to be linear, and the perfect bonding between the fibers and the matrix is assumed (i.e. LLinear.m in Figure 1(c)). These linear matrix portions of the RVE with a length Llinear.m next to each end prevents a premature failure, normally initiating at the intersections of RVE and the linear matrix expansions. Second, a homogeneous linear material is added at the two ends (i.e. Lexp .m in Figure 1(c)). These two linear homogeneous matrix expansions are incorporated to minimize the impacts of the imposed boundary conditions on the mechanical response and failure mode. In the middle part of the RVE, linear fibers, nonlinear matrix, and interfacial debonding behaviors are all explicitly considered. It should be noted that, in practice, a failure near two grips of the sample is not desired and must be avoided. Our proposed partitioning of the composite sample enforces the failure events to happen in a random manner (in fact, due to different random microstructural representations), sufficiently far from the RVE’s ends. Schematic illustration of the proposed micromechanical model and the geometrical parameters: (a) the overall model geometry and the enforced boundary conditions, (b) uniformly distributed unit cells, each containing two discontinuous aligned fibers, (c) and (d) intersection views of the 3-D geometry and a unit cell.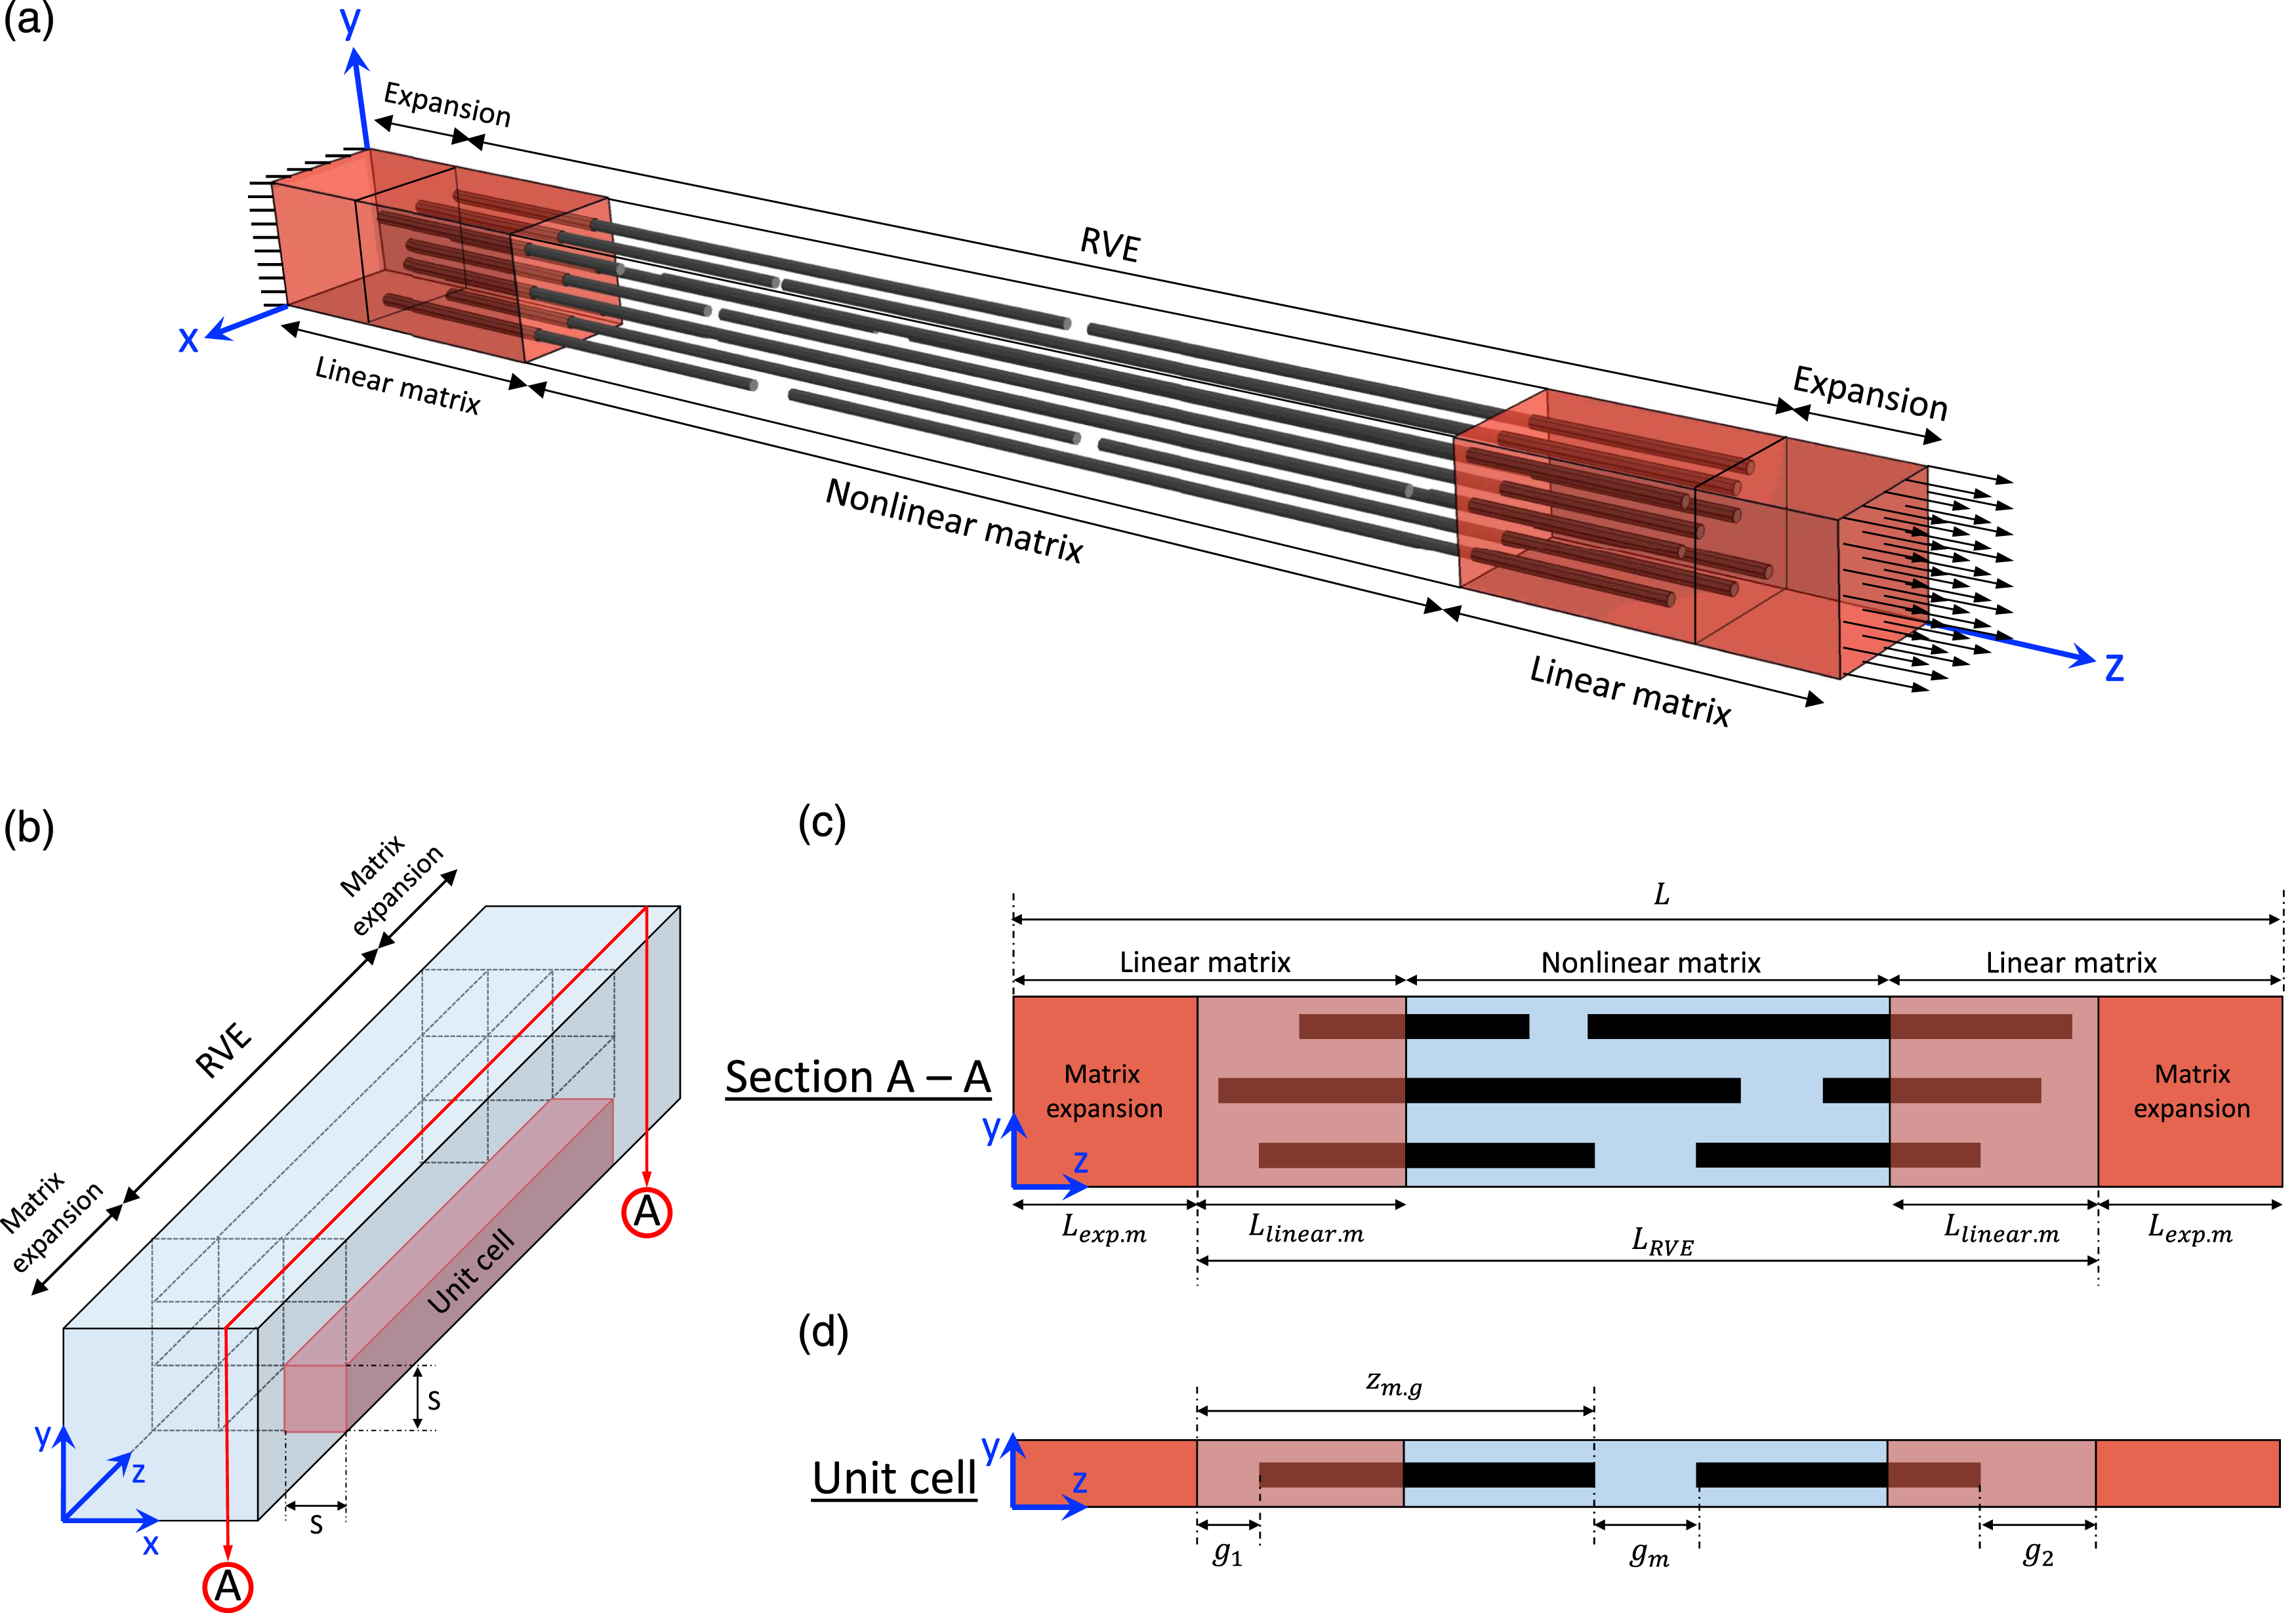
The micromechanical model was subjected to longitudinal tension by restraining the displacement of one end (at z = 0) in the direction along the fibers’ axis (i.e. z-direction) while applying loading in the z-direction to the opposing end (at z = L, where L is the dimension of the model geometry along the z-axis). It must be noted that the strain was evaluated only based on the elongation of the RVE, excluding the contributions of the expansions’ elongation from the strain calculation. In the subsections that follow, the geometry of the RVE and the algorithm for its random generation are described in detail.
Representative volume element
The RVE described herein consists of aligned fibers of varying aspect ratios that are randomly distributed along the z-axis and uniformly distributed along the directions transverse to the fibers’ axis (i.e. x − y plane). It must be noted that the fibers’ lengths and locations in the z direction are random, while the fibers are perfectly aligned in this work. Moreover, the fibers’ distribution in the x − y directions is known to affect the mechanical response of unidirectional fiber-reinforced composites under loading transverse to the fibers’ direction.20–23 However, for a loading scenario along the fibers’ direction, the distribution of fibers in the x − y plane is not expected to significantly impact the mechanical responses, especially when the fiber volume fraction is low (i.e. the case of 3-D printed DCFRCs, for example, 5.5% fiber volume fraction in the work of). 9 Hence, considering a uniform distribution of fibers in x − y directions is a reasonable simplification. The goal is to develop a random generating algorithm to produce RVEs such that the distribution of fibers’ aspect ratio and volume fraction fit to an experimentally measured distribution and a specific value, respectively. The details of the RVE geometry and procedure for its random generation are described as follows.
Description of RVE geometry
The proposed RVE consists of a number of unit cells that are uniformly distributed in x − y directions in the form of n × n Cartesian grids, as depicted in Figure 1(b). Each row and column of the grids correspond to a unit cell with the same dimensions (S) along the x and y axes. Each unit cell contains two fibers of random lengths, located back-to-back, as illustrated in Figure 1(c). The z locations of the fibers within each unit cell are random, resulting in three gaps of variable lengths, as shown in Figure 1(d); between an RVE end and the first fiber tip (g1), between the first and second fibers (g m ), and between the second fiber tip and the other end of RVE (g2). The second gap, g m , is located at a distance zm.g away from the first end of the RVE. These four gap variables (i.e., g1, g m , g2, and zm.g) are sufficient to describe the length and locations of the two fibers within each unit cell.
Procedure for random generation of RVE geometry
Several geometrical parameters are required to input into the random generator algorithm to construct a representative microstructure. The generated RVEs herein are programmed to match a partially experimentally-measured target microstructure in this work. We propose an algorithm for random generation of the RVE based on the gap variables and a number of hyperparameters (i.e. “tunable” parameters) and target attributes. The hyperparameters are the RVE length (L
RVE
), number of unit cells (n × n), and gap length restrictions (GLR), defined as minimum and maximum limits for the total gap length (i.e. g1 + g
m
+ g2). GLR is enforced to facilitate the convergence and enable controlling
The entire process of random RVE generation is schematically shown in the flowchart in Figure 2. The inputs to the algorithm are hyperparameters and target attributes. The algorithm initially generates an RVE based on L
RVE
and n, and randomly initializes the variables (i.e. g1, g
m
, g2, and z
mg
) for all the unit cells, considering GLR. Then, the distribution of FARs is adjusted iteratively by randomly selecting a unit cell and values for the variables per iteration. The selected values are accepted if only they improve the distribution of FARs. Note that the criterion for improved distribution of FARs is to get more similar to the experimentally reported distribution. If the criterion is not met, the selected values are rejected. This process is repeated until the similarity between the distributions of FARs and the target distribution is maximized. The similarity between the generated and target distributions is calculated using the Kullback–Leibler (KL) divergence measure. The KL divergence is a popular statistical parameter to determine how similar a probability distribution is to a reference probability distribution and can take any value greater than zero.
24
At the end of the iterations, when the distribution of FARs is no longer improved, the absolute difference between the generated and target values of The flowchart of the proposed algorithm for random generation of 3-D printed aligned DCFRC’s microstructure based on a target distribution for FARs, a target 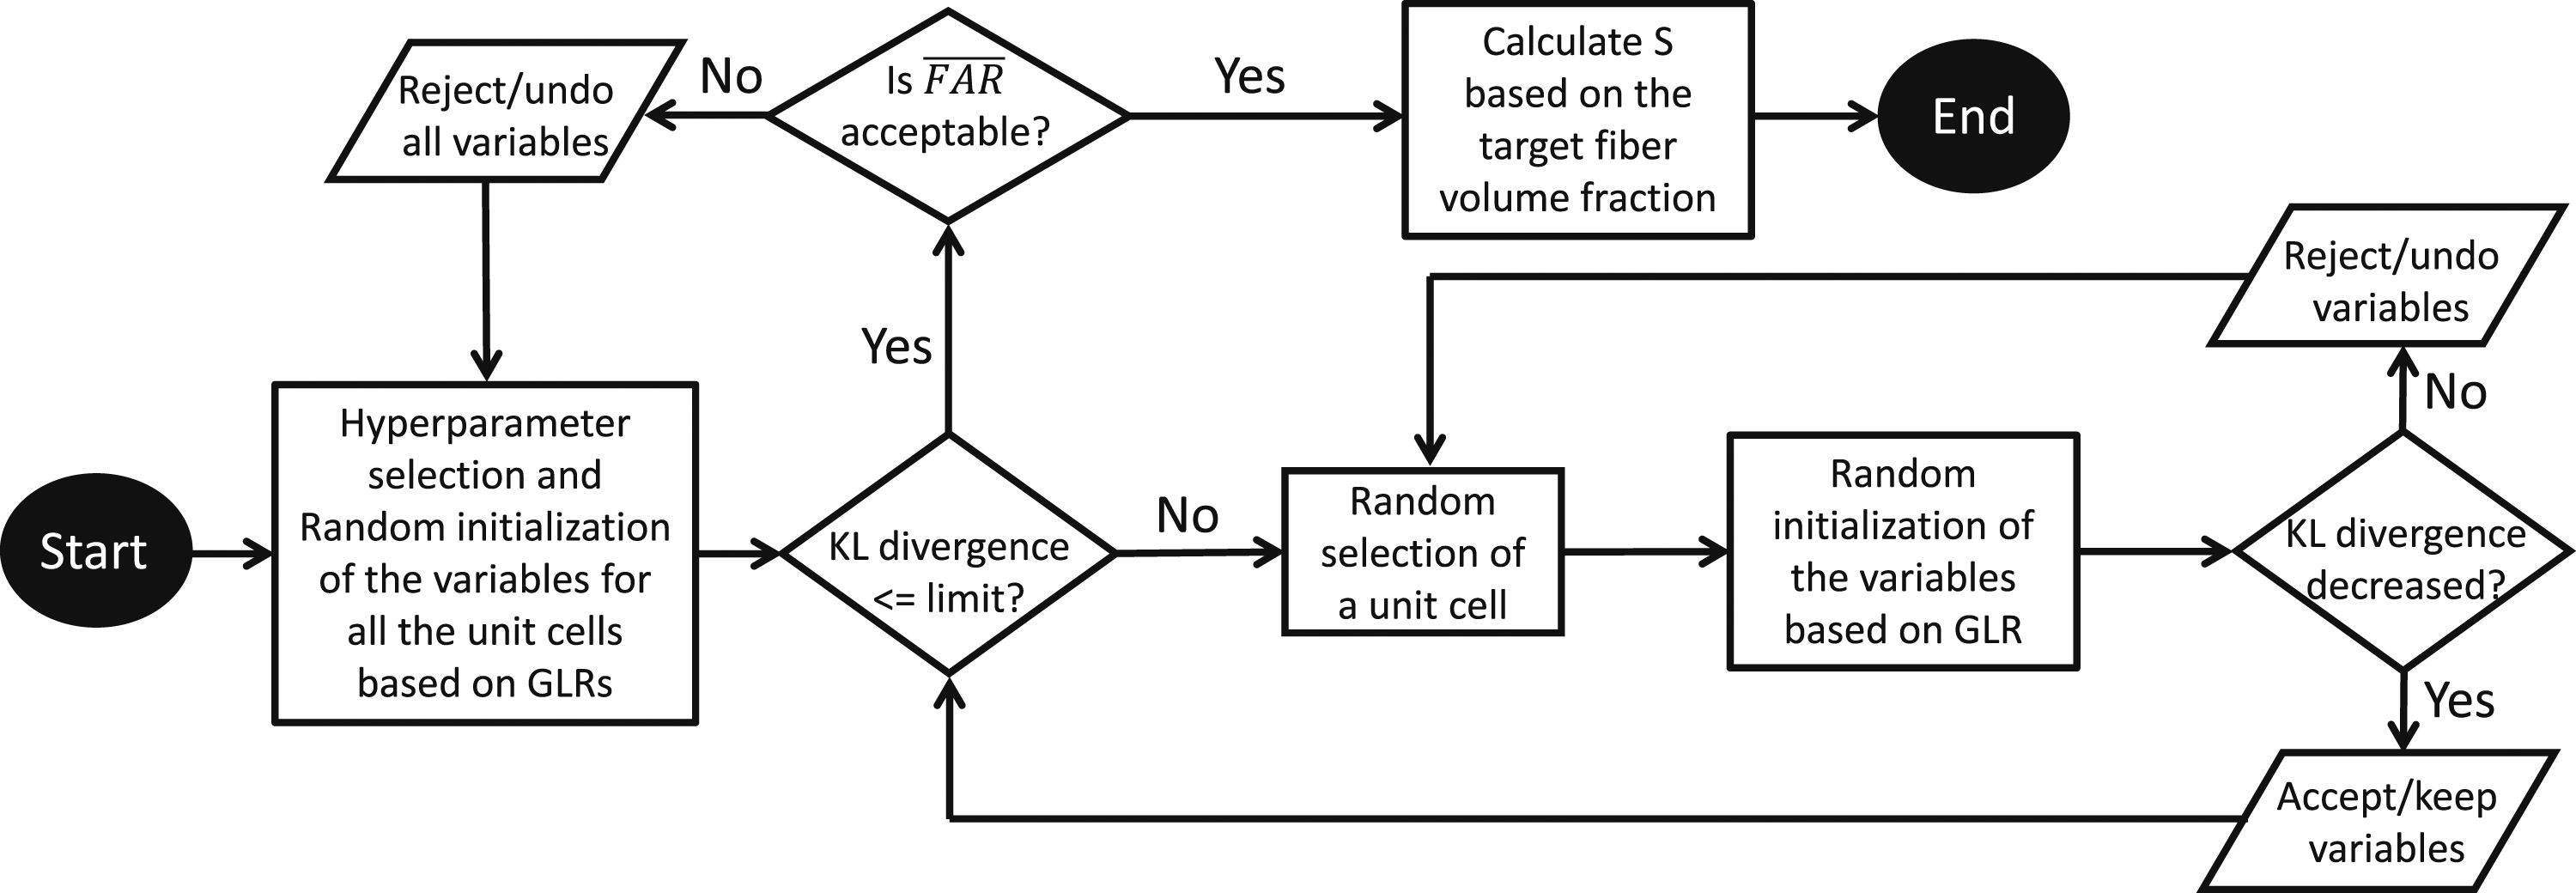
This final condition is automatically met if the RVE is long enough to capture the entire FARs’ distribution. However, as discussed in the Validation section, a shorter RVE can be considered to decrease the computational cost. In this case, the algorithm still requires the generated and target values of
In terms of computational cost, the efficiency of the proposed framework depends on the dimensions of the numerical model geometry, which in turn, depends on FARs. Hence, the framework is ideal for investigating composites with intermediate FARs (e.g. 3-D printed DCFRCs) as the simulations can be run using a computer with an ordinary multi-core processor. Note that an ordinary machine at the time of publishing this paper can be defined as a machine with, e.g. an Intel Core i7 processor and a 16 GB memory. The functionality of the proposed framework in studying composites with large FARs depends on the availability of computational resources.
Constitutive equations
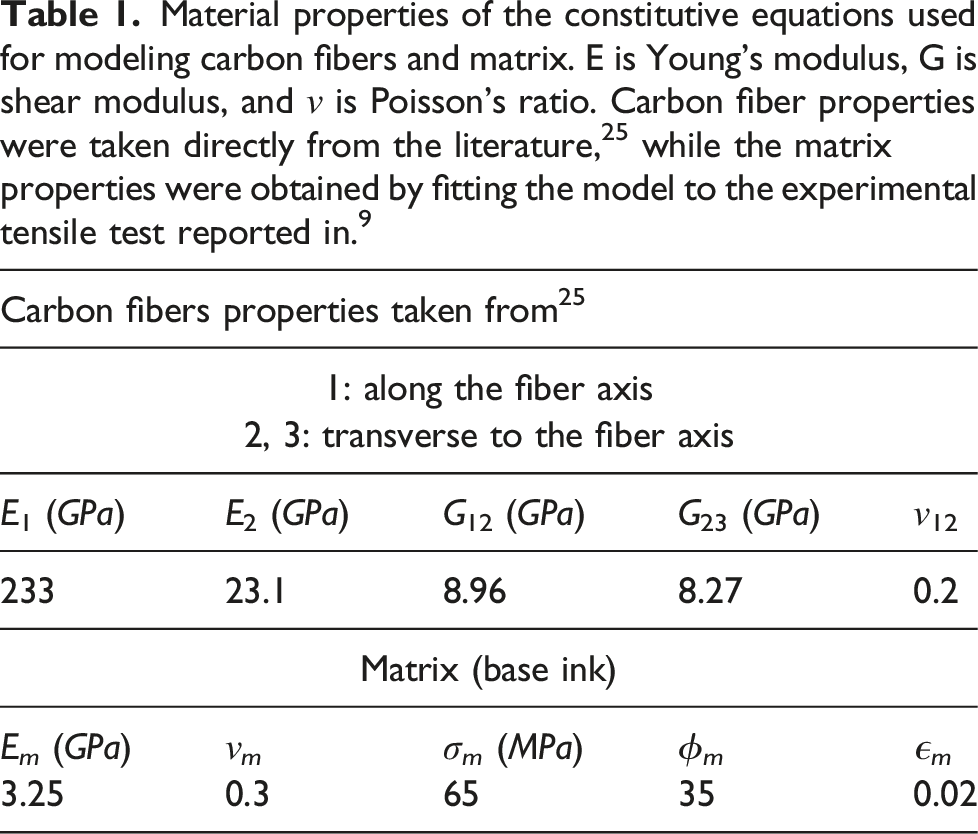
The constitutive equations were selected such that they accurately simulated the materials used in the 3-D printed composites developed by. 9 In those composites, 5 μm diameter carbon fibers were embedded within a modified thermosetting epoxy (resin).
Fibers
Material properties of the constitutive equations used for modeling carbon fibers and matrix. E is Young’s modulus, G is shear modulus, and ν is Poisson’s ratio. Carbon fiber properties were taken directly from the literature, 25 while the matrix properties were obtained by fitting the model to the experimental tensile test reported in. 9
Matrix
Based on an experimental tensile test, the constitutive behavior of the matrix was observed to be linear before brittle failure. 9 A bi-linear stress-strain behavior within a damage plasticity constitutive equation was then assumed to simulate the nonlinear response of the matrix. For two linear matrix portions, the linear stress-strain behavior with no failure was utilized (see Figure 1(a)).
The damage plasticity constitutive equation proposed by 26 was used to simulate the nonlinear matrix’s response. The damage model was initially proposed for concrete; however, it has also been proven accurate for modeling other quasi-brittle materials, including thermosetting epoxies.27–30 In the constitutive equation, failure initiation is determined based on a yield criterion initially proposed by 26 and later modified by. 31 For the matrix of interest in this research, the constitutive behaviors under tension and compression were assumed to be the same. This assumption was justified by recognizing that the fiber volume fraction in the composite of interest herein is low (i.e. 5.5%, in comparison with the high fiber volume fraction, i.e. usually above 50%, in conventionally-manufactured composites), and thus, the type of induced stresses in the matrix is primarily tensile for the case of tensile loading along the fibers’ axis. Note that the internal shear forces between the fibers and the matrix (also known as shear lag) are taken into account by modeling the interfacial debonding. The damage model employs a Drucker-Prager hyperbolic yield criterion as the plastic-flow potential, accounting for the pressure dependency of brittle materials through an angle of internal friction ϕ m . This yield criterion has been frequently utilized to deal with the plastic deformation of polymers and other pressure-dependent materials 32 and. 33
The bi-linear stress-strain behavior utilized is as follows. The pre-failure behavior of the matrix was assumed linear with Young’s modulus E
m
and a Poisson’s ratio ν
m
before the strength σ
m
, and the corresponding yield strain ϵ
m
, was reached. The post-failure stress followed a linear decay until the ultimate strain, i.e., the effective plastic strain at the complete failure 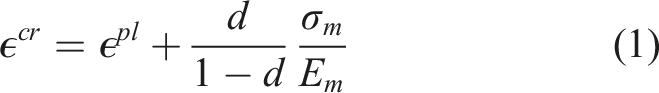
We then calibrate the plasticity damage constitutive framework for the matrix’s behavior against the tensile test on the matrix material. The calibrated parameters of the constitutive behavior for the matrix of interest are presented in Table 1. The comparison between the numerically and experimentally measured stress-strain responses is illustrated in Figure 3, demonstrating the performance of the employed constitutive model in accurately simulating the matrix’s mechanical response. As depicted in Figure 3, no experimental data was available for the post-failure stress-strain response. It should be mentioned that a linear stress-strain constitutive behavior followed by a sudden brittle failure could not be assumed for simulating the nonlinear response of the matrix since it would not capture the observed softening due to the inherent plastic behavior of the epoxy matrix. Stress-strain response of the matrix (resin), comparing numerical and experimental results.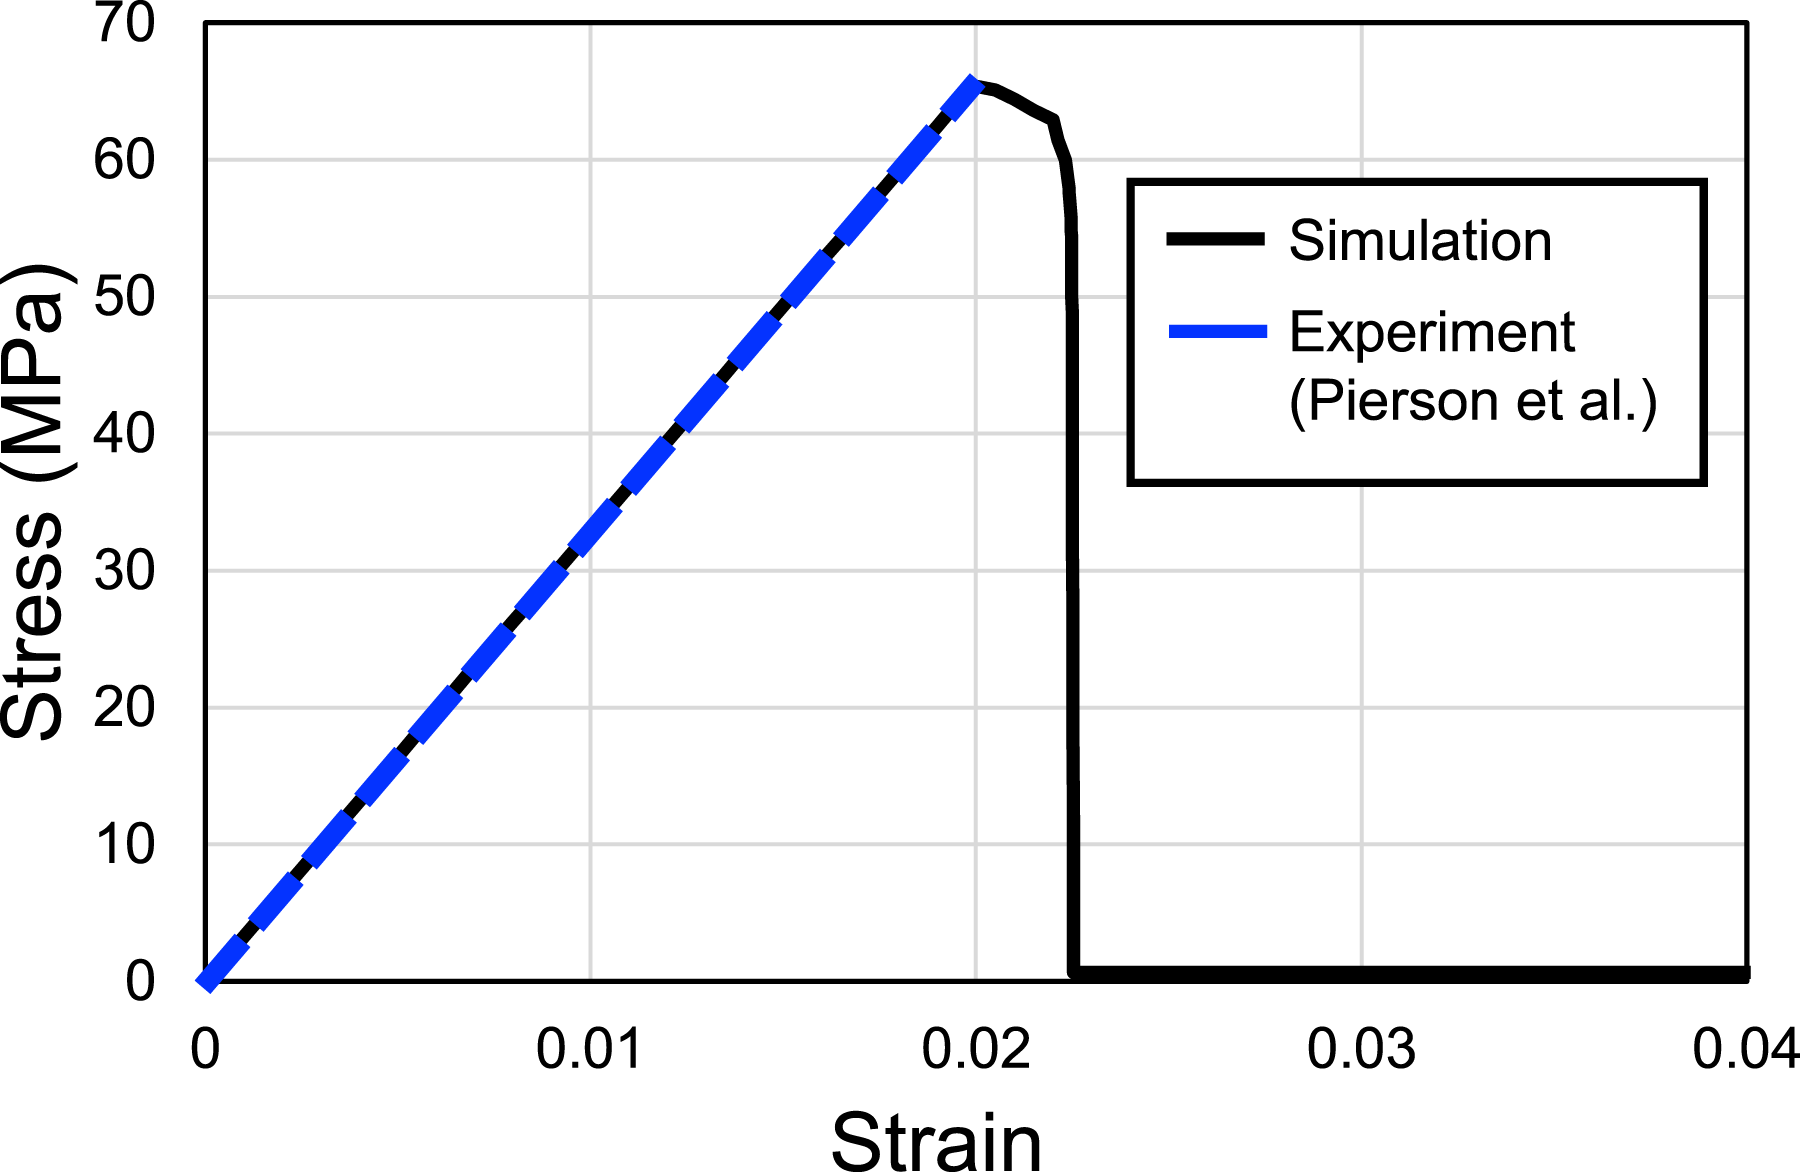
Fiber/matrix interfaces
A cohesive zone model for simulating fiber/matrix interfaces was used to incorporate the interfacial debonding. In the constitutive equation, a penalty contact was assumed for the interfaces before the traction exceeds a specified interface strength, σ c . After the initiation of failure, the traction-separation law decreases to zero, following a linear decay. The linear decay slope depends on the interface’s fracture toughness, G c .
According to the composite’s configuration and the specific loading scenario in this work (i.e. longitudinal loading along the fibers) and the fundamentals of fracture mechanics theory, debonding at the fiber/matrix interfaces is Mode II (i.e. tangential, occurring along the fibers) or Mode I (i.e. normal, occurring at the fiber tips). Mix-mode debonding scenarios in this configuration are highly unlikely and, thus, not dominant. Moreover, since the total areas of fiber tips are significantly smaller than the total lateral areas by a factor equal to
The values of σ c and G c were selected based on the experimental results of the 3-D printed composite of interest 9 such that the desired tensile strength and failure pattern for the composite were attained. The calibrated values for σ c and G c were 50 MPa and 150 N/m, respectively. These values are consistent with those measured experimentally for the Mode II debondings of fibers from thermosetting resins.28,35–38 The experimentally measured values range from 30 MPa to 100 MPa for σ c and 80 N/m to 300 N/m for G c .
When modeling brittle interface debondings, CZMs can prevent the convergence in the FE solver by causing the iterations to enter an infinite cycle. 39 This convergence issue was addressed by using the viscous regularization method, adding small amounts of artificial viscosity to the CZM’s traction-separation law to facilitate the convergence. 40 To minimize the effect of the viscous regularization on the accuracy, the viscosity parameter was chosen to be the smallest possible value. In this work, the viscosity parameter 0.0001 was selected.
Validation
The proposed micromechanical model in this work was validated based on the experimental results of a 3-D printed composite, 9 where the authors developed four inks with different fiber volume fractions and distributions of FARs. In this study, only the printed specimens with the largest fiber content (i.e. 5.5%) were considered since they demonstrated a more desirable mechanical performance in terms of both stiffness and strength.
Several RVEs were generated for verification purposes. The constructed RVEs were simulated using Abaqus-Standard under a static loading scheme. 41 An Abaqus/Python script was developed to automate the simulation process. The script takes the details of an RVE’s geometry and all the model parameters as the input, automatically generates the micromechanical model, runs the simulation, and post-processes the results. The simulations were conducted using the Cascades cluster in the Advanced Research Computing (ARC) at Virginia Tech. For simulating each individual RVE, an Intel Broadwell 2 × E5 − 2683v4 2.1 GHz CPU, containing 32 processors was employed.
In the following subsections, we explain, in turn, the utilized meshing, the details of the generated RVEs and their validation, and the validation of their mechanical response and failure mode.
Meshing
The fibers and the matrix were meshed using 8-node linear isoparametric (C3D8) and 4-node linear tetrahedral (C3D4) elements, respectively. A mesh sensitivity analysis was conducted to optimize the element sizes in various regions, attempting to balance computational effort and accuracy. The element sizes were controlled by enforcing the uniform placement of a specified number of mesh nodes along the edges of the fibers and unit cells. Figure 4 illustrates an example of the utilized meshing for the fibers and the matrix in a sample RVE. The fiber/matrix interfaces were simulated using the “interaction” of the fiber and matrix elements. For defining the interaction, a surface-to-surface contact type with the small, not finite, sliding formulation was utilized.
41
An example of utilized meshing for the fibers and the matrix within an RVE.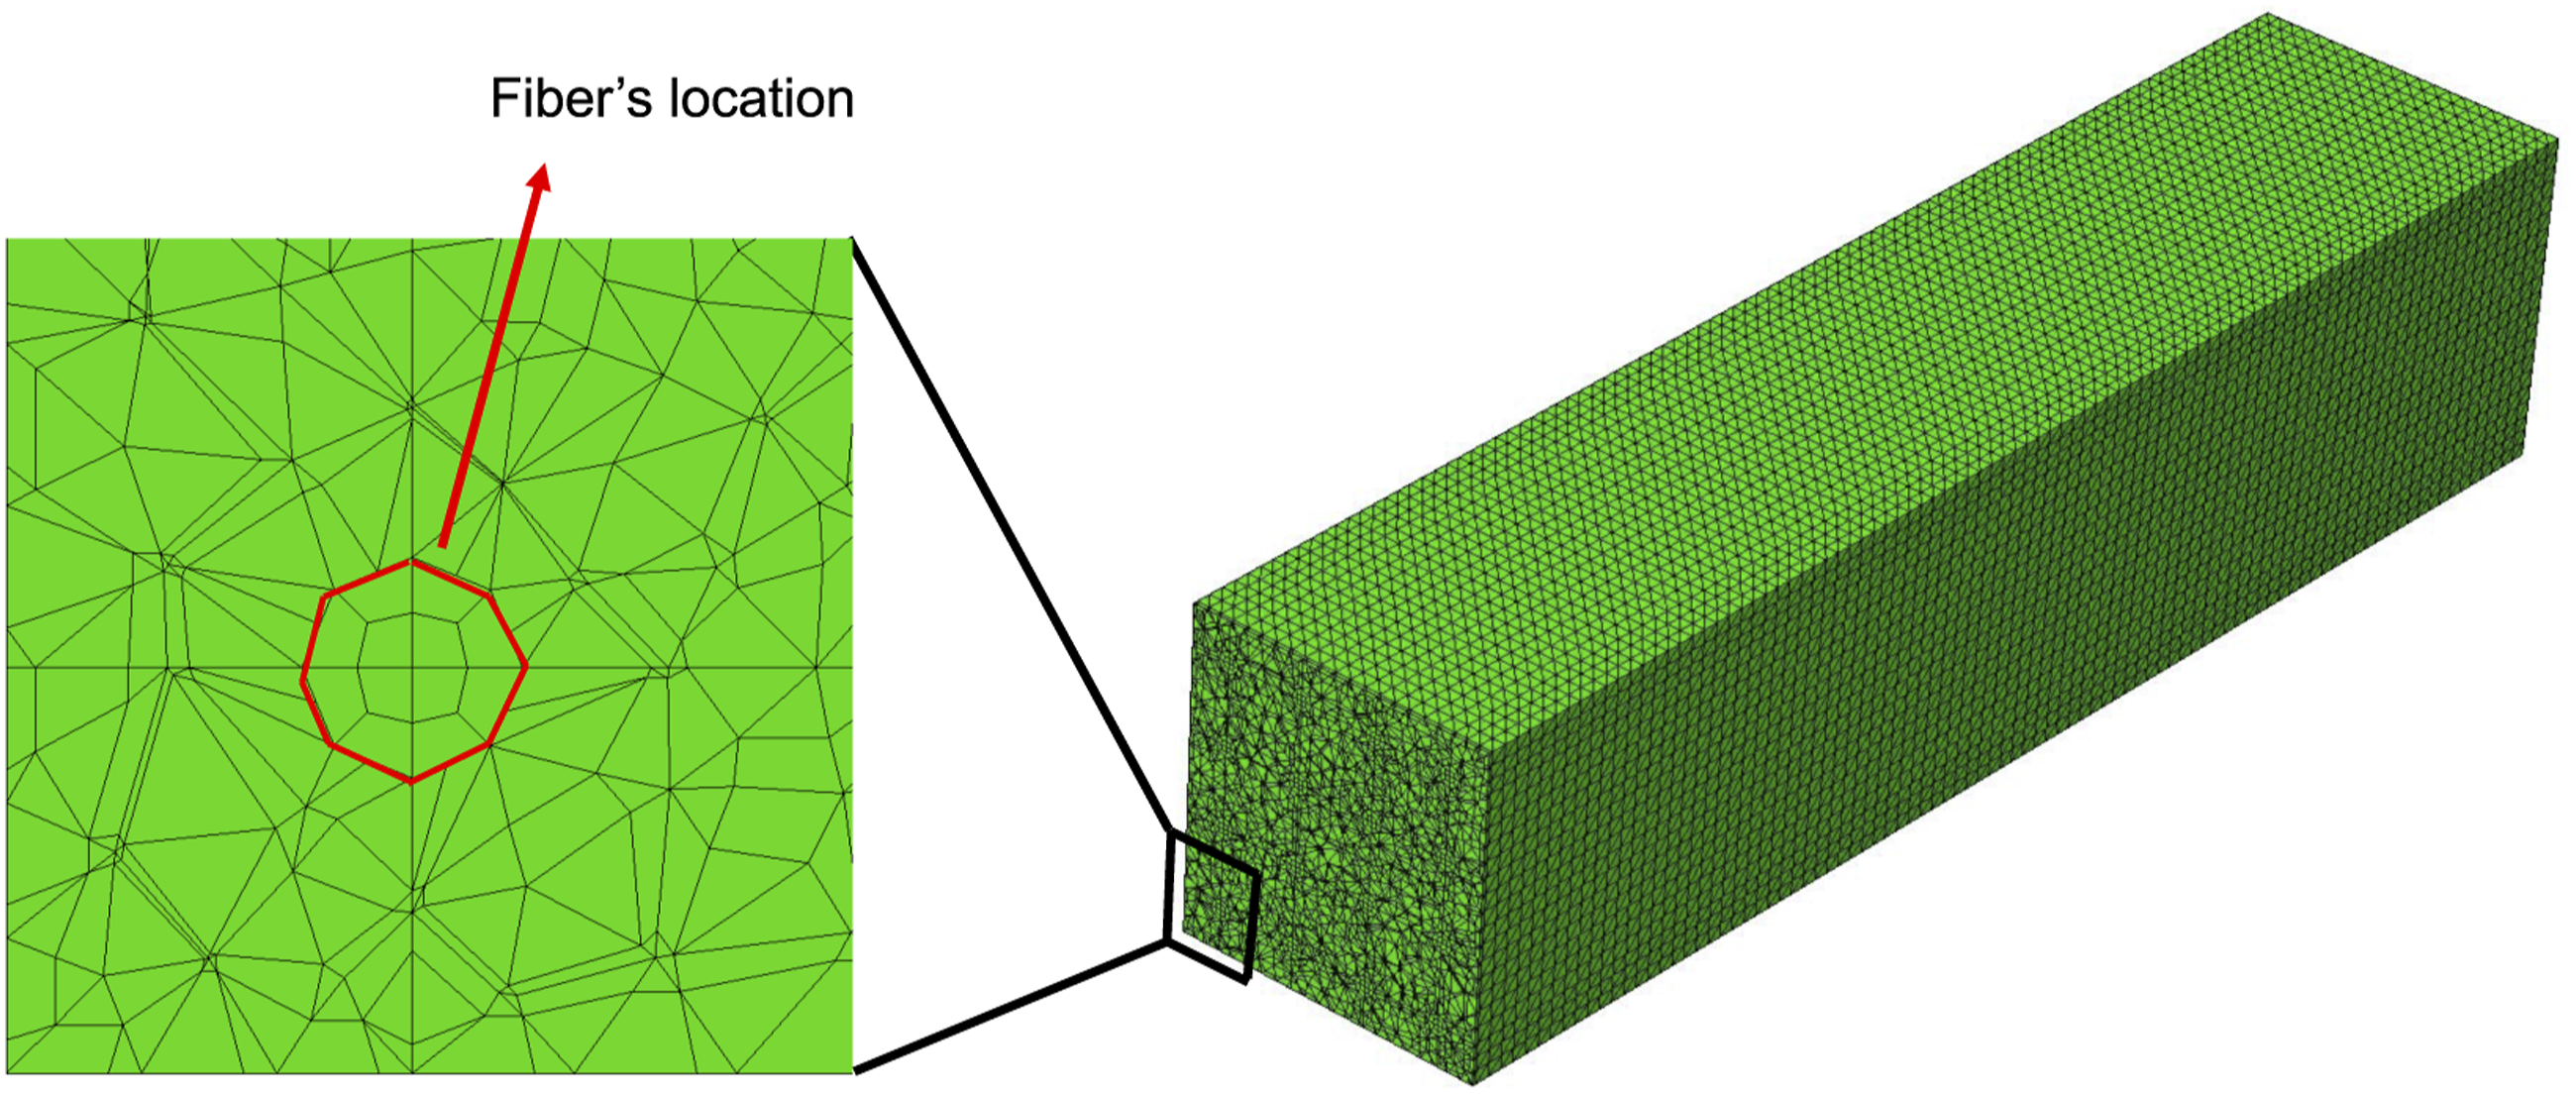
Validation of RVE geometry
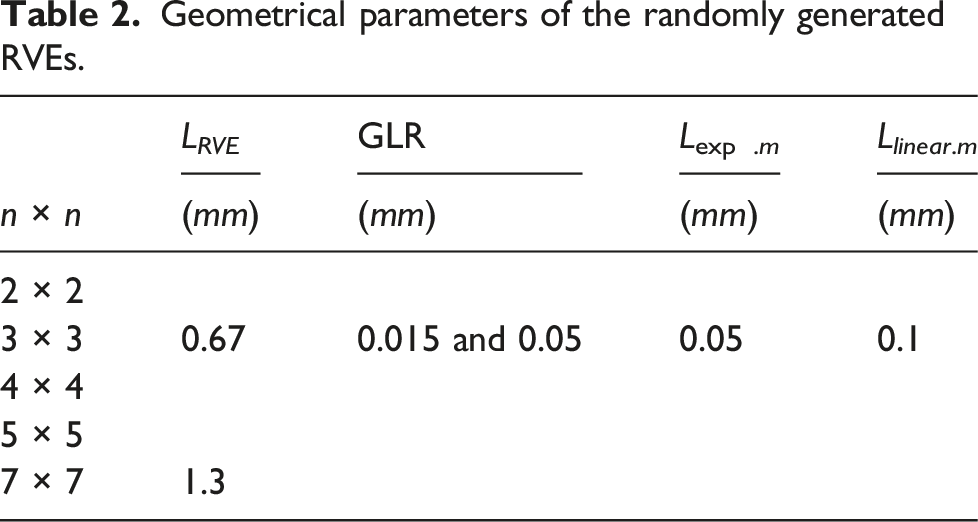
To validate the model geometry and mechanical responses of the proposed micromechanical framework, five cases of 2 × 2, 3 × 3, 4 × 4, 5 × 5, and 7 × 7 RVEs were considered. The RVEs were generated such that the fiber volume fraction of the composite of interest was 5.5% and the FARs followed a Weibull distribution with the scale and shape parameters equal to 70.2 and 1.53, respectively, resulting in an • The geometrical target attributes, as described in the Representative volume element subsection, can be well captured in the RVE. • The RVE dimensions were to be as small as possible so that the computational cost can be minimized, and at the same time, accurate mechanical responses can be simulated.
As one of the hyperparameters of the algorithm, L
RVE
significantly impacts the computational cost, primarily because as L
RVE
increases, the cross-sectional area should also increase to maintain an appropriate aspect ratio for the RVE. Additionally, as L
RVE
increases, more fibers need to be incorporated in order to maintain a target fiber volume fraction. An L
RVE
large enough to capture the entire target distribution was determined to be 1.3 mm. However, it was verified that with an L
RVE
50% smaller and equal to 0.67 mm, it was possible to capture 80% of the target FARs’ distribution as well as the target
First, several geometrical parametric studies were conducted to realize the effects of Lexp.m and Llinear.m on the obtained tensile strength and failure response. Figure 5(a) displays the impacts of these geometrical parameters on the composite tensile strength. In this figure, Llinear.m were changed while Lexp.m was kept constant at 0.05 mm, and Lexp.m varied with Llinear.m being constant at 0.1 mm. As seen in this figure, the variations of these geometrical parameters do not affect the obtained strength significantly. Note that an approximate plateau can be observed after Lexp.m = 0.05 (see the solid black line in Figure 5(a)), denoting the point with the least impact of the matrix expansion, and consequently the applied boundary condition, on the obtained strength. Figure 5(b) demonstrates an example of failure pattern at the smallest Llinear.m, i.e. 0.025 mm, with Lexp.m = 0.05 mm. As observed in this figure, at the smallest Llinear.m, some matrix damage events happen near the RVE’s ends. However, in practice, the failure near two grips of the sample is undesired and must be avoided (see the micromechanical section). Lexp.m and Llinear.m were chosen to be 0.05 mm and 0.1 mm, respectively, which were the smallest values that could effectively minimize the impact of the applied boundary conditions on the mechanical response and prevent a premature failure. Simulation results showing the effects of Llinear.m and Lexp.m on (a) the composite tensile strength and (b) failure pattern of the RVE at the post-failure loading stage when the resistance is decreased by 5%.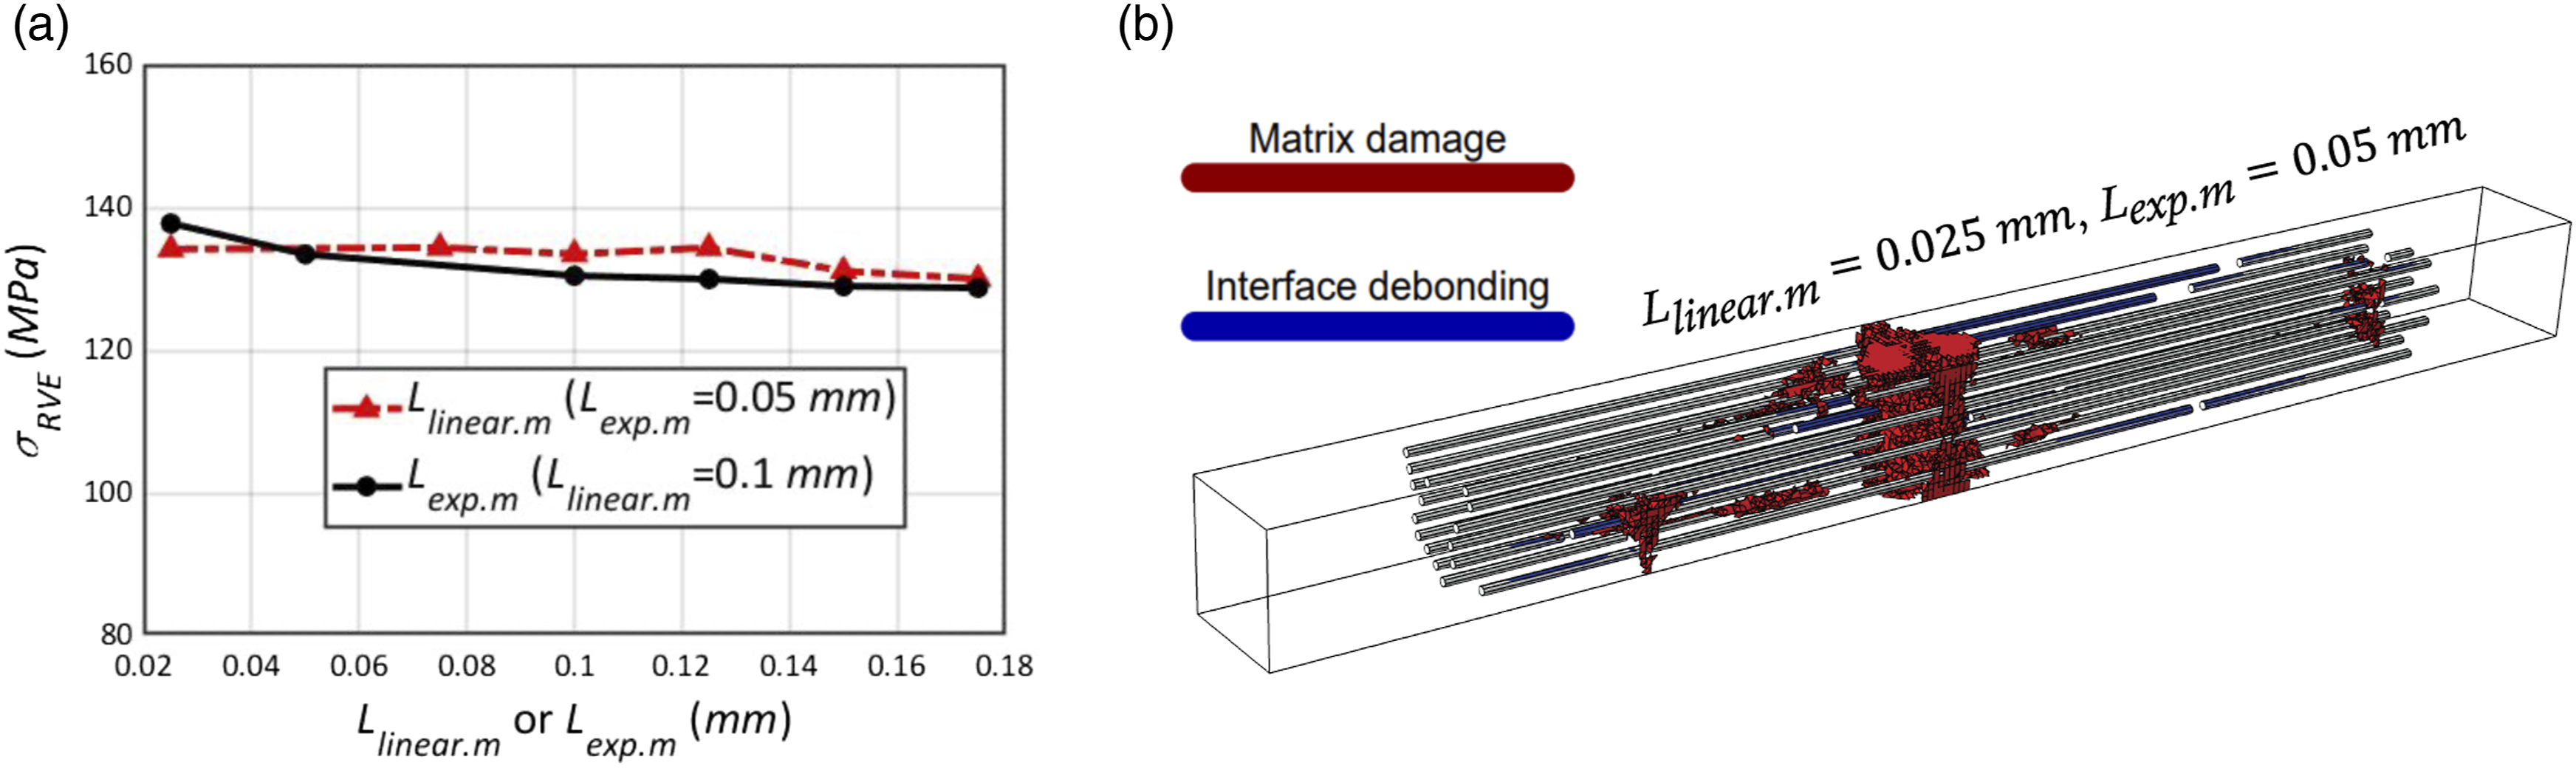
Geometrical parameters of the randomly generated RVEs.
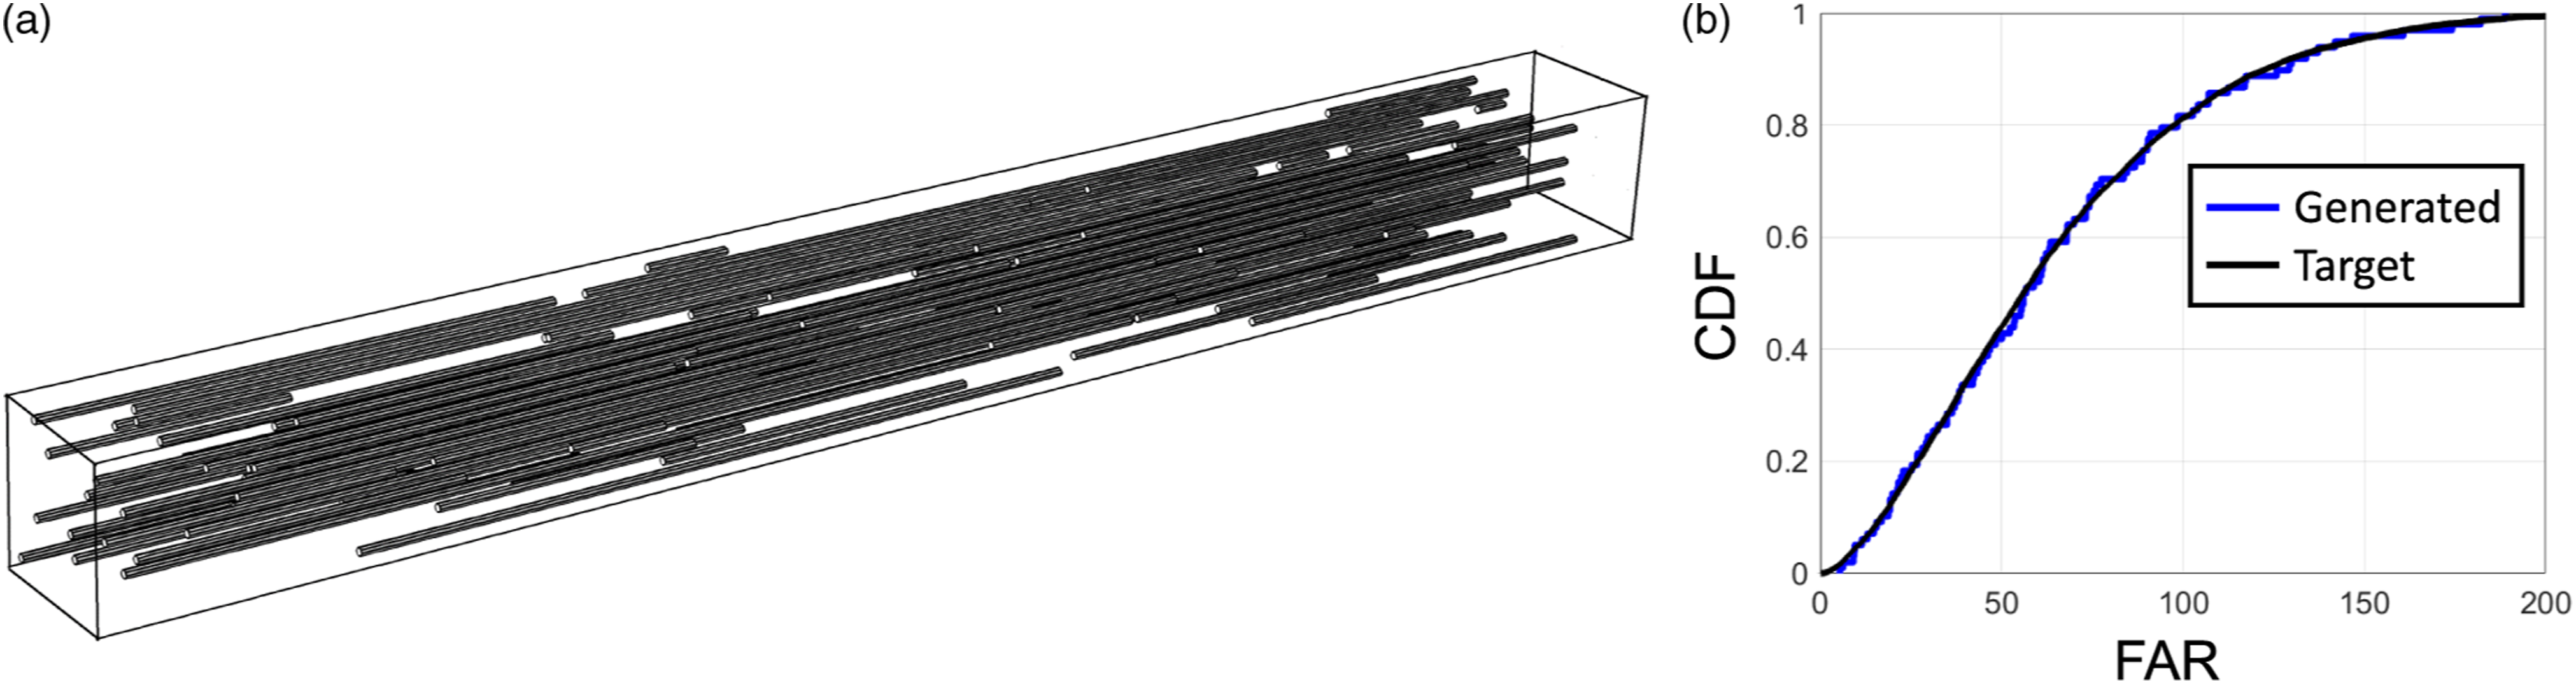
As an example, the unadjusted distribution of FARs, based on random initialization of variables at the beginning of the iterations, is illustrated in Figure 6(a). During the iterations for adjusting the FARs’ distribution, the similarity between the generated and target distributions for FARs increases. Note the decrease in KL divergence as the number of accepted iterations increases, shown in Figure 6(b). The similarity between the generated and target distributions at the end of the iterations is depicted in Figure 6(c) and the final generated RVE is presented in Figure 6(d). As described earlier, 20% of the target distribution for FARs was not captured, but instead, both the generated and target distributions had the same Illustration of the procedure for generating a sample 5 × 5 RVE: (a) the comparison between the FARs distribution of the initially generated RVE and the target distribution based on their cumulative density functions (CDFs), (b) decrease of KL divergence, evaluated based on the generated and target FARs distributions with the increase of the number of accepted iterations, (c) the comparison between the FARs’ distribution of the final generated RVE and the target distribution based on their CDFs, and (d) the final generated RVE. (a) Example of a generated 7 × 7 long RVE that can capture the entire target distribution of FARs and (b) the comparison between the FARs’ distribution of the generated 7 × 7 long RVE and the target distribution based on their CDFs.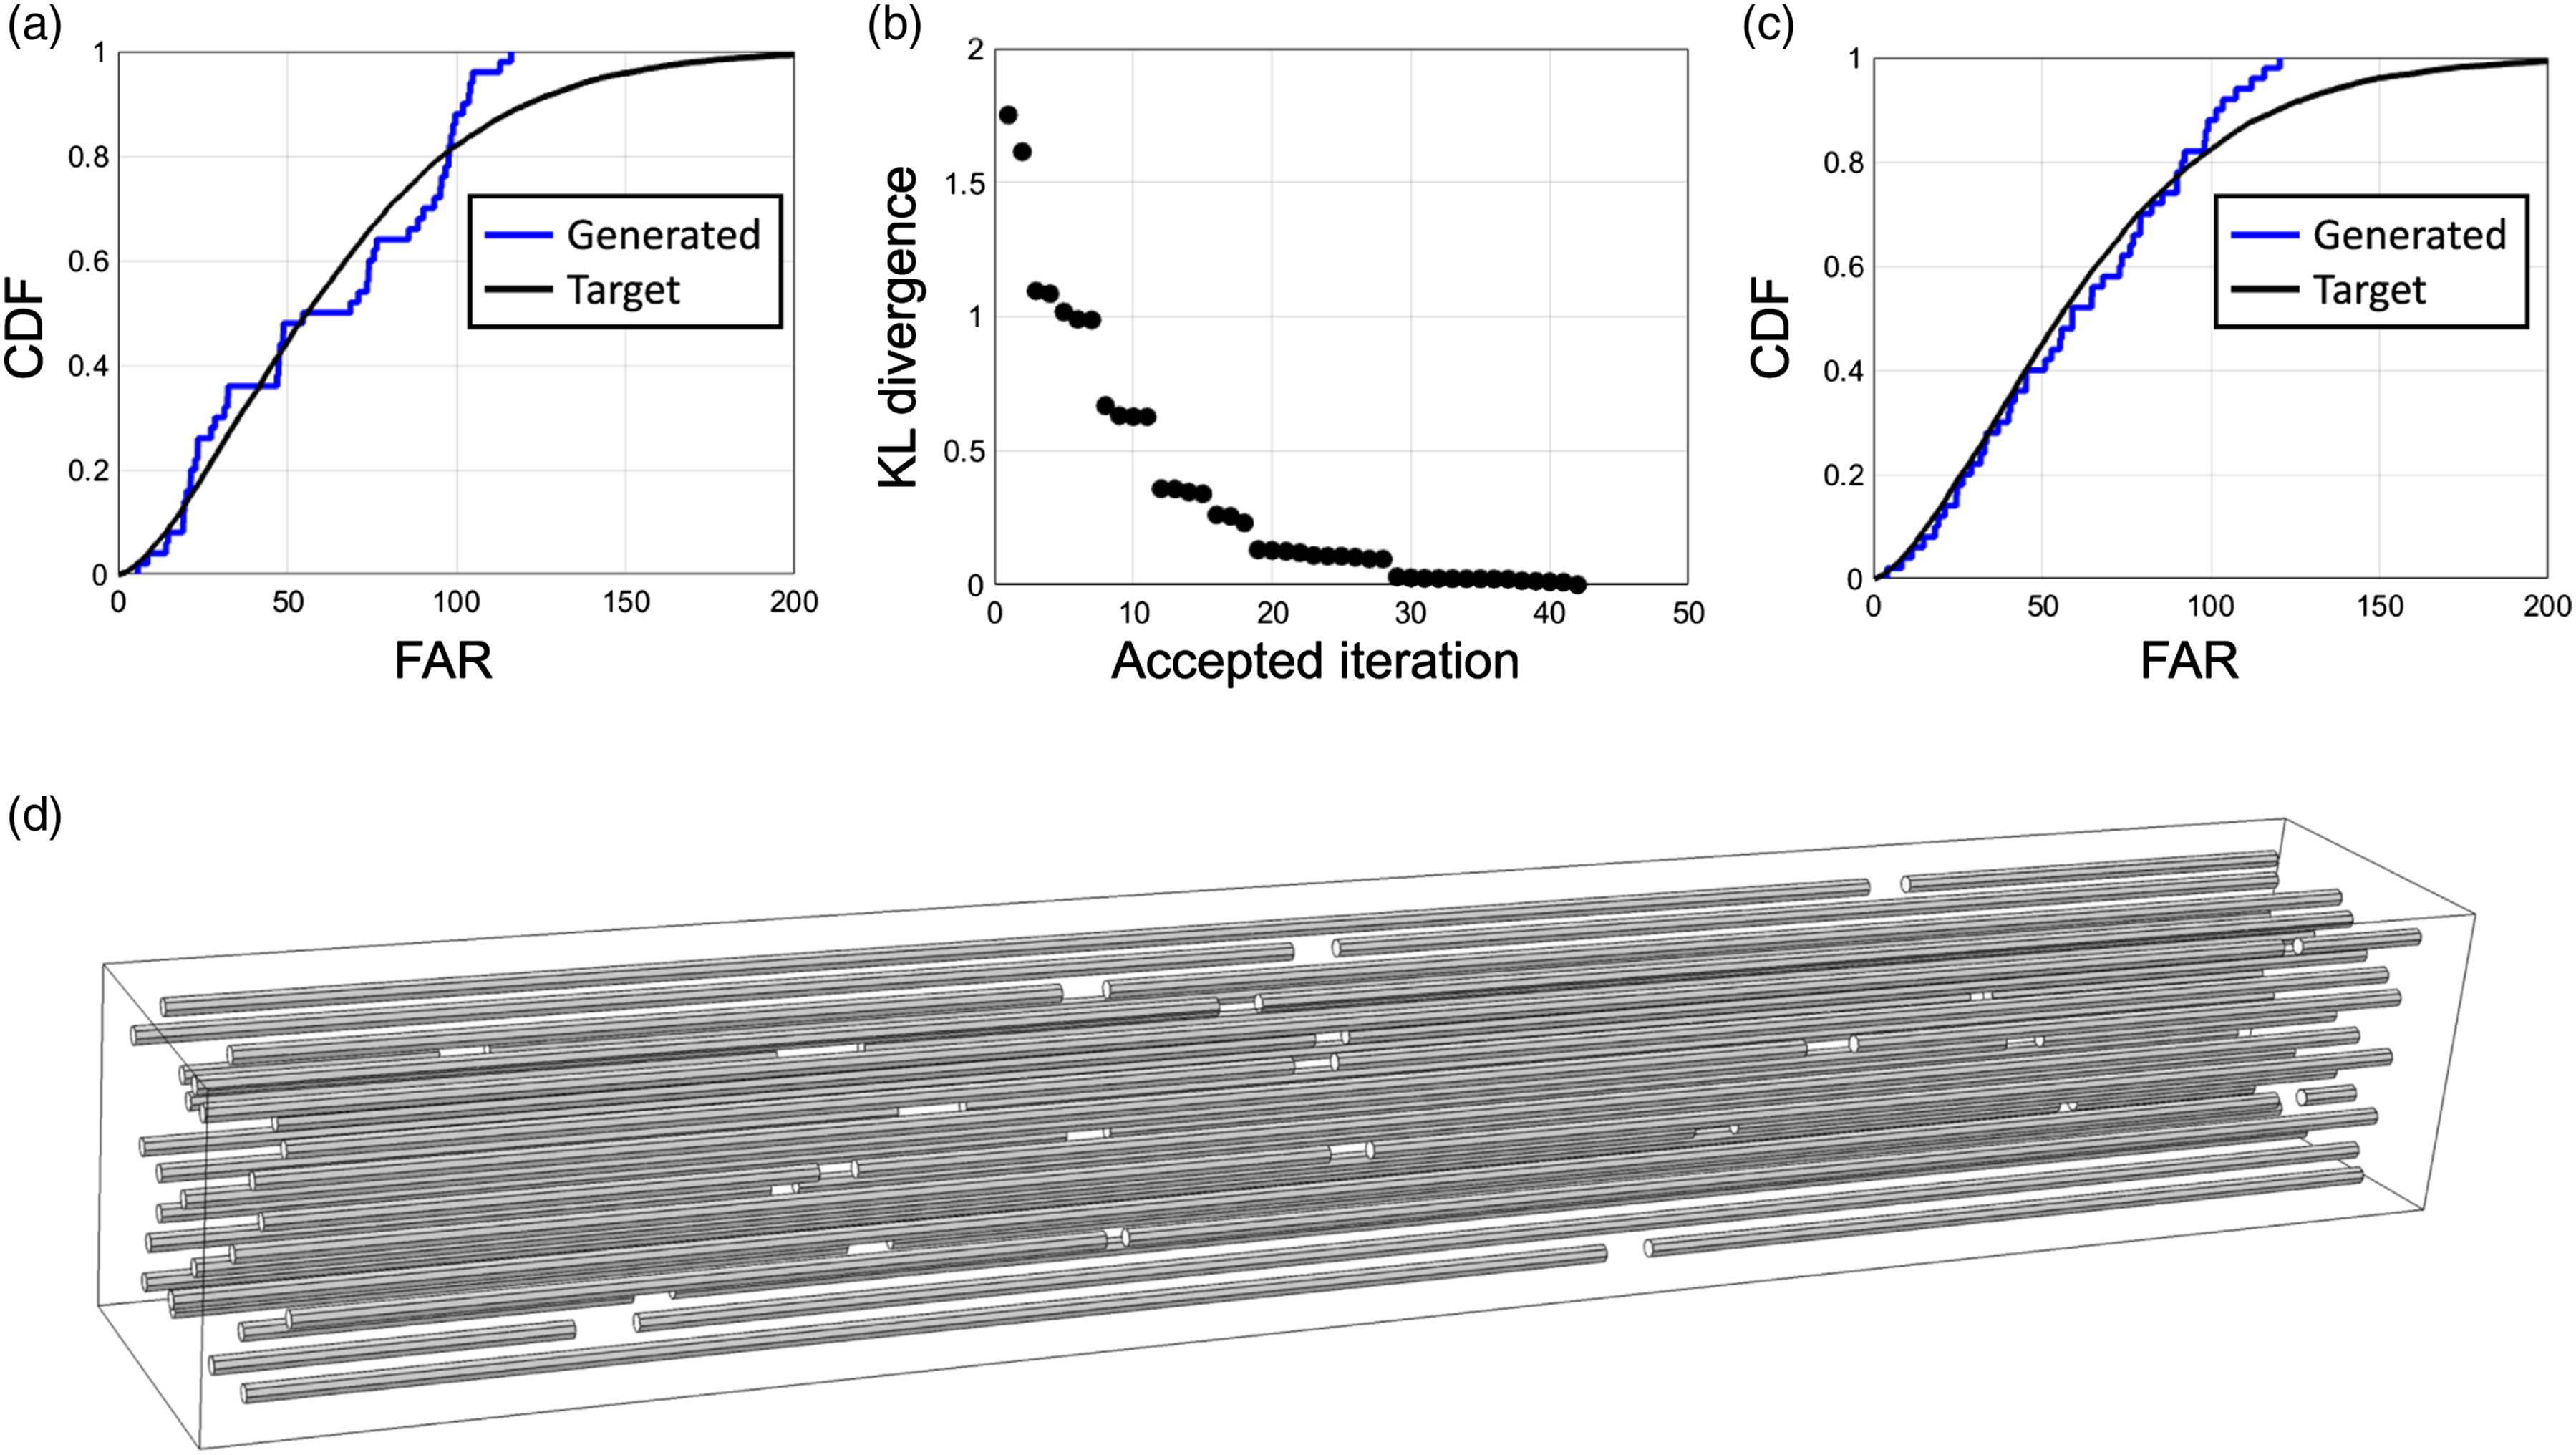
Validation of mechanical response and failure mode
The validation of the mechanical response was based on four parameters; the trend of stress-strain response, failure pattern, homogenized elastic modulus along the fibers’ axis (E RVE ), and tensile strength (σ RVE ).
The stress-strain response of the simulated RVEs displays an almost linear behavior, followed by a brittle failure, consistent with the experimental results. An example of this behavior is illustrated in Figure 8(a) for a 5 × 5 RVE with a σ
RVE
value closest to the average strength of all the simulated 5 × 5 RVEs. This figure also presents the initiation of various stages of damage evolution. The first stage of damage was characterized by the Mode I debonding of fiber/matrix interfaces at the fiber tips, occurring at an applied strain around 0.0025. It should be reminded that the interface debonding at the fiber tips was recognized as Mode I type because the evolved failure path, i.e. along the fiber’s tip, is perpendicular to the direction of applied tensile loading, i.e. along the fiber’s axis. No marked change in the linearity of the stress-strain response was observed since each locally debonded interface at a fiber tip had a significantly smaller area than the RVE cross-sectional area. The damage in the matrix initiated at an applied strain of approximately 0.0078 in the vicinity of the fiber tips, as shown in Figure 8(b). The locally damaged areas in the matrix around the fiber tips propagated towards each other and slightly along the fibers, as illustrated in Figure 8(c). The propagation rate of matrix damage was slow with respect to the applied strain, until an applied strain of approximately 0.011. After that stage, the propagation rate increased, followed by the initiation of the Mode II interface failure along the fibers. Soon after, the failure of the composite initiated at an applied strain around 0.013, corresponding to a σ
RVE
value equal to 136 MPa. Typical simulation results, illustrated for a sample 5 × 5 RVE as an example: (a) stress-strain response with various stages of damage initiation marked on it and associated typical longitudinal cross-section of the RVE depicting (b) matrix damage initiation at the fiber tips, and (c) damage propagation through the matrix. (The damage images are zoomed-in, and therefore fewer fibers are visible).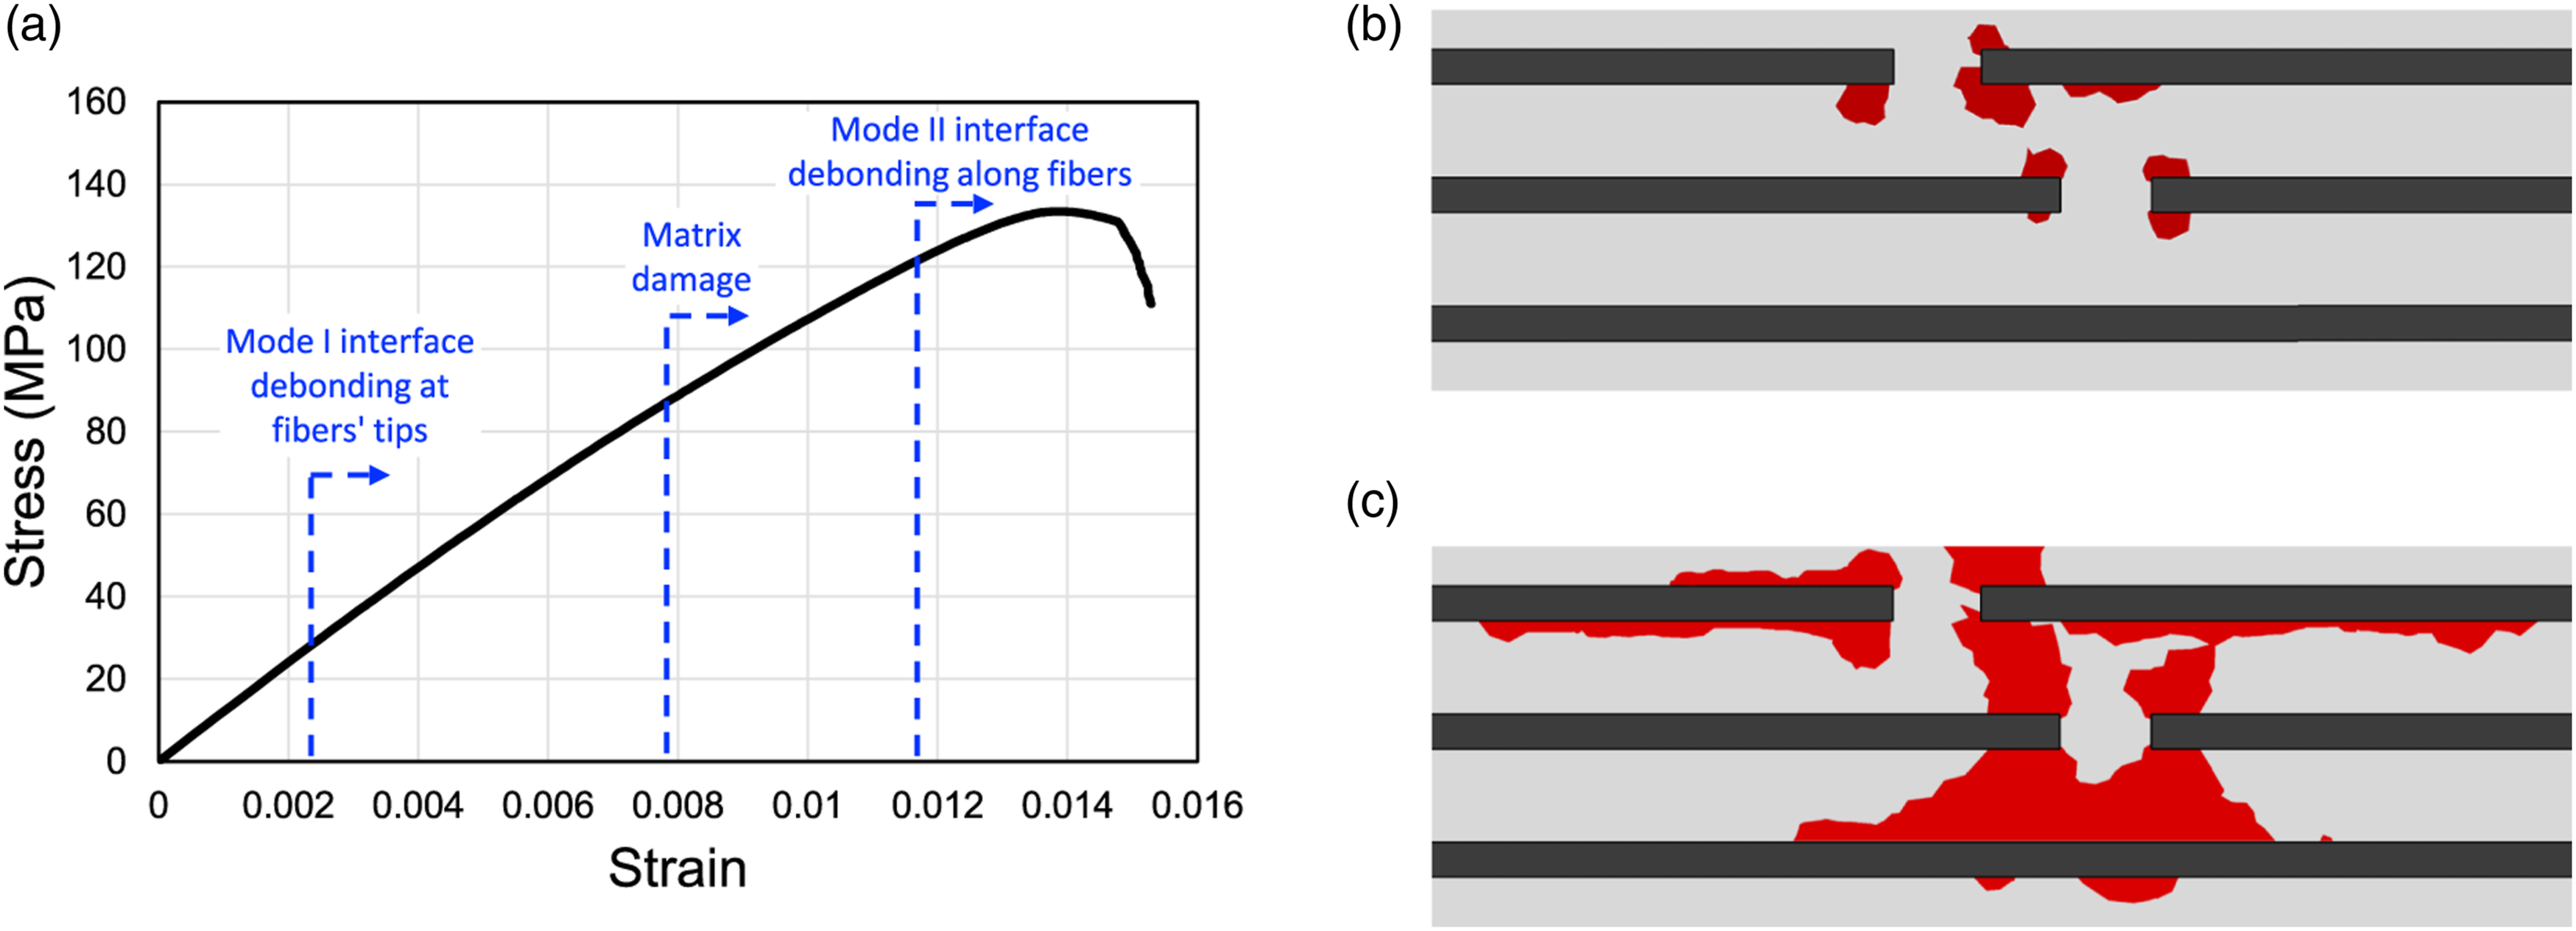
Figure 9(a) depicts the post-failure damage for the same 5 × 5 RVE immediately after the initiation of failure when the load-carrying capacity was decreased by 5%. At this loading stage, the zone and pattern of failure were more noticeable. The failure mode denoted a fracture surface transverse to the RVE length, from which the fibers protrude out. This failure mode was consistent with the experimental microscopic images of the fracture surface
9
as well as the failure mode of the longer 7 × 7 RVEs, an example of which is depicted in Figure 9(b). This example was plotted at a loading stage after the start of failure and before the simulation was terminated due to convergence difficulty. In general, the simulations of the longer 7 × 7 RVEs encountered convergence issues shortly after the initiation of failure, and hence, complete damage propagation and fracture zone could not be simulated. Typical simulation results comparing the failure pattern of (a) a 5 × 5 RVE capturing 80% of the target FARs’ distribution with that of (b) a 7 × 7 RVE that captures the entire target distribution for FARs. The failure pattern of the 5 × 5 RVE is plotted at the post-failure loading stage when the resistance was decreased by 5%, while that of the 7 × 7 RVE is plotted at the end of simulation when the resistance was decreased by 1%, before the simulation was terminated due to convergence difficulty.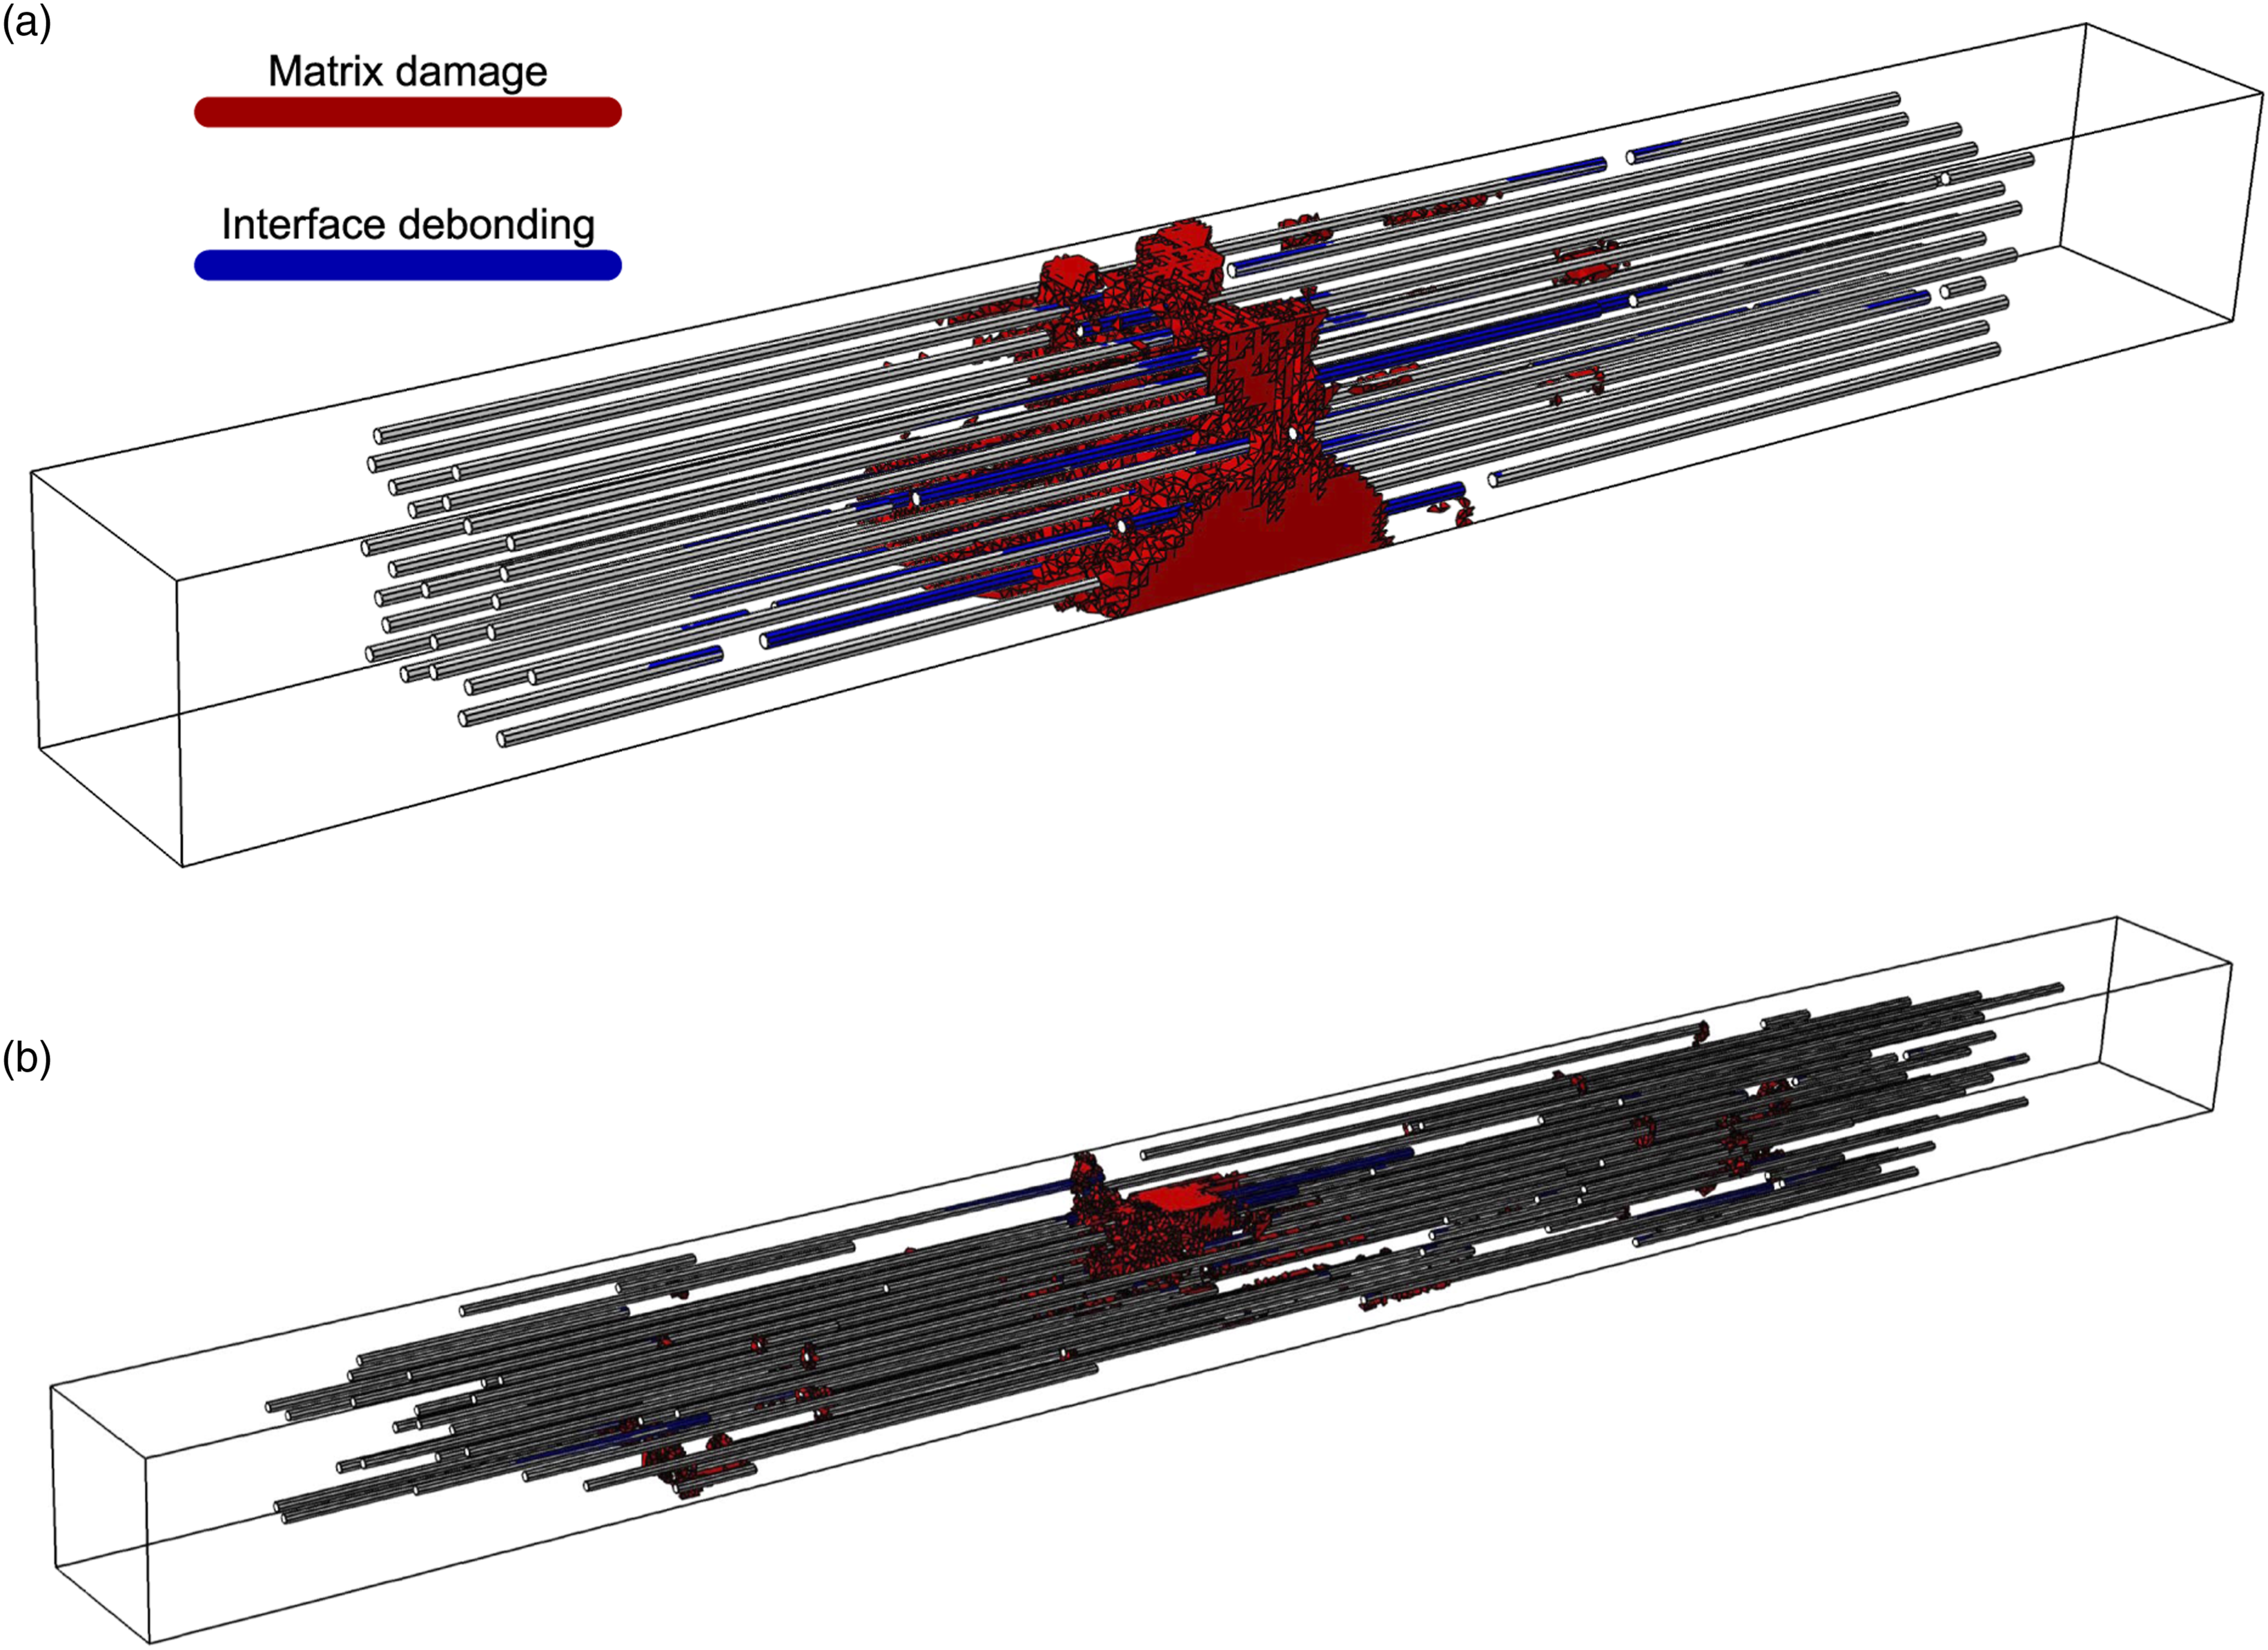
In general, the failure patterns and trend of stress-strain responses of all the simulated RVEs with different sizes were similar and consistent. However, E
RVE
and σ
RVE
varied depending on both the RVE size and the microstructure. The summary of statistical analyses conducted on E
RVE
and σ
RVE
for all the simulated RVEs is illustrated in Figure 10. It must be noted that for the case of 5 × 5 and 7 × 7 RVEs, the confidence interval was not calculated and the results were not presented in the form of a box plot since only five data points were available, insufficient for conducting such computations. The summary of the simulations’ results for various RVE sizes and their comparison with the experimental results based on the measured (a) homogenized modulus of elasticity (E
RVE
) and (b) tensile strength (σ
RVE
).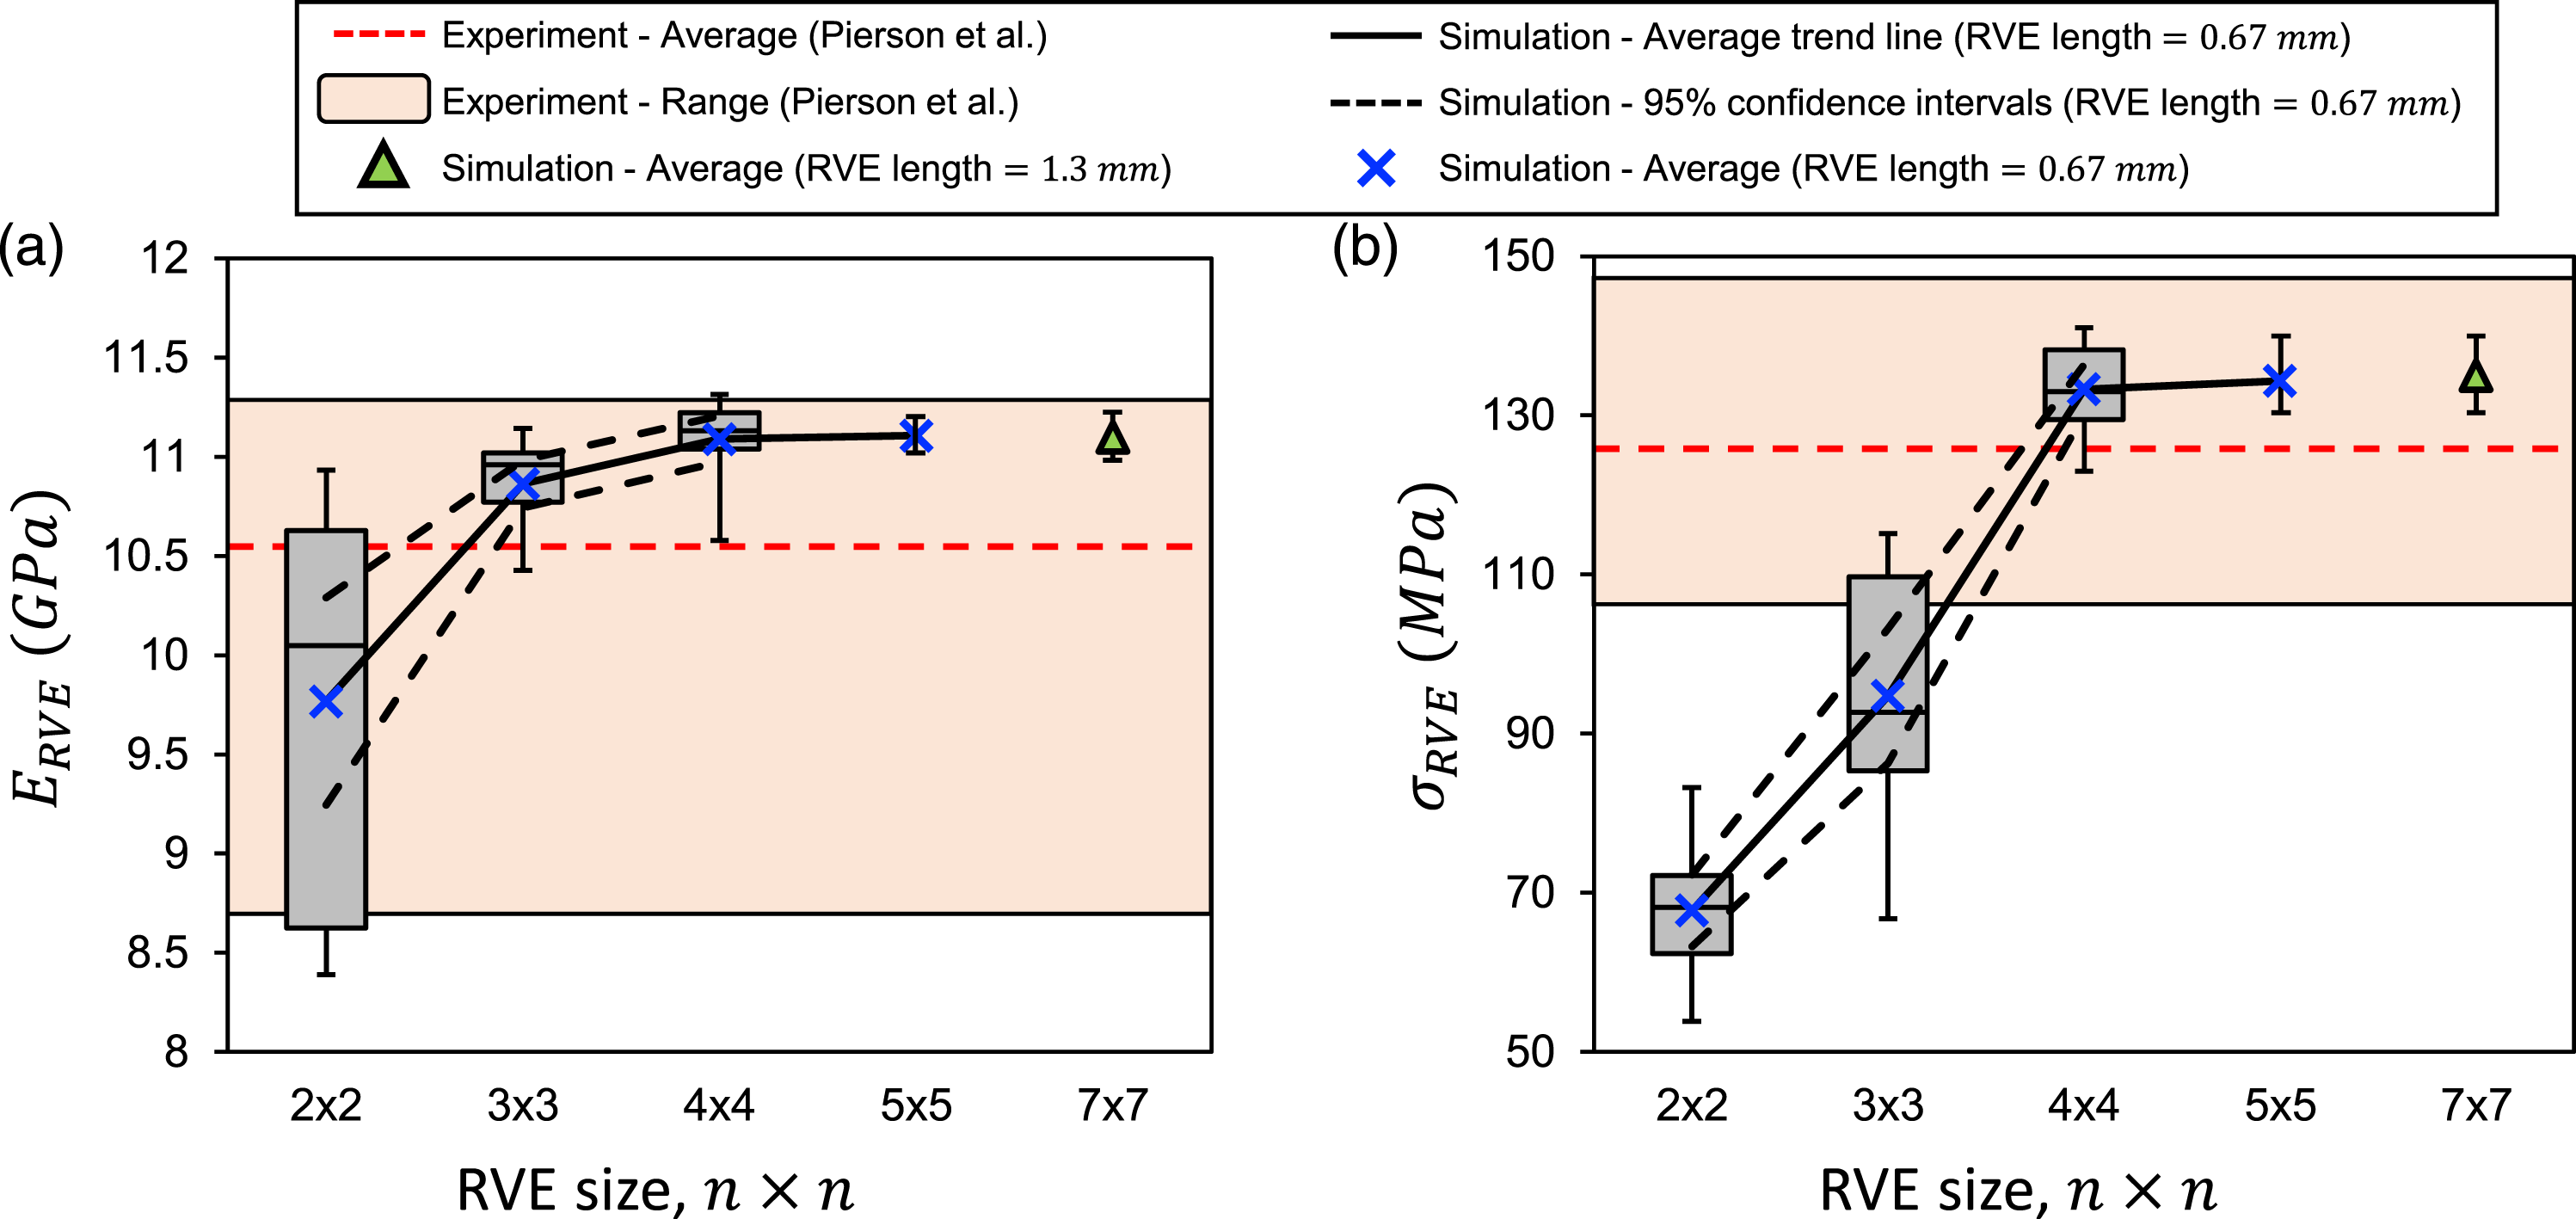
The impact of RVE size on E RVE is shown in Figure 10(a). As seen in the figure, 2 × 2 RVEs underestimated the homogenized elastic constant, and the results were highly scattered with a wide 95% confidence interval. As the RVE size increased, the dispersion of the measured values for E RVE decreased, and the mean values became larger, converging at 11.1 GPa. The converged value for E RVE was within the range of experimental results, although it was slightly greater than the experimental average. The reason could be associated with the fact that the fibers of the actual composite were not perfectly aligned and the presence of void defects in the 3-D printed composites. It is worth acknowledging that the level of porosity achieved via direct write thermosetting composite printing is much lower than that typically created by other extrusion-based AM processes. 9 Moreover, as seen in Figure 10(a), the converged value of E RVE for the shorter RVEs (i.e. L RVE = 0.67 mm) is consistent with those measured for the longer 7 × 7 RVEs (i.e. L RVE = 1.3 mm).
The analysis of σ RVE based on the RVE size is illustrated in Figure 10(b). As seen in the figure, the average value of σ RVE for the case of 2 × 2 RVEs was small, only slightly greater than σ m due to the inefficient fiber/matrix engagement. The average value of σ RVE for the case of 2 × 2 RVEs is, in fact, similar to the strength of the utilized epoxy. For the case of 3 × 3 RVEs, the fiber/matrix engagement improved, resulting in a larger average value for σ RVE . However, since the RVE was not large enough, the RVE strength greatly depended on the randomness of the microstructure, resulting in large variability in the measured values of σ RVE . For the case of 4 × 4 RVEs, the results were less scattered and the average value of σ RVE (i.e. equal to 134 MPa) was significantly greater than that for the case of 3 × 3 RVEs. Hence, the confidence interval was also small, indicating a consistent and effective fiber/matrix engagement for all the randomly generated 4 × 4 RVEs.
In general, the average values of σ RVE for the case of short RVEs (i.e. L RVE = 0.67 mm) increased with the increase of RVE size, ultimately converging at 136 MPa, which was consistent with that measured for the longer 7 × 7 RVEs (i.e. L RVE = 1.3 mm). The converged value of σ RVE was also within the range of experimentally measured values, i.e. between 106.5 MPa and 147.5 MPa. However, this converged value was slightly larger than the average of the experimental results since the impacts of void defects and imperfections in fibers’ alignment were not taken into account in the simulations herein.
In summary, the shorter RVEs with a sufficiently large cross-sectional area could provide enough accuracy for simulating the composite’s response while being significantly more computationally efficient compared to the longer RVEs. Hence, the results suggest that shorter RVEs can well represent the microstructure given that (1) the RVE can capture target
Parametric studies
In this section, the effects of several critical material properties on the overall mechanical performance of the composite structure are investigated. More specifically, the impacts of the characteristics of fiber/matrix cohesive interfaces (i.e. σ c and G c ) and the matrix strength (i.e. σ m ) on the composite strength (i.e. σ RVE ) and failure pattern are presented. The analyses are performed by changing each parameter of interest individually and within a specified range while keeping other parameters constant, equal to the calibrated values presented in the Constitutive equations section. To conduct the parametric studies, the 4 × 4 RVE with a σ RVE value closest to the average strength of all the 4 × 4 RVEs was selected as the most representative candidate to run the parametric studies.
Effect of fiber/matrix cohesive interface parameters
One of the most important parameters in the mechanical performance of any composite is the quality of the bonding between the matrix and inclusions. Hence, this subsection studies the impacts of the strength and fracture toughness of the fiber/matrix cohesive interfaces on the mechanical responses. The range of the selected values for each parameter is consistent with the experimental measurements, reported in the literature.28,35–38 We should recall that the term “cohesive” interface was used in this paper because a cohesive zone model was utilized to simulate the fiber/matrix interface. The term “adhesive” also could be interchangeably used, referring to the bonding of 2 different phases, i.e. the fiber and the matrix phases.
To investigate the significance of cohesive strength of interfaces, six specimens with σ
c
values ranging from 25 MPa to 150 MPa were simulated. The fracture toughness, G
c
, for all the specimens was kept constant, equal to 150 N/m. The summary of the simulations is illustrated in Figure 11. As a general trend, σ
RVE
increased from 103 MPa to 151 MPa with the increase of σ
c
from 25 MPa to 150 MPa, as shown in Figure 11(a). This increase was more significant when σ
c
increased from 25 MPa to 50 MPa, compared to when it was increased from 50 MPa to 150 MPa. The reason can be explained by investigating how σ
c
affected the failure pattern, shown in Figure 11(b) for the cases of weak and strong interfaces. For the interface strengths smaller than 50 MPa, the failure initiation was characterized mainly by the debonding of fiber/matrix interfaces. For the interface strengths greater than 50 MPa, however, the contribution of the fiber/matrix interface debondings to the failure mode decreased as the interface strengths became greater than the matrix strength (i.e. equal to 65 MPa). For interface strengths greater than 100 MPa, the density of interface debondings was negligible, and the failure was mainly characterized by matrix failure. Simulation results showing the effects of fiber/matrix interface strength on (a) the composite tensile strength and (b) failure pattern of the RVE at the post-failure loading stage when the resistance is decreased by 5%.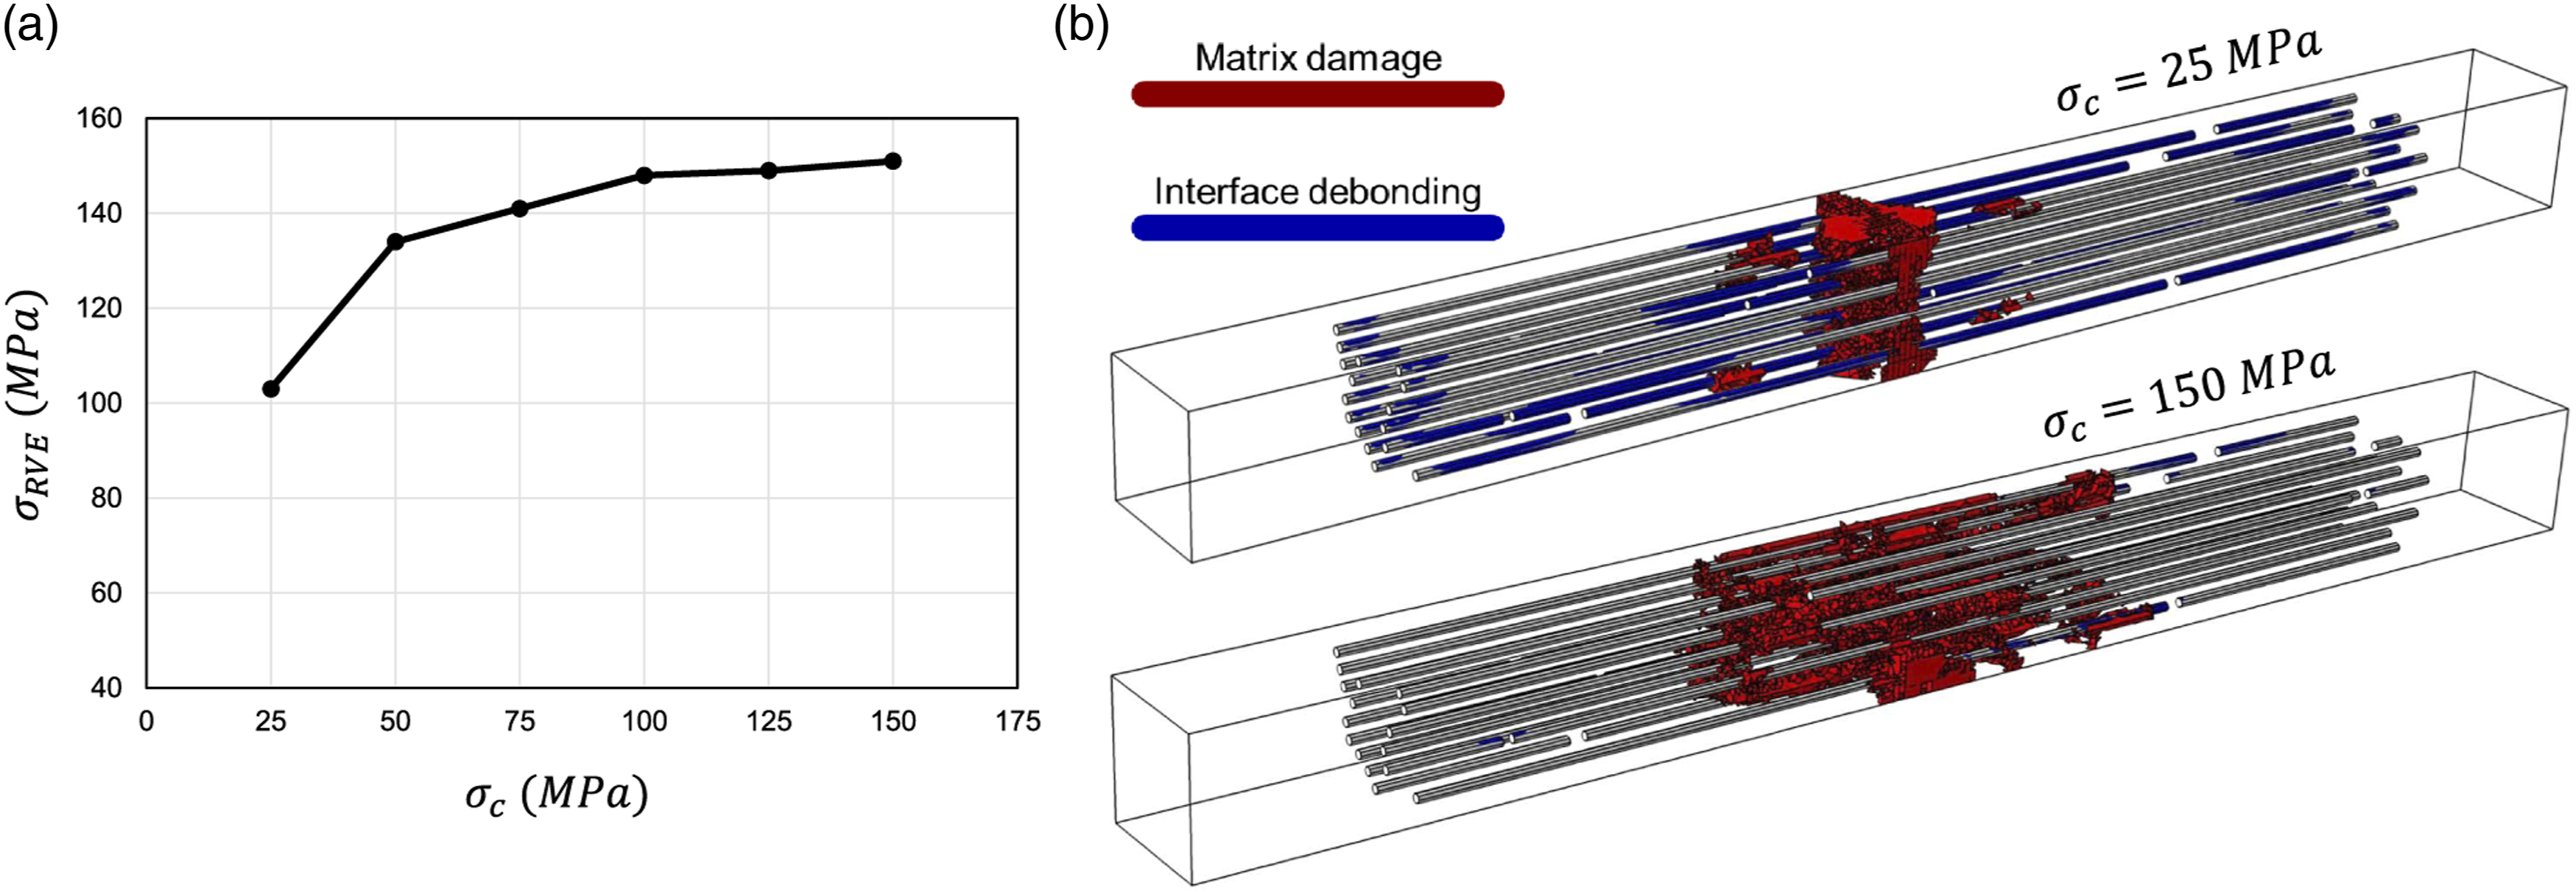
To study the impact of interface fracture toughness, seven specimens with G
c
values in a range between 50 N/m and 200 N/m were simulated. The interface strength, σ
c
, was kept constant and equal to 50 MPa among all the specimens. Figure 12 depicts the summary of the simulations. The increase in G
c
from 50 N/m to 200 N/m, increased the RVE strength, σ
RVE
, from 110 N/m to 135 N/m, as shown in Figure 11(a). Hence, the effect of interface fracture toughness was not as significant as that of the interface strength. The reason was that the composite failure occurred shortly after the initiation of Mode II interface debondings, a mechanism governed by the interface strength. Therefore, the fracture toughness of the interfaces becomes effective after the initiation of debondings and only controls the debonding propagation rate. The decrease in the propagation rate with the increase of fracture toughness slightly changed the failure pattern by increasing the contribution of matrix failure. This fact is illustrated in Figure 12(b), comparing the specimens with low and high interface fracture toughnesses. The slightly more severe matrix failure and lower density of interface debondings for the specimen with G
c
= 200 N/m than those for the specimen with G
c
= 50 N/m can be noted. This change in the failure mode explains the mild increase in σ
RVE
with the increase of G
c
. Simulation results showing the effects of fiber/matrix interface fracture toughness on (a) the composite tensile strength and (b) failure pattern of the RVE at the post-failure loading stage when the resistance is decreased by 5%.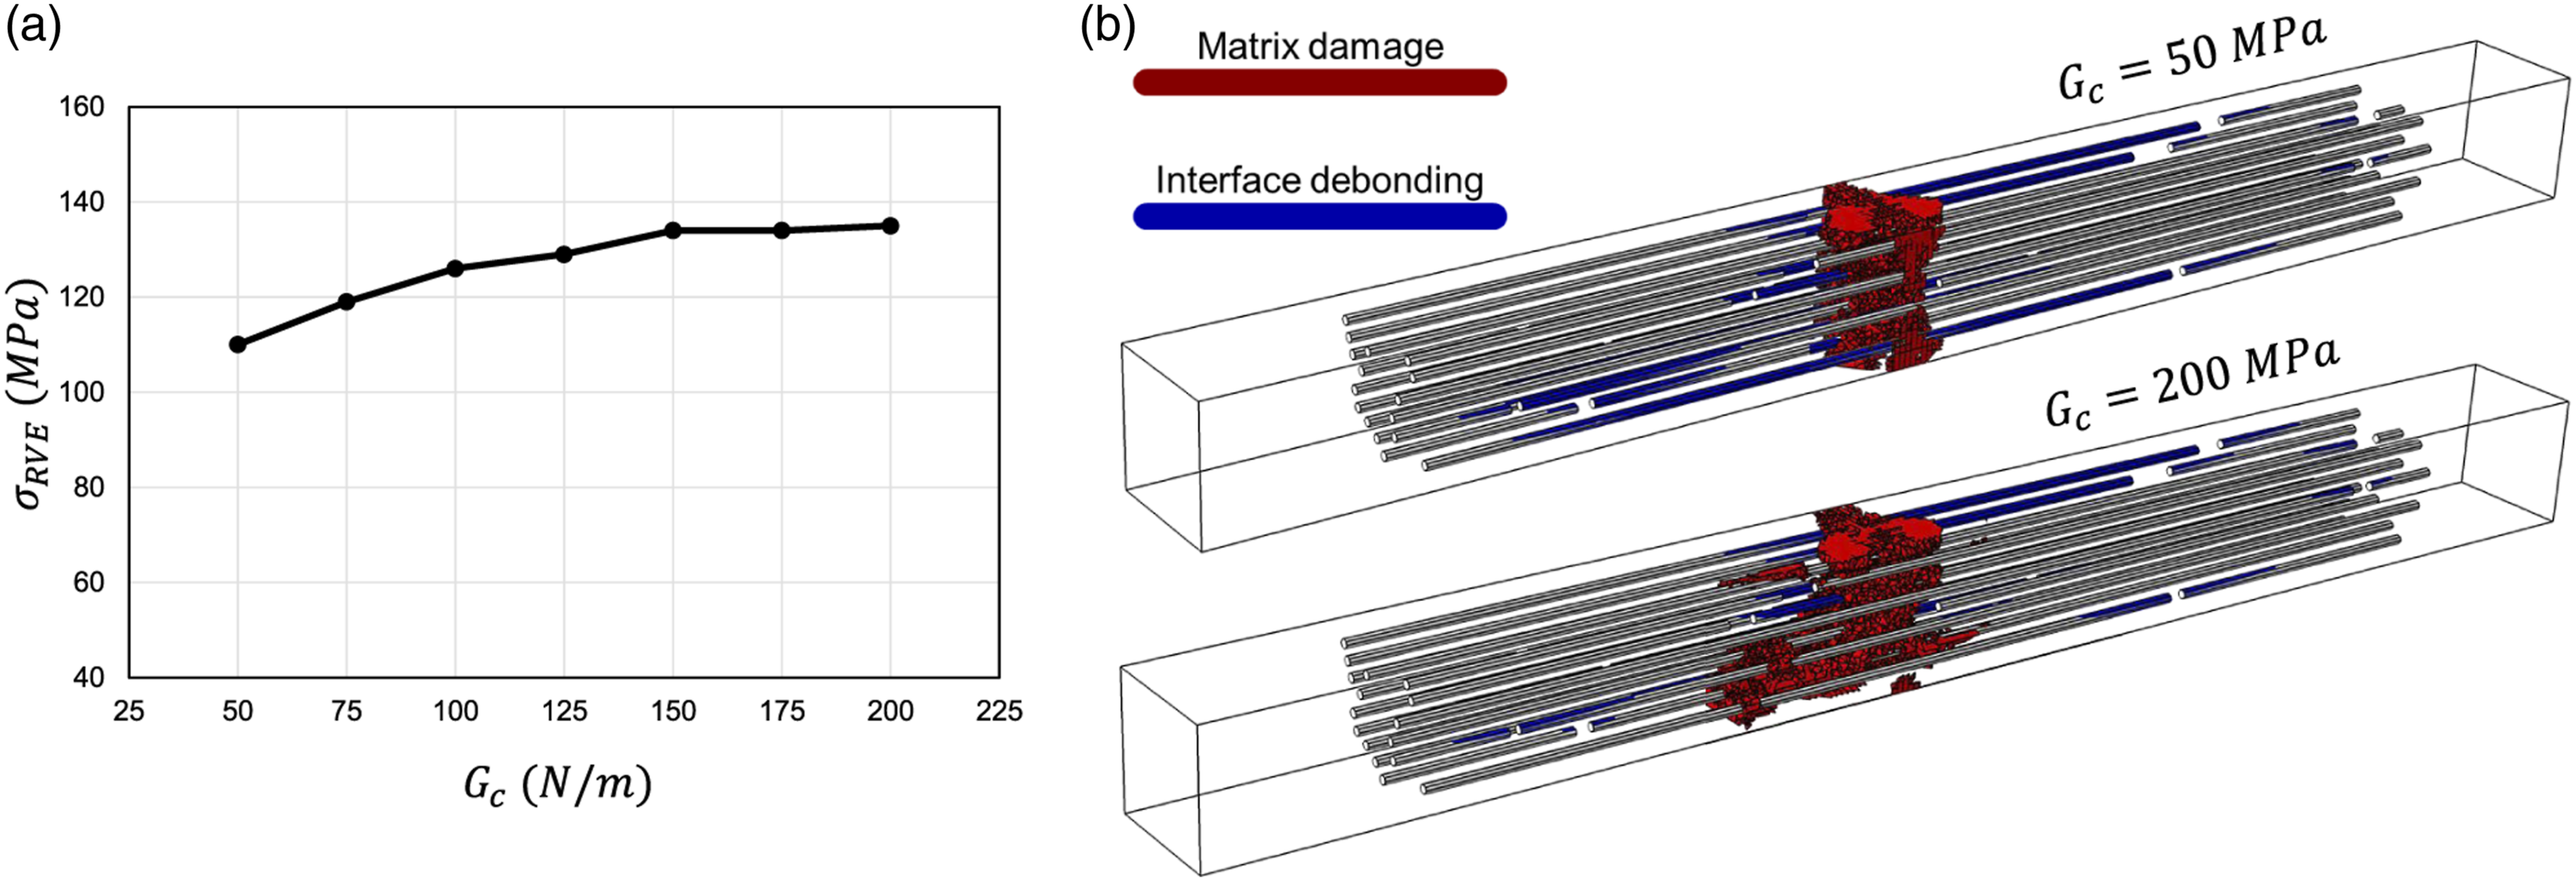
Effect of matrix strength
Since the matrix volume fraction of the composite of interest in this paper is high (i.e. equal to 94.5%), the mechanical response of the composite is expected to significantly rely on the matrix constitutive behavior, especially matrix strength. To investigate the impact of matrix strength on the composite’s mechanical response, five specimens with σ m values ranging from 35 MPa (representing weak epoxies) to 95 MPa (representing strong epoxies) were simulated. All other parameters of the matrix constitutive equations were kept constant.
The summary of the simulation results is shown in Figure 13. The results indicated that the composite strength greatly depended on the matrix strength. σ
RVE
increased from 75 MPa to 150 MPa with the increase of σ
m
from 35 MPa to 95 MPa, as illustrated in Figure 13(a). As seen in the figure, the rate of increase in σ
RVE
with respect to σ
m
gradually decreased as σ
m
increased. The reason was that as σ
m
increased, the density of the fiber/matrix interface debondings increased, reducing the contribution of matrix strength to the failure. This change in the failure mode is illustrated in Figure 13(b), comparing the failure patterns of RVEs with weak and strong matrices. The more severe matrix failure and lower density of interface debondings for the case of σ
m
= 35 MPa compared to those for σ
m
= 95 MPa can be noted. Simulation results showing the effects of matrix strength on (a) the composite tensile strength and (b) failure pattern of the RVE at the post-failure loading stage when the resistance is decreased by 5%.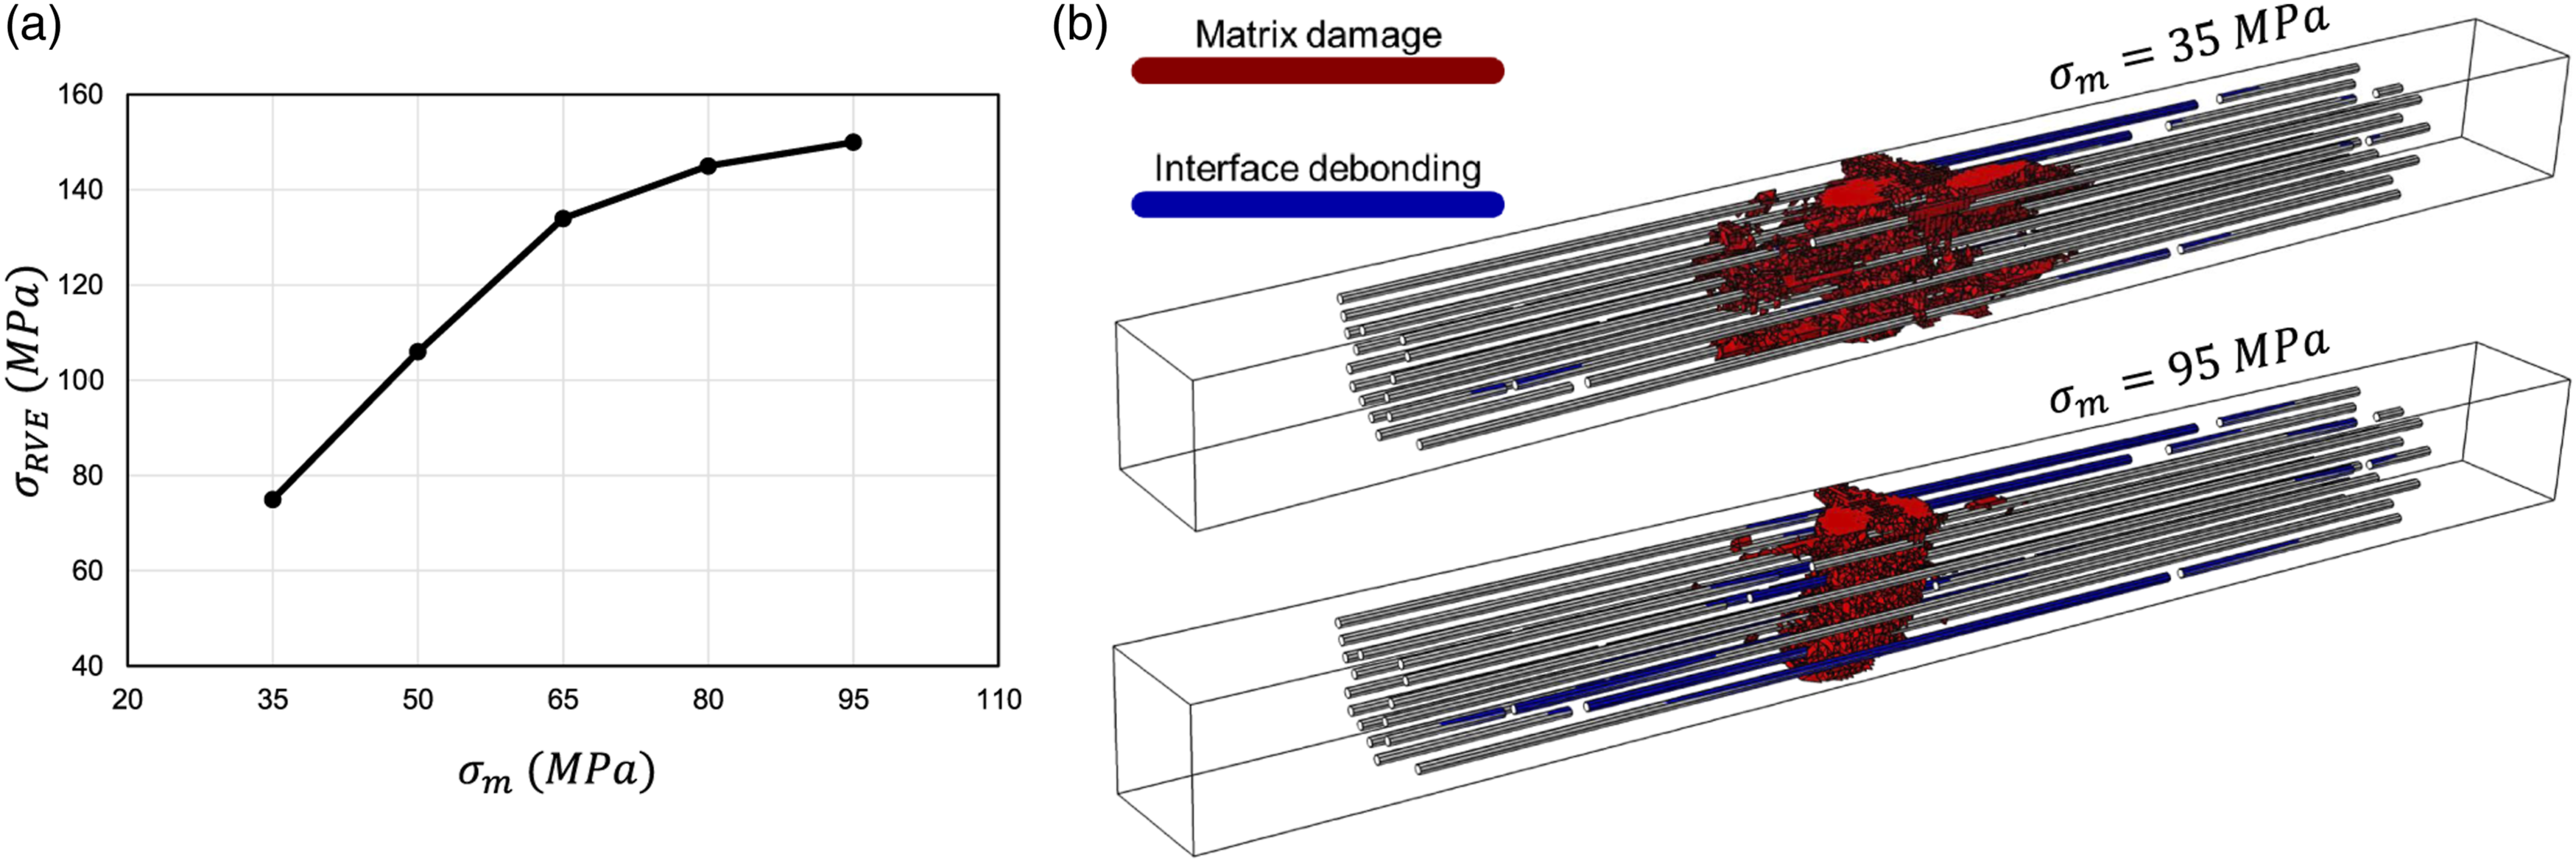
Conclusion and future works
This paper proposed a high-fidelity and efficient micromechanical framework for simulating the initiation and propagation of damage and final failure in the representations of aligned DCFRCs’ microstructure. The framework was suitable for investigating the mechanical response of 3-D printed aligned DCFRCs subjected to mechanical loading along the fibers’ axis. These composites had intermediate FARs, and their simulations using the proposed micromechanical framework could be run on an ordinary multi-core CPU (e.g. a machine with an Intel Core i7 processor and 16 GB memory). The numerical framework involved simulating a full 3-D RVE of the composite’s microstructure. An algorithm for random generation of the discontinuous fibers within the RVE, taking into account the distribution of FARs, was presented. The algorithm was used to randomly generate several RVEs with different sizes. The generated RVEs were then simulated, and their results were compared with the experimental results. It was verified that the proposed micromechanical framework could accurately simulate the mechanical responses of 3-D printed aligned DCFRCs in terms of stress-strain response and failure pattern.
It was shown that the 4 × 4 RVE size with a length of 0.67 mm that captures 80% of the experimentally measured distribution for FARs was large enough to accurately and reliably simulate the mechanical behavior of the composite of interest. The composite of interest was then further investigated by selecting a 4 × 4 RVE and studying its sensitivity to a few parameters. The considered parameters were the characteristics of fiber/matrix cohesive interfaces as well as the matrix strength. It was shown that the failure pattern was greatly affected by the studied parameters. The most significant parameter in both composite strength and homogenized elastic modulus was the matrix strength since the matrix comprises %94.5 of the composite volume. A correlation was also shown between the matrix strength and the characteristics of fiber/matrix interfaces in terms of their influence on the failure mode; a relatively strong interface caused the failure to be characterized by matrix failure, while with a relatively strong matrix, the failure was characterized by the interface debondings. Therefore, to effectively improve the performance of the composite, the mechanical properties of both fiber/matrix interfaces and matrix must be improved proportionally.
In future investigations, the impacts of other geometrical parameters, such as fiber volume fraction and distribution of FARs, will be investigated. It also will be worthwhile to model void defects in the micromechanical model and study their impact on the strength and failure pattern of the 3-D printed aligned DCFRCs although the void percentage in the direct additive manufacturing method is much lower than in other conventional methods. We recently investigated the effects of thermal curing processes on the mechanical responses of additively manufactured aligned DCFRCs.42,43 More detailed information on the possible temperature-dependent behavior of each composite’s constituent will be explored and implemented into our modeling framework, which will culminate in accurately simulating the mechanical responses of such composites under simultaneous mechanical and thermal loadings.
Footnotes
Acknowledgements
The authors gratefully acknowledge the support from the Air-Force Office of Scientific Research (AFOSR) Young Investigator Program (YIP) award #FA9550-20-1-0281. The authors also acknowledge Advanced Research Computing at Virginia Tech for providing computational resources and technical support that have contributed to the results reported within this paper. URL: ![]()
Declaration of conflicting interests
The author(s) declared no potential conflicts of interest with respect to the research, authorship, and/or publication of this article.
Funding
The author(s) disclosed receipt of the following financial support for the research, authorship, and/or publication of this article: The authors gratefully acknowledge the support from the Air-Force Office of Scientific Research (AFOSR) Young Investigator Program (YIP) award #FA9550-20-1-0281.
Data availability statement
The datasets generated and/or analyzed during the current study are available upon reasonable request.