
Abstract
This study aims to investigate the impact of engineering and mechanical factors on the bending behavior of composite sandwich beams supported by engineering and mechanical factors. Utilizing numerical modeling approaches that were developed with the ABAQUS 2017 software and grounded on basic beam theory, sandwich beams were constructed. The numerical data for the mechanical behaviors were calculated. We studied the bending behavior of two models (I and half-arch) of EN AW-1050A aluminum alloys and resin/glass beams (T300-M800) subjected to an imposed displacement due to bending. We created a reference model based on a simulation of a honeycomb sandwich beam for comparison purposes. The proposed models can be utilized to investigate the flexion of a sandwich beam, supported at one end and exposed to substantial mechanical loads. models, these models possess specific applications in the automotive, civil engineering, and aerospace industries. In terms of energy absorption, the models performed well. In contrast to the other two models, the conventional honeycomb model performed effectively. It displayed a 70% response to pressures, a 58% response to deformation, a 49% superiority to shear stress, and a 46% superiority to displacements.
Introduction
Composite sandwich structures are preferred for creating lightweight elements that offer high mechanical performance, particularly in specialized fields such as aeronautics, the automotive industry, the naval sector, and biomedical engineering.1,2 They are composed of two rigid outer skins joined to a lightweight inner core, an arrangement that offers notable specific rigidity as well as excellent resistance to bending and compression.3,4 These structures, generally composed of thin and resilient surface sheets combined with a low-density core, have several advantages over conventional materials, including weight reduction, improved mechanical and thermal stability, excellent impact resistance, and enhanced durability against corrosion.5,6 These composites, thanks to their distinctive set of characteristics, are widely integrated into critical engineering sectors. 7 Moreover, the geometry and nature of the nucleus, whether hexagonal, undulated, lattice, or biomimetic, have a significant impact on performance under different loading conditions.8–10
The three-point bending test is a standardized method used to evaluate the fracture toughness, stiffness, and flexural behavior of sandwich structures.11–15 However, physical tests often have limitations: they are expensive, time-consuming, and do not allow for the practical exploration of a wide range of geometric variations. To overcome these limitations, numerical modeling techniques are valuable tools for predicting the mechanical behavior of sandwiches, allowing for efficient design and optimization of their structural and functional properties.16–21 Software such as Abaqus enables the accurate modeling of the effect of various core shapes on stress fields, strains, and critical failure zones.17,22,23 Today, this numerical method is considered a vital tool for optimizing structural design while minimizing the need for destructive testing. 24
Despite numerous studies investigating a wide range of composite sandwich structures, only a small number of researchers have conducted systematic comparisons of the mechanical performance of honeycomb, semi-arched, and I-core models under various loading conditions. In addition, the influence of various variations in displacement amplitude and real operational conditions (temperature, humidity, and multi-axial loads) on stiffness, flexural strength, and energy absorption is yet poorly understood. By evaluating the sensitivity of each type of structure’s performance and determining the ideal model for specific practical applications, this study aims to fill this gap in the existing literature.
In this work, we attempt to investigate the effect of geometric and mechanical properties on the bending behavior of reinforced sandwich beams. We utilized ABAQUS 2017 software for our numerical modeling. We used imposed displacements to stress the boundary conditions of the sandwich beam during bending. Numerical results for stresses and displacements were calculated. We modeled the bending behavior of two models of aluminum (1050A)/resin/glass (T300-M800) sandwich beams loaded with imposed displacements. The comparison was made with a honeycomb (NIDA) sandwich beam, which served as a reference model that we developed through simulation. In order to build the model meshes, we used the C3D8R (Global Seeds) finite element to embed the supports and then inserted sensor points into the mesh. Software that is compatible with digital modeling models was used to process the resulting curves and histograms.
Design and production
As the sandwiches are manufactured, their mechanical properties are modified by adjusting the thickness of each phase, the core, and the type of skins (whether they are identical or not). Generally speaking, the skins are of the same thickness (tf), and the ratio of tf to hc (where hc is the thickness of the core) ranges from 0.01 to 0.1. Sandwiches are divided into three groups based on the d/tf ratio, where d is the separation between the neutral axes of the sandwich skins. A sandwich is considered to have thick skin if its d/tf ratio is less than 5.77. A d/tf ratio of 5.77 to 100 indicates that the sandwich has thin skin. A d/tf ratio greater than 100 indicates that the sandwich has fragile skins. These limits are determined relative to the contribution of each member to the bending and shear rigidity of the sandwich. 25
Bending rigidity
Sandwich constructions typically experience compression buckling or bending loads. Therefore, it is essential to understand how the core and skin materials behave under this kind of stress in order to maximize their qualities for a particular application. According to the following connection, a sandwich material’s bending rigidity, or D, is its characteristic quantity.27,28
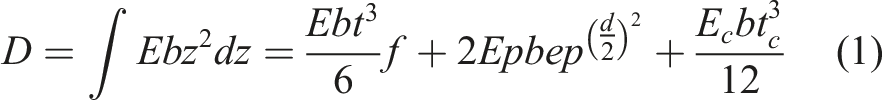
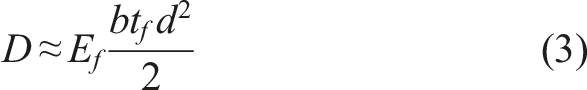
After simplifying the equation, we find:

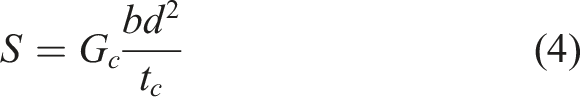
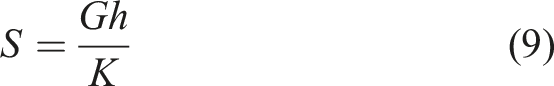
Bending rigidity is limited to shear, and stiffness S is mostly determined by core properties, with skins playing a minor role. The following formula states this stiffness:
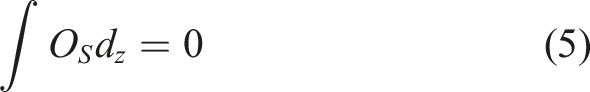
Stress and deformation of sandwich materials. Figure 1 depicts the general stress distribution in a sandwich beam. To simplify the analysis, the beam is just subjected to a bending moment Mx and a transverse force.
26
Load applied to a sandwich beam.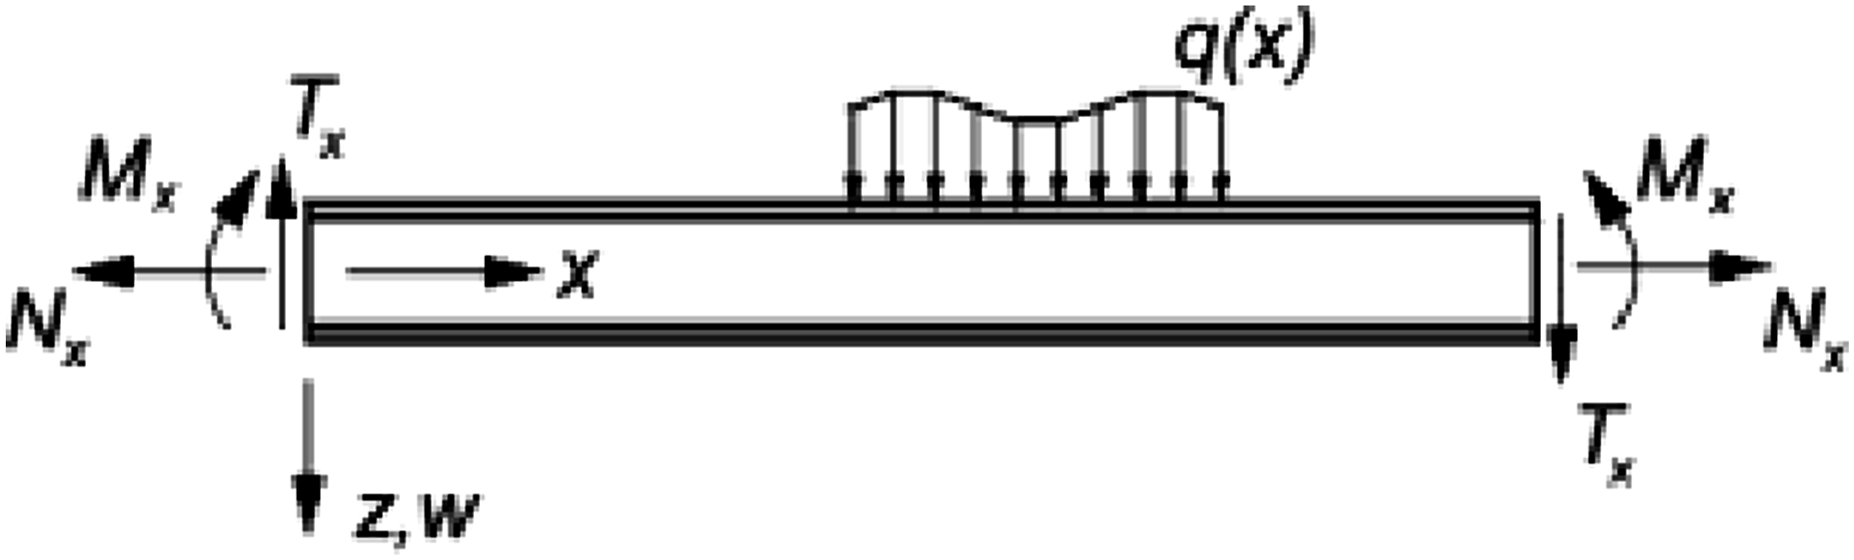
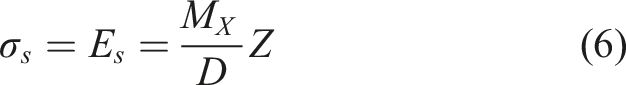
For a symmetrical sandwich (with the same skin having a high modulus of elasticity and low thickness), the position of the neutral axis is located in the middle of the core. Tensile stresses:
The compressive stress in the upper skin is given by:
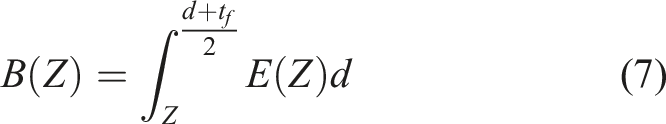
B (z) is the surface moment of order l, calculated by:
For a symmetrical sandwich of the same thin skin with: E
f1
= E
f2
, t
f1
= t
f2
, e = d/2, a core having a low modulus of elasticity, the shear stress remains constant in the core and it is given by the equation:

Any mechanical analysis of this kind of structure must account for shear deformations due to the low density of the material that makes up the core and the roughly constant shear stress in the cross-section. The deformation is made up of two contributions: one from shearing and one from bending.
S: the shear stiffness given by:
Bending behavior of sandwiches
Sandwich structures are often bent at three or four locations. Understanding how their elements (core and skins) respond to these two forms of stress is essential for optimizing their qualities for a particular application. 23
Digital simulation is a crucial step in the design and validation of mechanical structures. Simulation techniques are becoming increasingly efficient, enabling highly comprehensive descriptions of phenomena. Furthermore, these tools are no longer confined to linear mechanics. However, they are being developed to characterize more complex behaviors, including those leading up to structural failure, which is relevant to the subject of safety under both dynamic and static loads. 26
The necessity to calculate structural and terrain deformations under varied loads necessitates the use of numerical methods as well as somewhat complex material behavior laws. Modeling is the process of constructing a model that depicts an object or system and its properties, either whole or in part. A model can be identical to the underlying system or deviate from it due to approximations. 27
Materials and methods
We have chosen the “ABAQUS” software, which deals with the majority of structural mechanics problems. It can provide powerful tools for analysis in two and three dimensions.
Geometric study
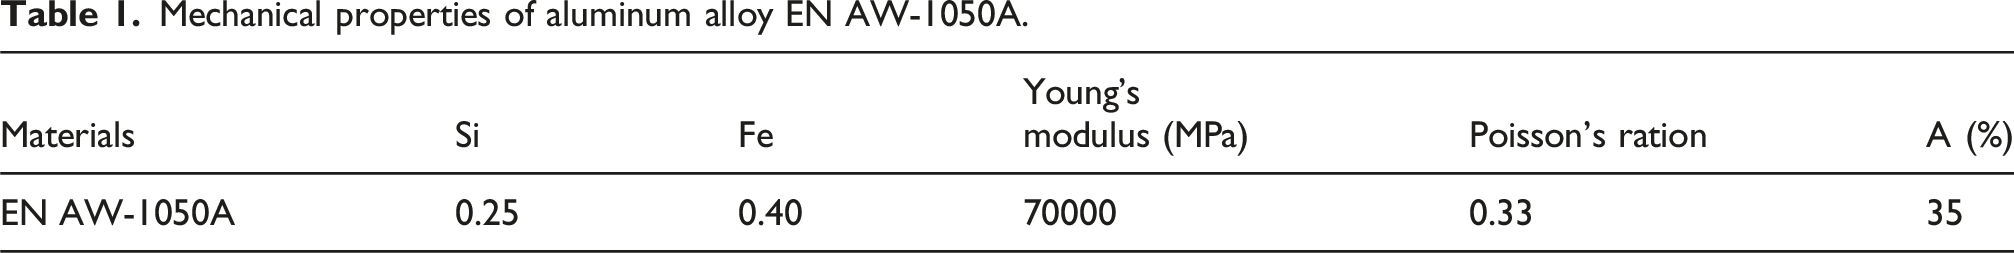
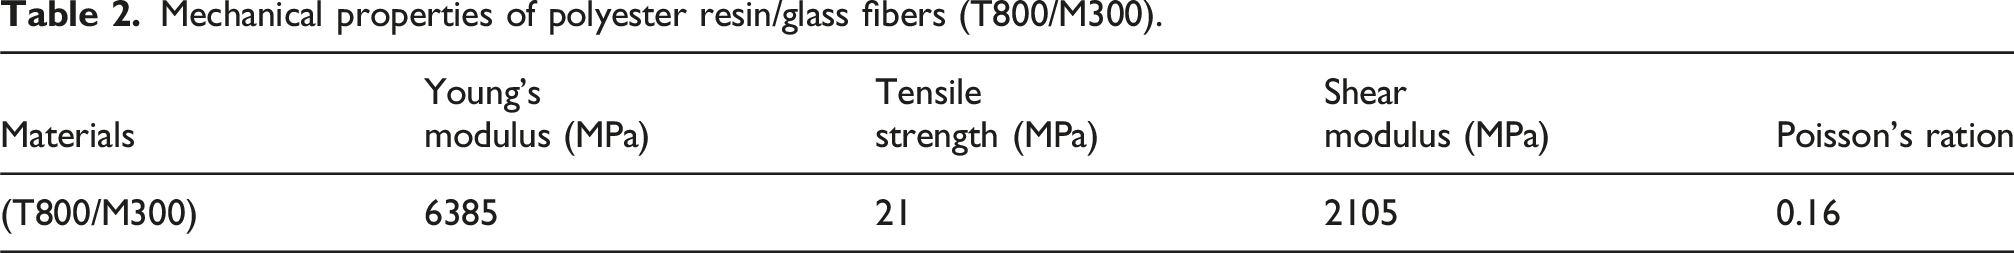
We investigated the bending behavior of two sandwich beam models and compared them to a reference honeycomb model that was subjected to imposed displacements. The sandwich beams were designed using the aluminum alloy EN AW-1050A (O) and (T800/M300) casings, with (T800/M300) utilized in the outer layers (skin) and (1050A) in the core for the requisite lightness and flexibility. In this study, we employed a three-point bending test Figure 2. The mechanical properties of the proposed materials are presented in Tables 1 and 2. Sandwiches beams geometry. Mechanical properties of aluminum alloy EN AW-1050A. Mechanical properties of polyester resin/glass fibers (T800/M300).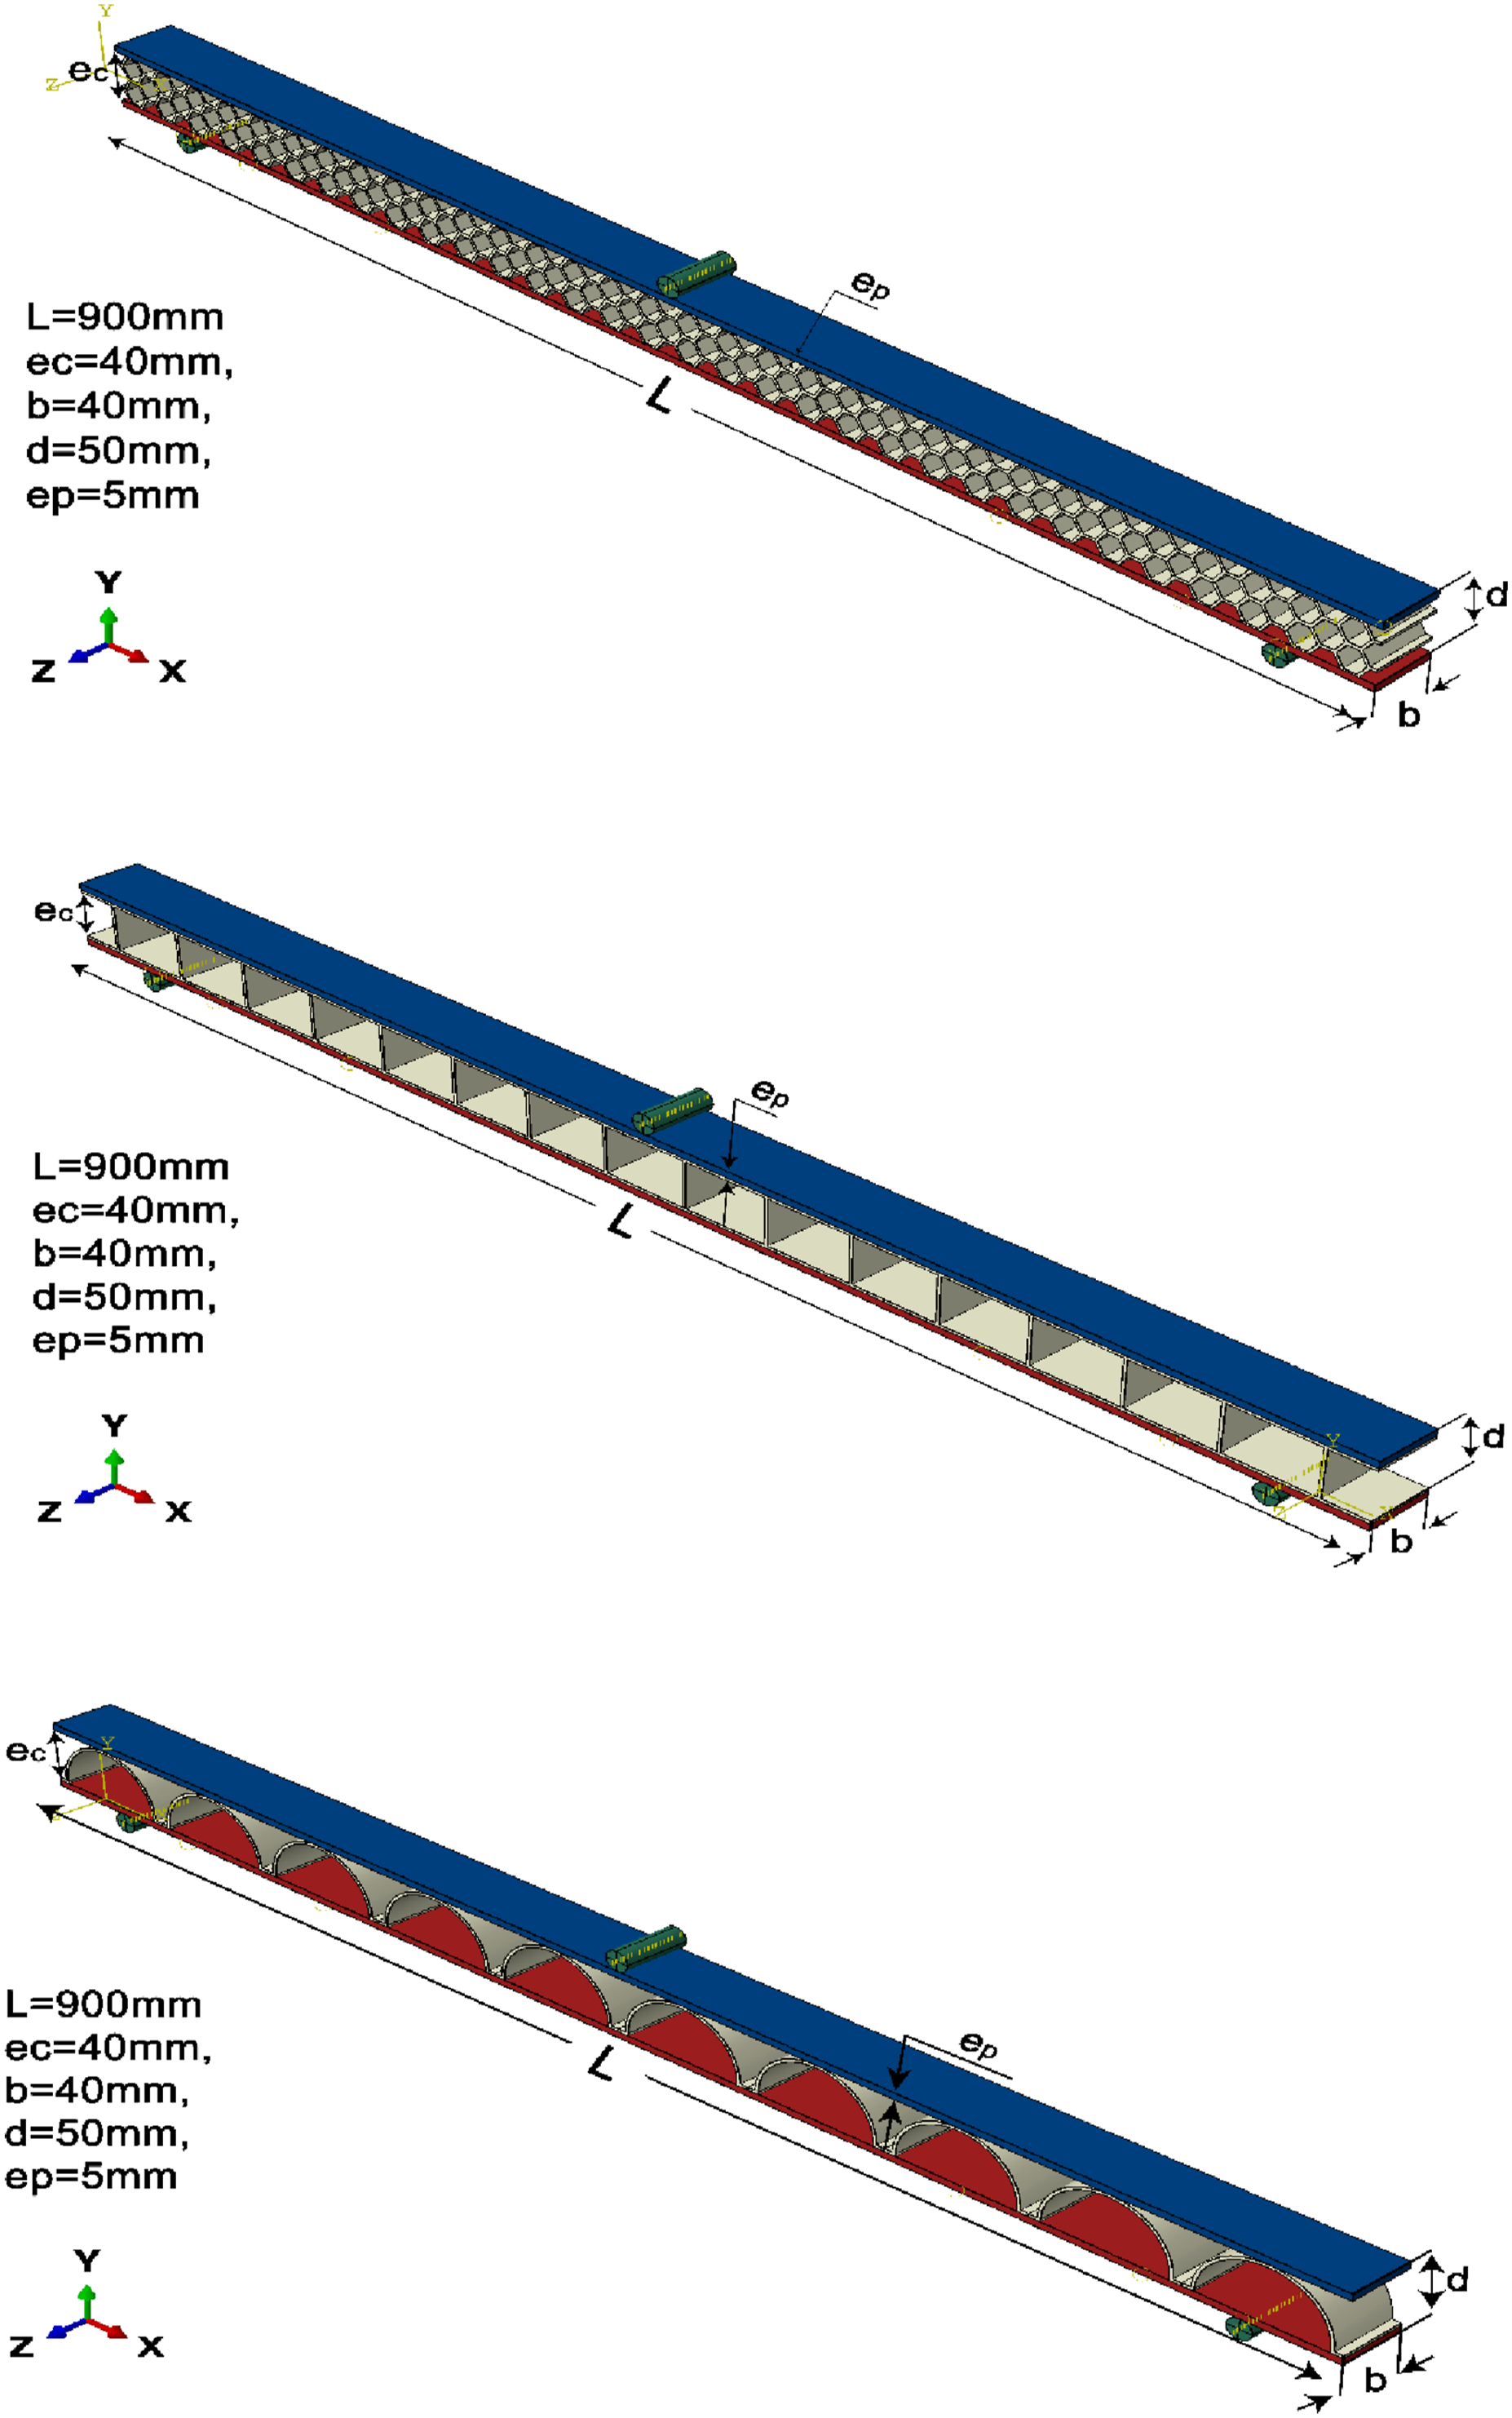
Finite element model and boundary conditions
Three main parts were used to model the composite sandwich structure: the supports, the core, and the skins. Its flexural performance was assessed using a three-point bending configuration. Realistic load transfer during bending was ensured by defining the connection between the sandwich structure and the three supports as tangential contact behavior. In a similar vein, tangential behaviors were employed to describe the interface between the skins and the core, allowing the simulation to account for interfacial shear effects and potential layer sliding. These contact behavior criteria are necessary to accurately depict the sandwich model’s mechanical response to flexural loading, especially the interplay between the core’s shear resistance and the skins’ bending stiffness.
To simulate the three-point bending response of composite sandwich constructions effectively, it is essential to define the tangential behaviors at contact interfaces. Relative sliding at the support-skin contact zones influences load transfer and support reactions. The shear transmission at the skin-core interface is also affected by these tangential behaviors. Accurate modeling of tangential interactions ensures proper representation of interfacial shear stresses and deboning tendencies. Neglecting this could lead to distorted shear and bending contributions, resulting in an underestimation of local stress concentrations. Therefore, modeling tangential contacts is critical for predicting failure modes and overall flexural stiffness in composite sandwich structures.
Using C3D8R components, an efficient choice for the assembly skins, core, and supports, the composite sandwich model was subdivided into smaller parts to capture three-dimensional stress and displacement under bending pressure accurately. Consistent meshing facilitated stable computations and proper load transfer at contact points. Local mesh refinement enhanced resolution in areas with strong stress gradients, such as the midspan loading zone and support contacts, allowing for precise modeling of bending and shear in composite sandwich constructions under three-point bending conditions.
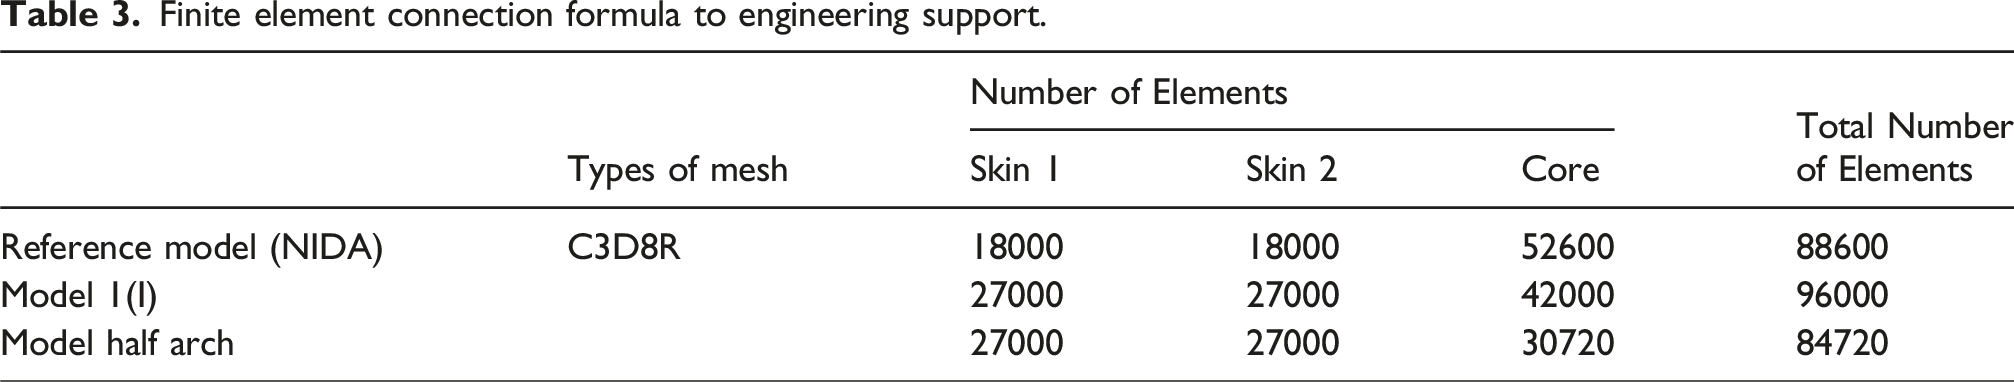
When modeling composite sandwich structures with finite elements, C3D8R elements are crucial, as shown in Figure 3. These 8-node linear brick elements provide a balance of speed and accuracy for visualizing three-dimensional stress fields. Their reduced integration decreases computational cost and prevents numerical instabilities. C3D8R elements can effectively represent bending stresses in the skins and shear stresses in the core. Using a uniform mesh formulation ensures consistent stiffness and smooth stress transfer across interfaces, making them ideal for analyses of complex loading scenarios, such as three-point flexion, where accurate global deformation and local stress predictions are necessary. Mesh of models.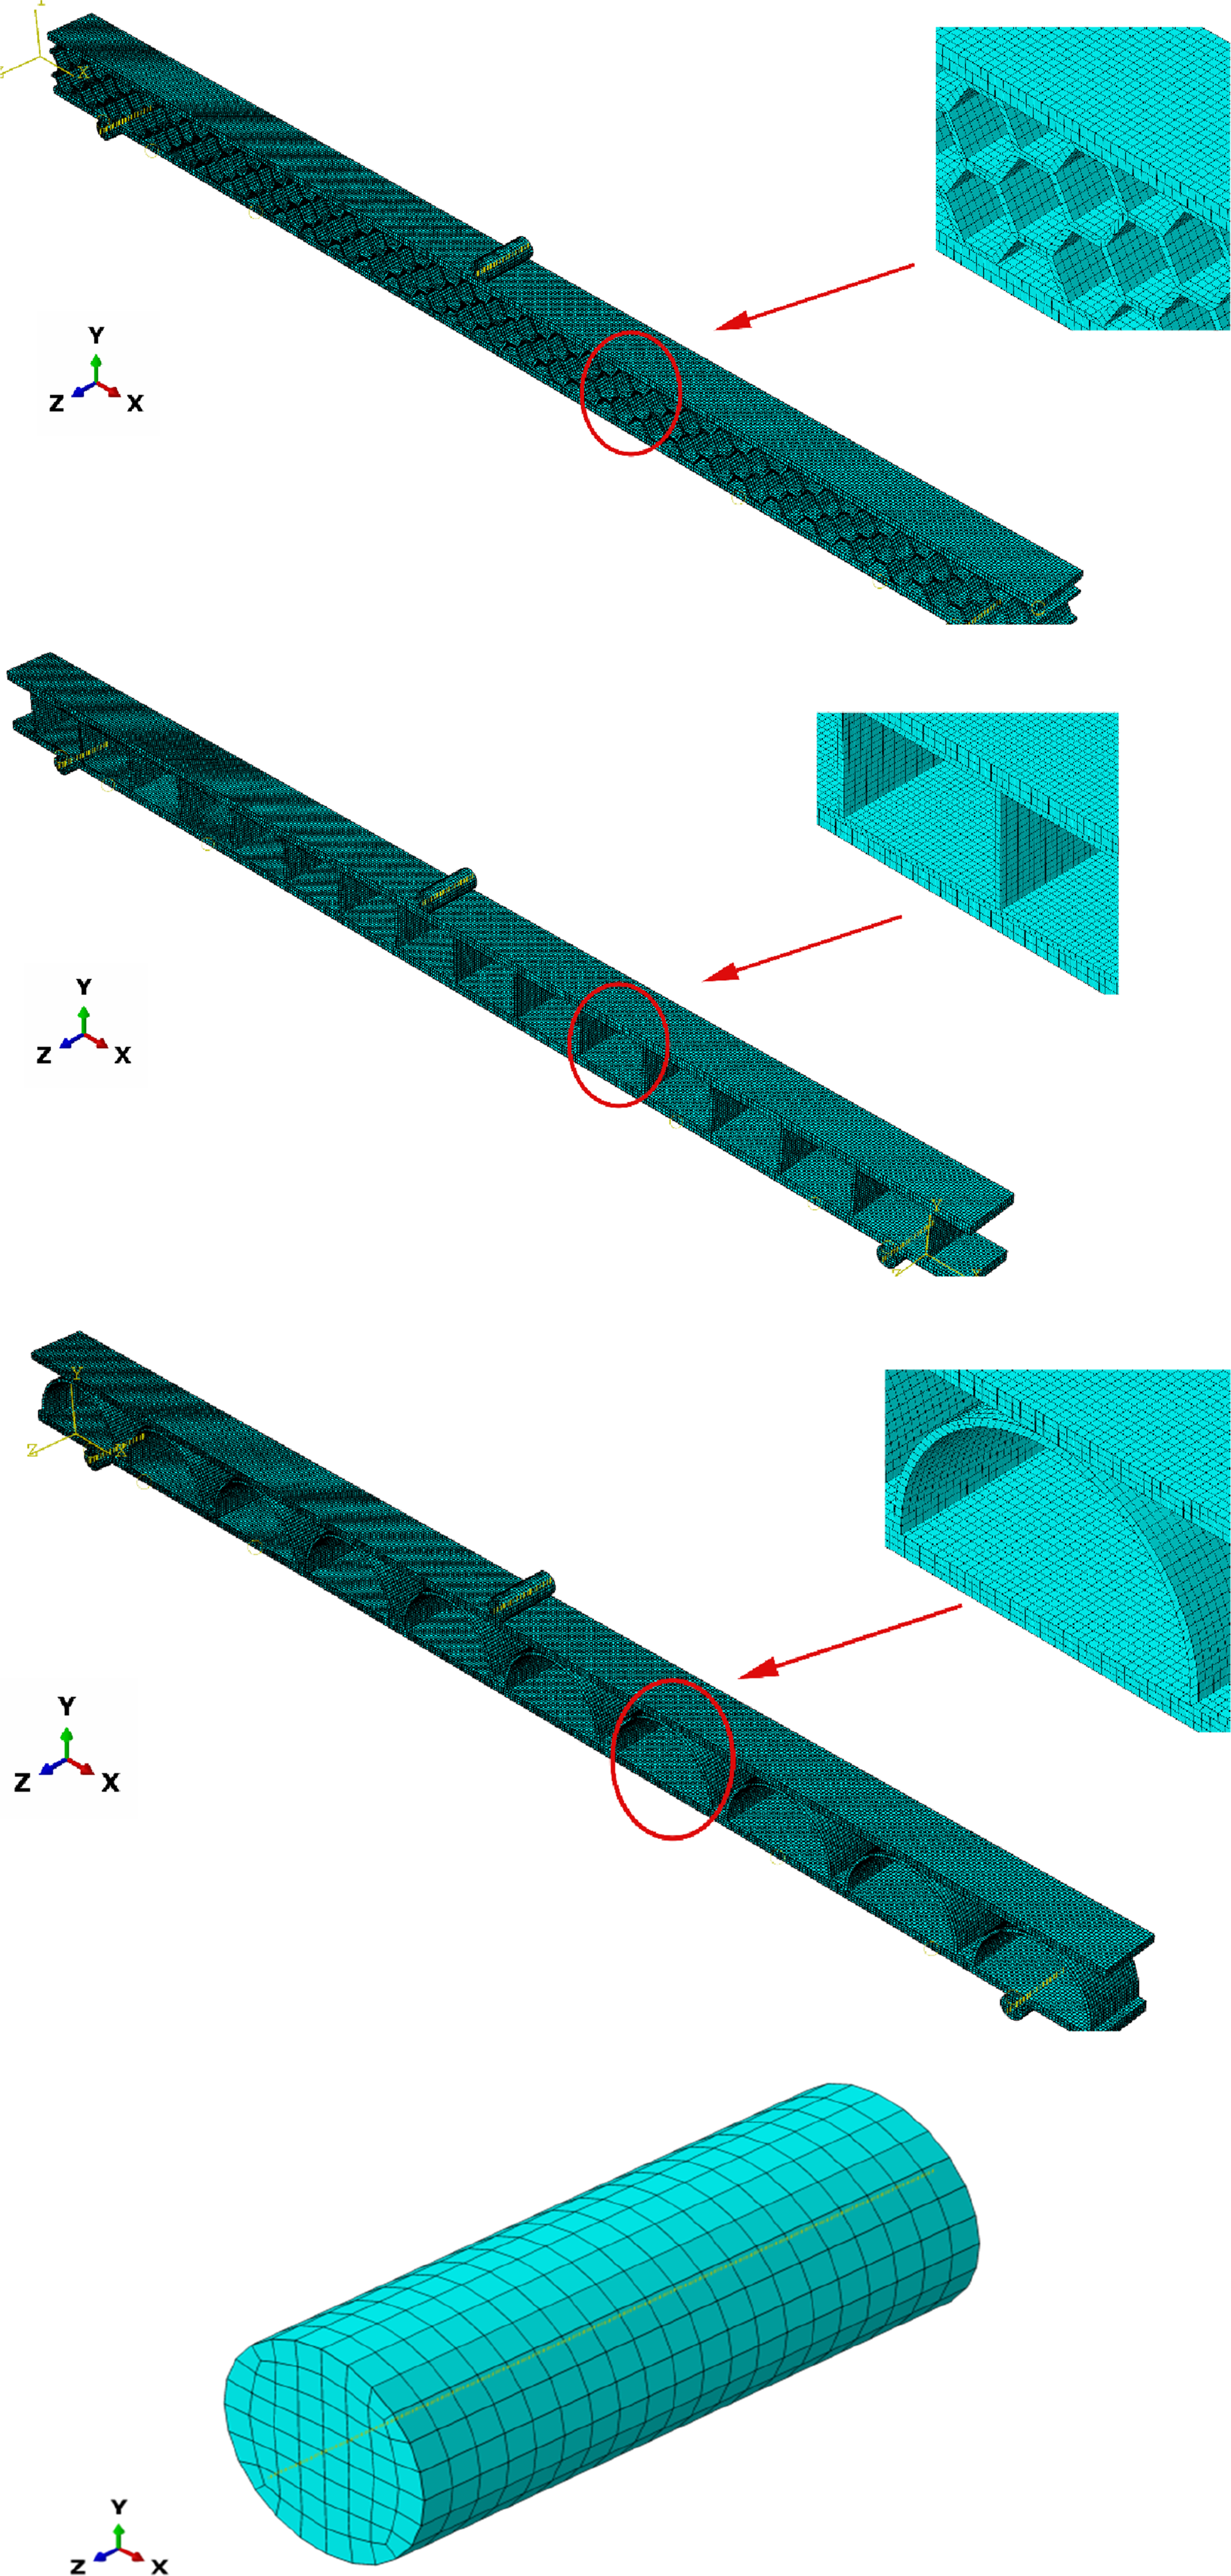
Boundary conditions
Finite element connection formula to engineering support.
Loading
All interacting components, such as the face sheets, core, supports, and loading indenter, have surface-to-surface contact defined. While tangential behavior was represented using frictional interaction to enable realistic sliding, contact behavior in the normal direction was specified as firm contact, prohibiting penetration in Figure 4. Models’ interaction.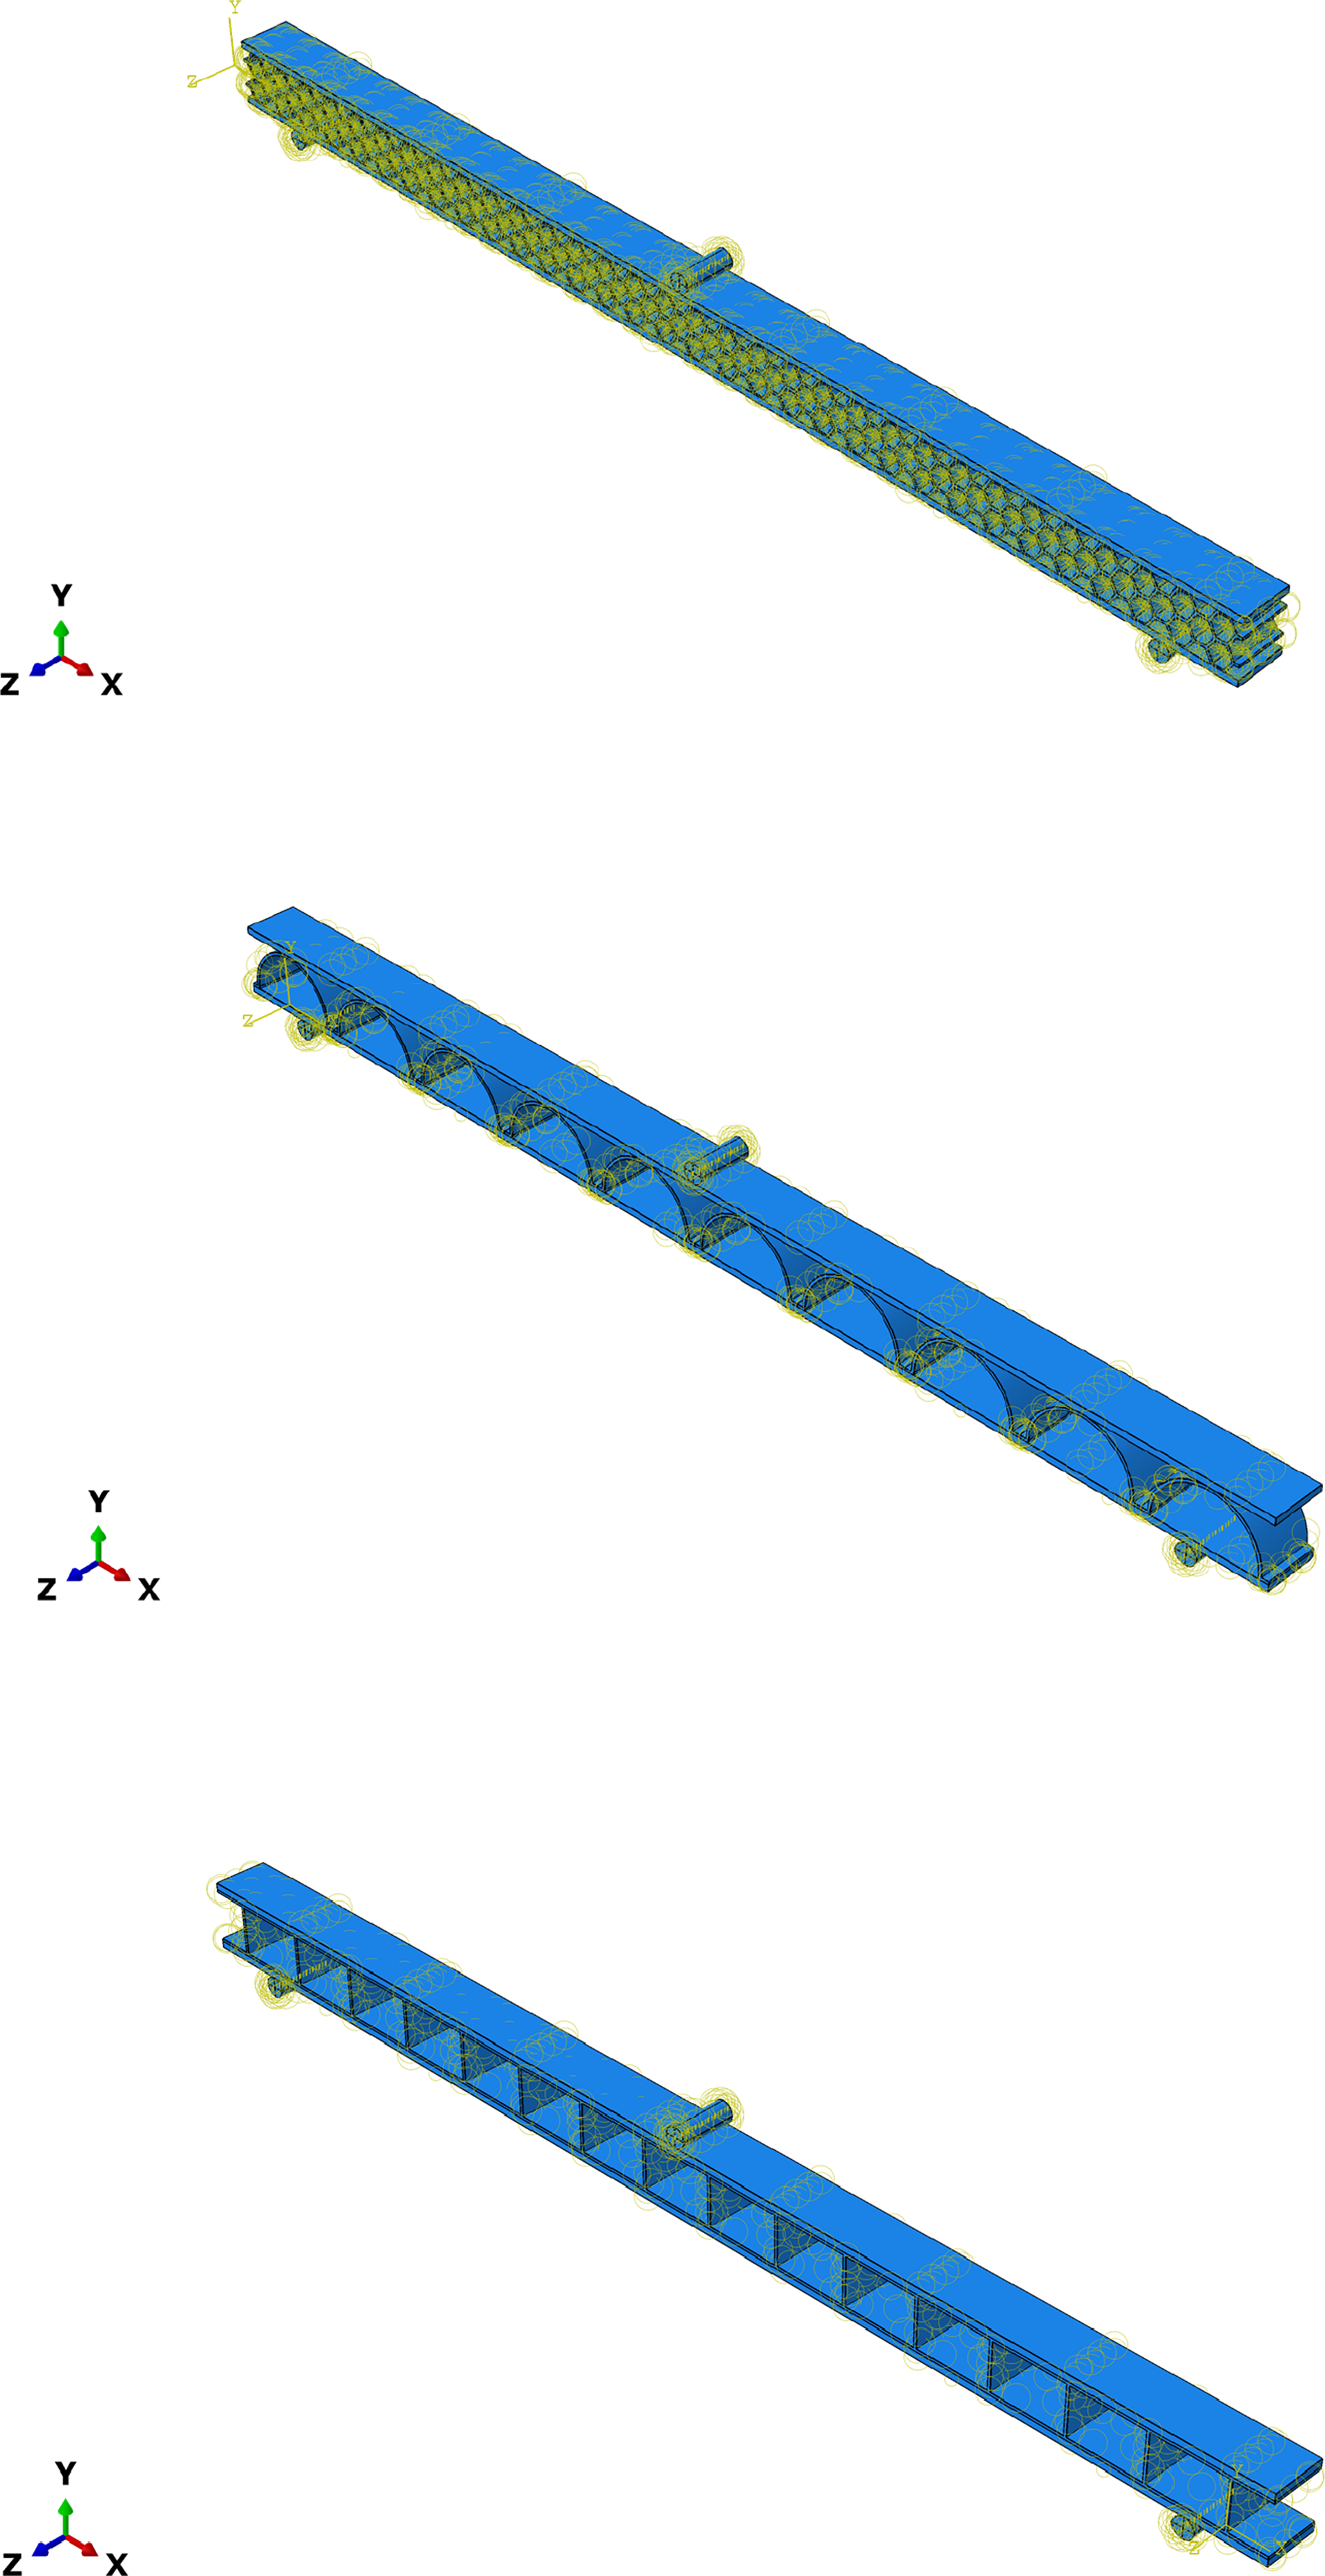
The two bottom supports were completely secured in terms of boundary conditions to stop any rotational or translational movement (U1=U2=U3=UR1=UR2=UR3=0). In order to simulate a progressive three-point bending scenario, a displacement-controlled loading was applied at the midspan through a cylindrical indenter. The displacement values ranged from 0.1 mm to 0.6 mm. The interaction of models illustrated in Figure 5. Loading.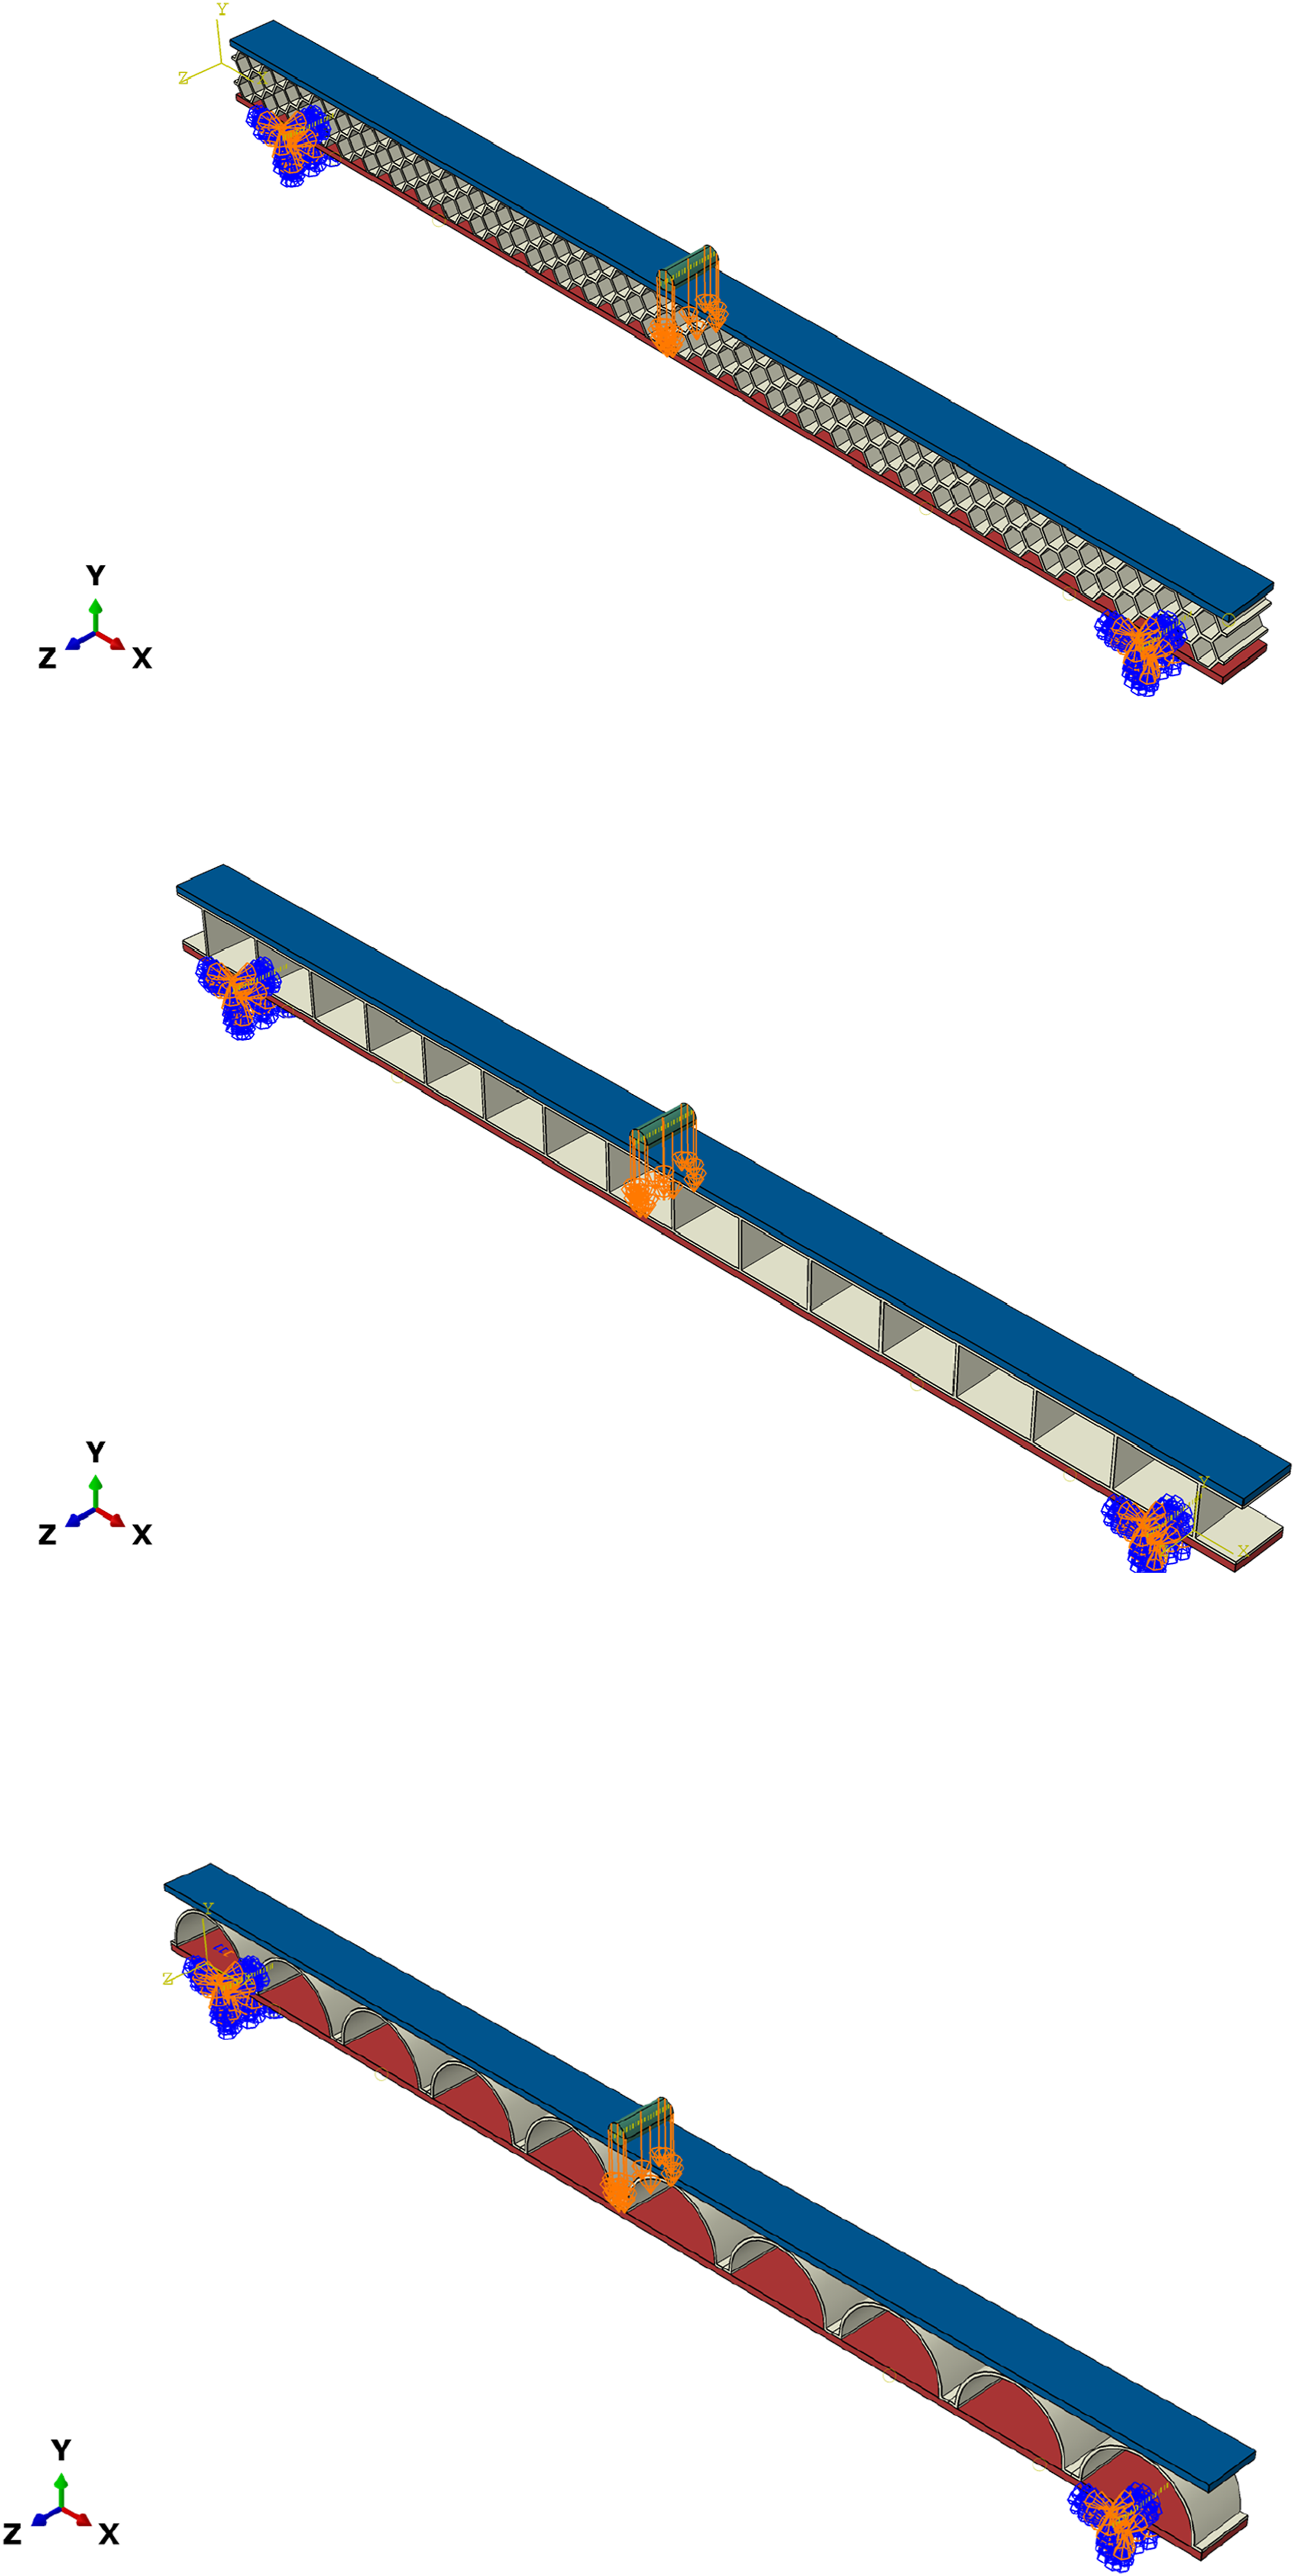
The imposed displacement values of 0.1, 0.3, and 0.6 were used to accurately capture the curvature (deflection) of composite sandwich structures under diverse loading conditions. This conclusion is based on a methodological approach that systematically accounts for the transition from quasi-linear to non-linear behaviour while maintaining the model’s numerical stability. Preliminary analyses demonstrated that intermediate values, such as 0.2, 0.4, or 0.5, did not produce significant additional variation in the mechanical response, unlike the chosen values that accurately represent mechanically significant deformations without redundancy or computational overhead. So, the chosen set of displacements is a great way to show how curvature changes and how well composite sandwich structures work as a whole.
ISO-value of stress
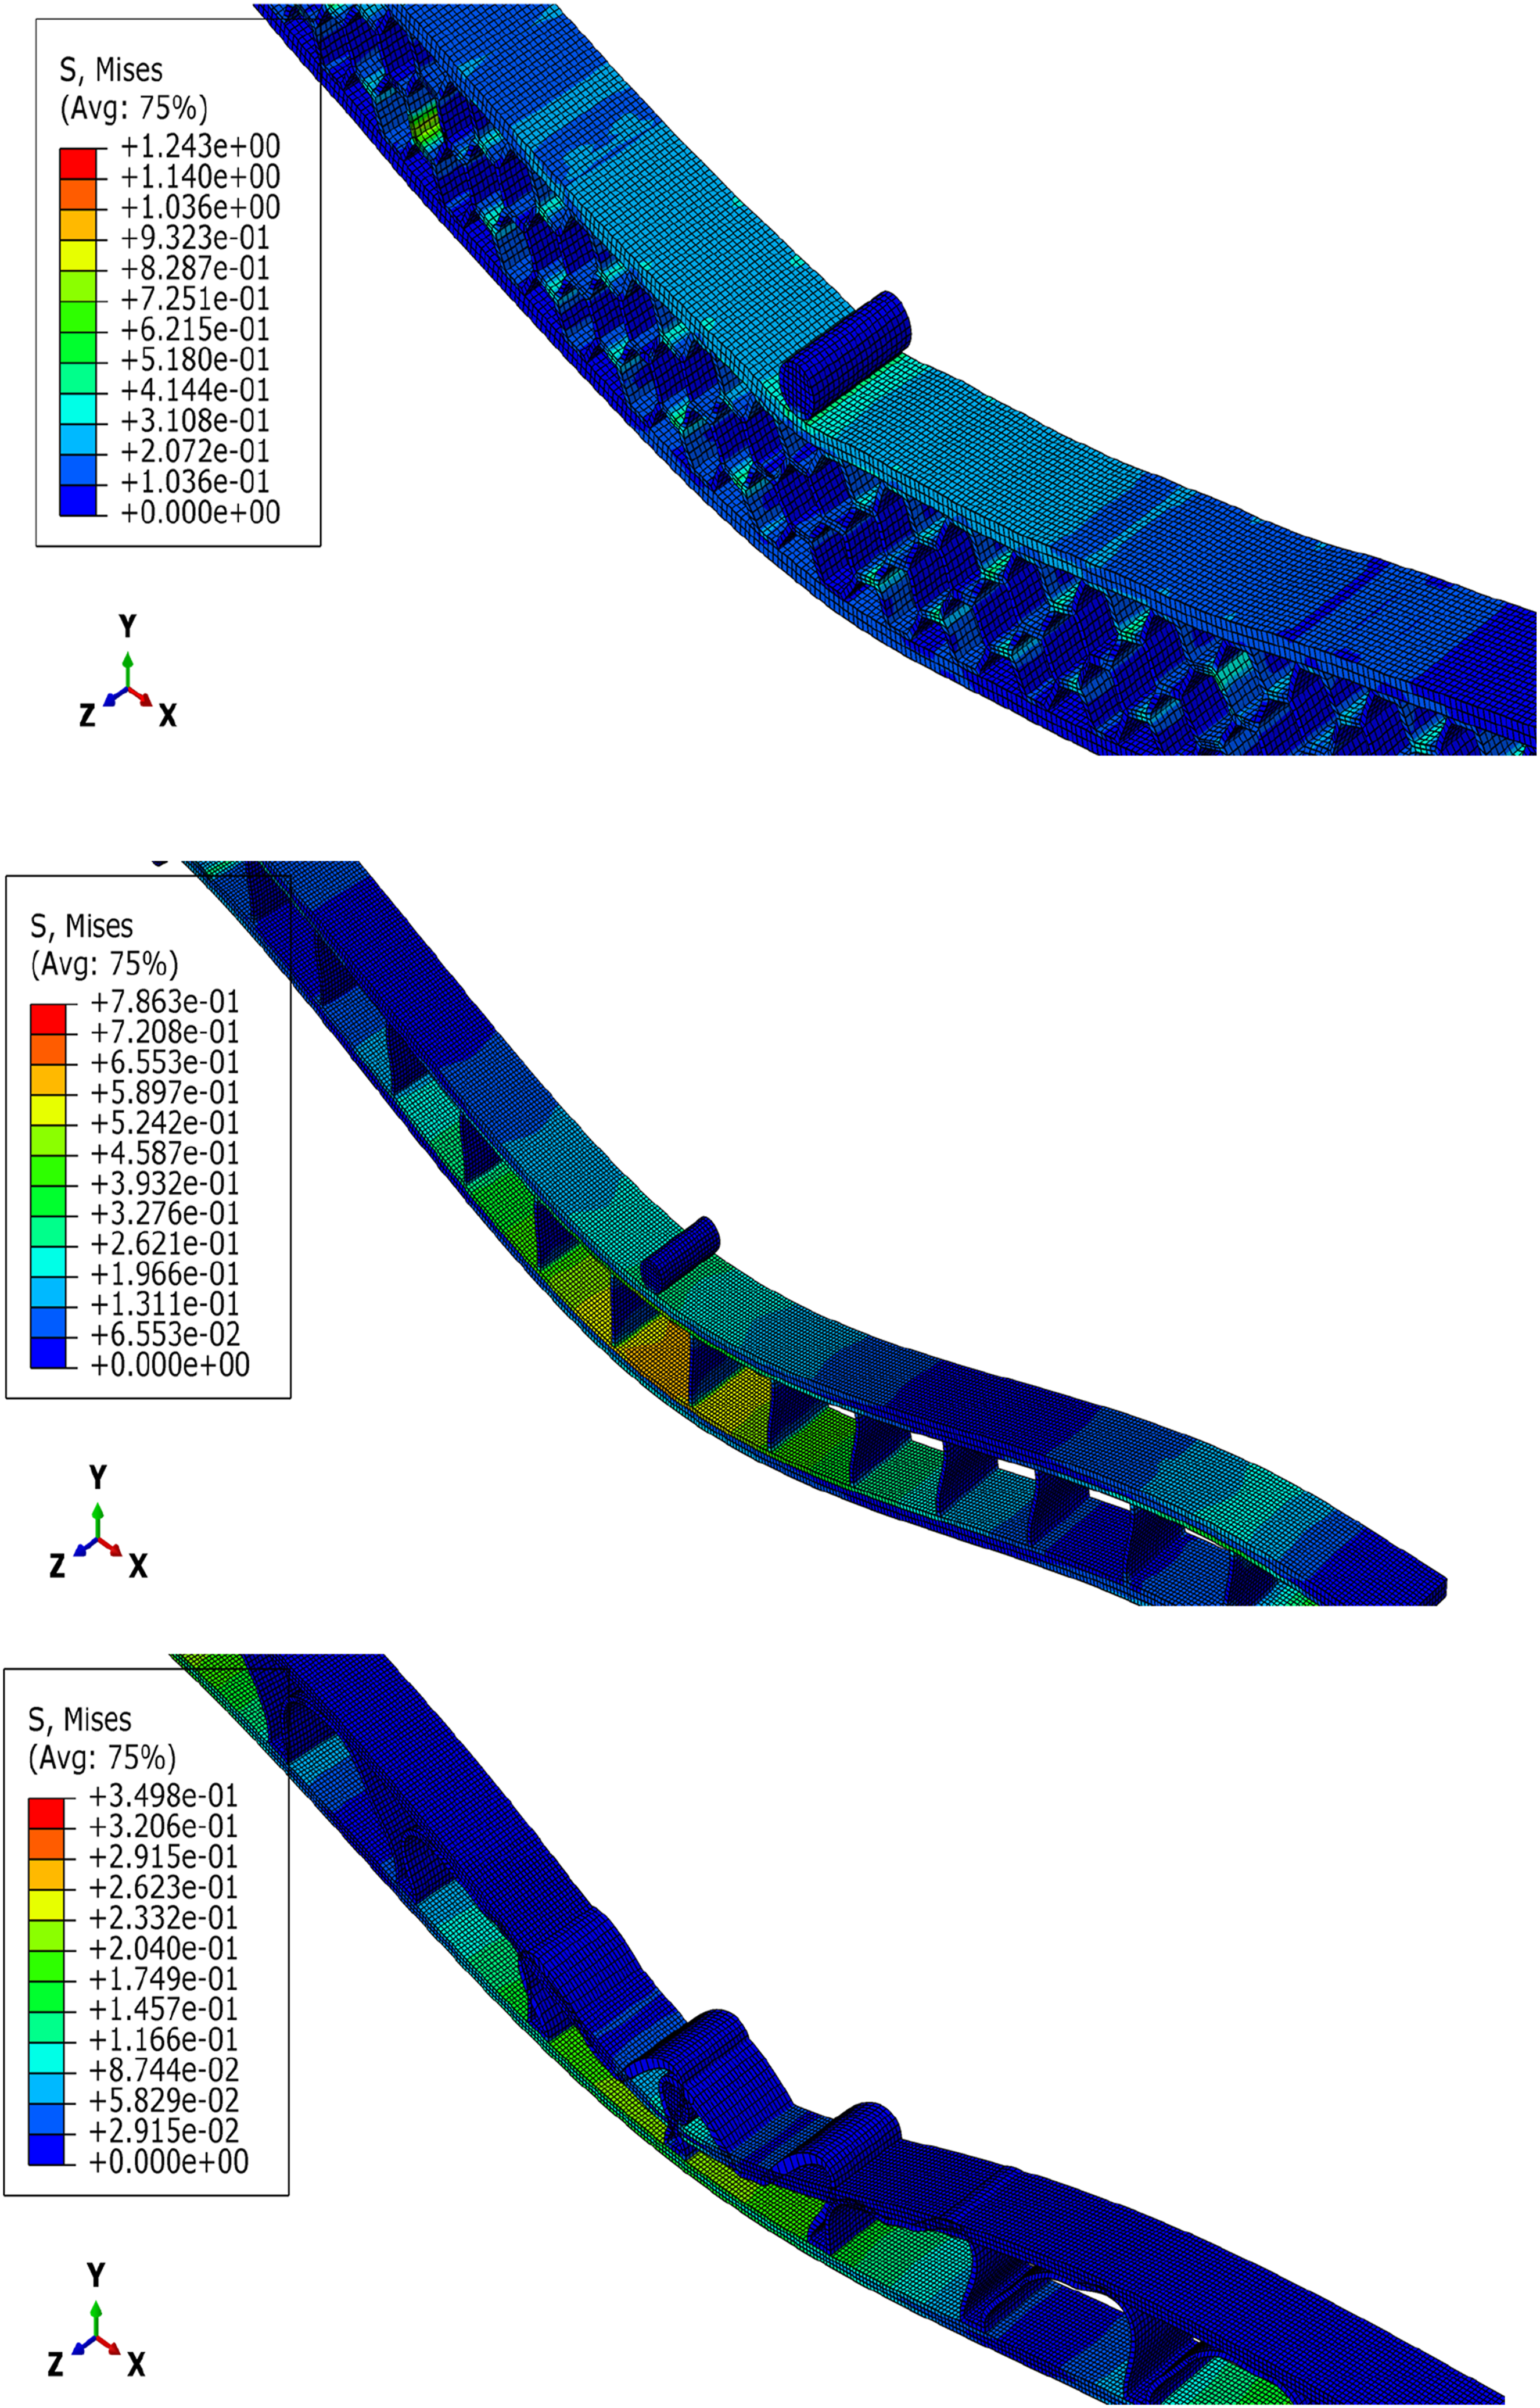
Von Mises results were obtained for the suggested sandwich constructions based on the visual color scale previously specified, which ranges from dark blue (low stress) to red (high stress), as shown in Figure 6. The equivalent value of σVM, Von Mises stress, is expressed as the following relationship in Figures 7, and 8. Stresses V. Misses; (a) NIDA, (b), model I, (c) model half arch.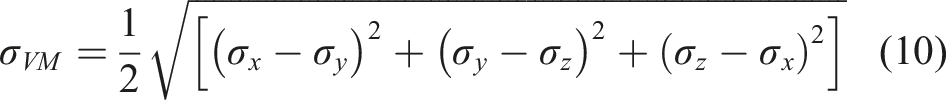
Displacements
Displacements; (a) NIDA, (b), model I, (c) model half arch.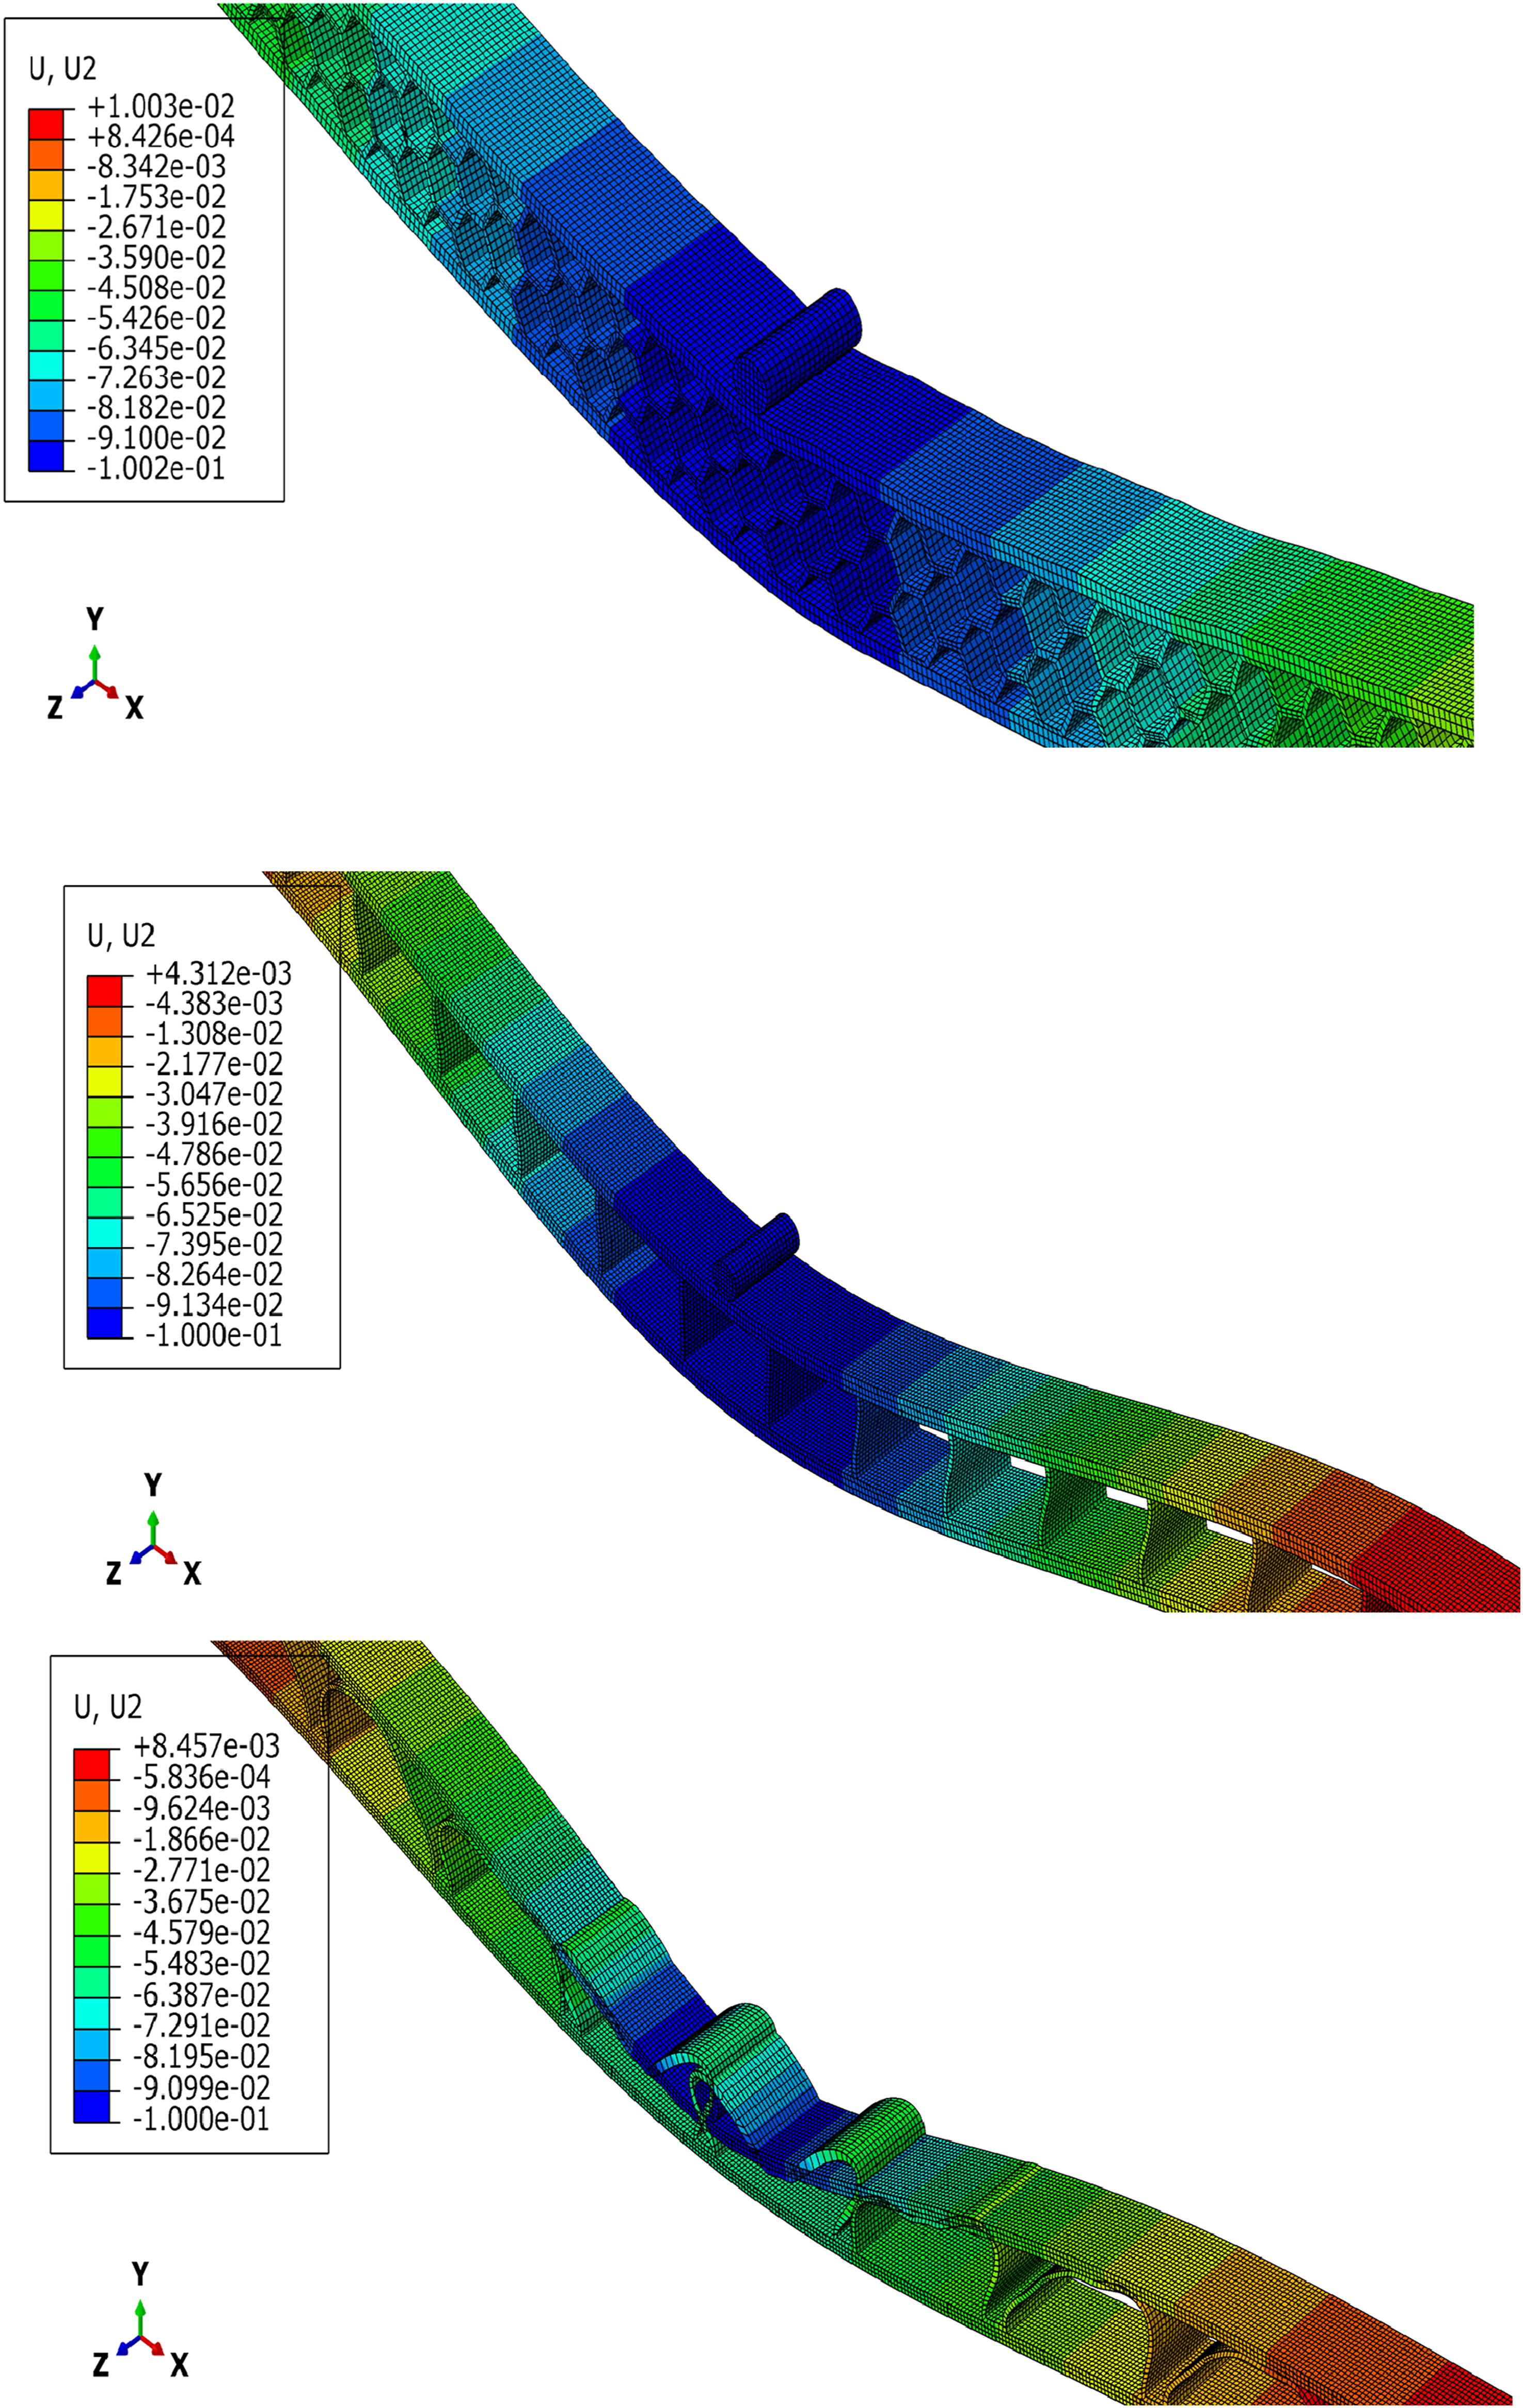
Strain
Stain; (a) NIDA, (b), model I, (c) model half arch.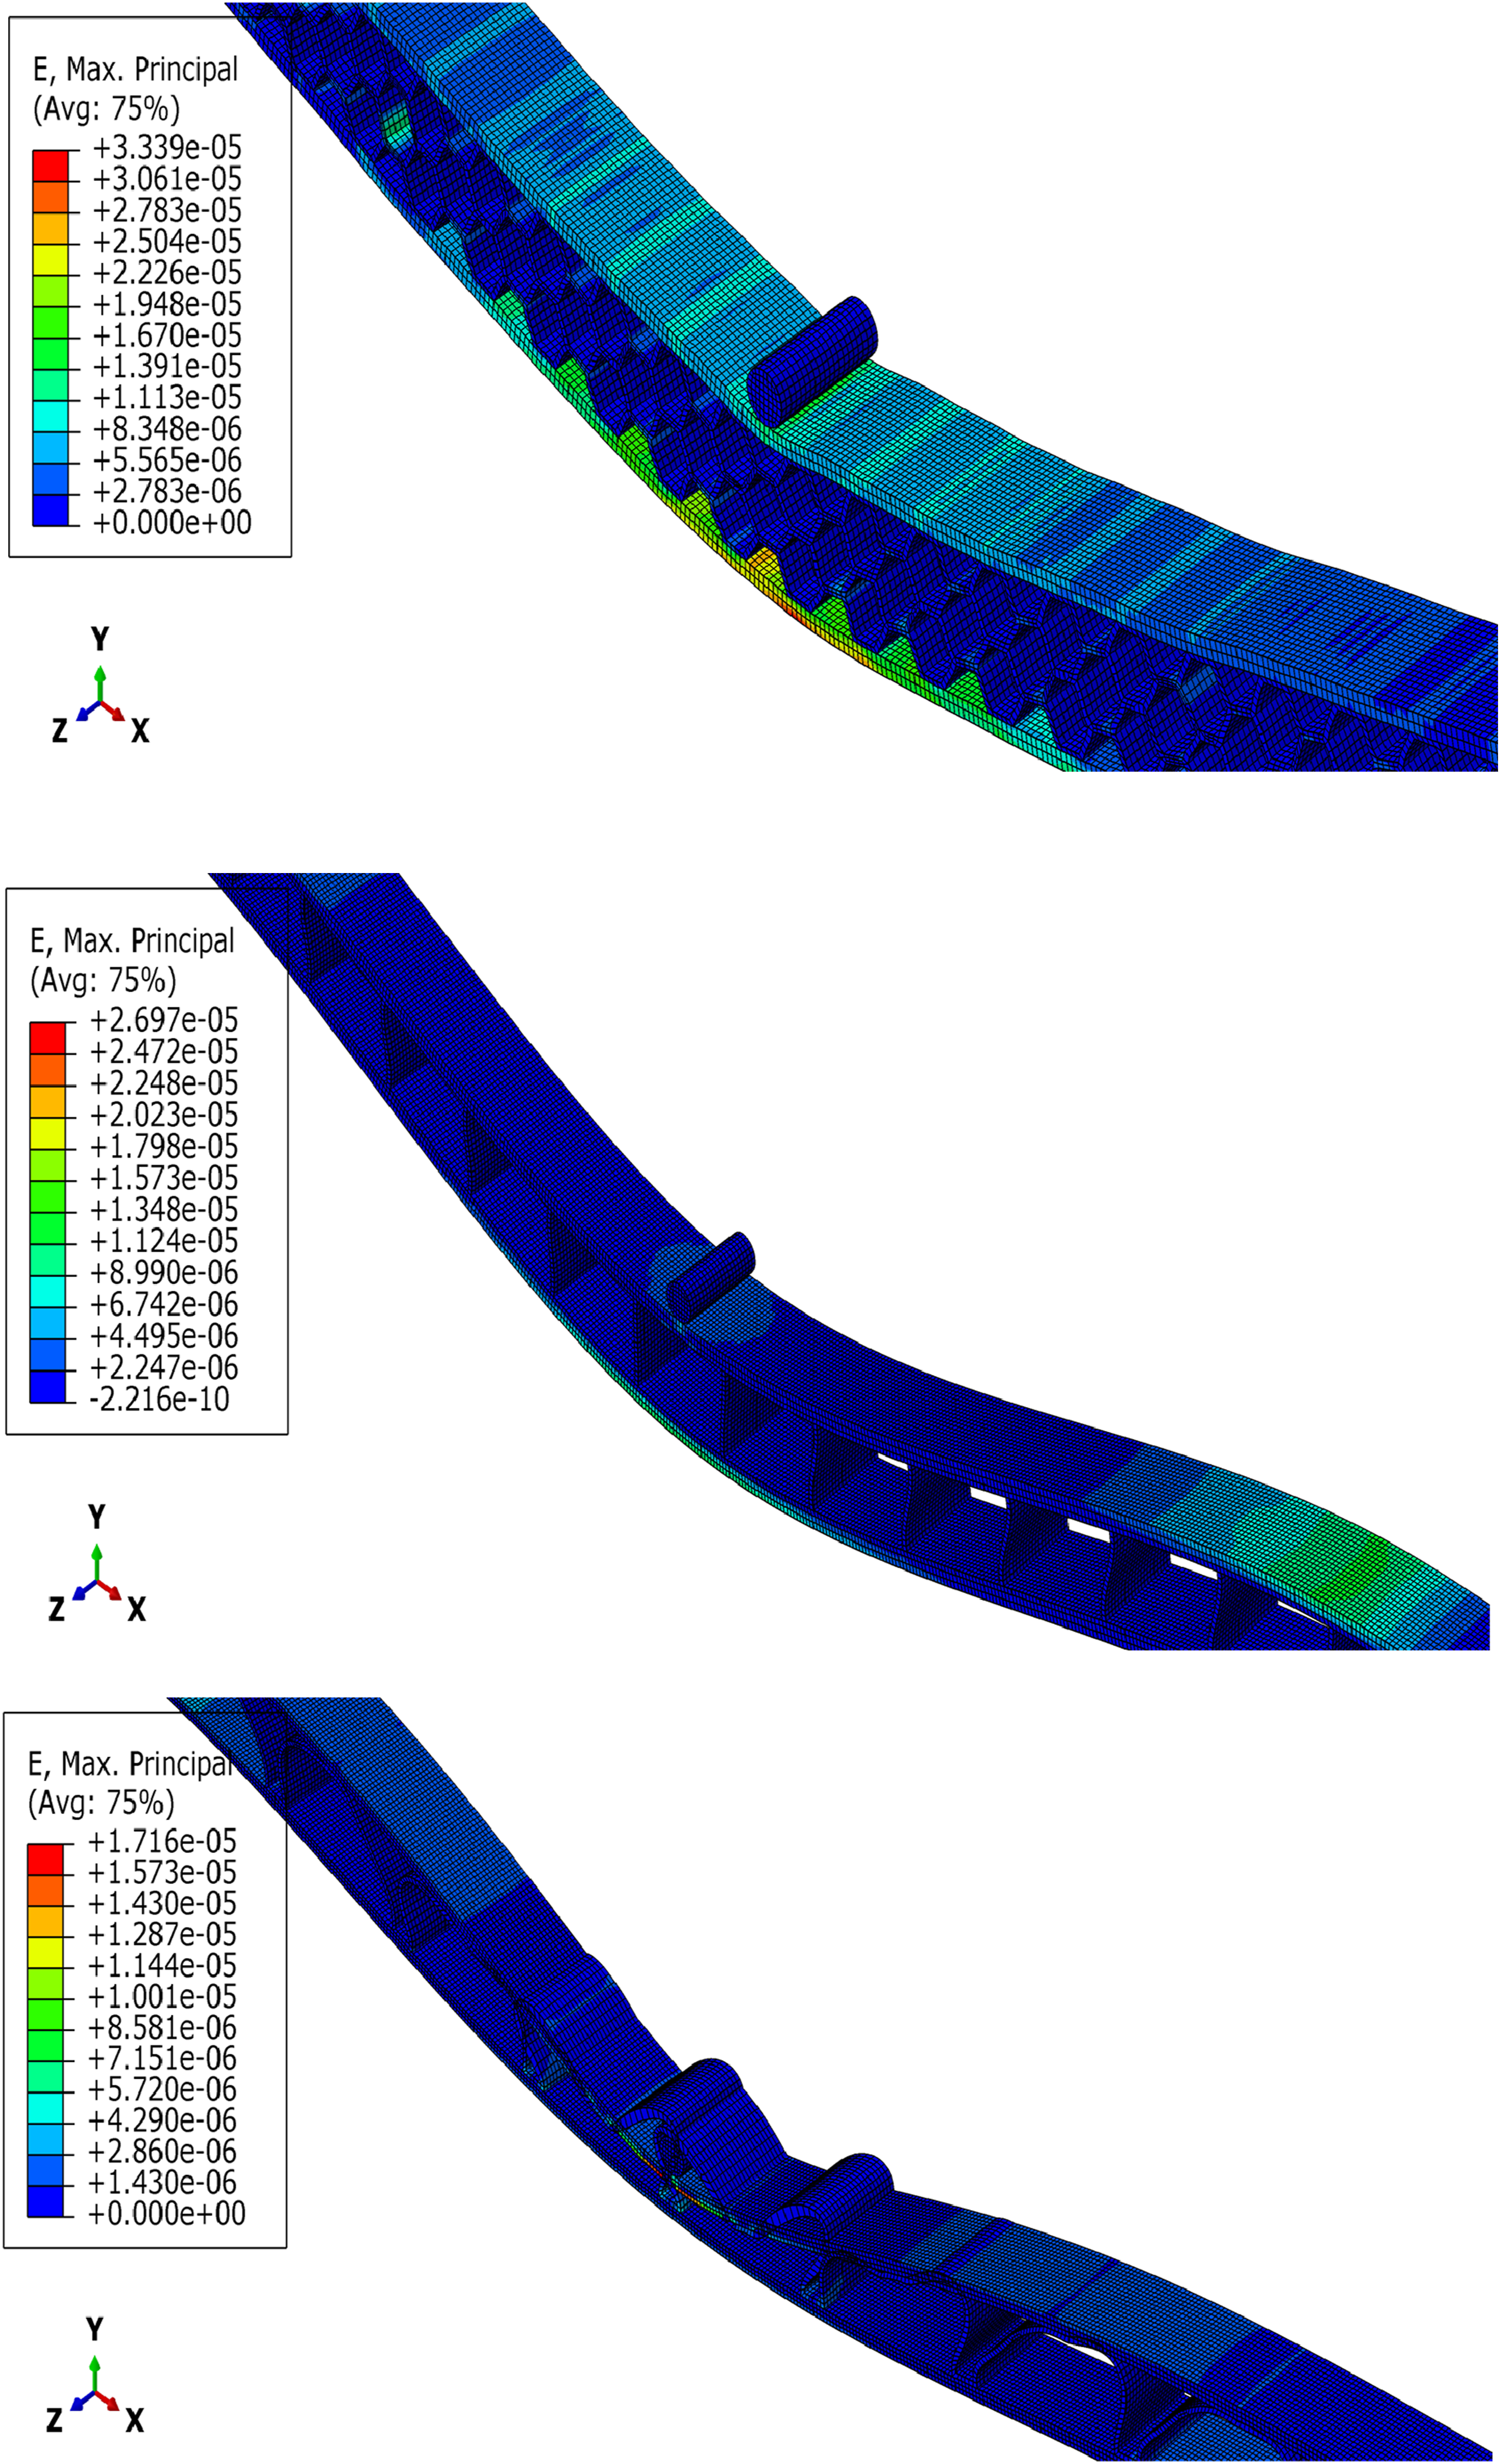
Shear stress
Shear Stress; (a) NIDA, (b), model I, (c) model half arch.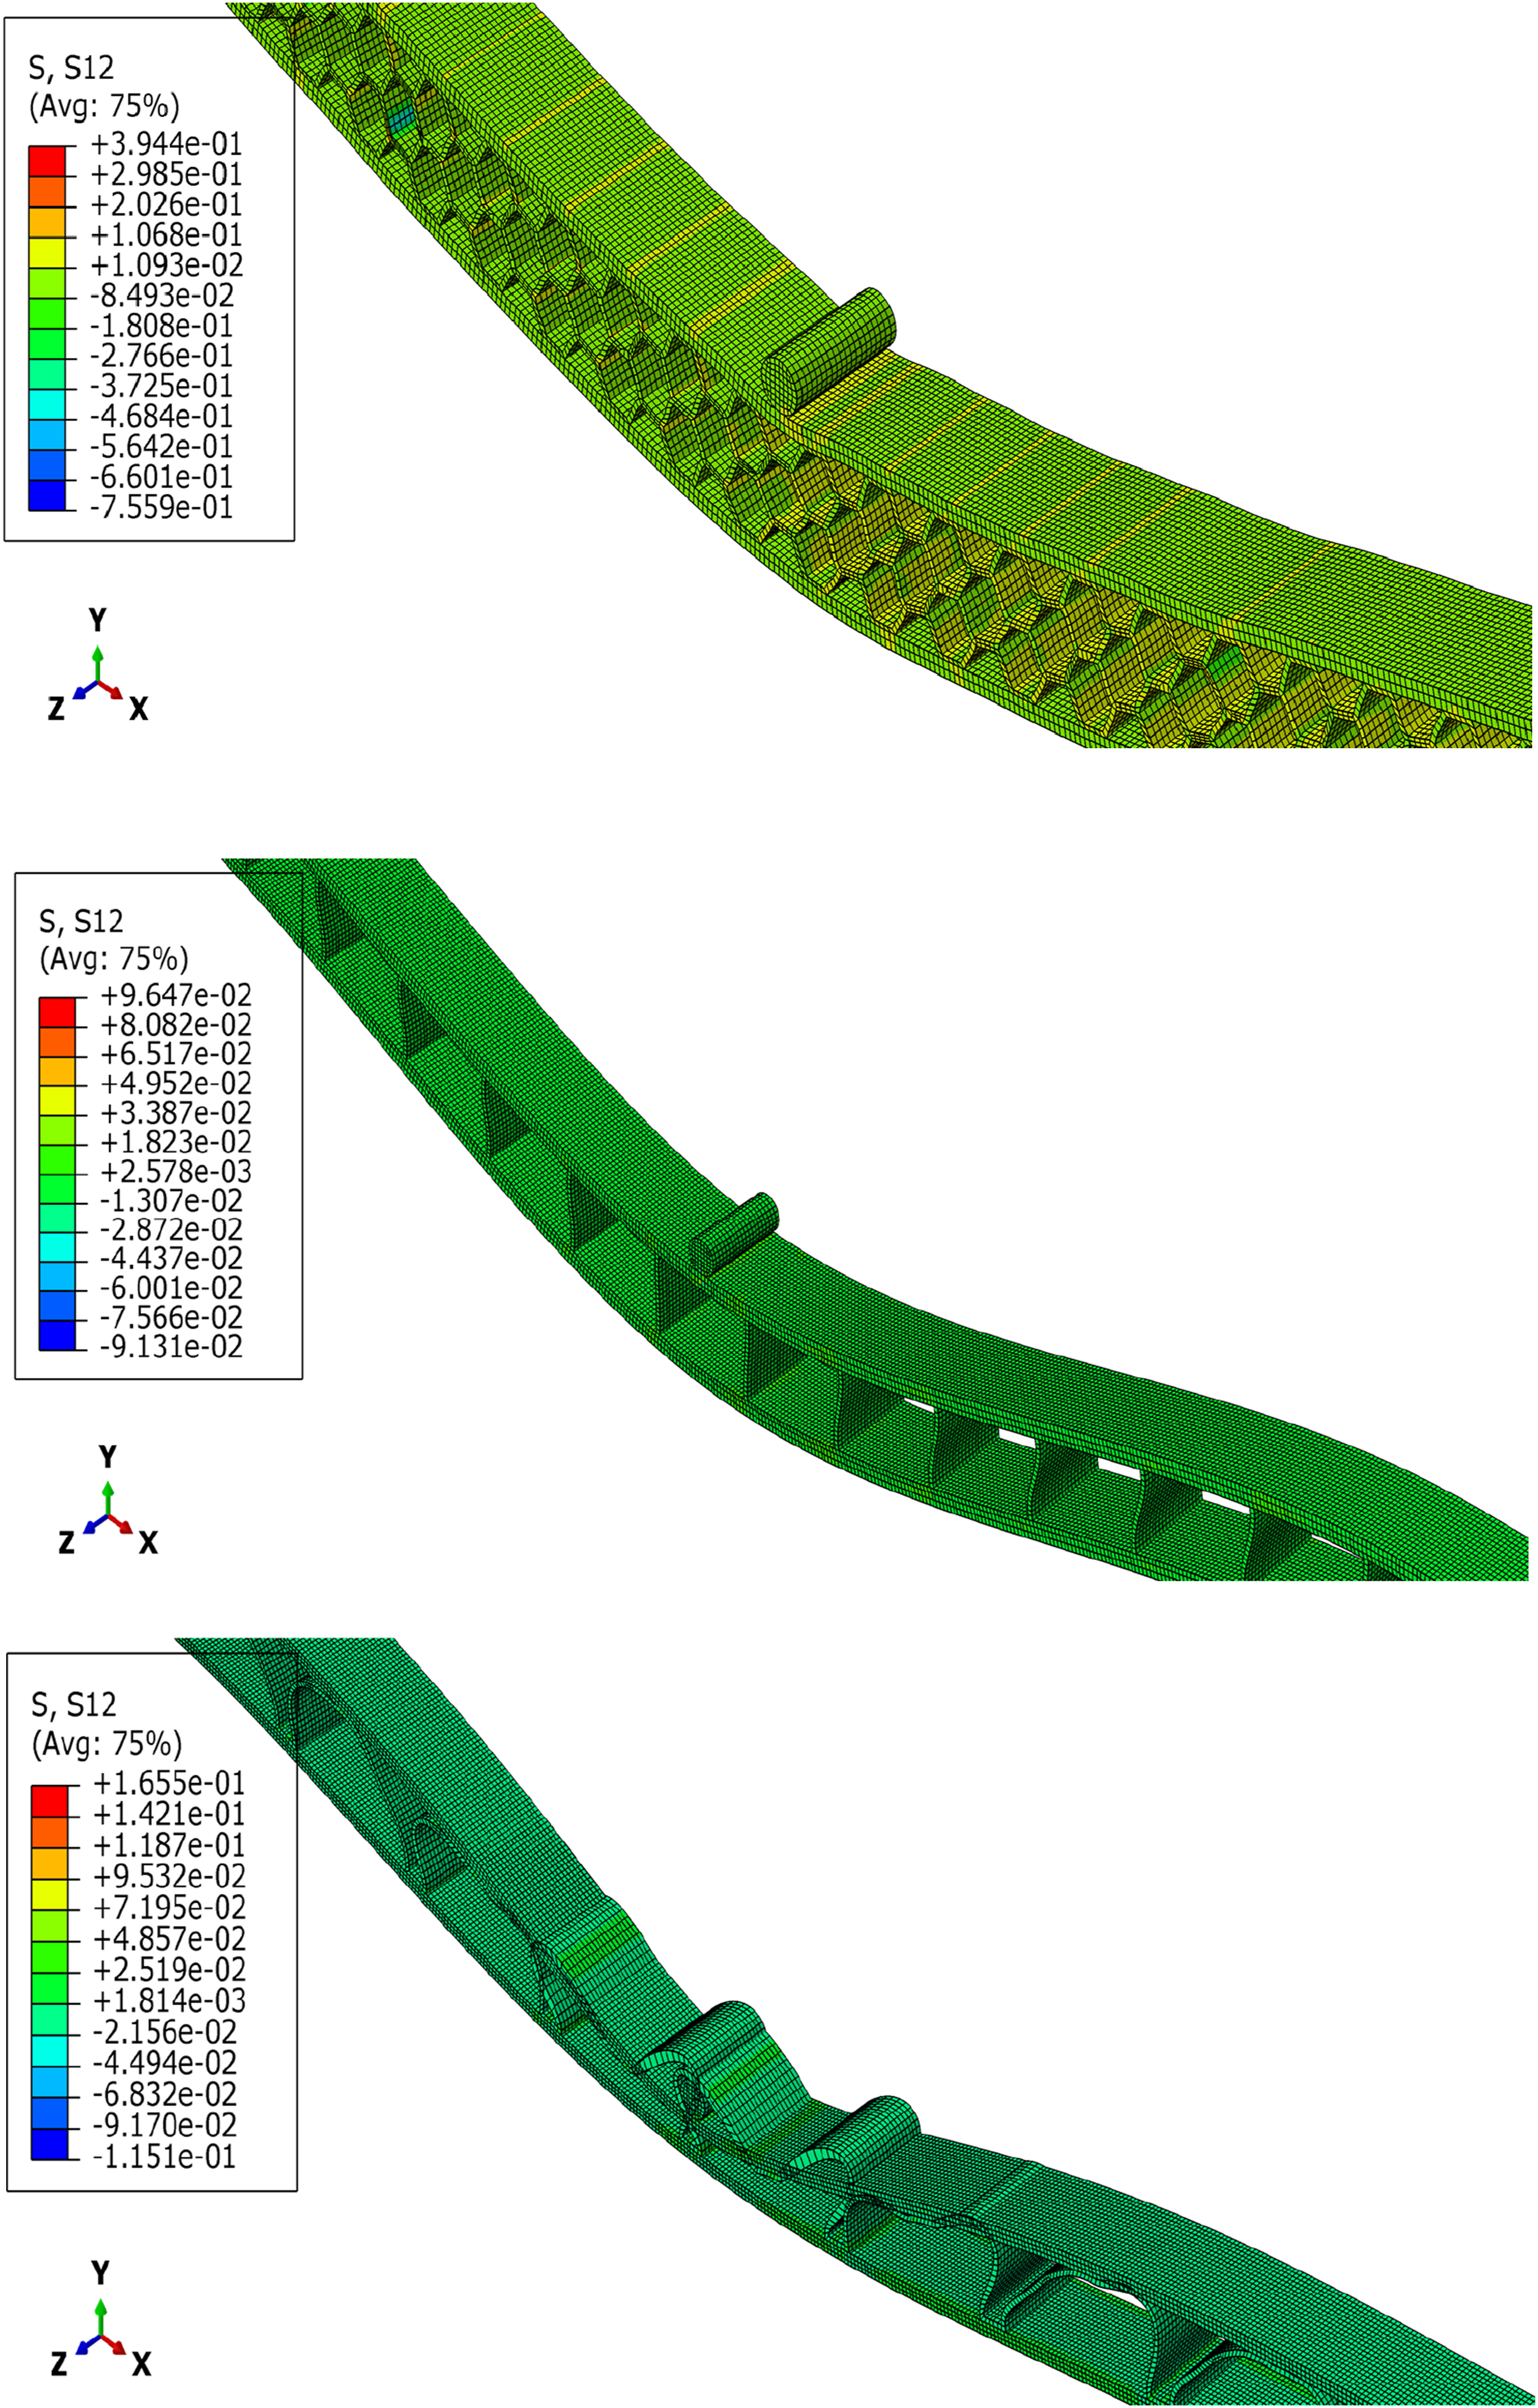
Results
Comparative studies
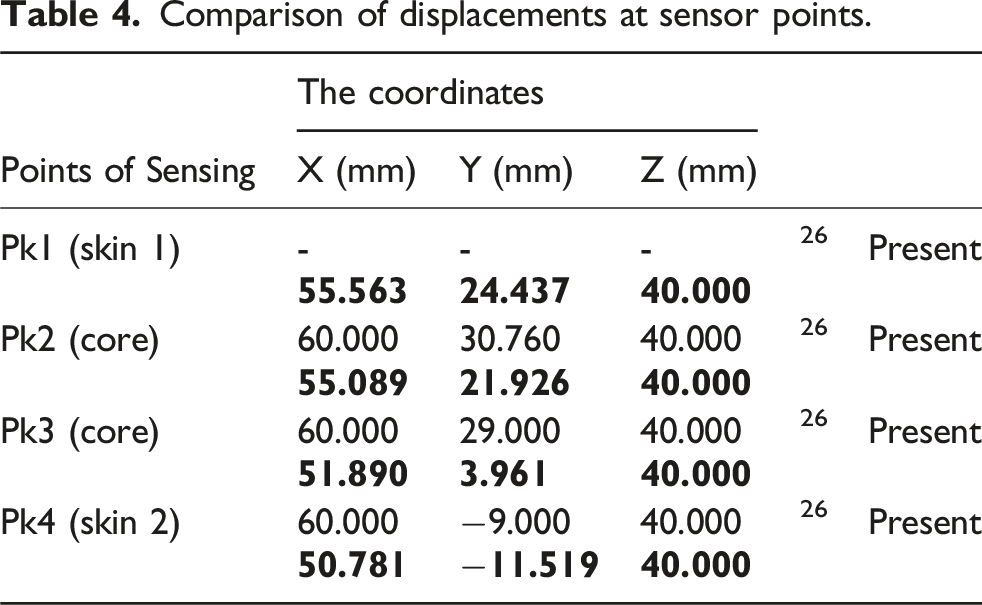
Comparison of displacements at sensor points.
Parametric study
To study the effect of model geometry on the development of applied stresses σxx, σyy, σzz, τxy, τxz, and τyz on the core and skin in order to understand the mechanical behavior of sandwich structures. We placed sensor points in the lattice, as seen in Figure 10. The sensor points (Pk1, Pk2 and Pk3) for models.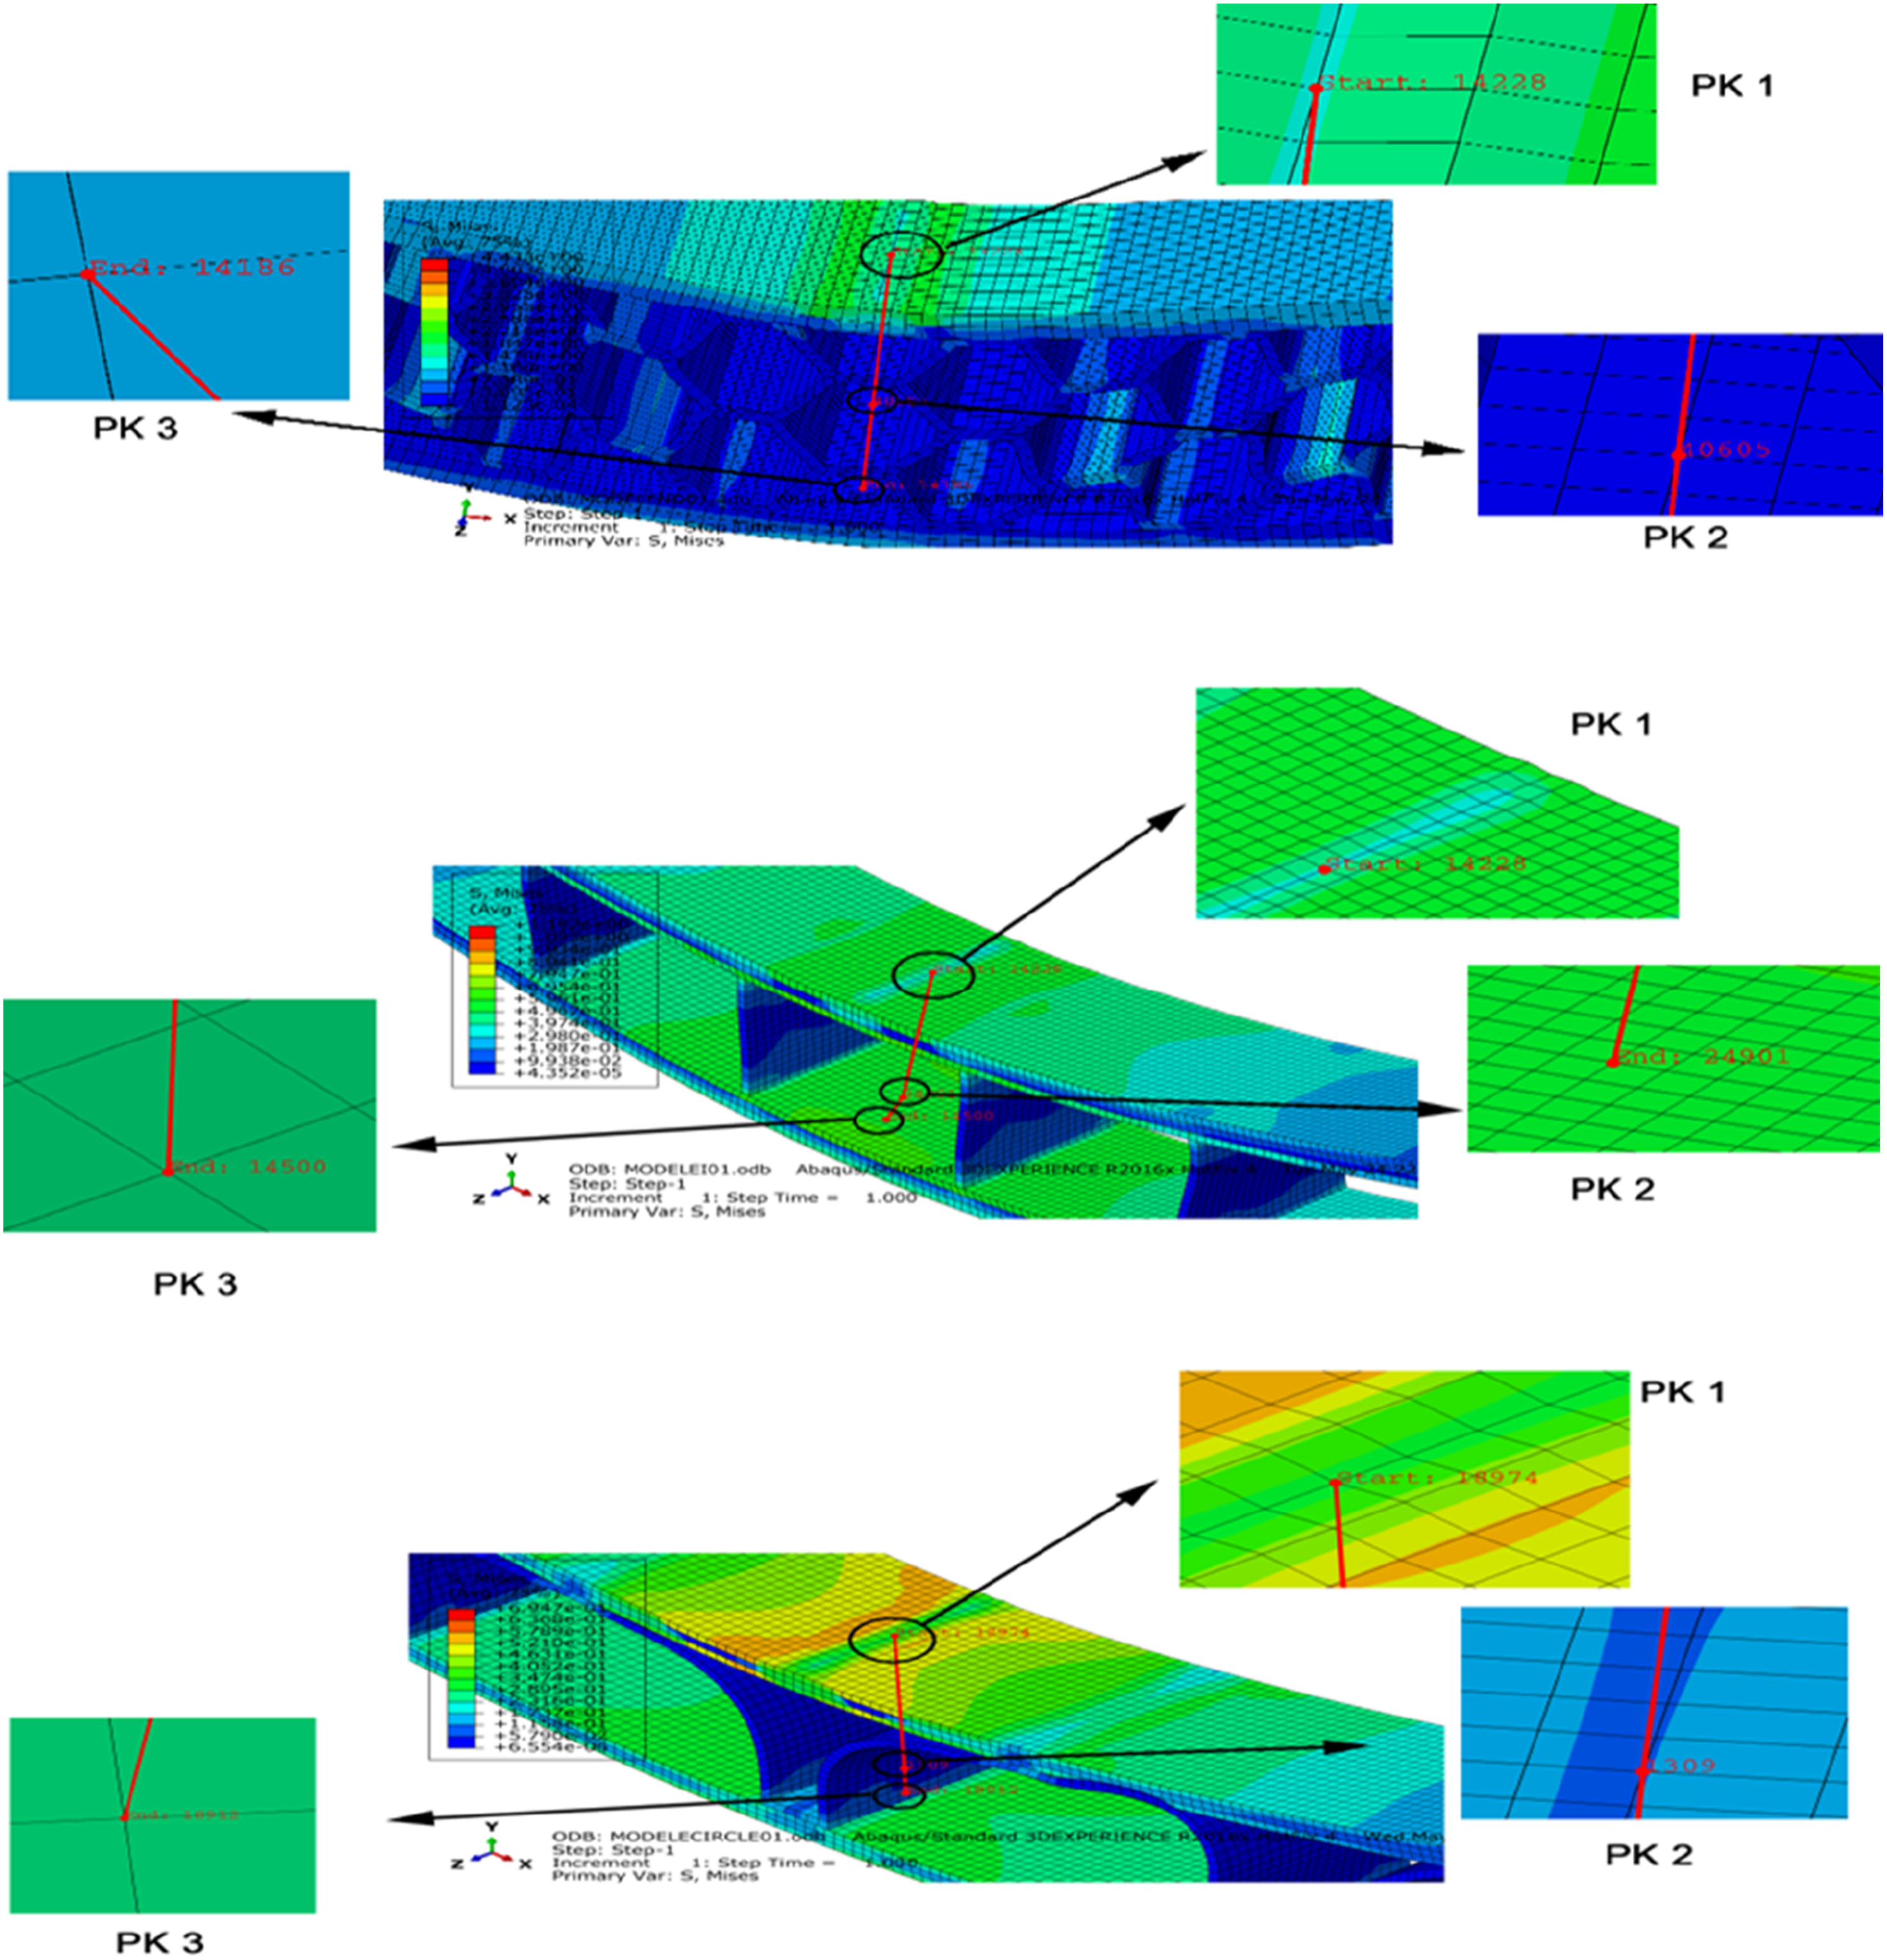
The Von Mises stress evolution of the composite sandwich model under forced displacements (0.1–0.6 mm) exhibits a gradual and nearly linear increase throughout all capture locations (PK1–PK4). The stress at PK1 peaked at approximately 1.35 MPa at δ = 0.6 mm, indicating that this location is the most critical for bending. On the other hand, PK2 had the lowest stress response, with a maximum of only 0.55 MPa at δ = 0.6 mm. This shows that the mechanical demand was lower at this point. The intermediate capture locations, PK3 and PK4, had very similar values, with stresses of roughly 0.90 MPa and 0.85 MPa, respectively, at δ = 0.6 mm. These data show that PK1 is the area where tension builds up the most, while PK2 is less loaded. The stress gradient between PK1 and PK2 shows that bending loads are not evenly spread over the sandwich beam.
This is in line with the three-point flexural behavior, where the highest stress occurs at the supports and the lowest stress occurs in the middle regions, as shown in Figure 10.
The stress–displacement curves in the image indicate that the four prosthetic configurations (PK1–PK4) respond to stress in distinct ways, as shown in Figure 9. PK1 and PK4 have comparatively moderate stresses of around 0.20 MPa and 0.10 MPa, respectively, with a displacement of 0.1 mm. PK2 and PK3, on the other hand, have greater stresses of about 0.25 MPa and 0.20 MPa. The difference between the configurations becomes more evident as the displacement rises. PK3 exhibits the most stress at 0.3 mm, with a value of approximately 0.60 MPa. PK2 comes next, with a pressure of 0.45 MPa, and PK1 and PK4 remain lower, at approximately 0.20 MPa. The trend continues at the highest displacement of 0.6 mm, with PK3 reaching the highest stress of approximately 1.20 MPa, followed by PK2 at 0.80 MPa, and PK1 and PK4 showing similar lower responses of approximately 0.40 MPa and 0.30 MPa, respectively. The steep slope of PK3 indicates that it is the stiffest, while the low stress development of PK4 suggests that it is the most compliant.
There are notable differences between the four prosthetic versions (PK1-PK4) in terms of the stress-displacement response. The maximum stress in PK4, around 0.20 MPa, is caused by the initial displacement of 0.1 mm. However, PK1, PK2, and PK3 are under a negligible amount of stress, less than 0.05 MPa, in contrast. The stress on PK4 increases linearly with increasing displacement, reaching a maximum of 1.30 MPa at 0.6 mm and a minimum of 0.60 MPa at 0.3 mm. However, there are relatively small increases in PK1, PK2, and PK3, and the stress levels remain below 0.10 MPa even at the maximum displacement. Compared to the other three types, PK4 is the most robust and has the highest load-bearing capacity. Conversely, the other three designs exhibit significantly lower stress buildup, indicating greater flexibility and reduced resistance to deformation as shown in Figure 11. The evolution of stress (a) NIDA, (b) I, (c) Half Arch.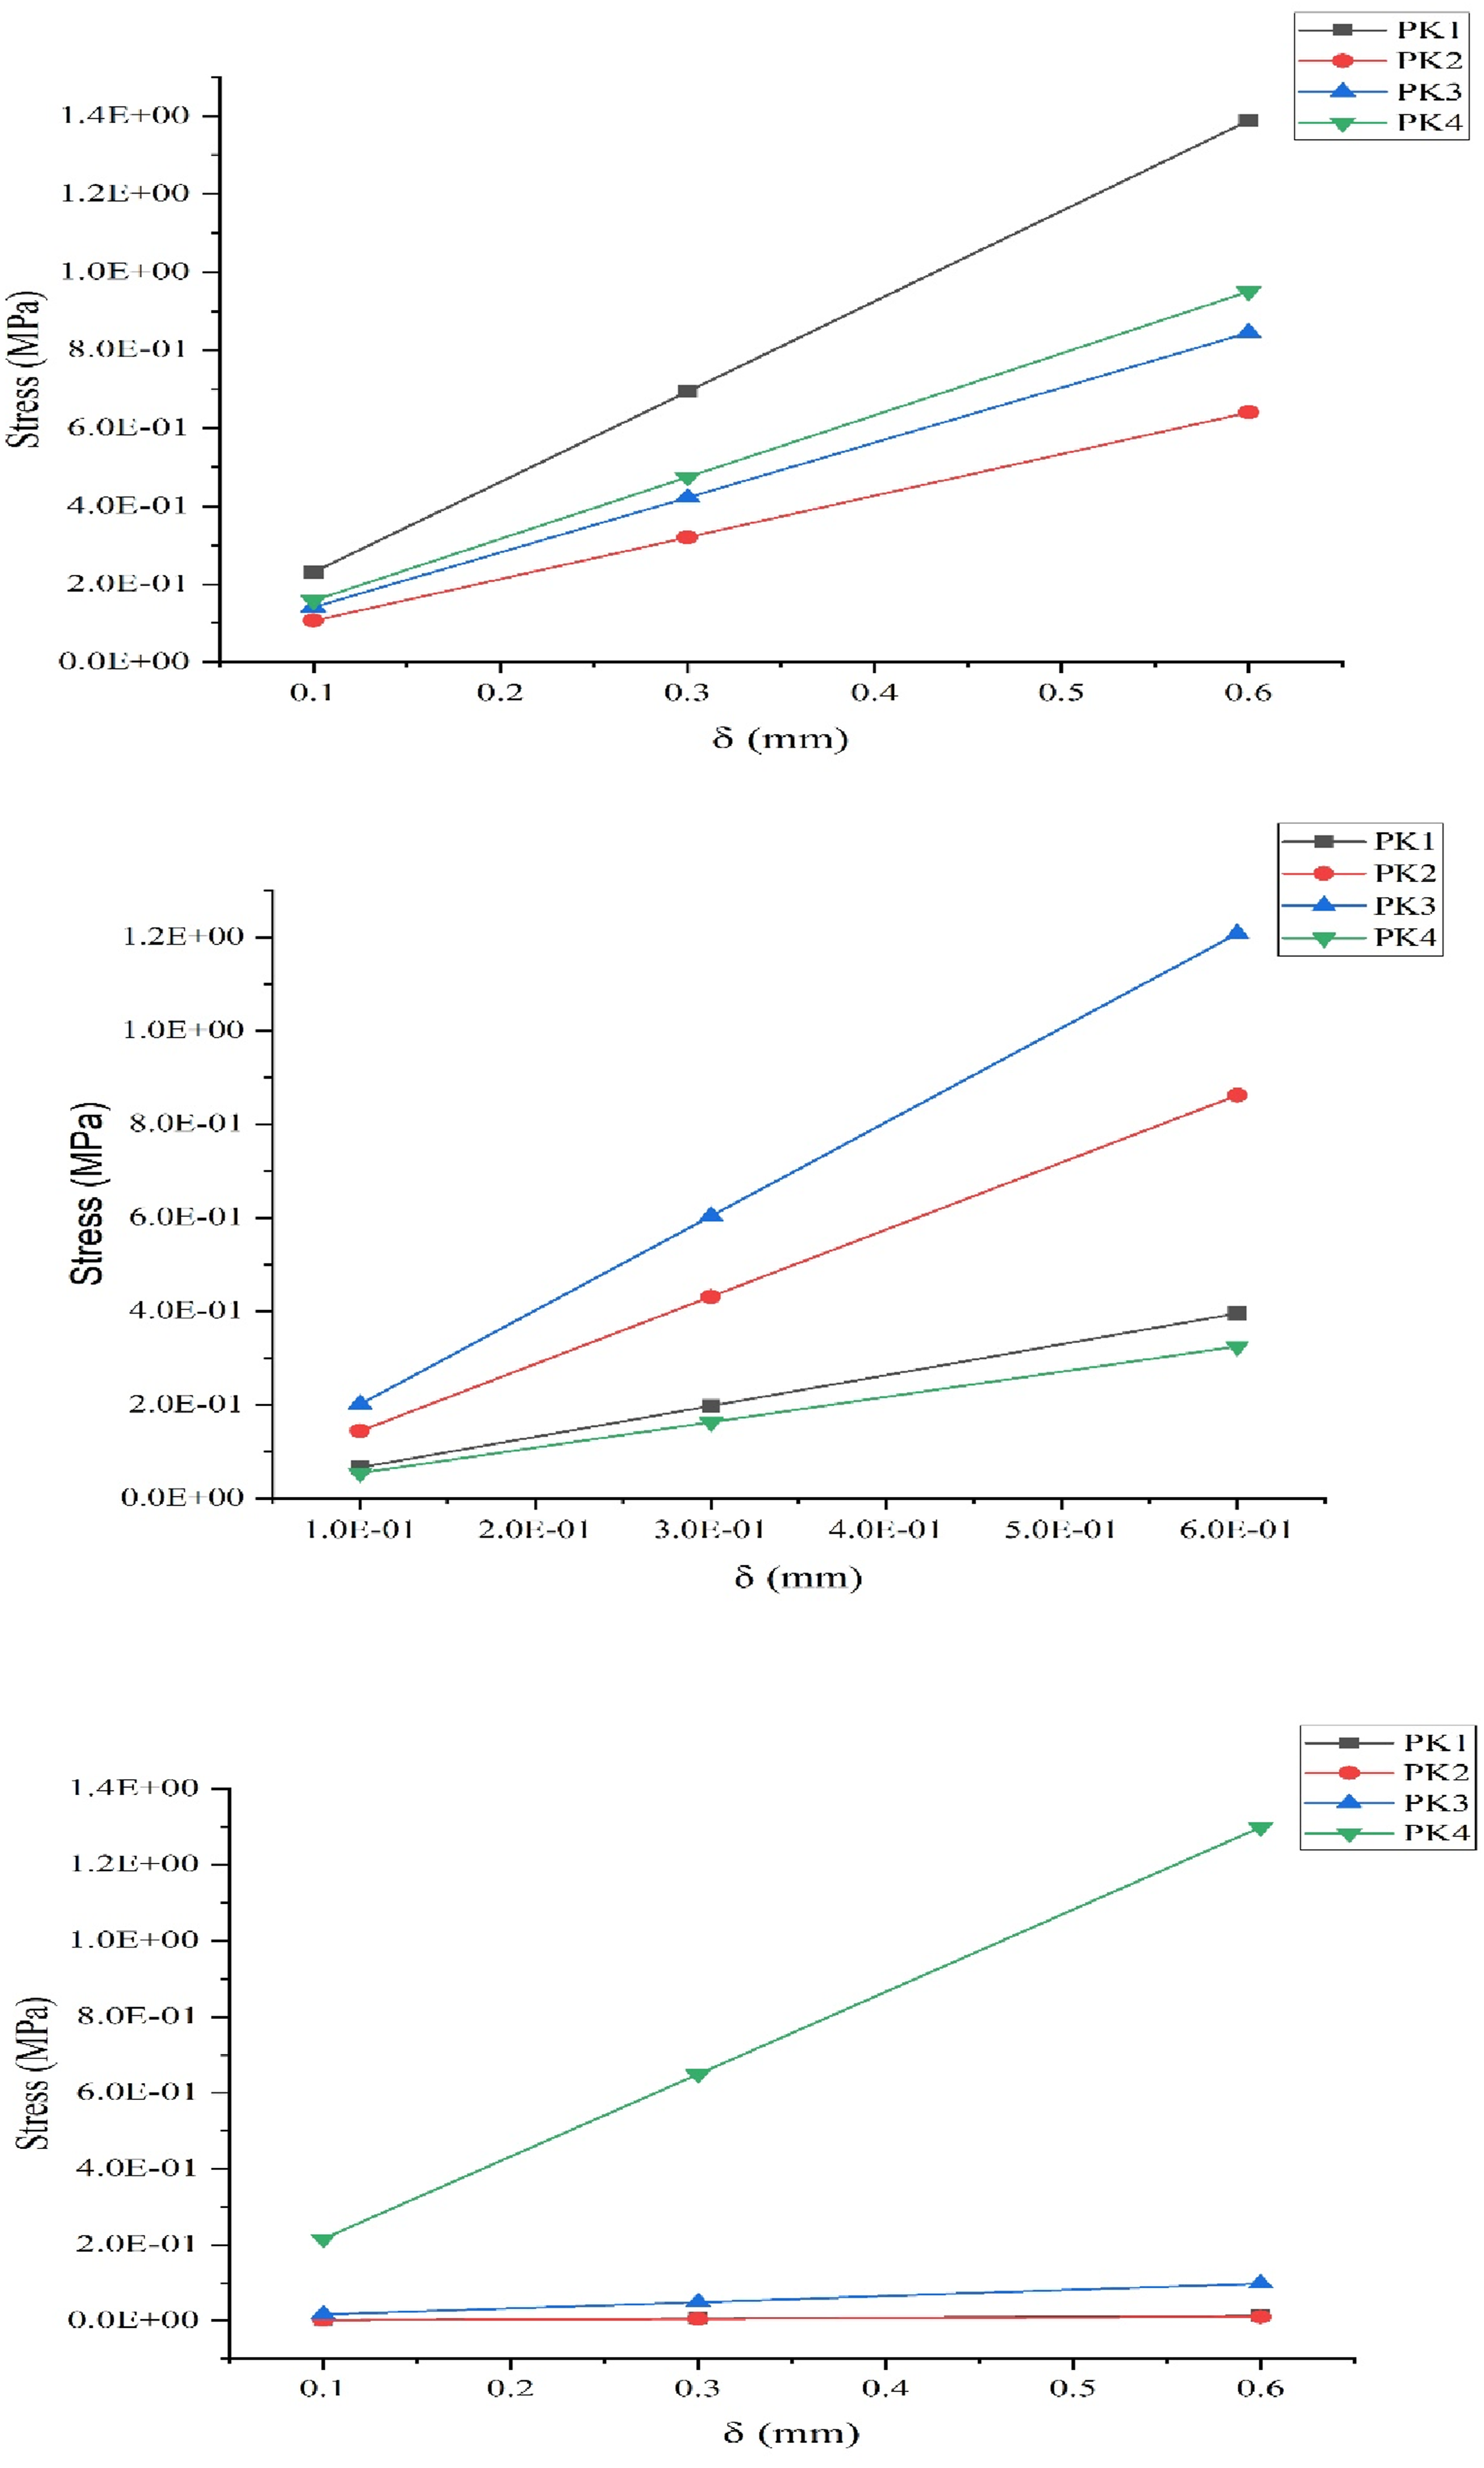
The findings show a clear linear connection between the applied displacement (δ) and the measured response (Uy) Displaying Figure 12. This is what you would expect from elastic deformation behavior in mechanical systems. The curves for all four samples (PK1–PK4) are relatively close to each other, indicating that the mechanical reaction is repeatable and consistent. When the displacement is modest, about 0.1 mm, the Uy values stay low (≈0.1 mm). When the displacement is larger, approximately 0.6 mm, the Uy values increase in proportion to the displacement, up to a value of approximately 0.6 mm. This proportionality means that the system maintains the same stiffness throughout the evaluated range, with only minor differences across different specimens. The curves being so close together also indicate that the material or structural element being studied behaves consistently, with minimal variation between trials. This type of linear elastic behavior is helpful in situations where you need to know how an object will deform when a weight is applied. It also indicates that there is no significant plastic deformation or non-linear effects within the studied displacement range. The evolution of displacements (a) NIDA, (b) I, (c) Half Arch.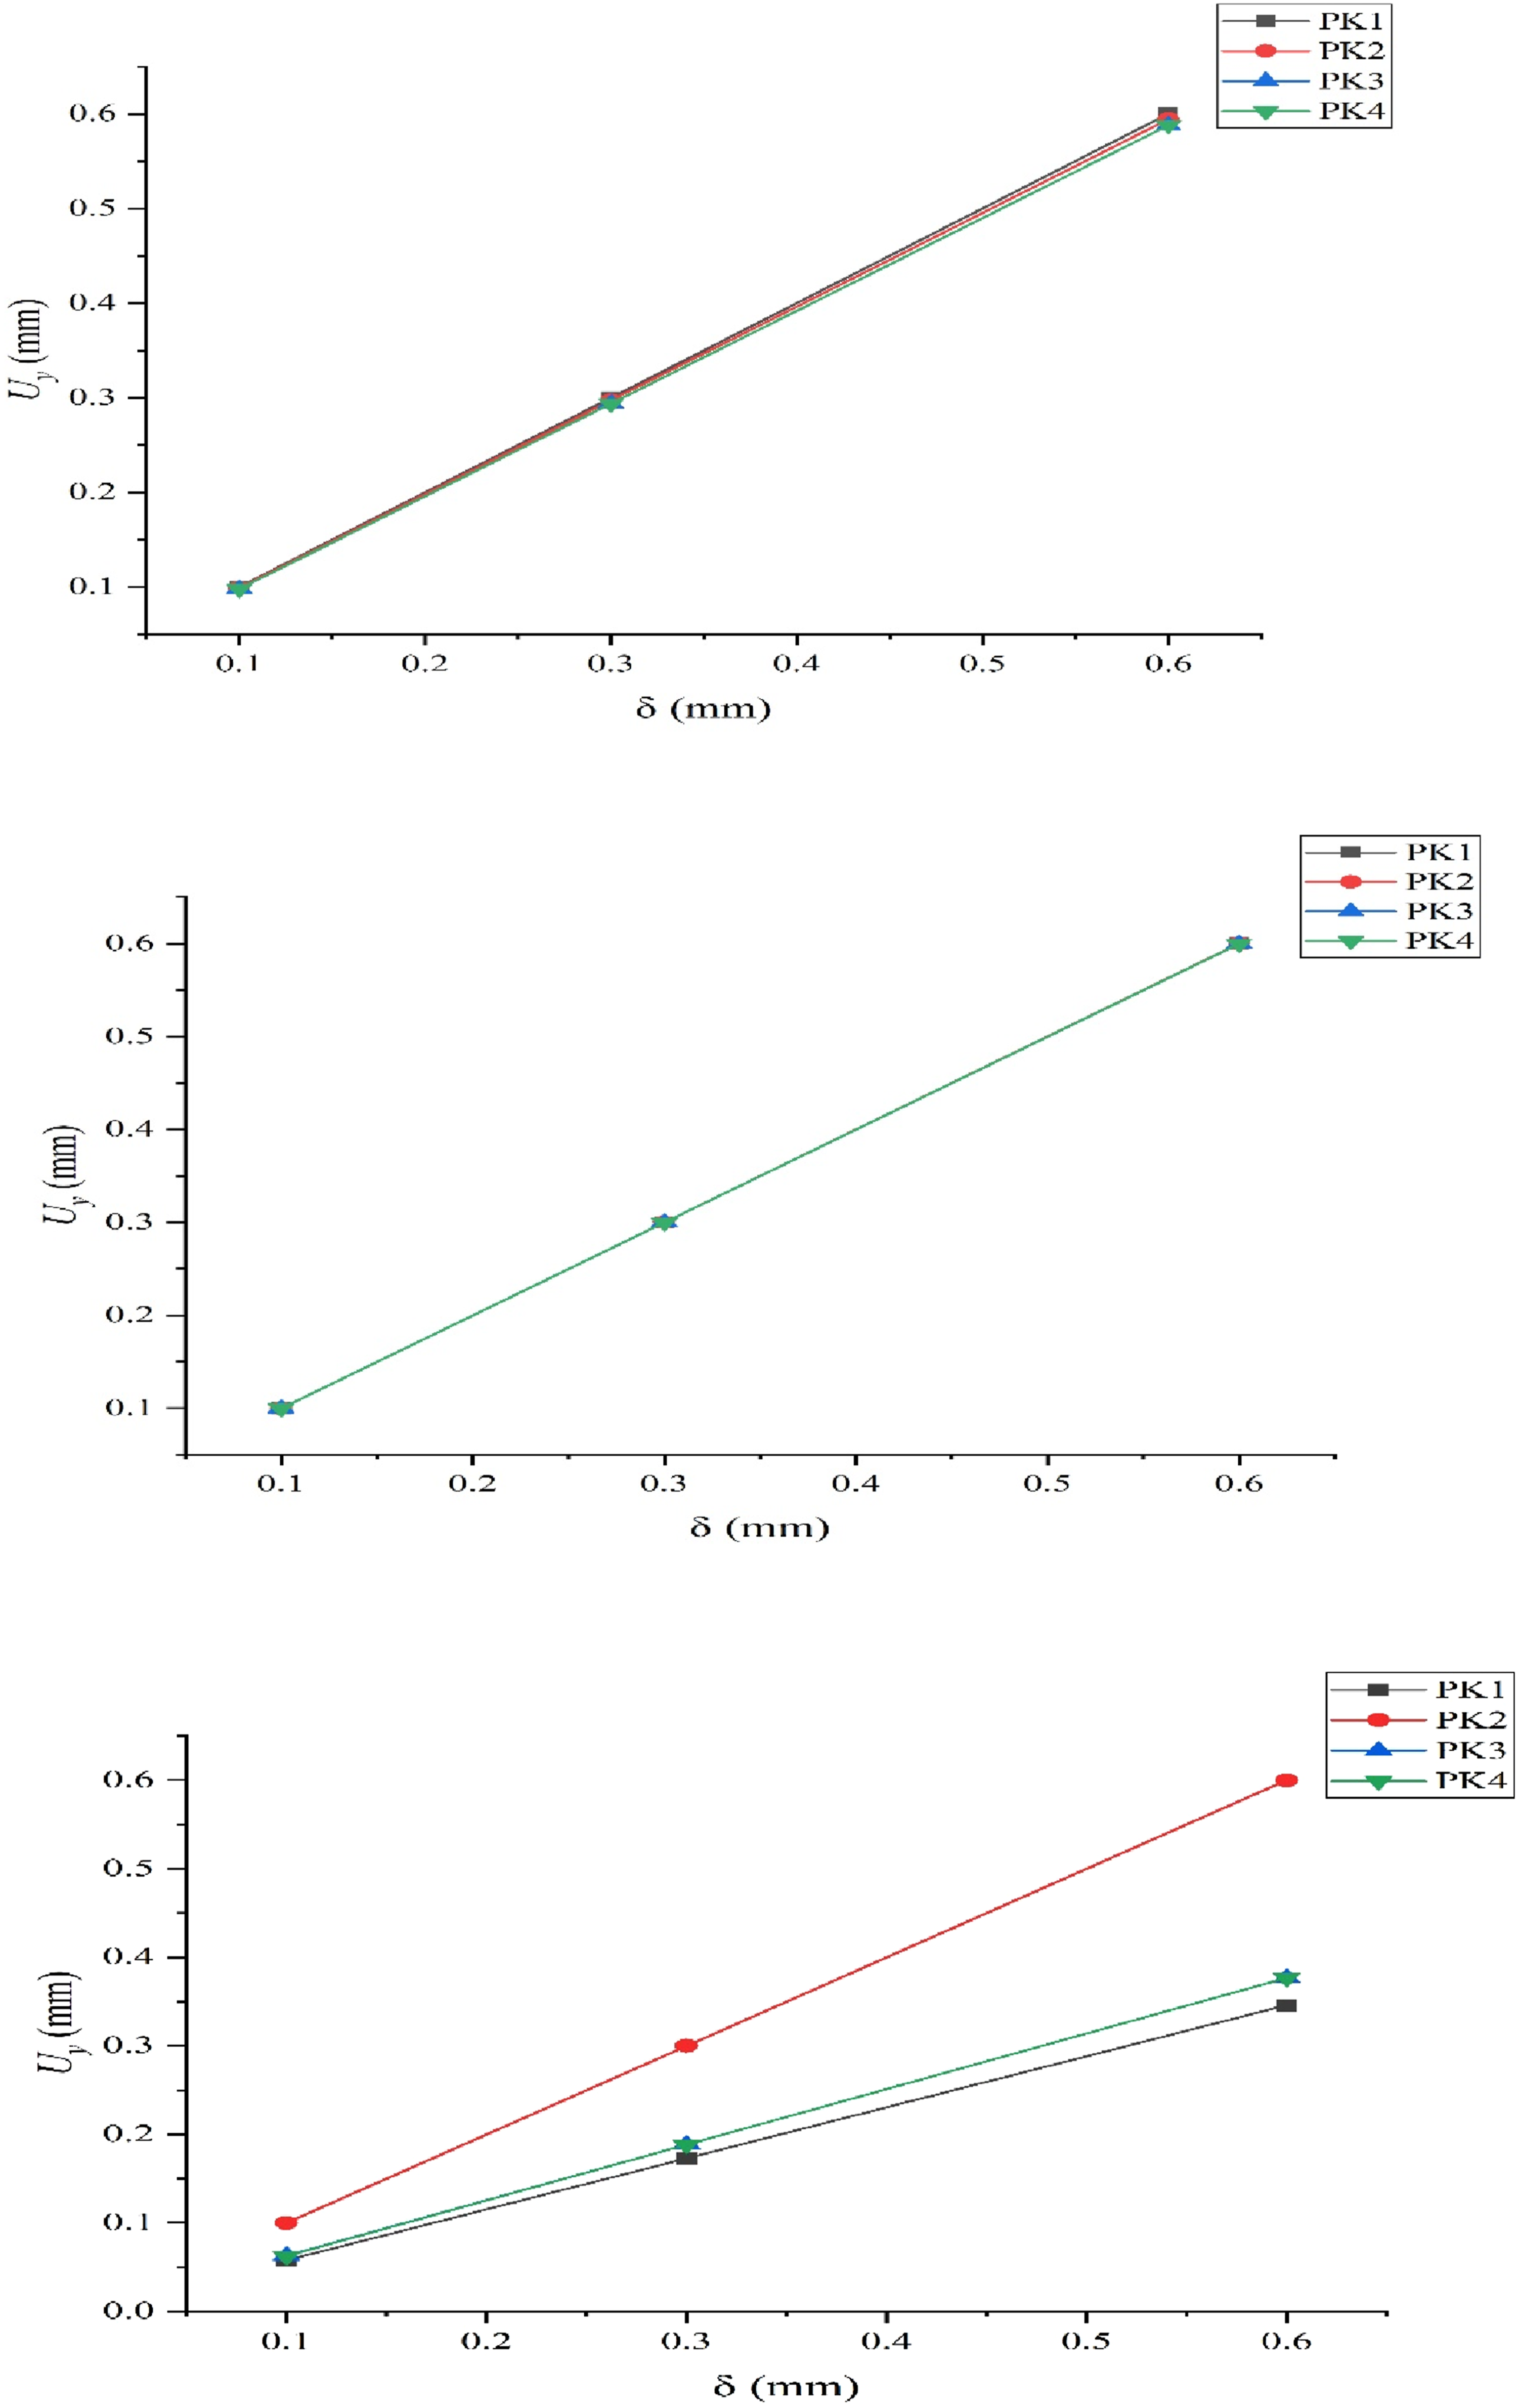
There is a straight line between displacement (δ) and observed response (Uy) for all four specimens (PK1-PK4) in the graph. The Uy is also 0.1 mm when the displacement is 0.1 mm. The Uy is also 0.3 mm when the displacement is 0.3 mm. Finally, when δ is around 0.6 mm, Uy goes up by about the same amount (0.6). The perfect one-to-one connection (slope ≈1) shows that the mechanical system is elastic and that the observed range does not deviate much from linearity. The fact that the curves for PK1, PK2, PK3, and PK4 all match shows that the reaction is the same and may be repeated in various samples. This means that the test circumstances are stable and the material qualities are the same. The slope (ΔUy/Δδ ≈ 1) indicates that the system’s stiffness remains constant, suggesting no plastic deformation or nonlinear effects are present. This mechanical feature is helpful for precise applications when you need to know how much it will stretch when a load is applied.
The results show that the combined behavior of PK1, PK2, PK3, and PK4 is significantly different from the behavior of each one acting alone, as illustrated in Figure 9. PK2 had a Uy value of 0.10 mm; however, PK1/PK3/PK4 had Uy values of 0.05 mm. PK1, PK3, and PK4 have a Uy of around 0.30 mm in the range of 0.18 to 0.20 mm, whereas PK2 has a δ of about 0.3 mm. When PK2 travels the most, which is around 0.6 mm, Uy = 0.60 mm. PK1, PK3, and PK4 are just around 0.34 to 0.36 mm long, but this one is substantially larger.
These differences indicate that the samples exhibit varying levels of stiffness. The slope (ΔUy/Δδ), which is the opposite of stiffness, shows compliance. PK2 is substantially more flexible and bends more readily with the same amount of power since it has a slope of around 1.0. The PK1, PK3, and PK4 slopes are stiffer and less likely to bend, with a measurement of around 0.55–0.60. The significant difference between PK2 and the other three samples may have caused changes to the material’s properties, structural integrity, or the experimental conditions.
Although there was much diversity in compliance, the results show that all the samples behave in a linear elastic manner. PK2, PK1, PK3, and PK4 are the four that are the least flexible. These kinds of changes are essential in mechanical design because they affect the amount of weight a structure can withstand, the amount of energy it can absorb, and its lifespan.
Figure 13 presents the strain responses of PK1-PK4 to increasing displacement, showing that the materials deform in various ways. The PK1 strain continuously increases from 2.0 × 10⁻⁵ at δ = 0.1 mm to about 8.0 × 10⁻⁵ at δ = 0.6 mm. PK4 exhibits the highest strain growth, ranging from 2.5 × 10⁻⁵ at δ = 0.1 mm to over 1.5 × 10⁻⁴ at δ ≈ 0.6 mm. This allows it to distort considerably more readily. PK2 and PK3 exhibit much lower strain responses. The highest strain values remain almost constant over the displacement range, with values below approximately 2.0 × 10⁻⁵ at δ = 0.6 mm. The evolution of strain (a) NIDA, (b) I, (c) Half arch.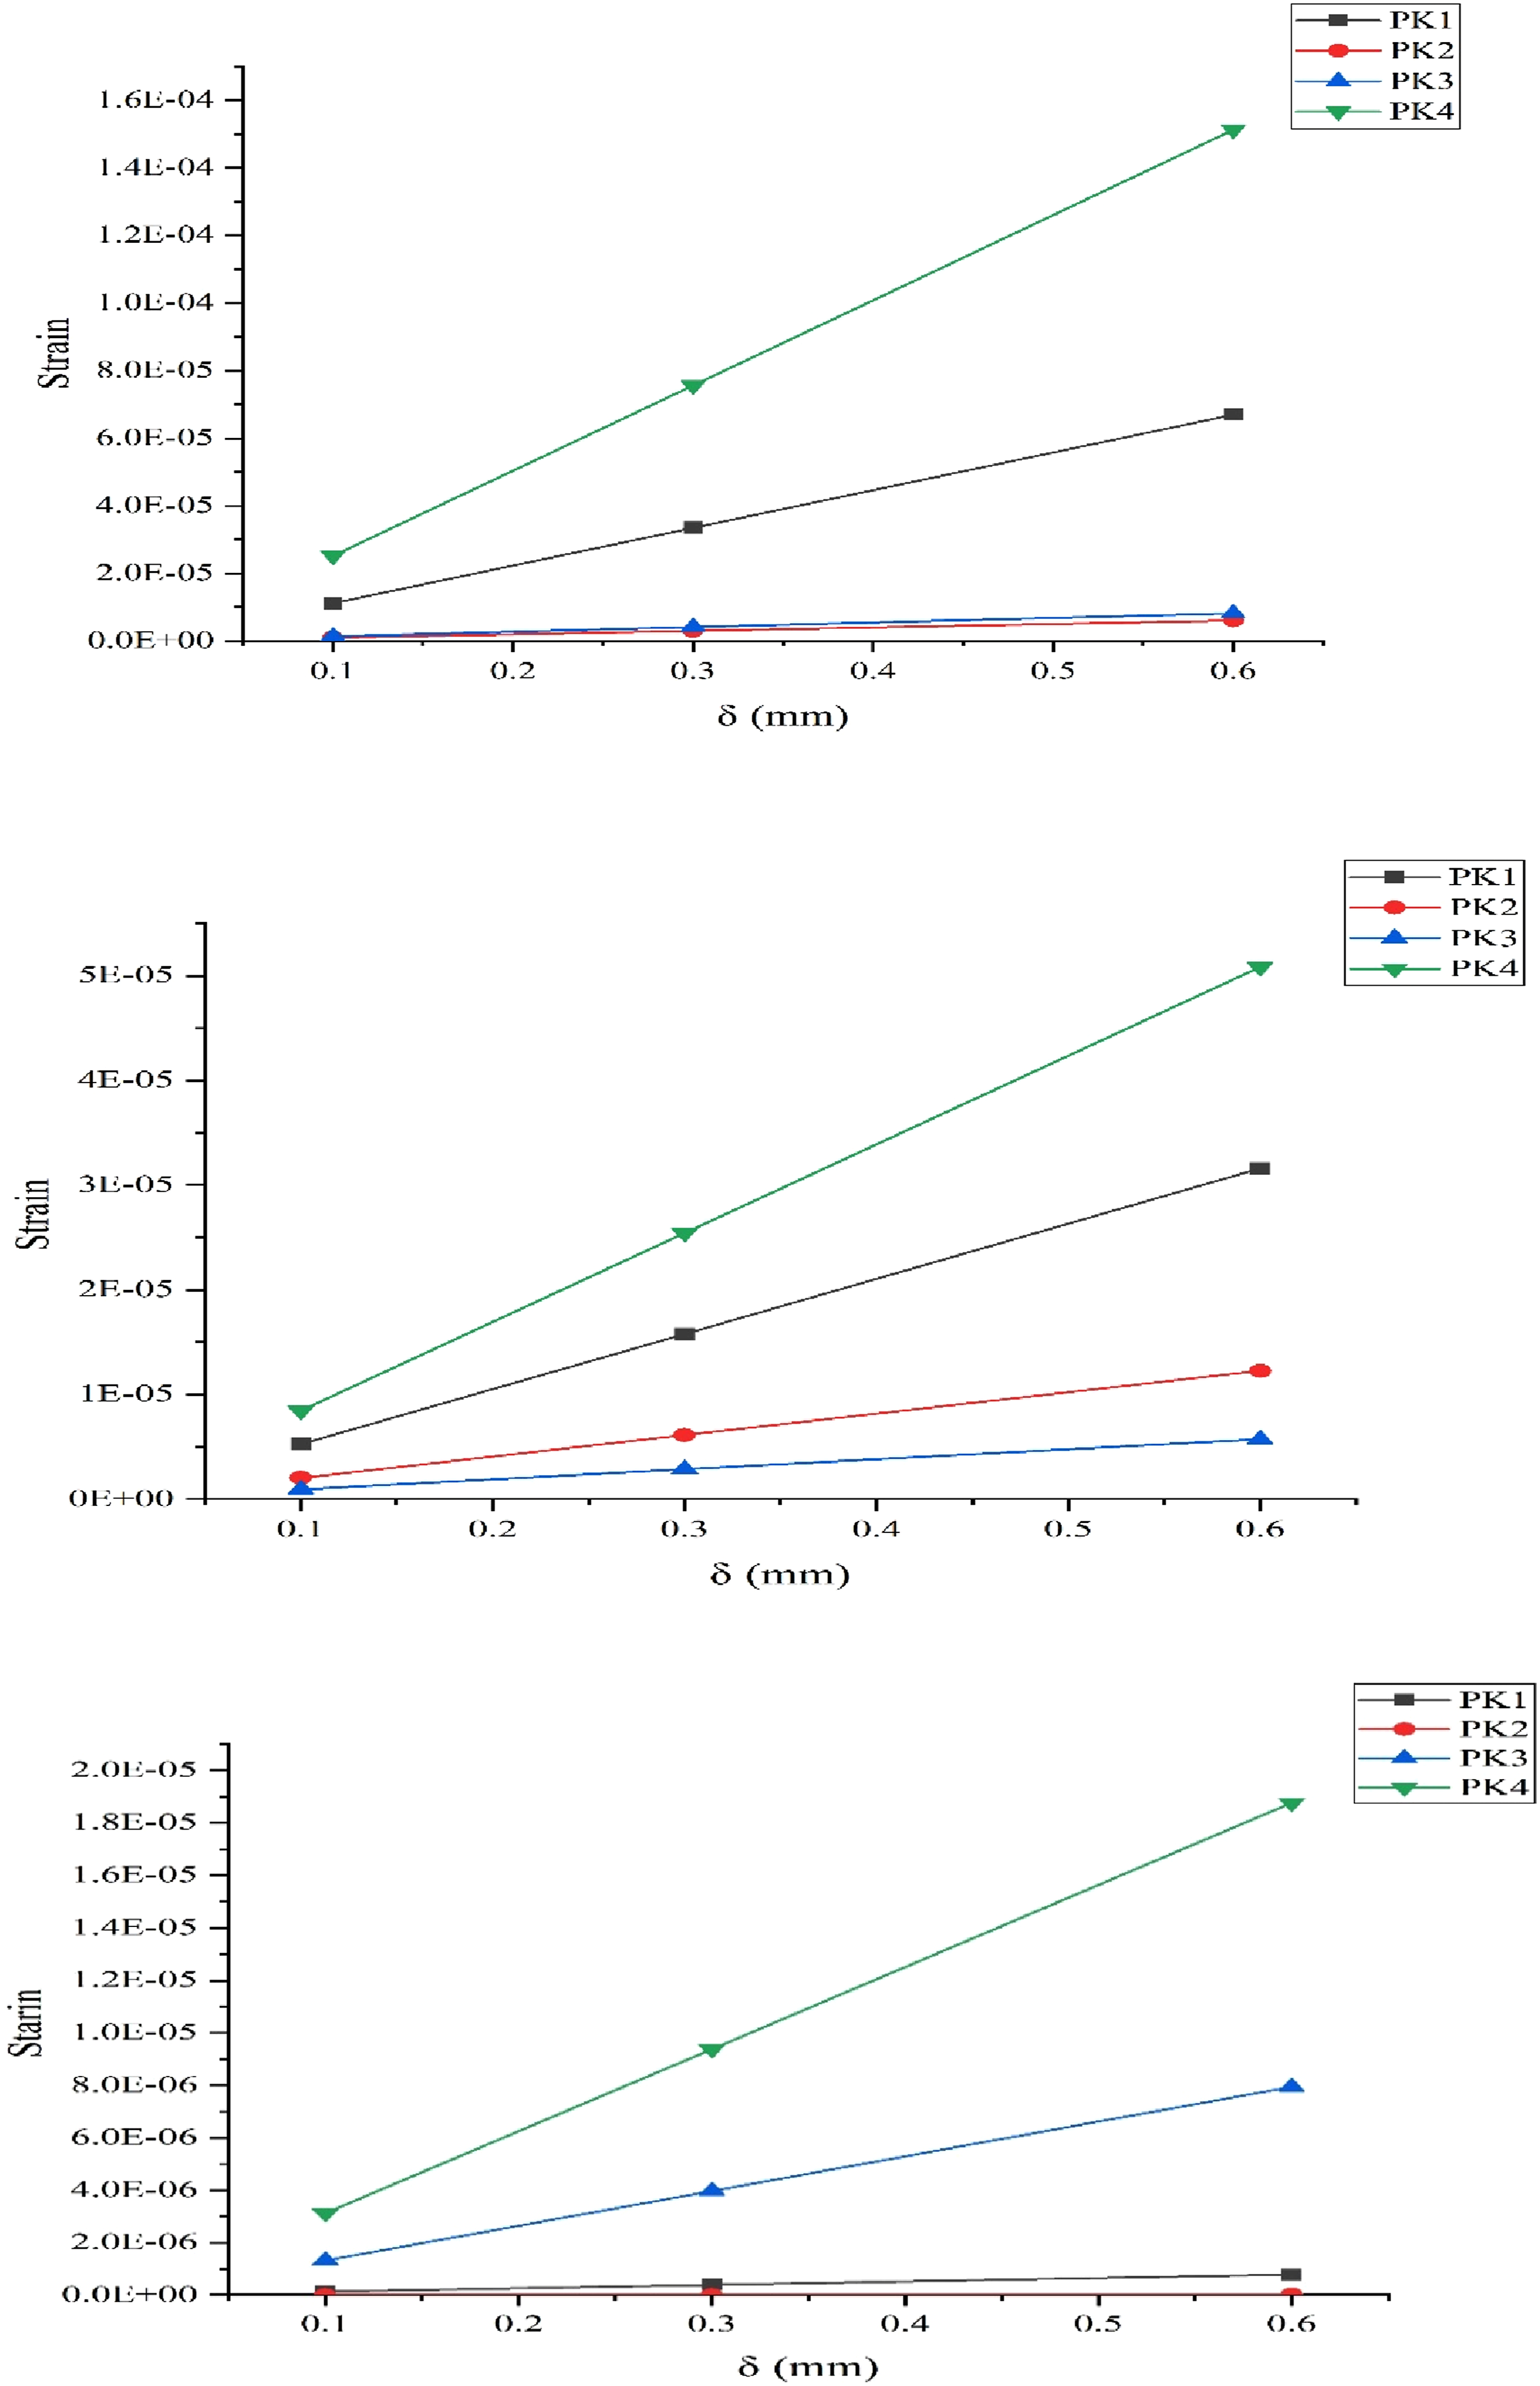
The slope change (Δstrain/Δδ) indicates compliance differences between specimens. PK4 has the highest compliance, followed by PK1. PK2 and PK3, on the other hand, are much stiffer and exhibit no strain increase when the same displacement is applied. This suggests that PK4 may have a weaker structure, a lower modulus, or faults that allow more strain to accumulate. In contrast, PK2 and PK3 remain rigid and exhibit virtually elastic stiffness with slight deformation.
In general, strain-displacement statistics indicate a significant amount of variance across specimens. The most flexible is PK4, followed by PK1, and the least flexible is PK2-PK3. From a design standpoint, this heterogeneity may influence how loads are distributed, how components fail, and their overall dependability. This implies that PK4 may not be the ideal option for applications requiring high stiffness, but it may be helpful for energy absorption or dampening. The strain–displacement curves show differences in the mechanical response of PK1–PK4. In comparison to PK1 (8.0 × 10⁻⁶), PK2 (3.0 × 10⁻⁶), and PK3 (1.0 × 10⁻⁶), PK4 exhibits the largest strain at δ = 0.1 mm (1.0 × 10⁻⁵). Once more, PK4 exhibits the largest strain at δ = 0.6 mm (about 5.0 × 10⁻⁵), followed by PK1 (roughly 3.0 × 10⁻⁵), PK2 (almost 1.2 × 10⁻⁵), and PK3 (roughly 5.0 × 10⁻⁶).
The linear trend in all instances indicates that the material is elastic over the evaluated range of displacements, with no signs of plastic deformation. The slopes (Δstrain/Δδ) are quite different, however. PK4 has the greatest strain rate (≈8.3 × 10⁻⁵ mm−1), followed by PK1 (≈5.0 × 10⁻⁵ mm−1), PK2 (≈2.0 × 10⁻⁵ mm−1), and PK3 (≈8.3 × 10⁻⁶ mm−1). These discrepancies show that compliance varies, with PK4 being the most compliant (least stiff) and PK3 being the stiffest.
From a mechanical point of view, PK4 would bend more readily when loads are applied, which makes it less effective for high-stiffness applications but may be suitable for absorbing energy or damping. On the other hand, PK3 would be more suitable in situations where rigidity and dimensional stability are crucial, as it does not respond significantly to strain. PK1 and PK2 exhibit characteristics that fall between stiff and flexible.
The strain-displacement curves for PK1–PK4 show that the materials deform in quite different ways as the displacement increases. PK4 exhibited the steepest response, with strain increasing from roughly 3.5 × 10⁻⁶ at δ = 0.1 mm to over 1.8 × 10⁻⁵ at δ ≈ 0.6 mm. This means that it is the most flexible of the samples. PK3 comes next, with a slight rise that brings it to approximately 8.0 × 10⁻⁶ at δ = 0.6 mm. PK1 and PK2, on the other hand, stay almost flat over the whole range of displacements, with maximum stresses below ≈1.0 × 10⁻⁶. This means that they are pretty stiff and do not change shape much. The slope (Δstrain/Δδ) shows how compliant something is. PK4 has the biggest slope (∼3.0 × 10⁻⁵ mm−1), followed by PK3 (∼1.3 × 10⁻⁵ mm−1). PK1 and PK2 have values that are very close to zero. This indicates that PK3 and PK4 undergo significant shape changes when loaded, whereas PK1 and PK2 remain relatively rigid. These findings indicate that the specimens exhibit significant differences in their mechanical properties. PK1 and PK2 may have a greater modulus or structural reinforcement, making them suitable for situations where stiffness is crucial. PK4, on the other hand, may be more effective in situations where compliance or energy absorption is required, as it exhibits a strong strain response. PK3 has a medium level of behavior, exhibiting a balance between stiffness and flexibility.
The shear stress–displacement graph clearly illustrates the differences among the four prosthetic variants (PK1–PK4). At a displacement of 0.1 mm, PK1 exhibits the maximum stress, around 0.04 MPa.PK2, PK3, and PK4 maintain a pressure of around 0.01 MPa. The stress response is relatively steady up to 0.3 mm, particularly for PK1, which maintains a consistent level without variation. Beyond this juncture, a significant disparity emerges: PK1 exhibits peak stress at 0.6 mm, around 0.22 MPa. PK3 has the maximum stress at 0.10 MPa, followed by PK2 at 0.05 MPa, while PK4 displays the lowest stress at 0.02 MPa. The findings indicate that PK1 exhibits the highest rigidity and is the least prone to deformation, whereas PK4 demonstrates the best flexibility. PK3 has a central response, indicating it possesses both rigidity and flexibility.
The graph demonstrates how four material models—PK1, PK2, PK3, and PK4—respond to stress (in MPa) and displacement (in mm). PK1 behaves quite differently from the other three. As the displacement in PK1 increases, the tension rises significantly, reaching nearly 0.12 MPa at a displacement of 0.55 mm. This indicates that the material is stiff and exhibits a distinctive elastic response, as it builds up tension to resist deformation. On the other hand, the stress-displacement curves for PK2, PK3, and PK4 are almost flat. The stress levels remain close to zero or slightly negative throughout all the displacements. This indicates that these materials bend easily, which means they are either incredibly flexible or very stiff. The way PK3 acts, maintaining tension at a practically constant level, may be due to its viscoelastic characteristics or yielding. The overlapping patterns of PK2 and PK4, on the other hand, imply that the materials or boundary conditions are comparable. The graph shows that PK1 is quite different from the other models. This illustrates the importance of material qualities in determining their performance under stress.
The graph shows how the same four material models—PK1, PK2, PK3, and PK4—respond to stress and displacement. There are some clear changes in how they respond to stress compared to the previous figure. PK3 exhibits the highest stress values in this situation, and the stress increases rapidly as the displacement rises, reaching approximately 0.035 MPa at a displacement of 0.55 mm. This means that PK3 is the stiffest of the four, indicating that it is a material that does not change shape easily when subjected to load. PK4 comes next, showing a linear rise in stress that is less steep but still obvious. This means that it is comparable but slightly less stiff. PK1 once again displays a slight increase in stress with displacement, although the stress levels remain lower than those of PK3 and PK4. This means that PK1 is less stiff in this situation or with different settings than it was in the last graph. PK2, on the other hand, still exhibits very little stress growth over the entire displacement spectrum, with values that remain near zero. This means that PK2 is a material that is very flexible or may even become softer as it is deformed, as seen in Figure 14. The evolution of shear stress (a) NIDA, (b) I, (c) Half Arch.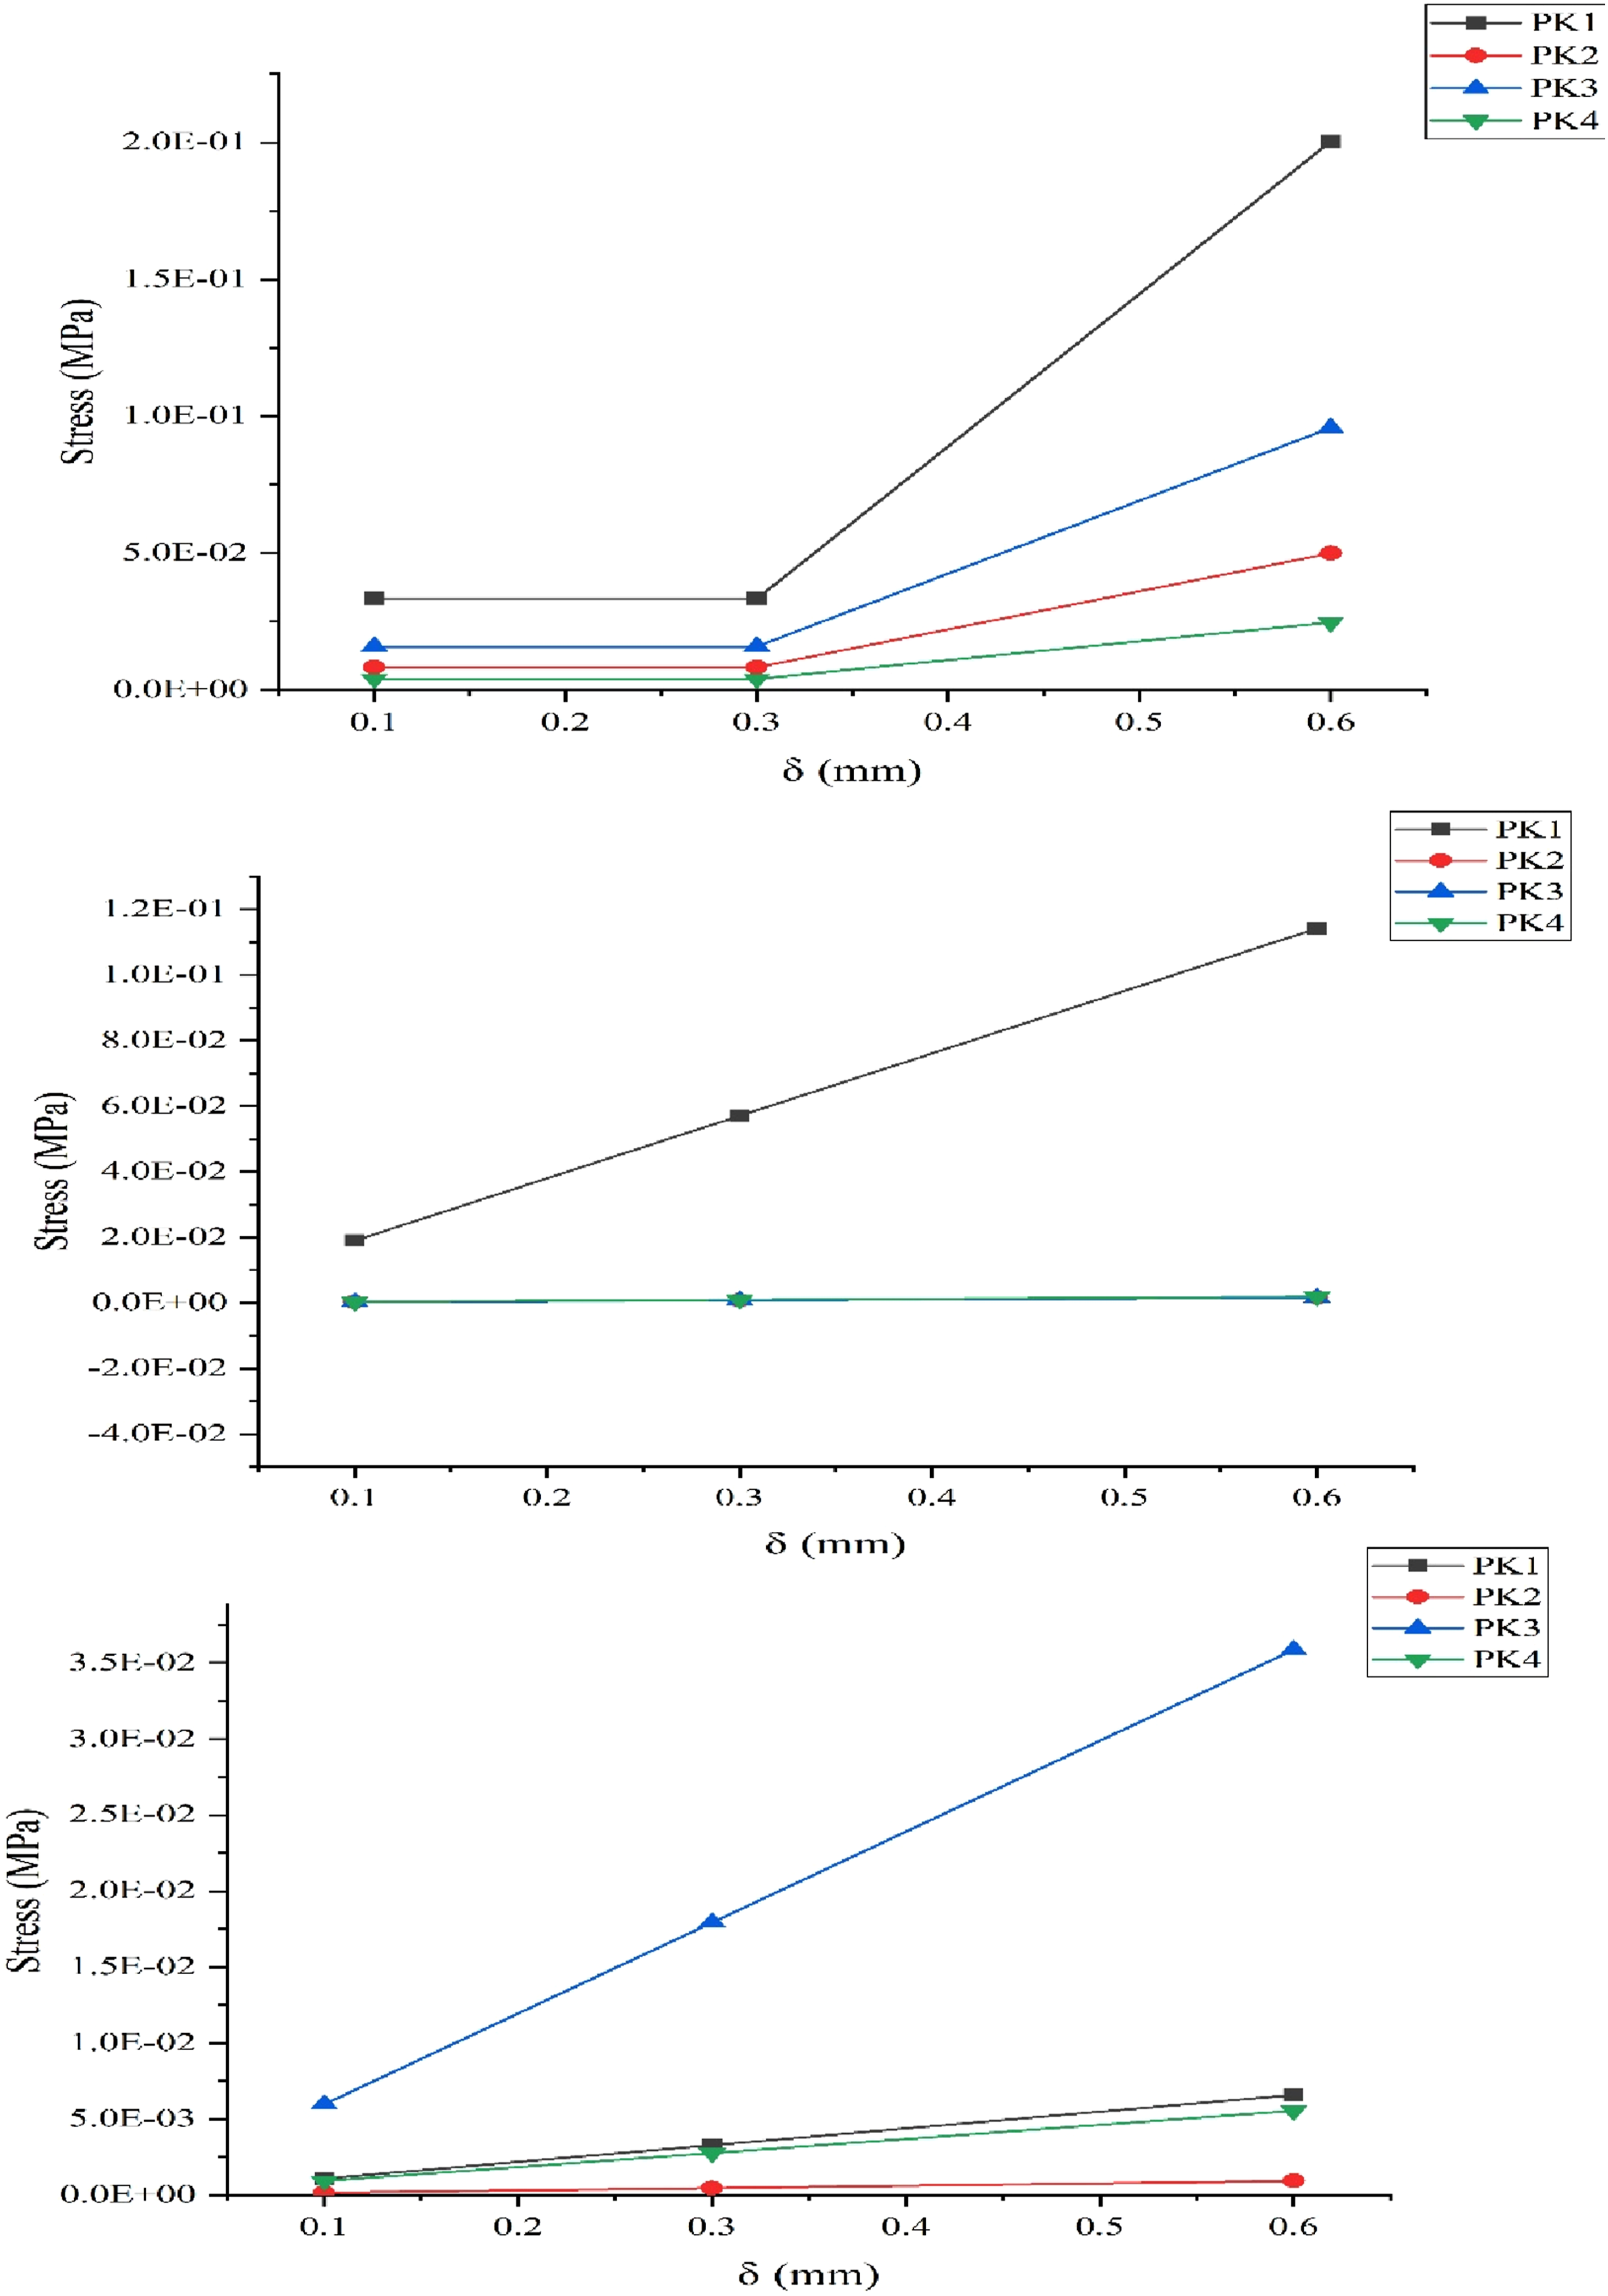
The histogram of maximum Von Mises stress reveals that the three sandwich shapes exhibit significantly different mechanical behavior, as shown in Figure 15(a). Model NIDA has the highest stress concentration, accounting for generously 70% of the total stress distribution. This high value means that the NIDA design is more likely to deform or fail in a specific area when under load, as excessive stress concentration typically accelerates material fatigue and reduces structural reliability. In comparison, Model I has the lowest stress value, which accounts for approximately 11% of the total. This means that the load is spread out more evenly and the structure can better handle outside pressures without creating critical stress areas. This makes it the best mechanical layout. The model half-arch is positioned in the middle, accounting for somewhat 19% of the total tension. It works better than Model NIDA, but it does not lower stress as much as Model I does. The analysis shows that Model I is the most effective at managing stress, followed by the Half-Arch. Model NIDA, on the other hand, is mechanically weak due to its higher stress concentration. Mechanical behaviors comparisons. (a) Stress, (b) Displacement, (c) Strain, (d) Shear stress.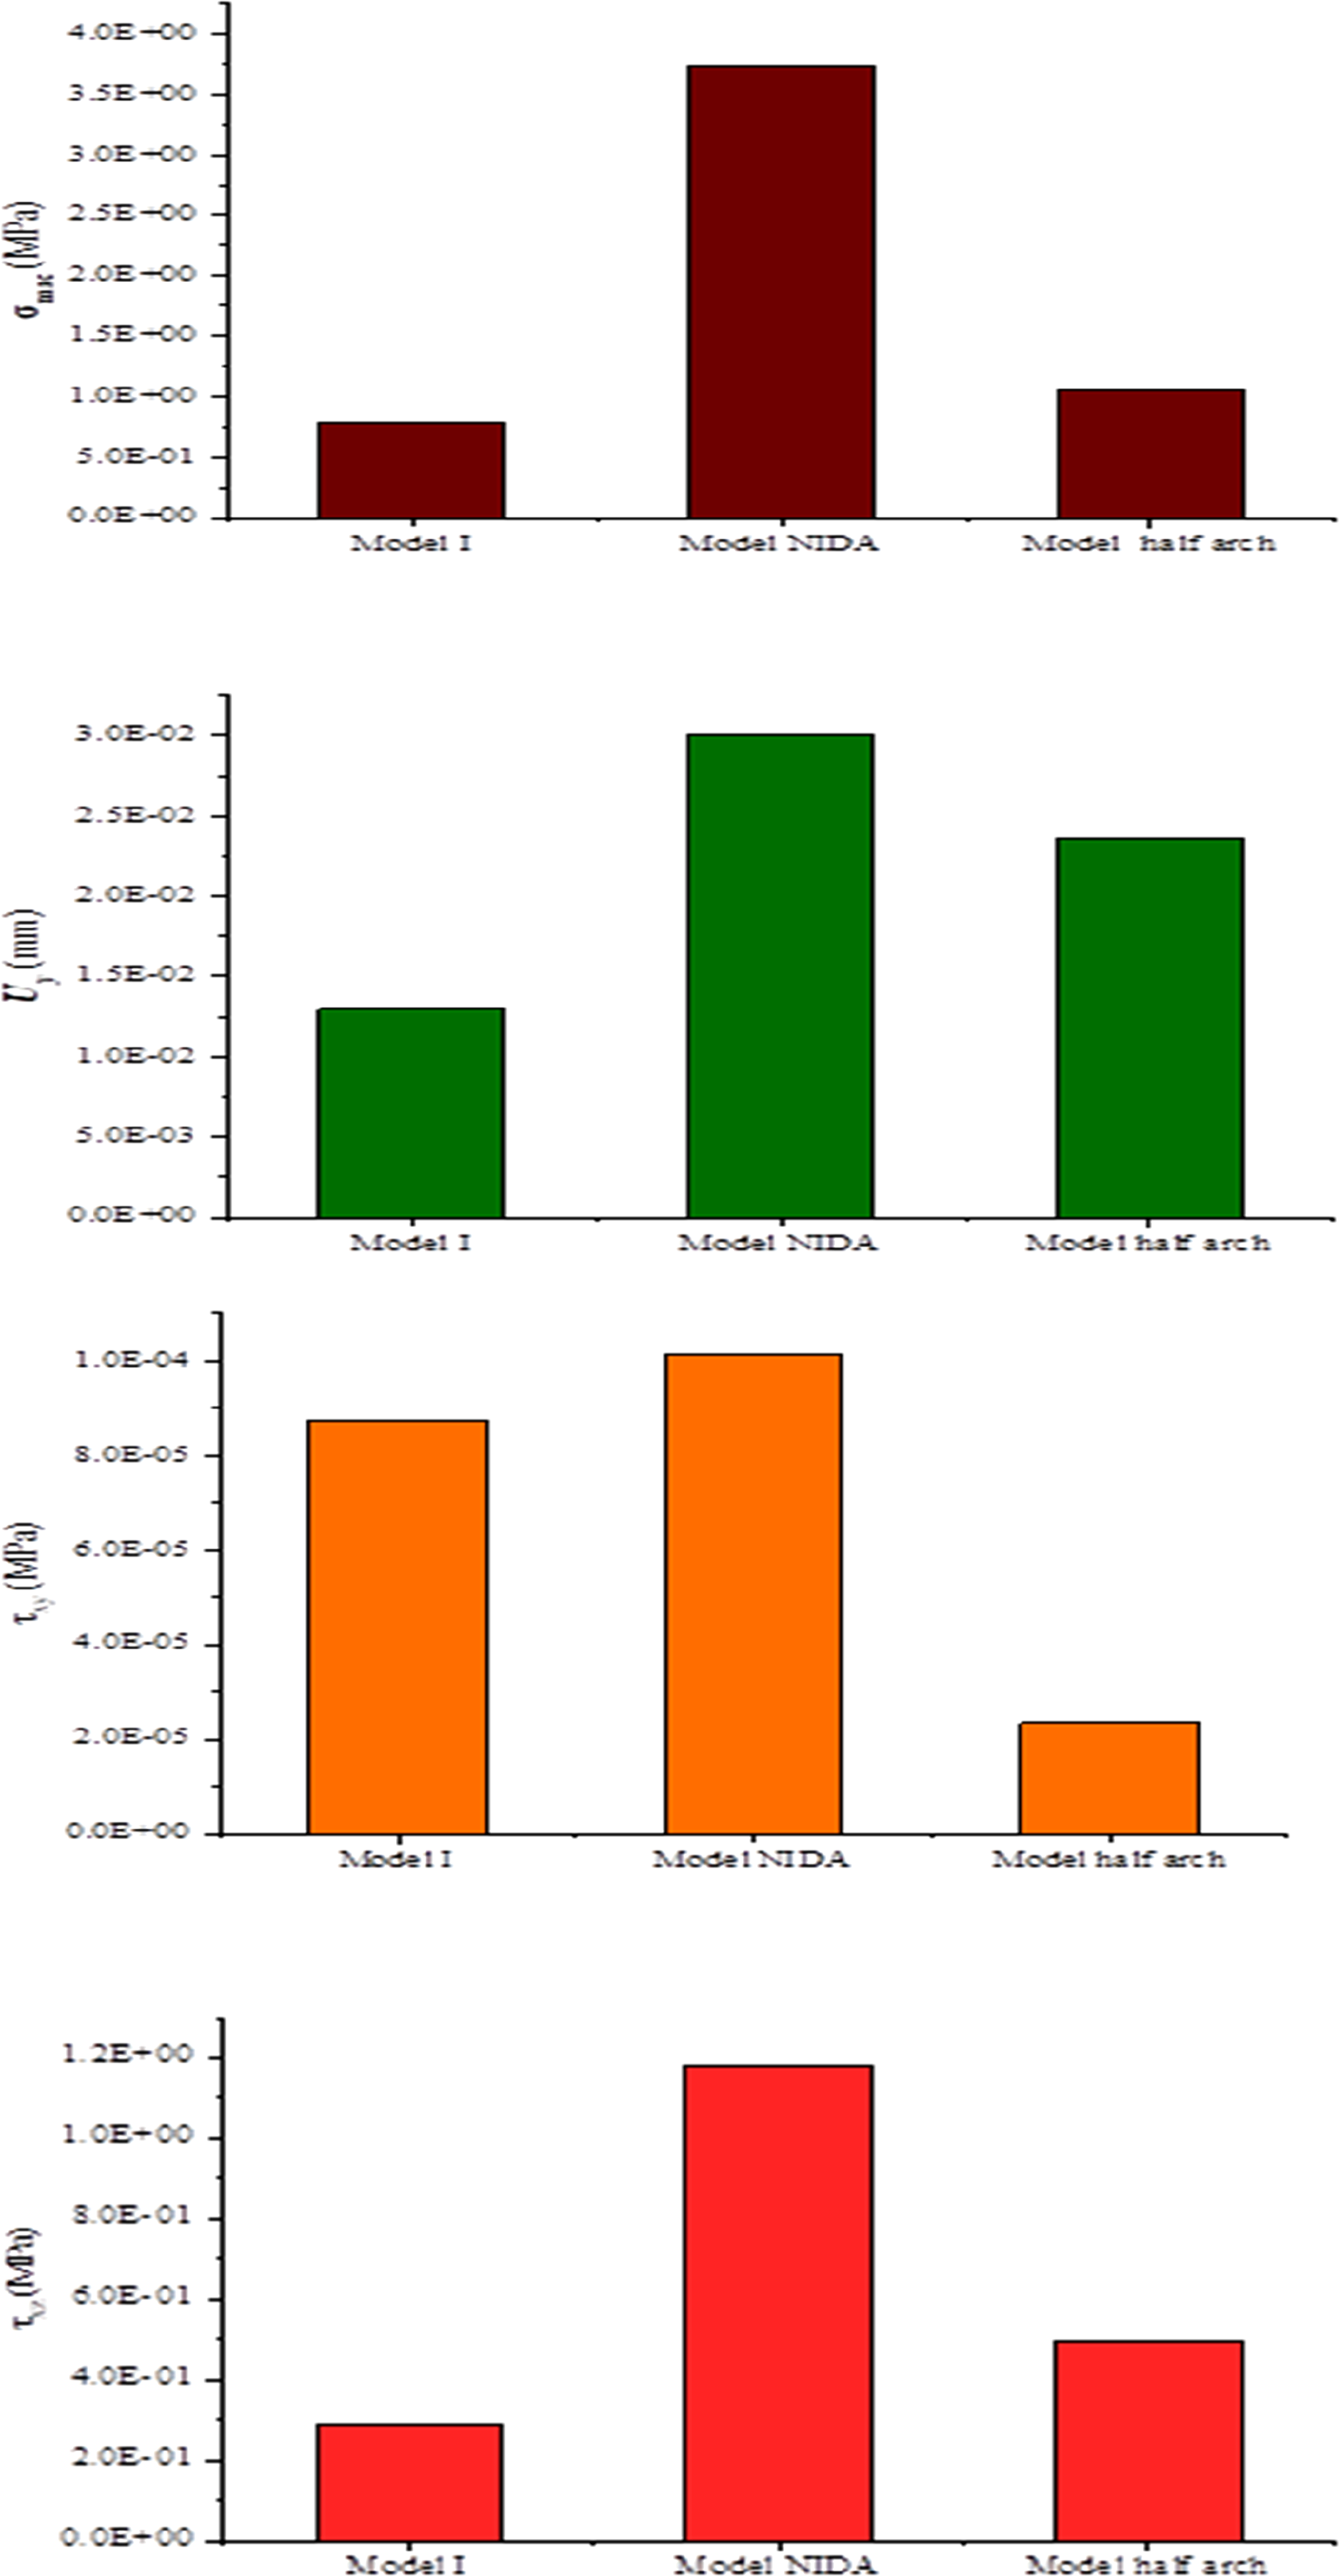
The displacement histogram makes the mechanical differences between the three designs significantly more straightforward. Model NIDA has the most significant displacement, accounting for approximately 46% of the overall distribution. This means that the structure is less stiff, and the NIDA arrangement is more likely to bend excessively, which could make the prosthesis less stable and less Figure 15(b). Model I, on the other hand, has the smallest displacement, which is around 20%. This indicates that it is stiffer and better able to withstand external loads. The Half-arch model has a reaction that is in the middle, with a contribution of about 34%. This suggests that it is a good mix between being able to resist deformation and being flexible. The displacement analysis supports the stress findings: Model I exhibits the best mechanical performance, followed by the Half-arch, while Model NIDA is the least efficient, as it is more prone to deformation.
The comparative investigation of shear stress distribution among the three sandwich composite forms reveals unique mechanical characteristics Figure 15(c). The NIDA model exhibits the most resistance and accounts for approximately 49% of the total shear capacity. This improved performance is attributed to its honeycomb-like structure, which effectively distributes loads and mitigates shear failure. The (I)-form model is very similar, comprising approximately 41% of the total, which indicates that its continuous and straightforward shape makes it structurally strong enough to handle shear stresses. The Half Arch model, on the other hand, represents only 10% of the overall shear response, which means it cannot effectively handle transverse pressures. This setup may nevertheless be helpful in situations where weight loss or controlled deformation is more important than maximum shear strength, even though it is mechanically less intense under shear.
The shear stress evaluation indicates that the NIDA model provides the best resistance, accounting for nearly 58% of the total shear performance. This proves that its cellular, honeycomb-like shape is effective at spreading loads and improving shear stability. The Half Arch type comes next, with roughly 26%. This means it can resist shear to a moderate degree while still maintaining a balance between stiffness and flexibility. The I-form model, on the other hand, accounts for only 16%, which is the lowest shear resistance among the three layouts. These results reveal that the NIDA shape is better at withstanding shear forces, while the Half Arch is a good middle ground, and the I-form is not very effective when shear forces are applied, as seen in Figure 15(d).
Discussion
The Von Mises stress combines the effects of multiple load components and highlights areas at risk of failure. The honeycomb (1.250) shows large local concentrations due to bending of the thin walls, as physically expected, since the forces concentrate at the connections between the walls and skins. The I-Core (0.7860) distributes loads better thanks to the central rib and wings, lowering stress peaks and enabling steady mechanical behaviour. The half-arch (0.3548) exhibits the lowest local stress, as the pre-flexed arches partially absorb the stresses, lowering local stress but spreading the loads less uniformly than the I-Core. This research demonstrates that the geometry and local stiffness of the core dictate the stress distribution and failure potential, thereby affirming the necessity of physical evaluation to enhance the performance of composite beams.29–33
The total displacement shows how flexible the beam is under load. The honeycomb (δ = 0.1003 m) exhibits significant movement because its walls are open and flexible, but this also causes stress to build up in some areas. The I-Core (δ = 0.004312 m) exhibits the lowest displacement, reflecting high overall stiffness and better transmission of bending loads to the composite skins. The half-arch (δ = 0.008457 m) exhibits moderate movement. When the arches bend at first, they can absorb some mechanical energy, reducing local deformation but increasing total movement somewhat compared to the I-Core. These observations demonstrate how the core’s shape affects the overall stiffness and the structure’s capacity to withstand bending while redistributing local stresses.34–37
The deformation shows how the material reacts to the load in that area. The thin walls of the honeycomb (ε = 3.339 × 10⁻⁵) bend and shear more under the strain, which is in line with the physical idea that bending and shear happen in small vertical segments. The I-Core (ε = 2.697 × 10⁻⁵) deforms less because the uniform distribution on the rib and wings makes concentration areas less likely, which means that the structure behaves more stably and can better transfer loads. The half-arch (ε = 1.679 × 10⁻⁵) has the least local deformation because the arches bend early, helping to spread stresses over a broader area and dissipate deformation energy. However, the overall displacement stays mild. This physical research demonstrates that deformation is contingent upon wall thickness, structural geometry, and force distribution, hence directly impacting the durability of composites.38–40
The shear stress tells you how well the beam can handle forces that are parallel to its surface. It is an important metric of how well the machine works. In the honeycomb model (τ = 0.3994), the cells’ thin walls concentrate forces at a single point, increasing the stresses on the joints with the composite skins. These walls are like small vertical beams that bend when loaded, which is why they are generally very flexible but powerful in some areas. The I-Core model (τ = 0.0964) distributes forces on the central rib and flanges more evenly, reducing stress concentrations and making the structure more rigid overall. This helps reduce the likelihood of local failure. The half-arc (τ = 0.1654) shows intermediate behaviour: the pre-flexed arcs spread out the forces, which makes them less concentrated but less stiff than the I-Core. This research shows that the core’s interior geometry regulates the distribution of shear stresses and directly affects mechanical stability and the likelihood of local deformation.26,41,42
Conclusion
In this research paper, the engineering impact of the core and skins resulting from three-point bending on sandwich structures is studied to evaluate their mechanical behaviors. The mechanical comparison of the three studied sandwich structures provides a clear insight into their performance in terms of stress, stiffness, and shear resistance. The first model consistently achieves excellent performance in reducing both von Mises stress (11%) and displacement (20%), indicating that it has excellent load distribution and high stiffness. This makes it the most mechanically efficient and stable design. The NIDA model has the best shear resistance (49-58%), but it also has the highest concentration of von Mises stress (70%) and the most significant displacement (46%). This means that, although it is very stable under shear, it is likely to fail in one area and deform excessively. The half-arch model consistently performs well in the mid-range for all three criteria: von Mises stress (19%), displacement (34%), and shear resistance (10-26%). This means it achieves a good balance between stiffness and flexibility,43,44 but it does not excel in either. Overall, the results indicate that Model I is the most reliable in terms of structural stability, Model NIDA is the best in terms of shear strength but suffers from stress and deformation concentration issues, and the half-arch model is a suitable option when a balance between stiffness and flexibility is required.
Footnotes
Author contributions
Takieddine Naili Supervision, critical review of methodology, and validation of simulation strategy. Lahcene Ghouari Conceptualization, methodology design, finite element model development, and manuscript drafting. Charafeddine Benatmane Data curation, numerical simulations in Abaqus, and result interpretation. Hala Messai Literature review, preparation of figures and tables, and assistance with manuscript editing. Salim Nouar Formal analysis, verification of results, and final proofreading of the manuscript. All authors have read and approved the final manuscript and agree to be accountable for all aspects of the work.
Funding
The authors received no financial support for the research, authorship, and/or publication of this article.
Declaration of conflicting interests
The authors declared no potential conflicts of interest with respect to the research, authorship, and/or publication of this article.
Data Availability Statement
Data sharing is not applicable to this article as no datasets were generated or analyzed during the current study.