
Abstract
Lightweight, corrosion-resistant and electrically conductive aluminum and its composites are perfect for electronics, automotive, marine and aerospace applications. Pure aluminum, however lacks the fatigue resistance and strength required for structural applications. To solve these problems, Aluminum hollow glass microsphere (HGM) Metal matrix composites are developed, which combine the advantages of aluminum with improved mechanical properties from reinforcements. These syntactic foams improve stiffness, fatigue/corrosion resistance and strength to weight ratios, which makes them appropriate for harsh conditions. This research introduces a new deep learning framework that uses a modified mixed attention mechanism with deep bidirectional long-short term memory (M2AM-Deep BiLSTM) network to forecast the propagation of fatigue cracks in aluminum-based Metal Matrix Composites, especially aluminum HGM and aluminum silicon carbide. To increase prediction accuracy, the model uses hybrid optimization using V-shaped and S-shaped binary divine religious algorithms (bDRA). The proposed model should achieve error less than 5% with the best value than other methods. The performance of the proposed model is executed on a Python platform and is compared to established approaches. The results demonstrate a high predictive capability when compared to traditional methods, enabling better experimental planning and material selection.
Keywords
Introduction
Composites are materials that have one material property but consists of two or more distinct constituents with different mechanical, chemical and physical characteristics. Certain properties are obtained by creating composite materials that are not achievable when using the individual constituent components. 1 Metal Matrix Composites (MMCs) are advanced materials in which ceramic reinforcements such as silicon carbide or aluminum oxide are incorporated into a metallic matrix (e.g., aluminum or titanium) to increase mechanical strength, wear resistance, and high-temperature performance. Despite being widely used in applications in military, automotive and aerospace, the hardness and brittleness make processing them expensive and difficult. 2 The characteristics of the constituents and the proportions of each component determine the attributes of composite materials. The simplest and most obvious method for predicting a composite’s characteristics is the rule of mixing. 3 MMCs are frequently distinguished by the kind of reinforcement material used as well as the matrix’s chemical and physical properties. The addition of reinforcing material particles to the matrix improves the mechanical and physical characteristics of the MMC. A matrix, usually a lightweight metal such as magnesium, titanium or aluminum supports the reinforcement material. 4 To improve properties such as strength, stiffness, wear resistance, and thermal stability, aluminum matrix composites (Al-MMCs) combine an aluminum matrix with reinforcements such as silicon carbide, aluminum oxide, or graphite. 5 Strengthening the matrix is the primary goal of the reinforcement phase, which transmits stress to the scattering phase. The effectiveness of stress transfer via the phase interface determines the behavior and performance of composites. 6 Specific stiffness, strength, resistance to wear and creep, thermal conductivity and configuration stability are all enhanced in the composite by combining and consolidating the metal matrix and dispersion phase. Higher operating temperatures, nonflammability and greater resilience to organic fluid degradation are further benefits of MMCs over polymer matrix composites. 7 The most widely used reinforcement for creating ex-situ MMCs and Metal Matrix Nano Composites (MMNCs) include carbides, oxides, nitrides, borides and carbon allotropes. However, the low wettability of practically all nonmetal/metal contacts is one of the biggest and most difficult problems. 8 When compared to pure aluminum, Al-MMCs have improved mechanical properties, including higher tensile strength, harder material and improved resistance to wear and creep.9–13 Despite maintaining a low density, the incorporation of reinforcements like SiC or Al2O3 significantly enhances the stiffness and load-bearing capacity of the material. 14 However, the type and quantity of reinforcement used may lead to a reduction in toughness and ductility. The ability of MMCs to withstand high temperatures, along with the improved electrical and thermal conductivity, transverse strength, and stiffness, are some of the key advantages.15,16 Furthermore, the hardness, strength, corrosion resistance, and wear resistance of MMCs are all greatly improved when the aluminum matrix is reinforced with ceramic particles.17,18
Literature survey
Zhao et al. 19 have frequently used prognostic and health management (PHM) for acoustic emission technologies to monitor the development of fatigue cracks, proposing an enhanced stacked autoencoder and attention mechanism (SSAE-AM) based fatigue crack prediction model. Joshi et al. 20 have used an in-situ Acoustic Emission (AE) signals obtained when ship steel DMR 249A fatigue cracks were propagating. Using the in-situ AE sensors fatigue tests were carried out for three distinct load ratios 0.1, 0.25 and 0.5. Using a hybrid deep learning model that combines conventional neural networks (CNN) and long short-term memory (LSTM), the identified AE signals were used to predict the fatigue crack growth rate (CGR). Lehmhus et al. 21 analysed the sensitivity of the notch of iron-based metal matrix syntactic foam (MMSF) reinforced with hollow glass microspheres. The research indicates that the MMSF was less fracture tough, notch sensitive, and the impact energy was higher in U-shaped notches than in V-shaped notches, which demonstrates the brittle fracture nature of the material in stress concentrations. Yan et al. 22 have used fly ash, lag and Hollow Glass Microspheres (HGMs) to develop a foaming process for lightweight, environmentally friendly geopolymer composites. It was investigated to the microstructure, strength and thermal conductivity of the composites were affected by Cetyltrimethylammonium bromide, Hydrogen peroxide, and HGM. Low density materials with respectable strength and low heat conductivity that were appropriate for insulation were created by the technique. Controlling porosity and guaranteeing constant connection between HGMs and the matrix were difficulties, nevertheless. Yan et al. 23 have used gas pipeline fatigue cracks, especially those made of X80 steel, present serious risks of catastrophic failure if were not regularly inspected. In addition to correctly identifying the change from state to rapid crack propagation, a predictive model for fatigue crack propagation has been created that provides accurate real-time Fatigue Crack Propagation Rate (FCPR) forecasts that fall within the 95% confidence interval of measured values. Anidjar et al. 24 have used additive manufacturing that has the potential to lower costs and make items lighter, interest in additive manufacturing has grown. This method entails first separating region devoid of start sites, and then locating these spots in the remaining regions, then determine the distance from the surface using well-established computer vision techniques. Alem et al. 25 have examined new developments in MMCs reinforced with metal particles, such as bulk metallic glasses, high-entropy alloys and shape memory alloys, and intermetallic. These reinforcements offer better mechanical properties and increased compatibility as compared to traditional ceramics. However, fully understanding interactions at the atomic level and personalizing composite characteristics remain challenges. Li et al. 26 have investigated a chirp ultrasonic infrared thermography that was frequently used in non-destructive testing of materials, picture noise and lateral thermal diffusion limit its ability to detect defects. A method called time-frequency domain transient features reconstruction (TFFR) has been suggested in this research to address these problems. By comparing the computed and measured crack diameters, it was demonstrated that TFFR may successfully lower noise and lateral heat diffusion, enhancing signal-to-noise ratio (SNR). Gong et al. 27 have suggested a way to quantify the fracture surface dimensions (length, width and angle) by separating the magnetic flux leakage (MFL) caused by circular sensor arrays. The width of the surface fracture was measured using the gradient edge of the magnetic leakage flux density modulus. Fort et al. 28 have used three magnetic field sensors to analyse changes in the magnetic field produced by a permanent magnet, the suggested method makes it possible to detect crack movements in all three spatial directions (x,y and z) by utilizing the data from the three sensors. This lays the groundwork for the deployment of inexpensive, on-invasive distributed sensor networks in structural health monitoring applications. Mariotti et al. 29 investigated the fatigue and fracture characteristics of Al2618 alloy reinforced with 7.1 wt% TiB2 particles, which were made by powder bed fusion laser beam. The TiB2 reinforcement was used to increase the mechanical properties of the alloy in order to be used as a reference for damage-tolerance evaluations of Aluminum (Al)-based MMCs. Ganesan 30 examined the behavior of low-cycle fatigue and FCG in pure copper (Cu) and an MMC of Cu reinforced with graphite and tantalum carbide. The composite exhibits enhanced fatigue resistance, tensile strength and strain life, which make it suitable in high-performance structural, electrical and thermal applications. Wang 31 analysed the high-temperature fatigue fracture mechanisms of titanium matrix composite (TMCs) reinforced with TiB and TiC. The research indicates that the reinforcements cause deflection of cracks and shielding of microcracks, which drastically lower the rate of fatigue crack growth and increase the serviceability of TMCs in the high temperature and vibration-intensive conditions.
Motivation
Aluminum based MMCs, especially reinforced with silicon carbide (SiC) and HGM show a great potential to achieve high mechanical properties. This makes them suitable for applications that require high-strength with low weight in the aerospace, marine and automotive fields. Under cyclic loading, however, there are nonlinear interactions between material properties and environment, and it is difficult to predict fatigue crack propagation accurately. To tackle this challenge, the present research adopted a novel deep learning model: M2AM-Deep BiLSTM, which is able to precisely model and characterize fatigue behavior. The proposed approach combines the strengths of hybrid optimization algorithms with important mechanical parameters such as porosity, crack length, and nanoindentation data, enhancing the predictive accuracy and understanding of the material to design lighter and stronger structural parts.
Objectives
(1) To use V-shaped and S-shaped bDRA in a hybrid optimization to increase the prediction’s accuracy. A specific set of input parameters that account for the material and mechanical causes of fatigue are used to train the model. (2) Among the parameter inputs are the number of loading cycles, the type and percentage of reinforcement (HGM or SiC), the amount of porosity, the applied stress, the crack length, the stress intensity factor and mechanical characteristics like hardness and elastic modulus from nano identification. (3) The proposed model find nonlinear correlations between loading conditions and material wear that precisely anticipate fatigue behaviour by using a time-series data collection. (4) On a python platform, the suggested model’s performance is evaluated and contrasted with more well-known methods. This method improves the experimental analysis by offering prediction value.
Framework for material fatigue analysis
Figure 1 depicts an advanced framework for forecasting material fatigue life, which combines synergistically the material science and artificial intelligence (AI), in this case deep learning (DL). It starts with material development, which involves designing aluminum MMCs customized for specific performance requirements, such as HGM/Al-SiC. These materials are then fabricated with multiple manufacturing processes, such as stir casting, gel casting and laser-based directed energy deposition, each of which has a significant impact on the structural integrity of the material. Material characterization is done next, using techniques including thermal analysis, mechanical testing, and nanoindentation to fully characterize the material properties. The critical parameters for fatigue prediction, such as loading cycles, applied stress, crack length, stress intensity factor, porosity, hardness, and elastic modulus are extracted and input into the deep learning model, which in this case is the M2AM-Deep BiLSTM network with an optimized mixed attention mechanism. For better prediction accuracy, hybrid optimization technique is applied that involves V-shaped and S-shaped bDRA. The model is programmed and tested in Python, validated with experimental data, and compared with industry standards to ensure robustness and reliability. The framework finally delivers fatigue prediction results, revealing the microstructural behavior, fatigue crack growth rate, and remaining fatigue life, which used for material design and optimization for critical applications in aerospace, automotive, and marine engineering. Deep learning framework for material fatigue analysis.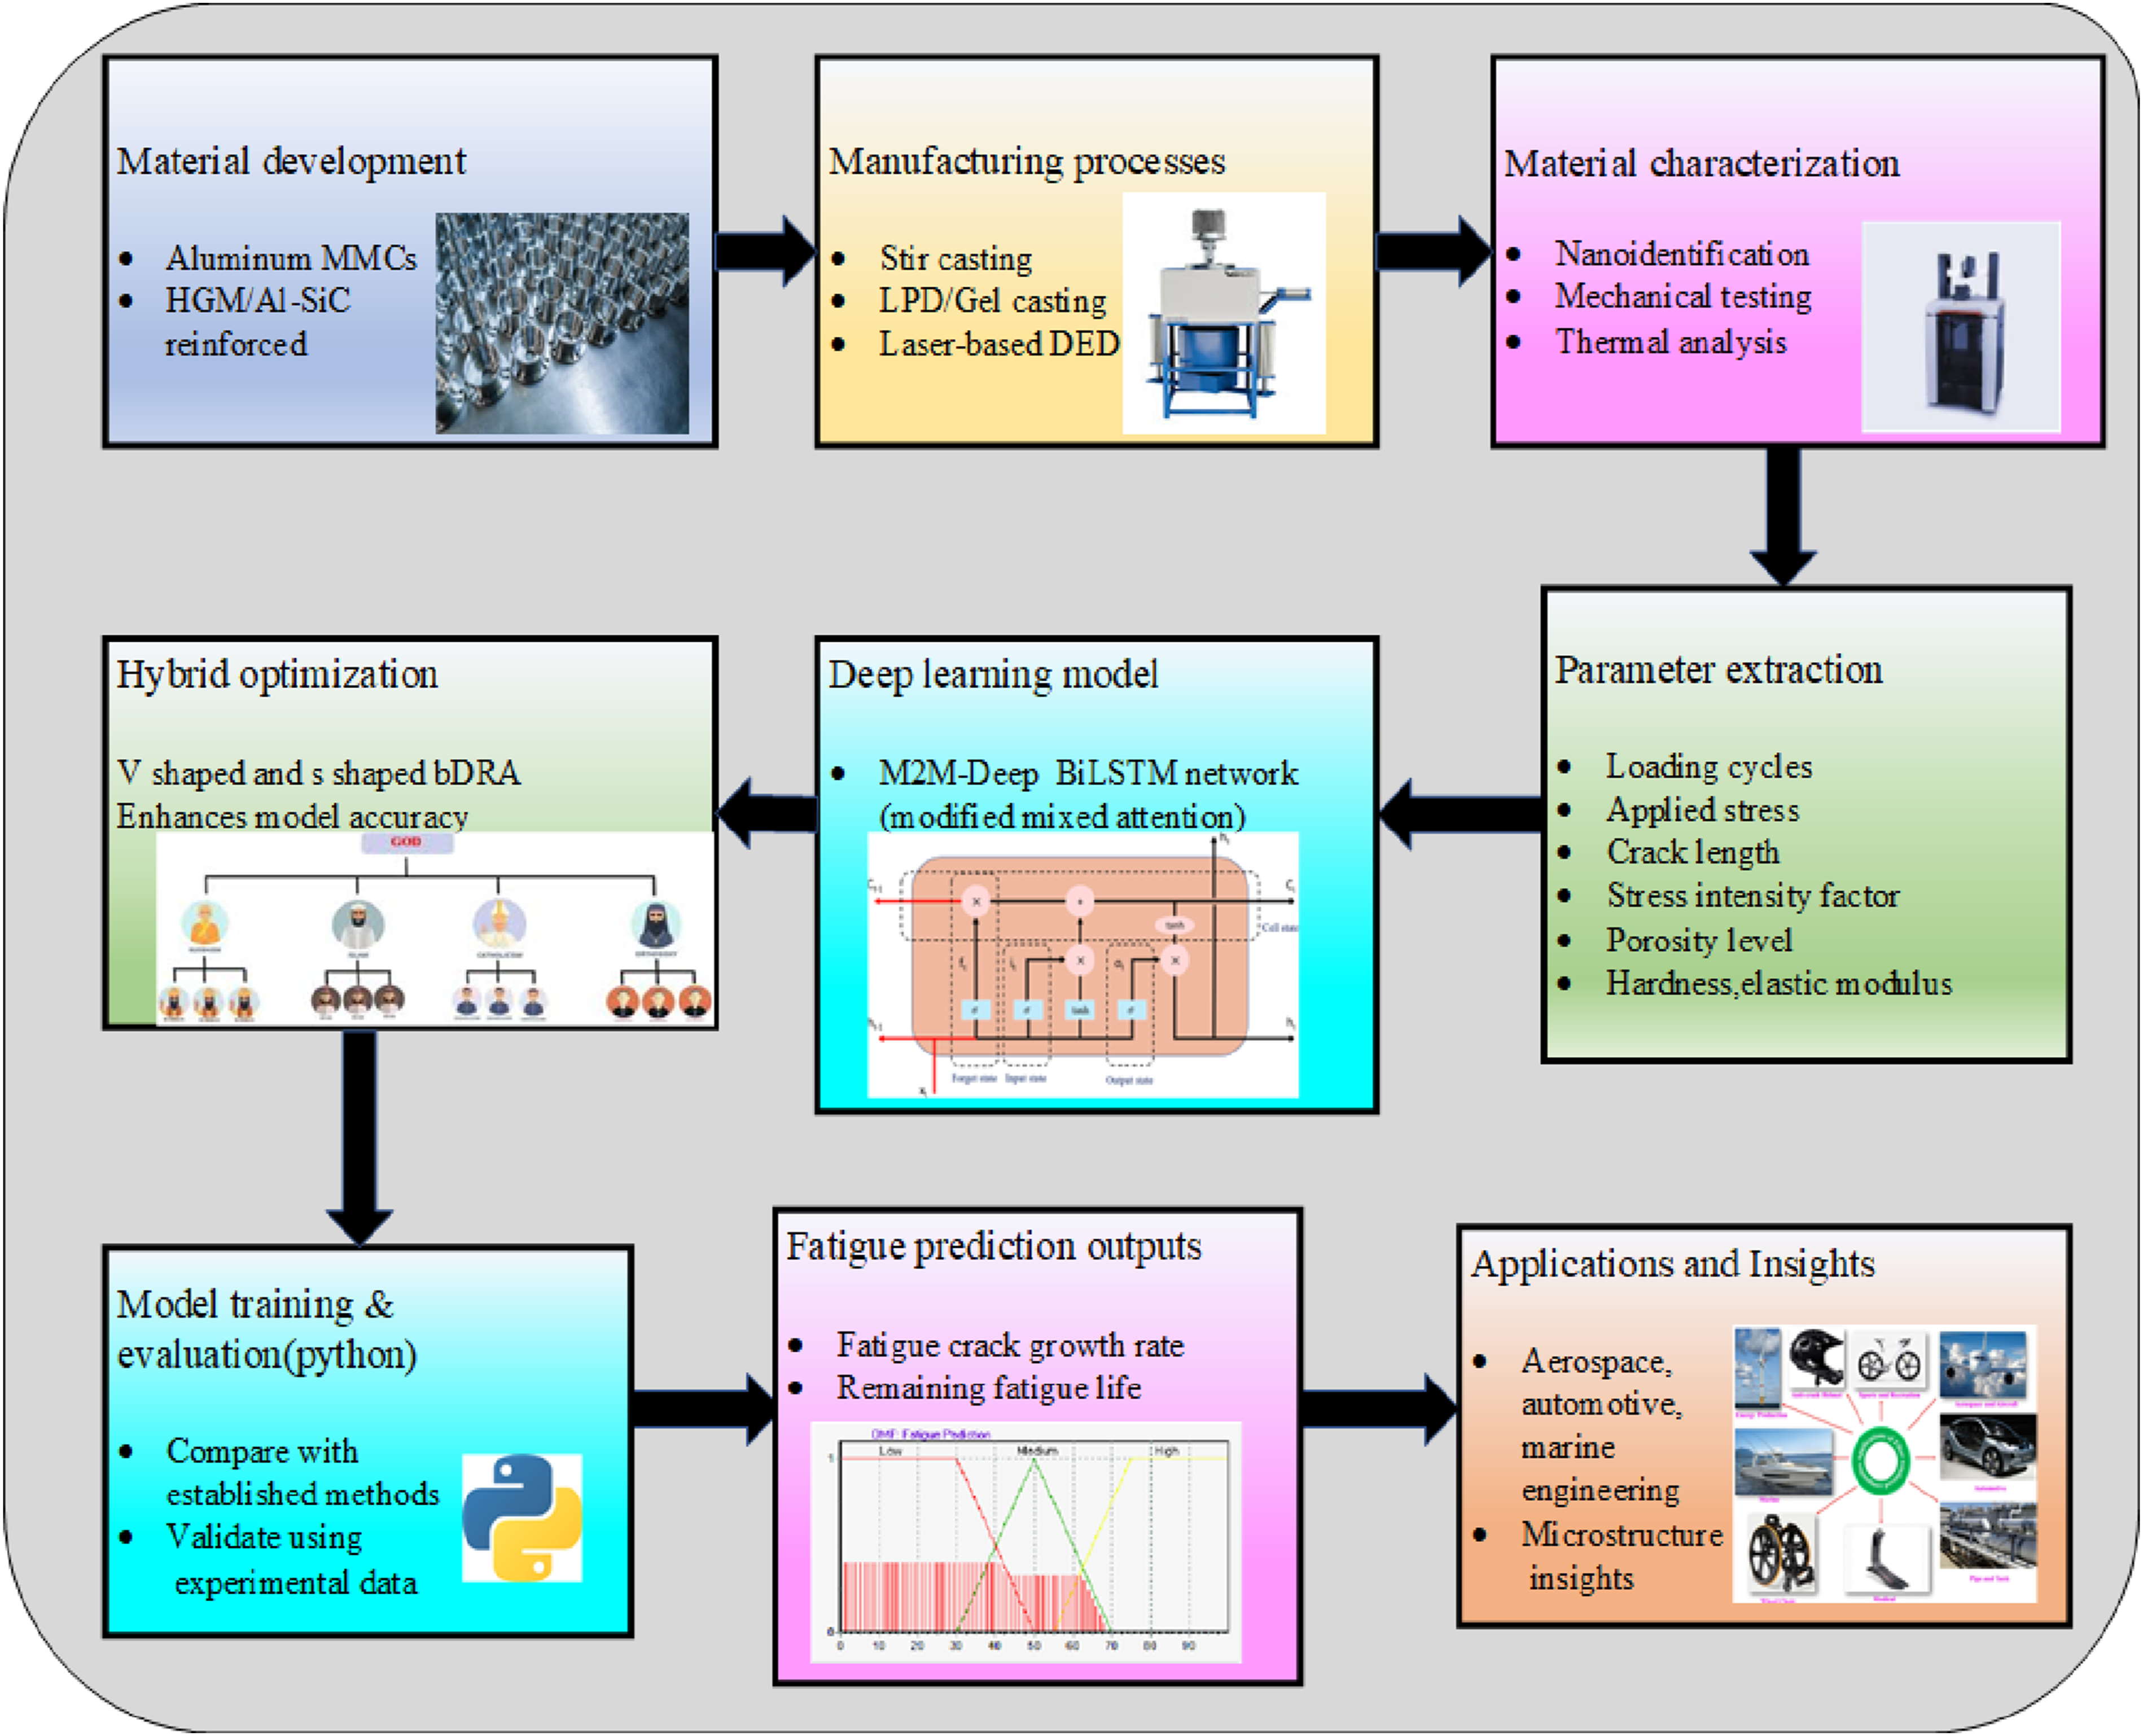
Aluminium hollow glass microsphere (HGM)
The composite specimens have been submitted using the stir casting method, which is renowned for its ease of use and effectiveness in creating uniform mixes.
32
Pure aluminum (99.7% purity) and HGM served as the primary materials. Strong, lightweight, water-resistant, and chemically inert, HGMs are composed of soda-lime borosilicate glass and have a high strength-to-weight ratio and low density. The real density is 0.8 g/cc, and the particle sizes range from 30 to 40 µm. SEM examination of HGMs is shown in Figure 2(a)–(c), with Figure 2(b) showing a particle diameter of 34.78 µm. Scanning electron microscopy (SEM) images showing the morphology of the hollow glass microspheres (a) overview of sample distribution at 200 µm scale, (b) magnified view highlighting individual particle shapes and size variation, (c) further zoomed in image showing surface texture and agglomeration at 250 µm scale.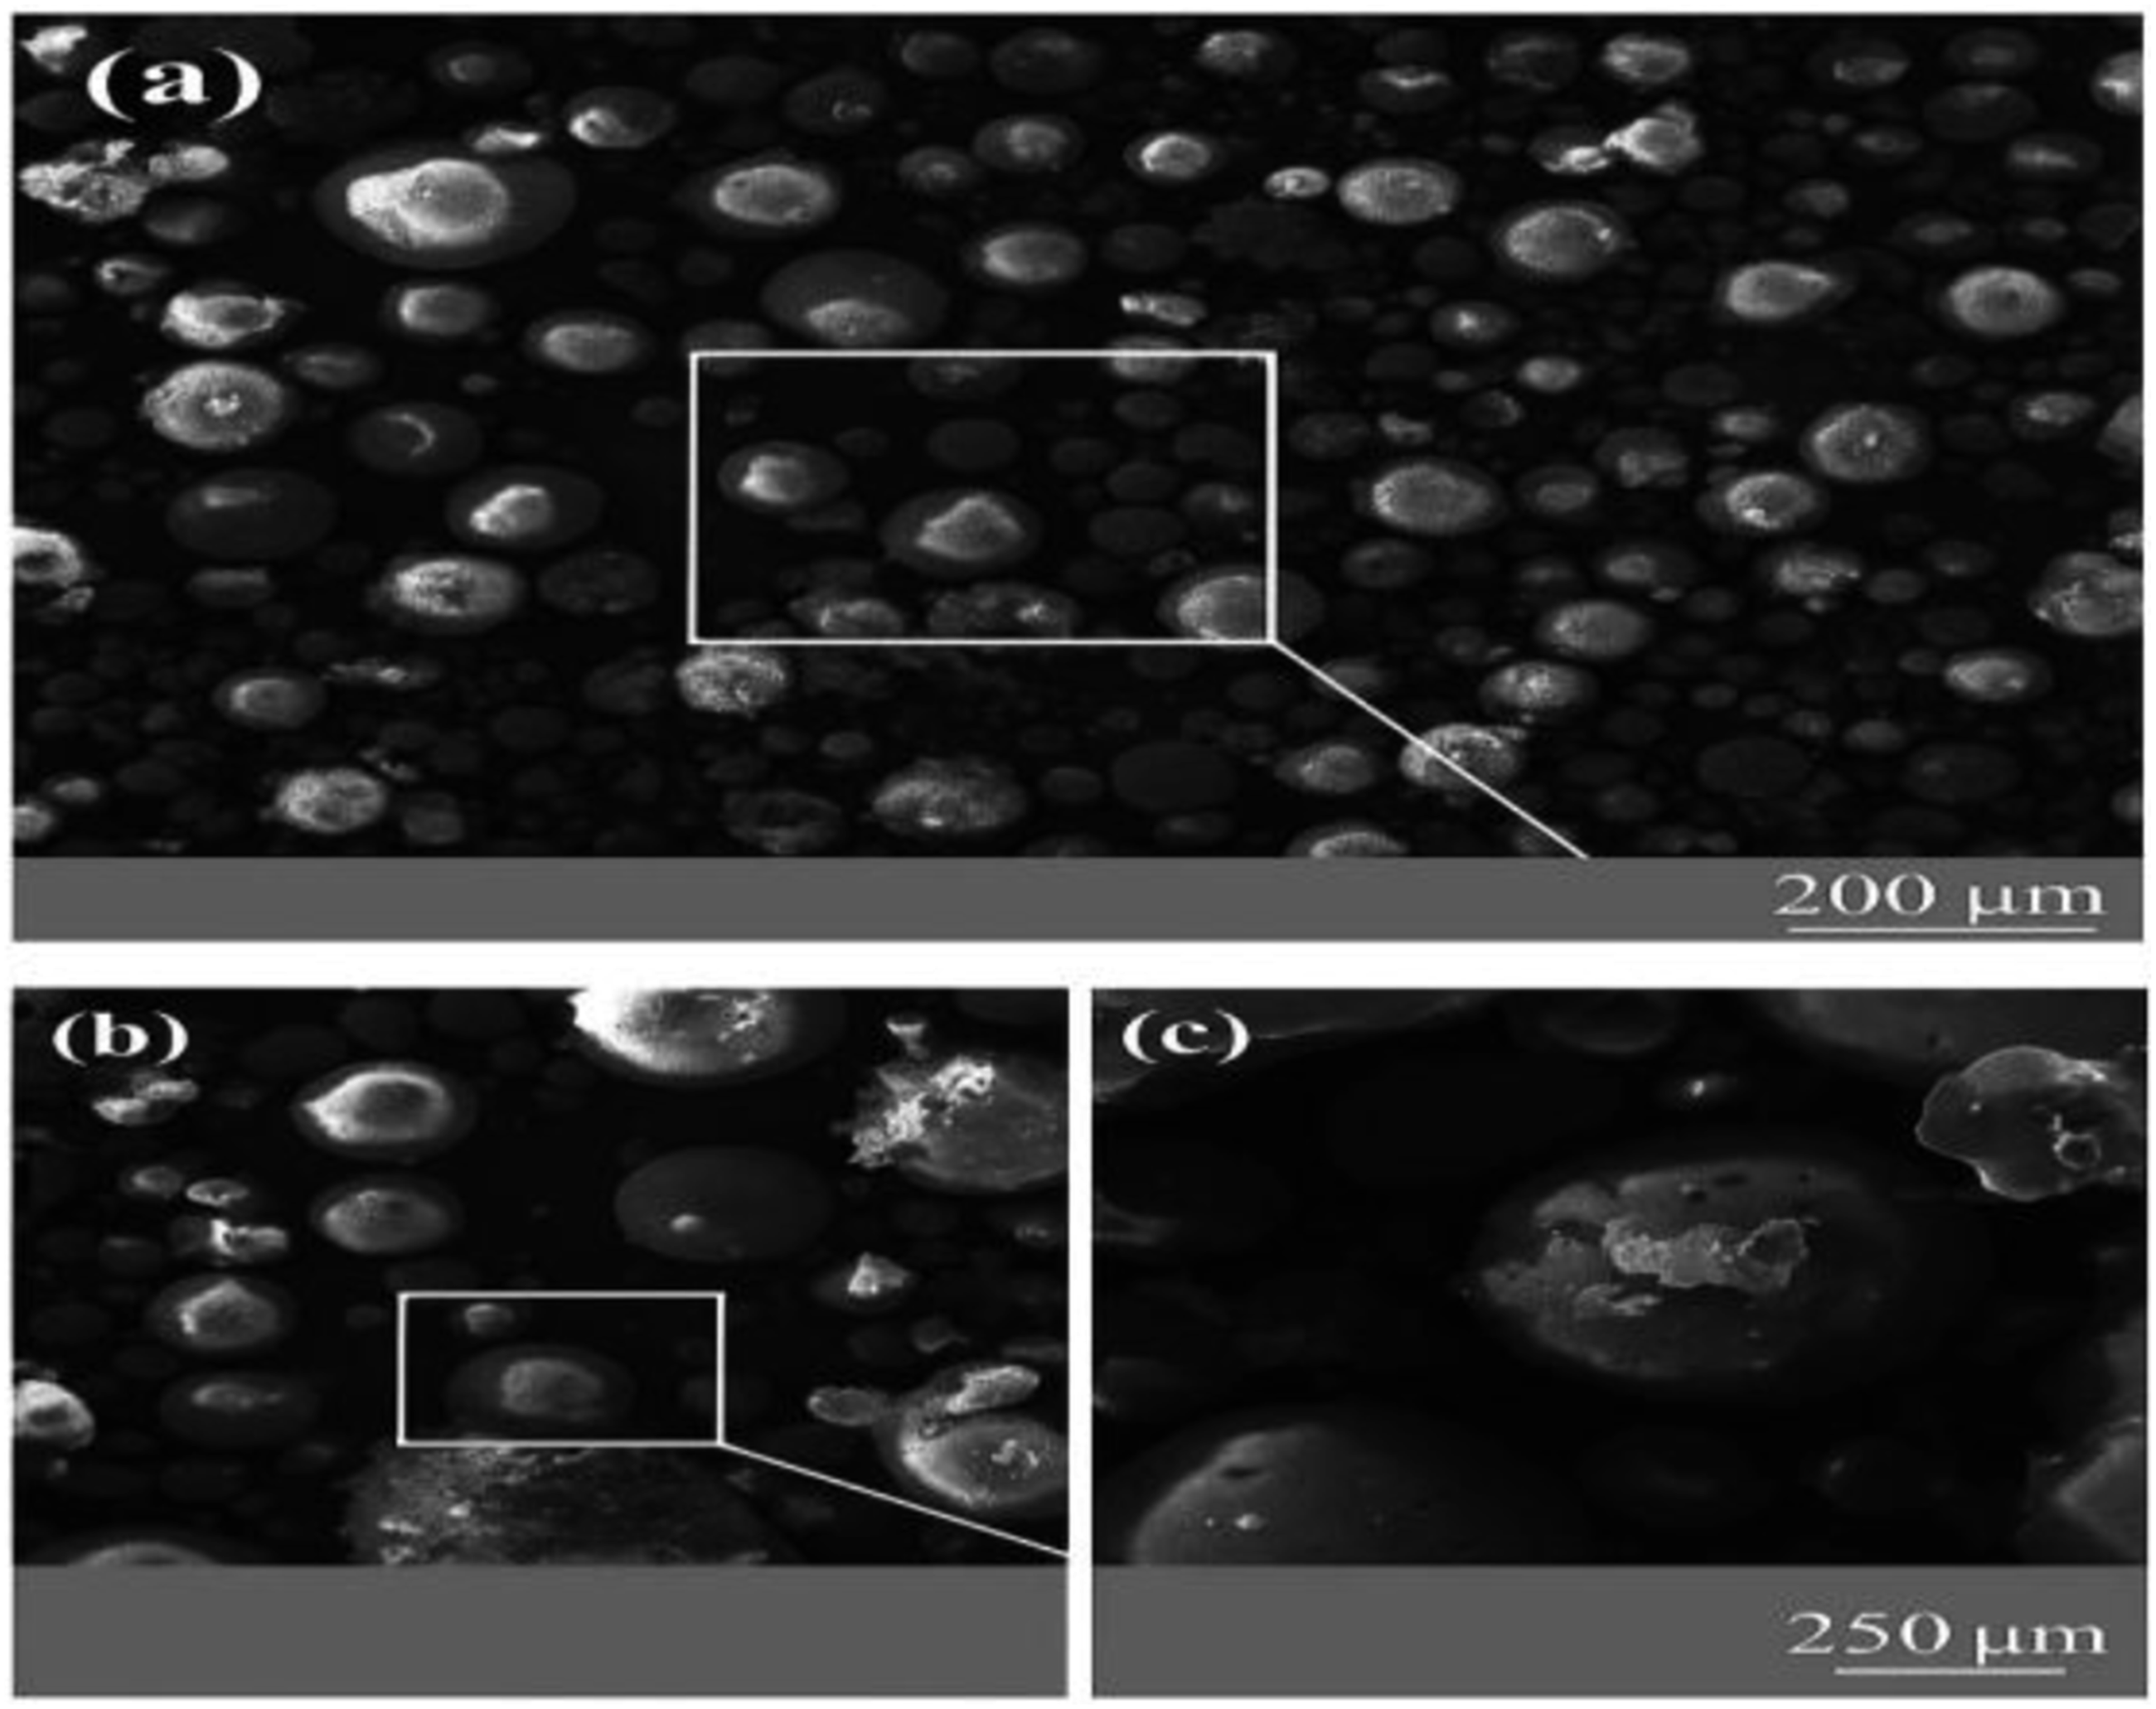
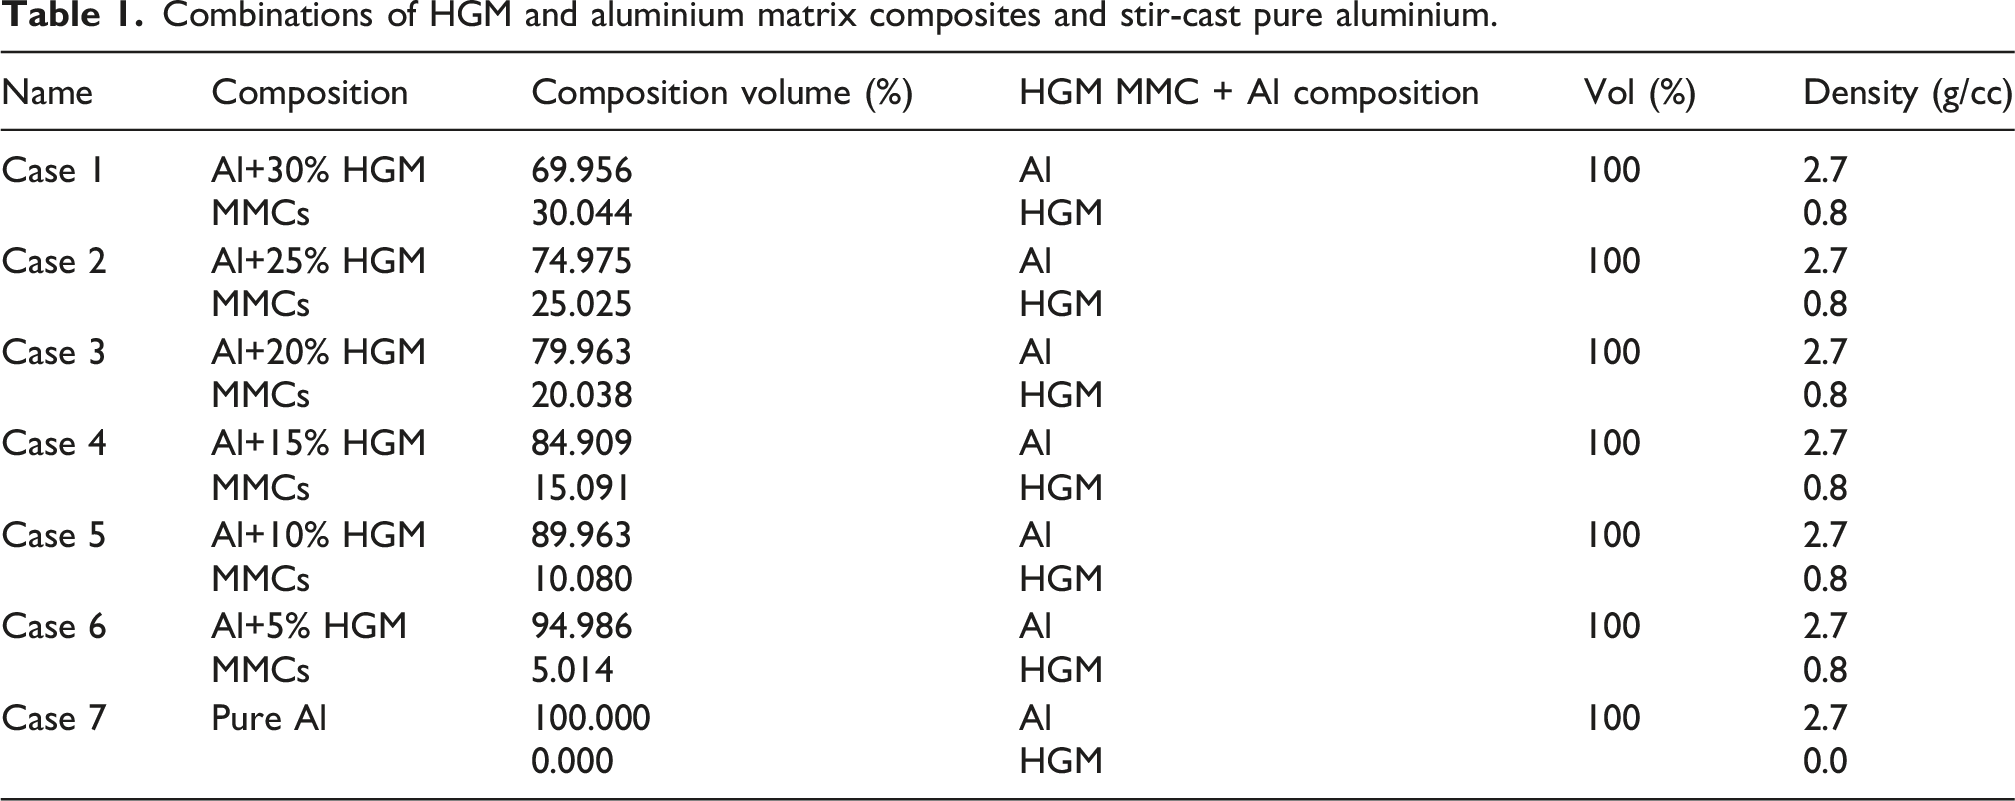
Combinations of HGM and aluminium matrix composites and stir-cast pure aluminium.
Nanoindentation testing
The nanoindentation testing is performed using a nano test advantage apparatus, designed for micromaterials. The tests are conducted with a residence time of 20 s, applying a minimum load of 10 mN at an ambient temperature of 25 ± 2°C. A 25 µm indenter is used for the tests. While macroscopic hardness testing could have been employed for this heterogeneous material, nanoindentation is specifically chosen for its ability to evaluate the material’s local, size-dependent characteristics at the micro/nano scale. This method provides more localized and precise measurements, which are crucial for understanding the heterogeneity of the composite material, especially given the variation in properties due to the presence of reinforcements like HGM and SiC. Unlike general hardness testing, which provides an average value for the entire material, nanoindentation allows for the assessment of hardness and stiffness at specific points, accounting for the influence of microstructural features such as the reinforcement distribution and the interfacial bonding between phases.
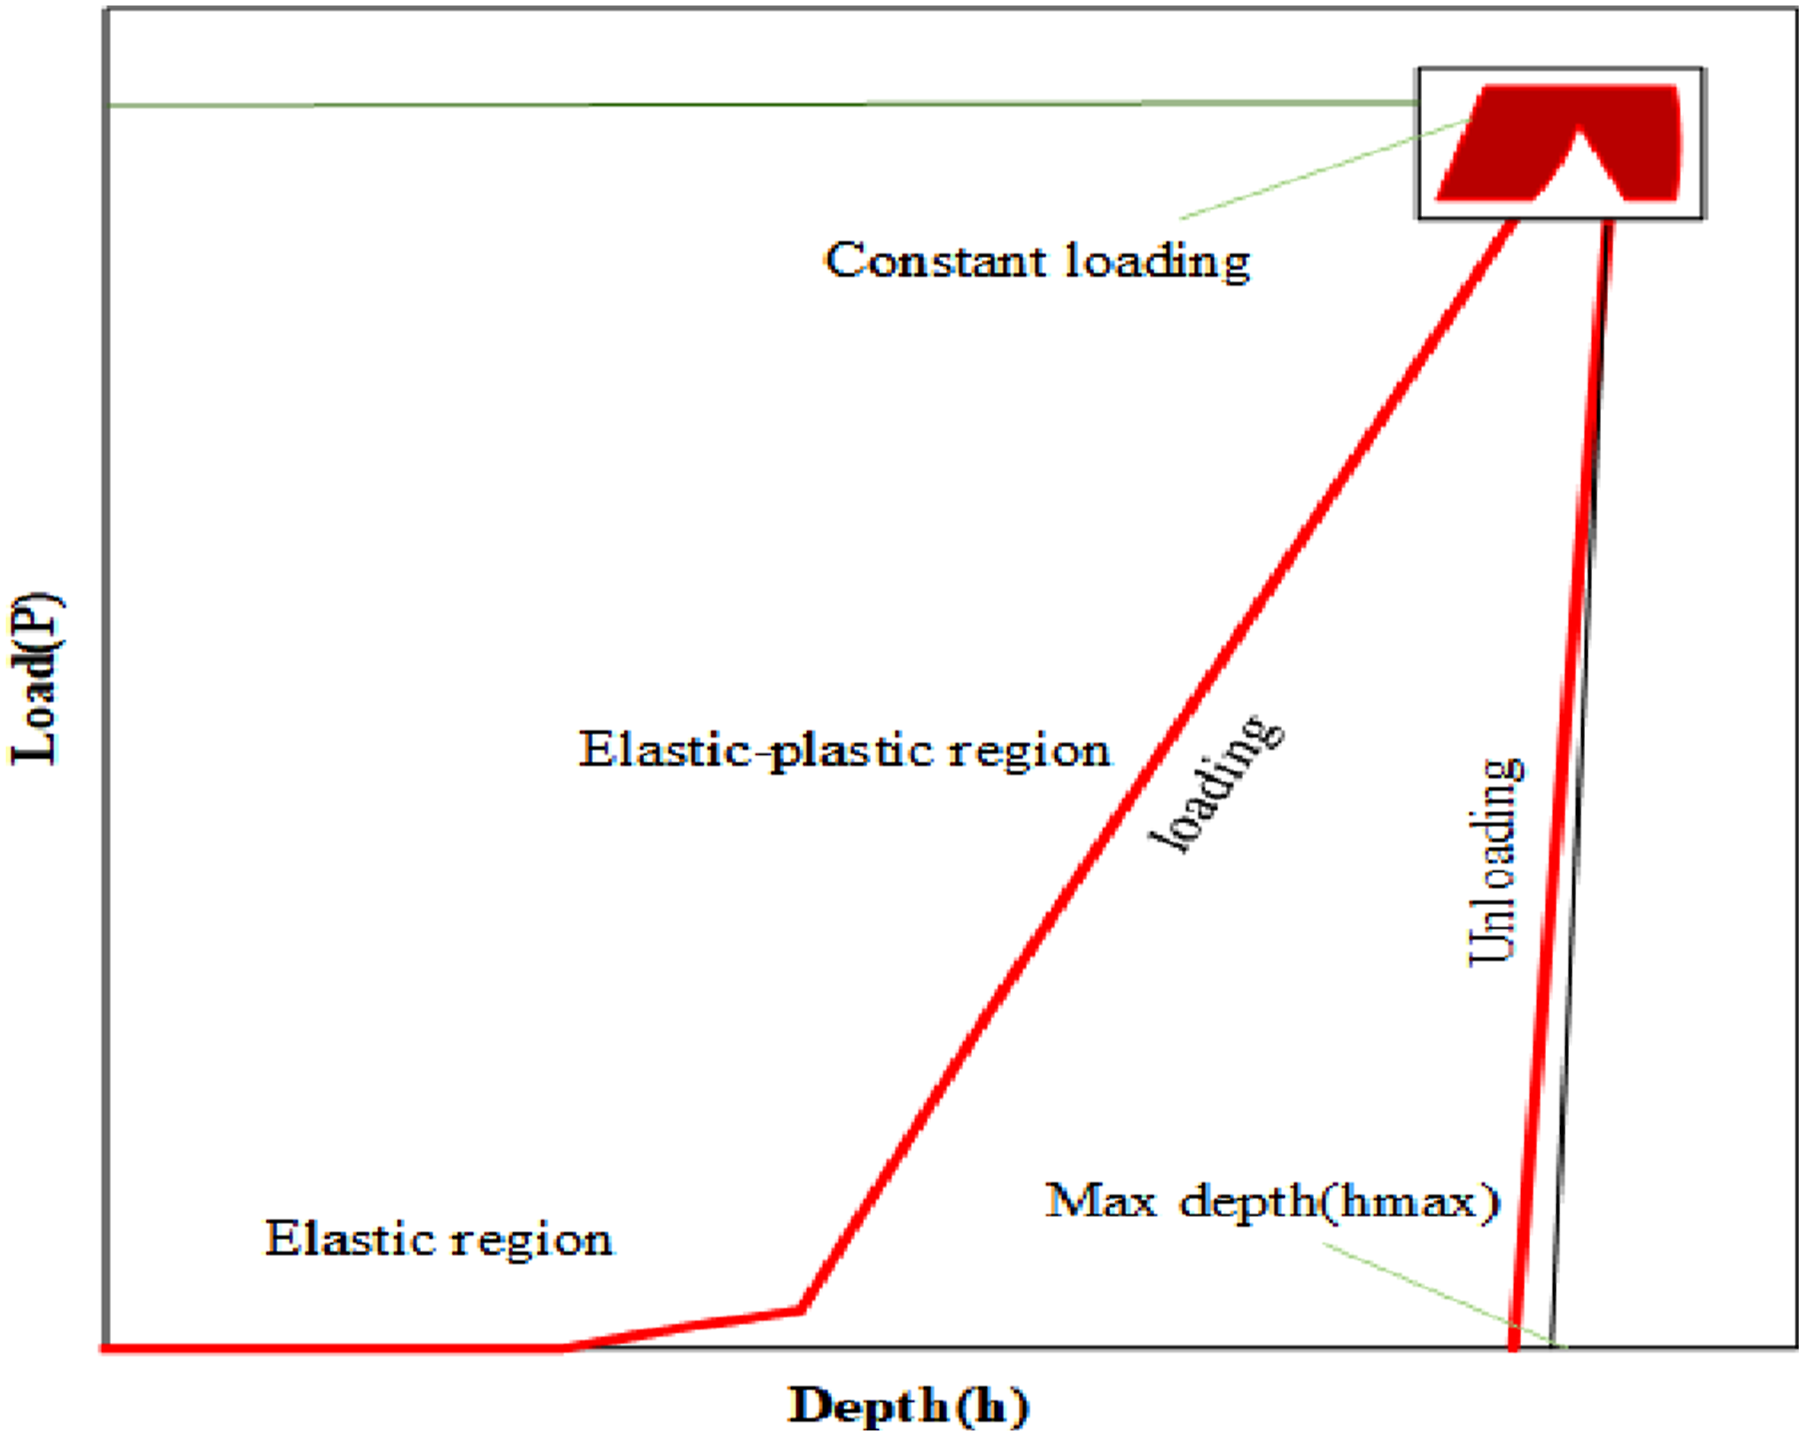
Figure 3 shows the relationship between the applied load (P) and the indentation depth (h). The major steps in the plot are the elastic, where the material moves elastically, the elastic-plastic, where there is both an elastic and plastic deformation and the constant loading, where the constant load is applied to achieve the maximum depth (hmax). Upon unloading, the material’s recovery is tracked in the unloading phase, and the initial slope of the unloading curve provides critical information about the indentation modulus ( Evaluation of mechanical properties at the micro/nano scale using nanoindentation load-depth plot.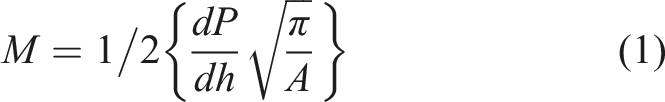
M2AM-deep BiLSTM network
The LSTM appears which stores data in the hidden layer’s storage cells. The memory cells store the data using the three integrated gates that determine whether the data is in the cell state.
33
Even though the LSTM has achieved memory dominance it is unable to analyse data from the future because it only process data from the past, which is utilized to draw conclusions from the research. The LSTM both forward and backward layers are used by BiLSTM to handle interdependence. The output layer is updated based on the output sequence, out, and the forward layer’s concealed sequence 


Figure 4 shows the M2AM-Deep BiLSTM architecture, which integrates a triplet attention mechanism with the zero-parameter attention mechanism (ZAM) and a mixed attention mechanism to optimize the weight adjustments in the BiLSTM network, enabling effective prediction of FCG in MMCs. By combining spatial attention and channel attention, the ZAM technique improves the model’s capacity to concentrate on key elements while reducing noise from unrelated data. The triplet attention mechanism, which operates in parallel with ZAM, attends to the spatial attention and combines the results through a Z-pool to decrease the zeroth dimension to ensure finer weight adjustments to enhance predictive accuracy. Here, Weight 1 refers to the output of the ZAM and the second layer of the triplet attention, whereas Weight 2 refers to the output of the combination of the first and third layers of the triplet attention. This system processes input features such as crack length and applied stress through multiple LSTM layers and convolution operations, ultimately predicting the FCGR and remaining fatigue life. The M2AM-Deep BiLSTM architecture.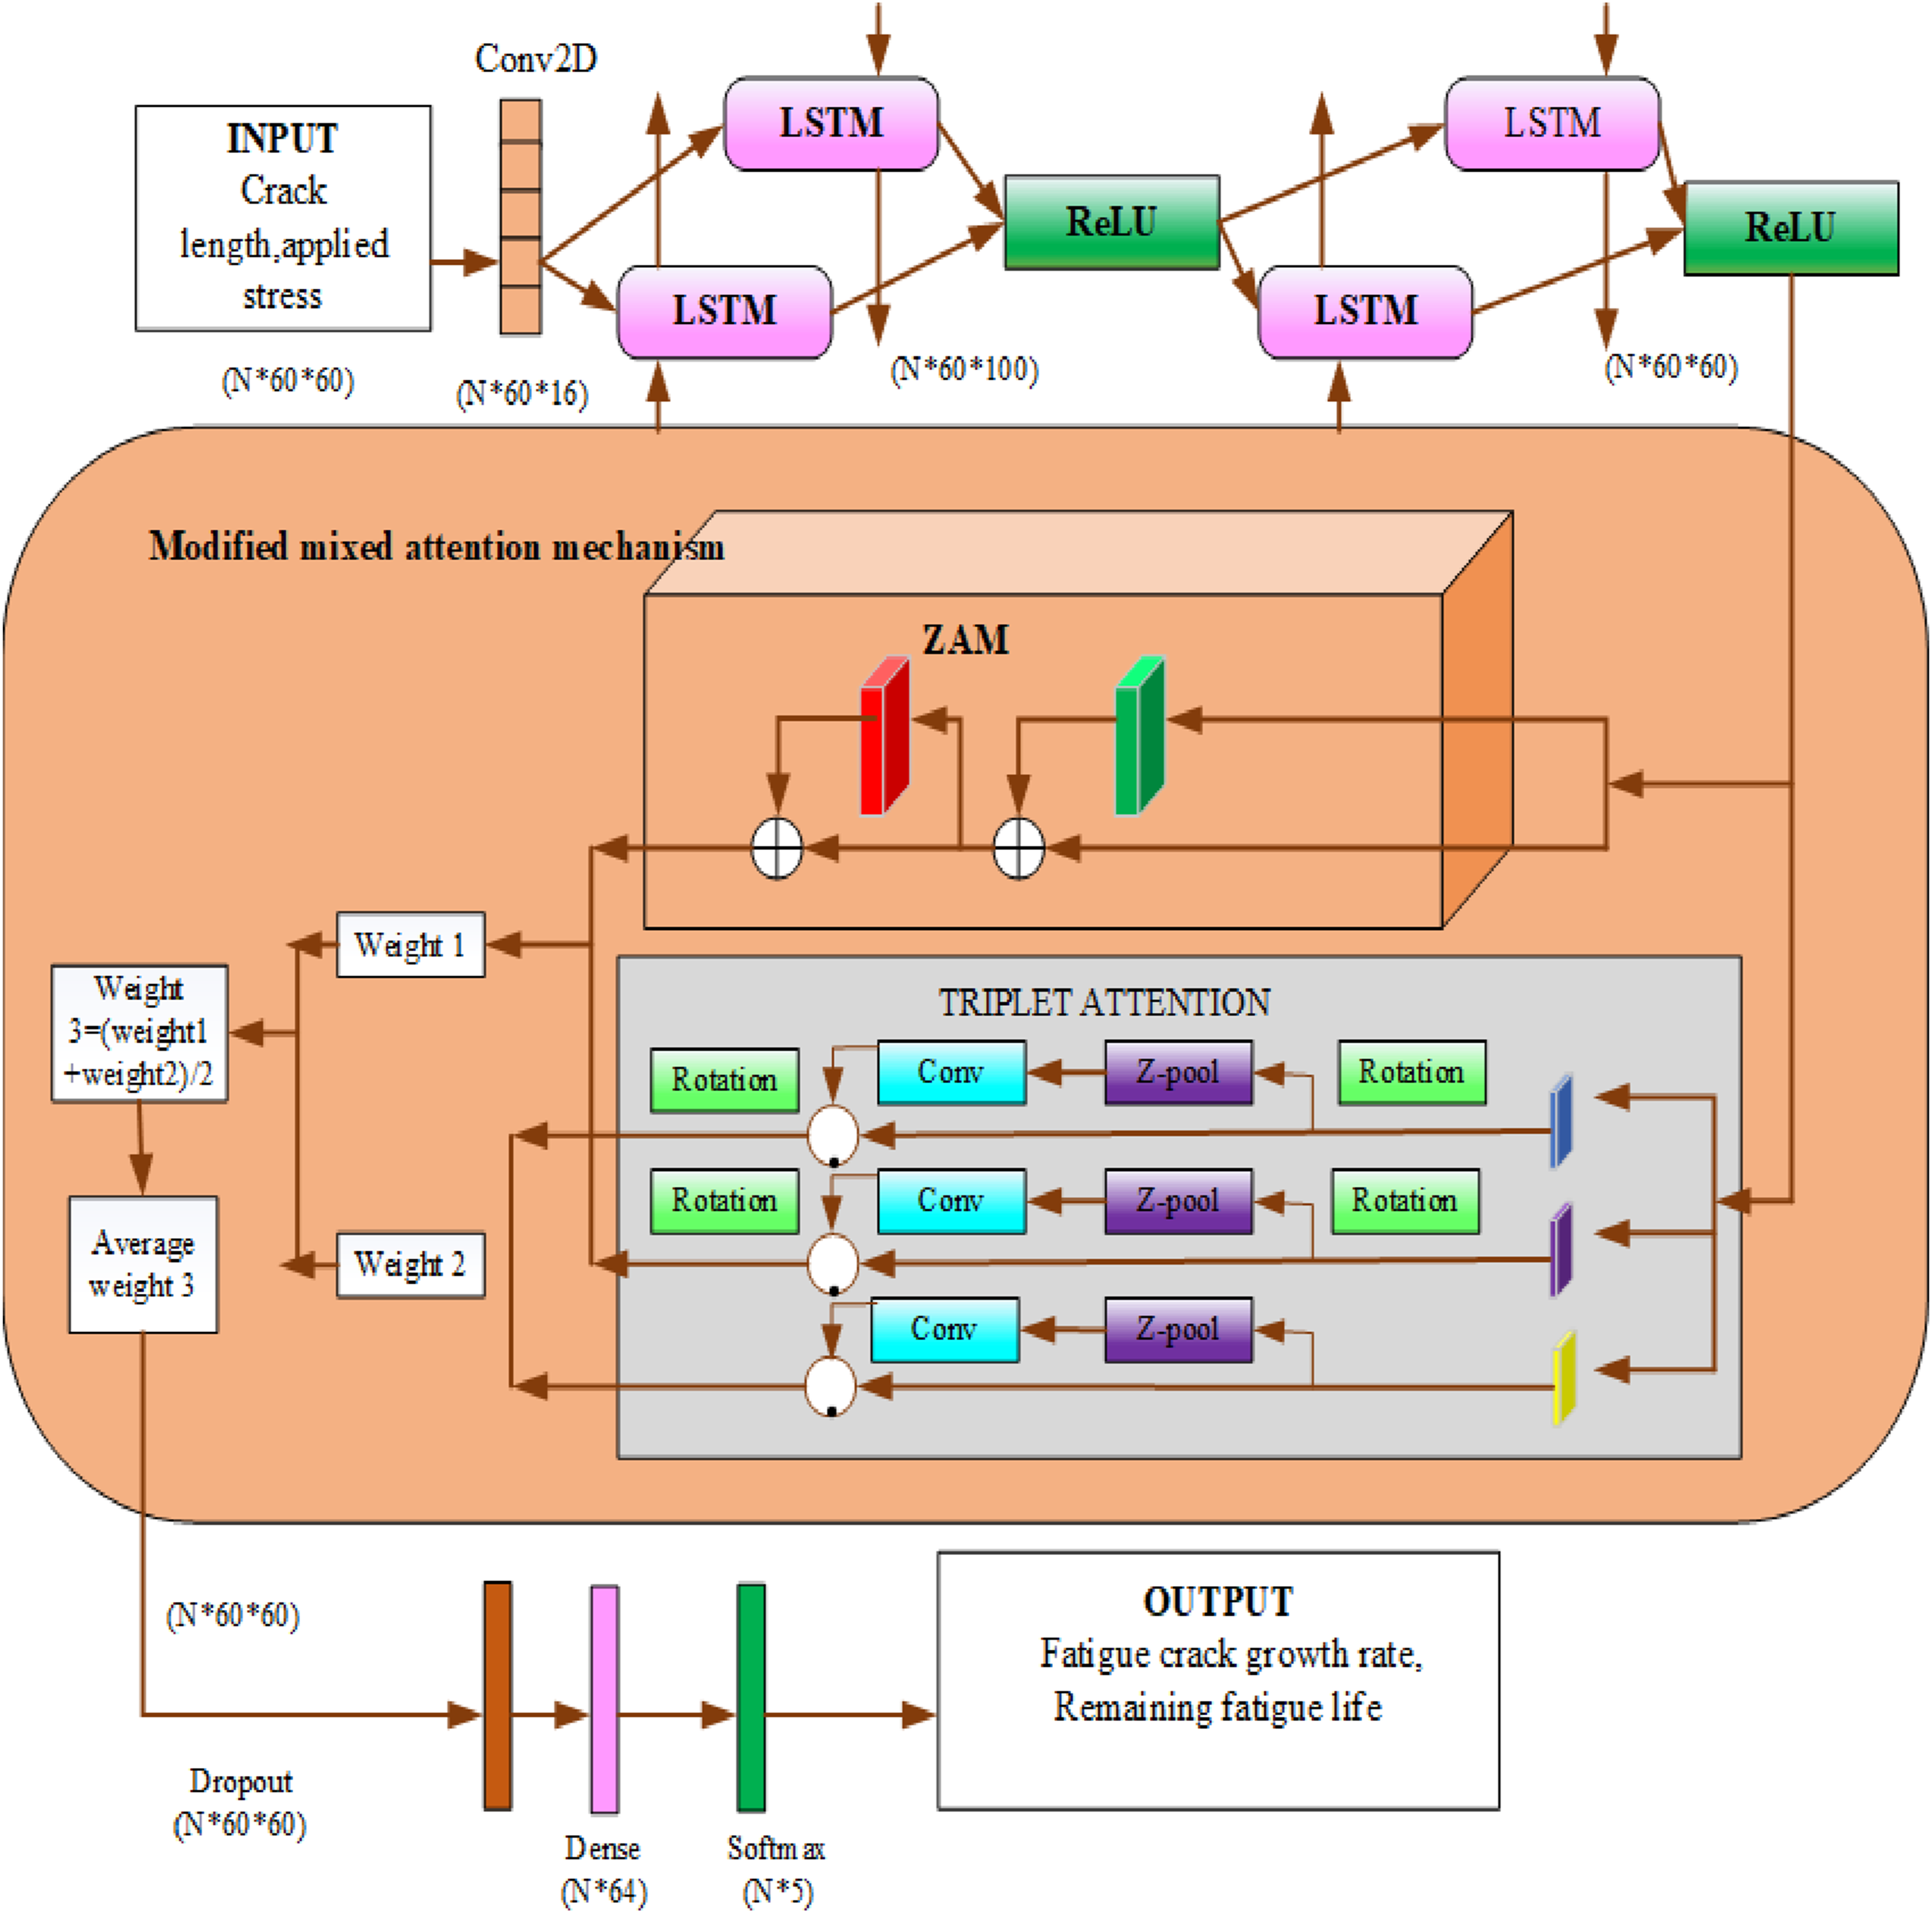
V-shaped and S-shaped binary divine religious algorithms (bDRA)
In continuous bDRAs, followers are updated by arithmetic rules such as addition, subtraction.
34
In binary bDRA, addition/subtraction is not possible directly but pass it through a transfer function and flip bits with a probability given by a transfer function. S shaped update based on a sigmoid curve. The transfer function is
The update rule for bDRA is given as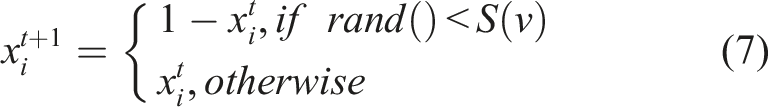
V shaped is based on absolute transfer functions: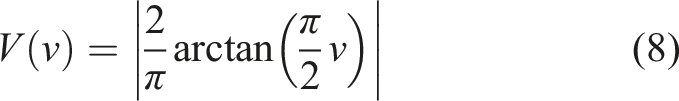
The update rule for bDRA is given as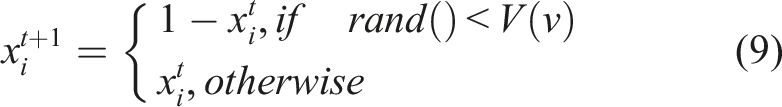
Figure 5(a) shows the V-shaped transfer function, defined as Families of transfer function (a) V-shaped and (b) S-shaped.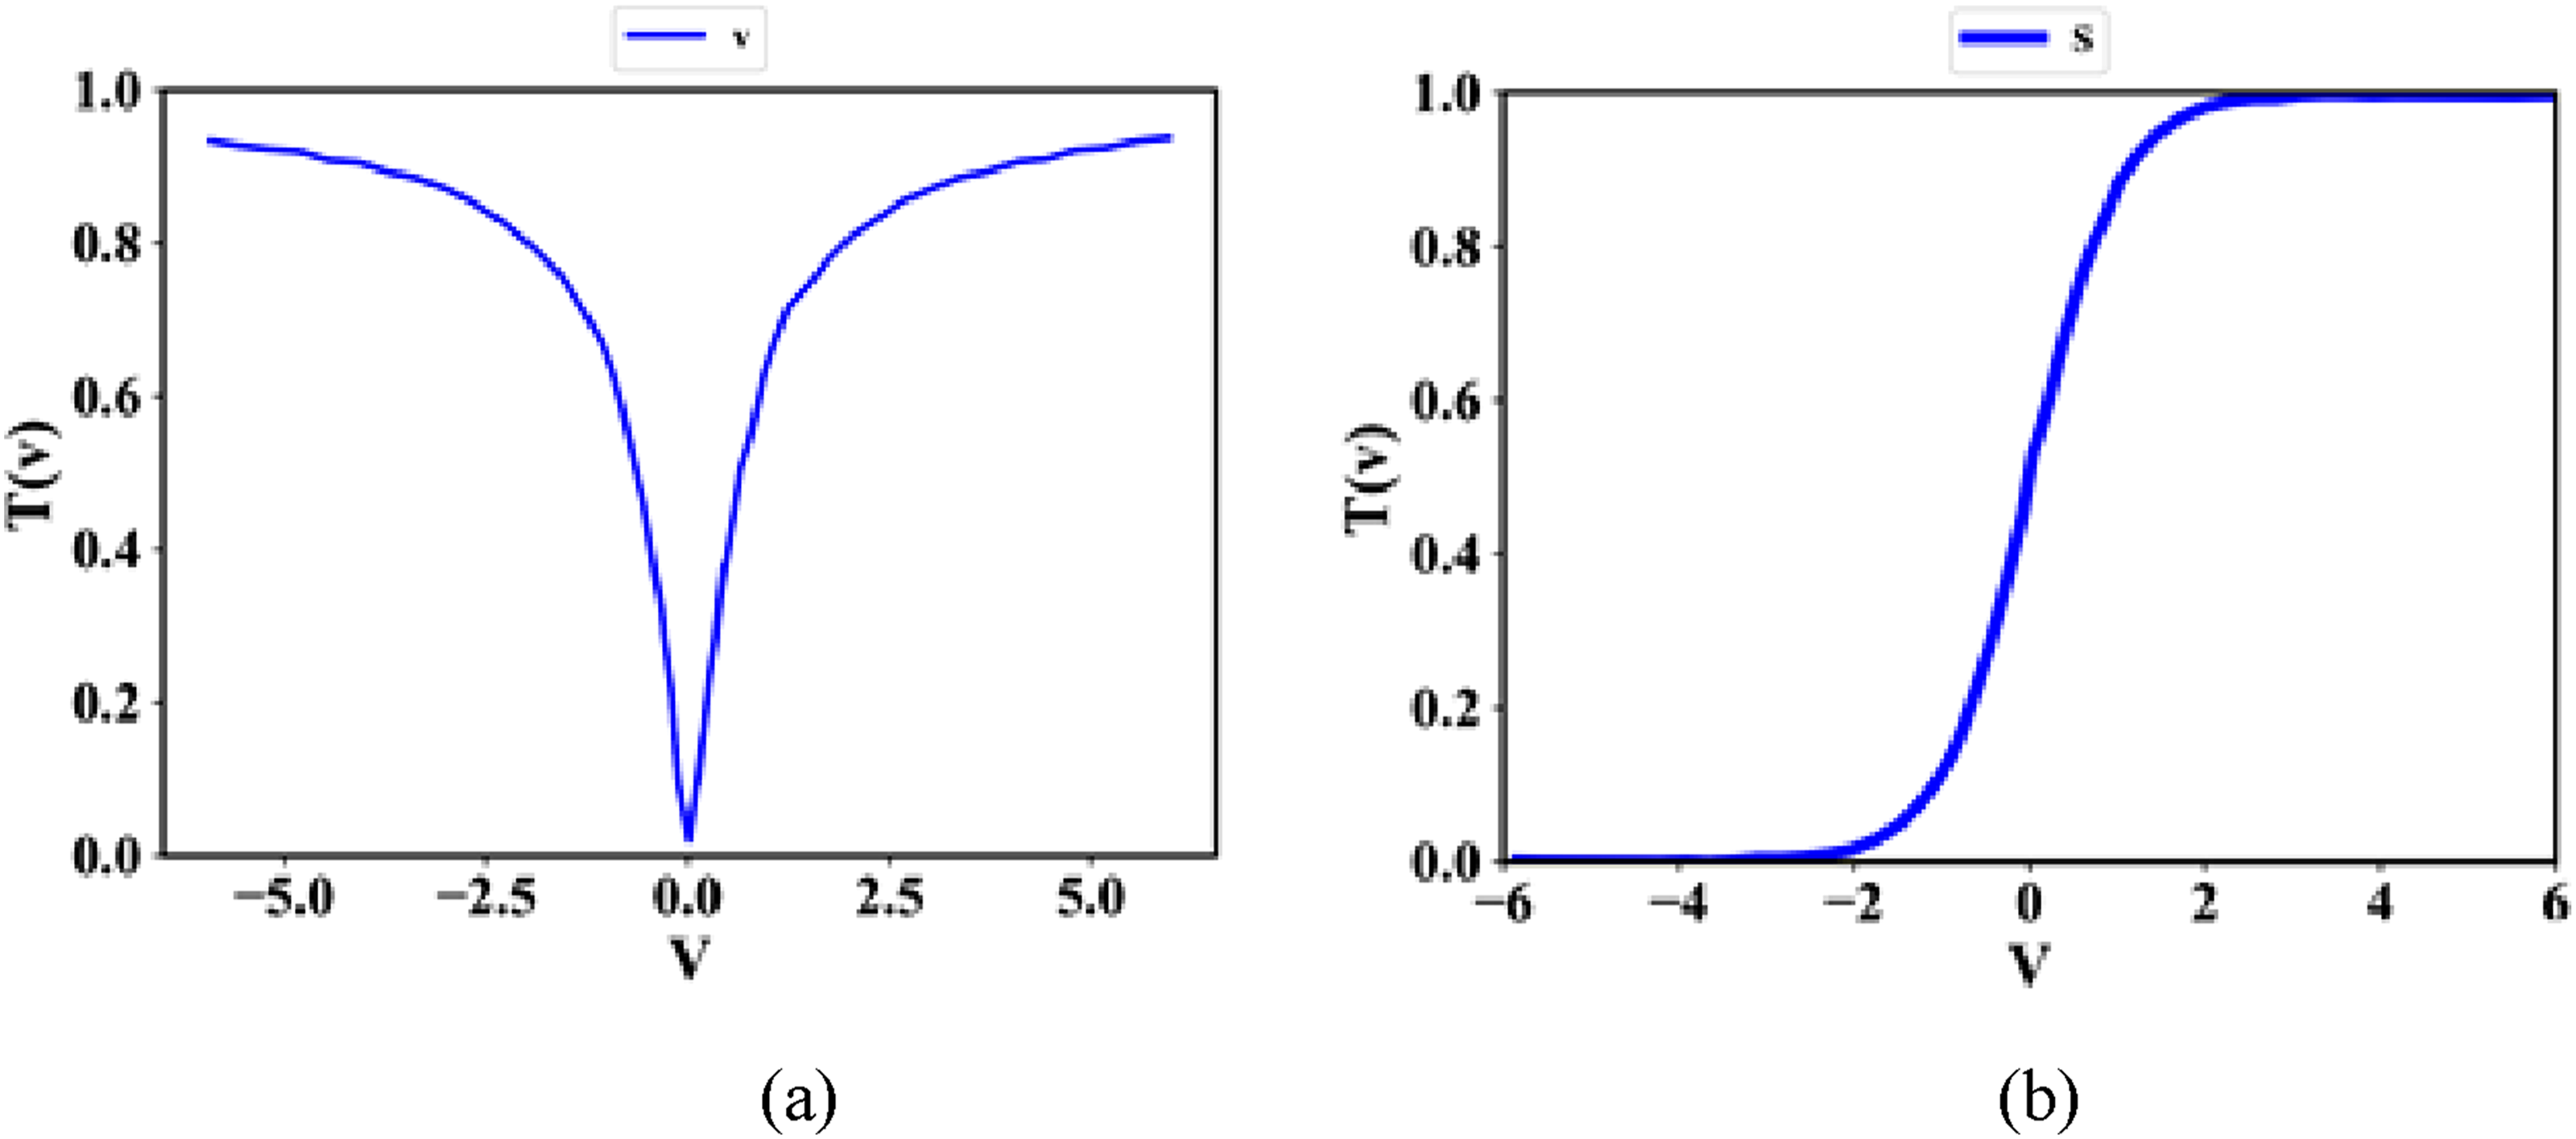
Two families of transfer functions are depicted in Figure 5 with the transfer functions,
Mathematical model (Distributing missionaries among communities)
Assume that there are 

Finding the most well-known follower
According to the suggested algorithm, the most notable follower is the one with the highest believe values.
Bringing in a new follower
Joining the religious community is always open to new members. Two operators, proselytism and miracles, are defined to model this. A freshly attracted follower only has one of these two operators used at once.
Selection operator
It takes a set of fundamental beliefs to draw in a new follower. Candidates with exceptional beliefs in one or more aspects occasionally draw notice.

Miracle’s operator
Religious leaders possess unique powers that allow them to draw in new followers. The community may gain new members with diverse beliefs as a result of these miracles. As a result, current adherents religious views grow stronger and the perform better and hold better positions in the religious community.
Proselytism operator
A religious missionary’s goal at this point is to get others to share the beliefs. This stage of exploitation has the potential to be successful in achieving the global optimum.
The suitability of a new follower
The fitness is evaluated after generating the belief vector of the newly joined follower attempting to enter the community.
Rewarding or penalty operator
Some followers are chosen at random or based on performance, and either rewarded or punished in order to foster a competitive environment. This may result in the following individuals performing at a higher level.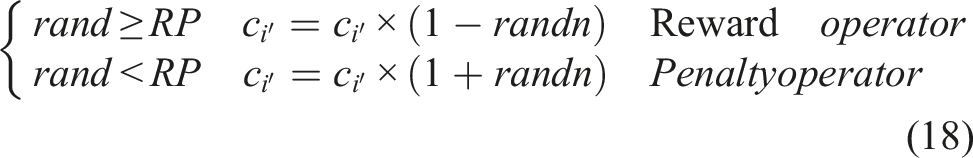
Updating a follower’s belief profile
The weakest follower’s belief vector or the follower’s repeated belief vector is used for replacement.
Replacement operator

Figure 6 illustrates the process starts with the initialization of parameters and belief profiles for the individuals, followed by sorting these profiles based on the fitness values. Groups are then created, and each group is assigned a missionary to lead a division of followers. The group leader is defined as the most prominent individual, and followers are absorbed into the group under the missionary’s guidance. A decision is made based on a random probability comparison Algorithm process for the proposed approach.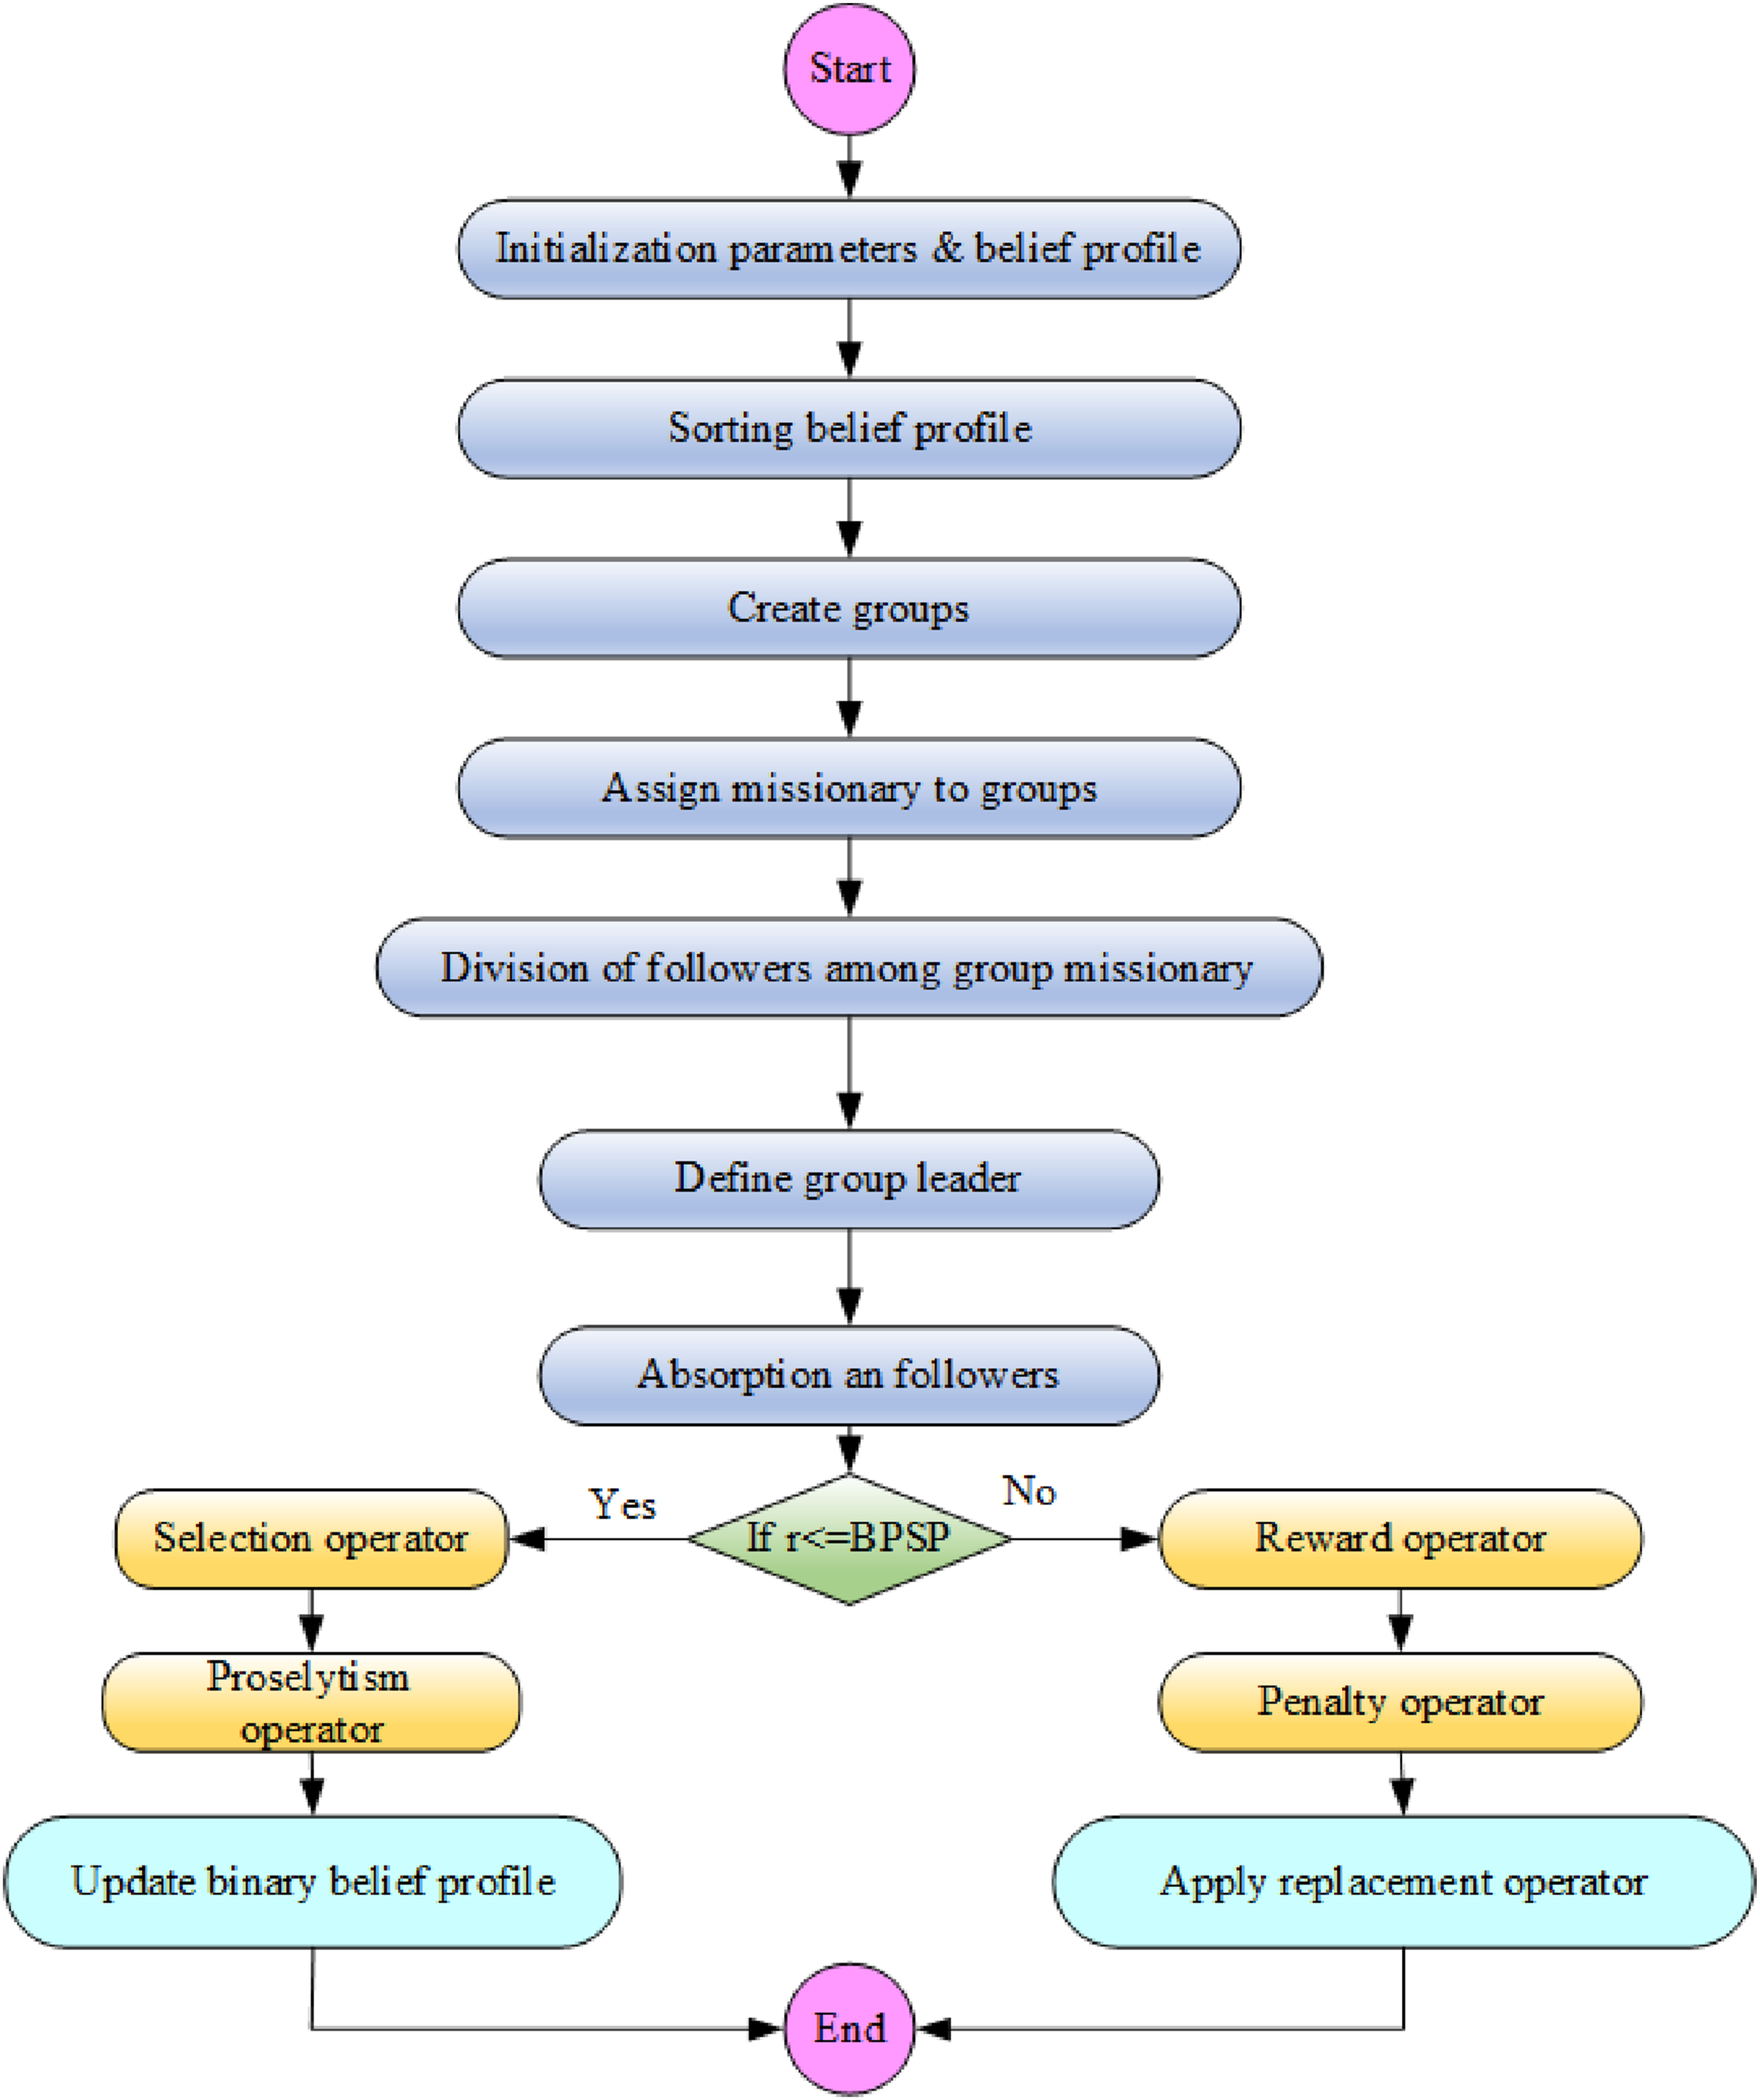
Results and discussions
The results accurately predict both fatigue crack growth and fatigue behaviour of the developed composites. The proposed model is implemented on the Python platform and compared with existing approaches to evaluate its predictive capability. The obtained results demonstrate that the proposed framework enables a more detailed and reliable evaluation of the fatigue performance of HGM- and SiC-reinforced aluminium composites.
Figure 7 depicts the fatigue crack growth behavior of three different specimens (labeled 1, 10 and 15) and the length of the crack (a) grows with the number of load cycles (N) applied in millimeters. In the first case, the length of the crack in all three specimens begins at about 2 mm and grows gradually. Nevertheless, the rate of crack growth increases at a high rate in the late stages as the number of cycles increases between 0 and 10,000 cycles. Growth curves for fatigue cracks in specimen 1, 10 and 15.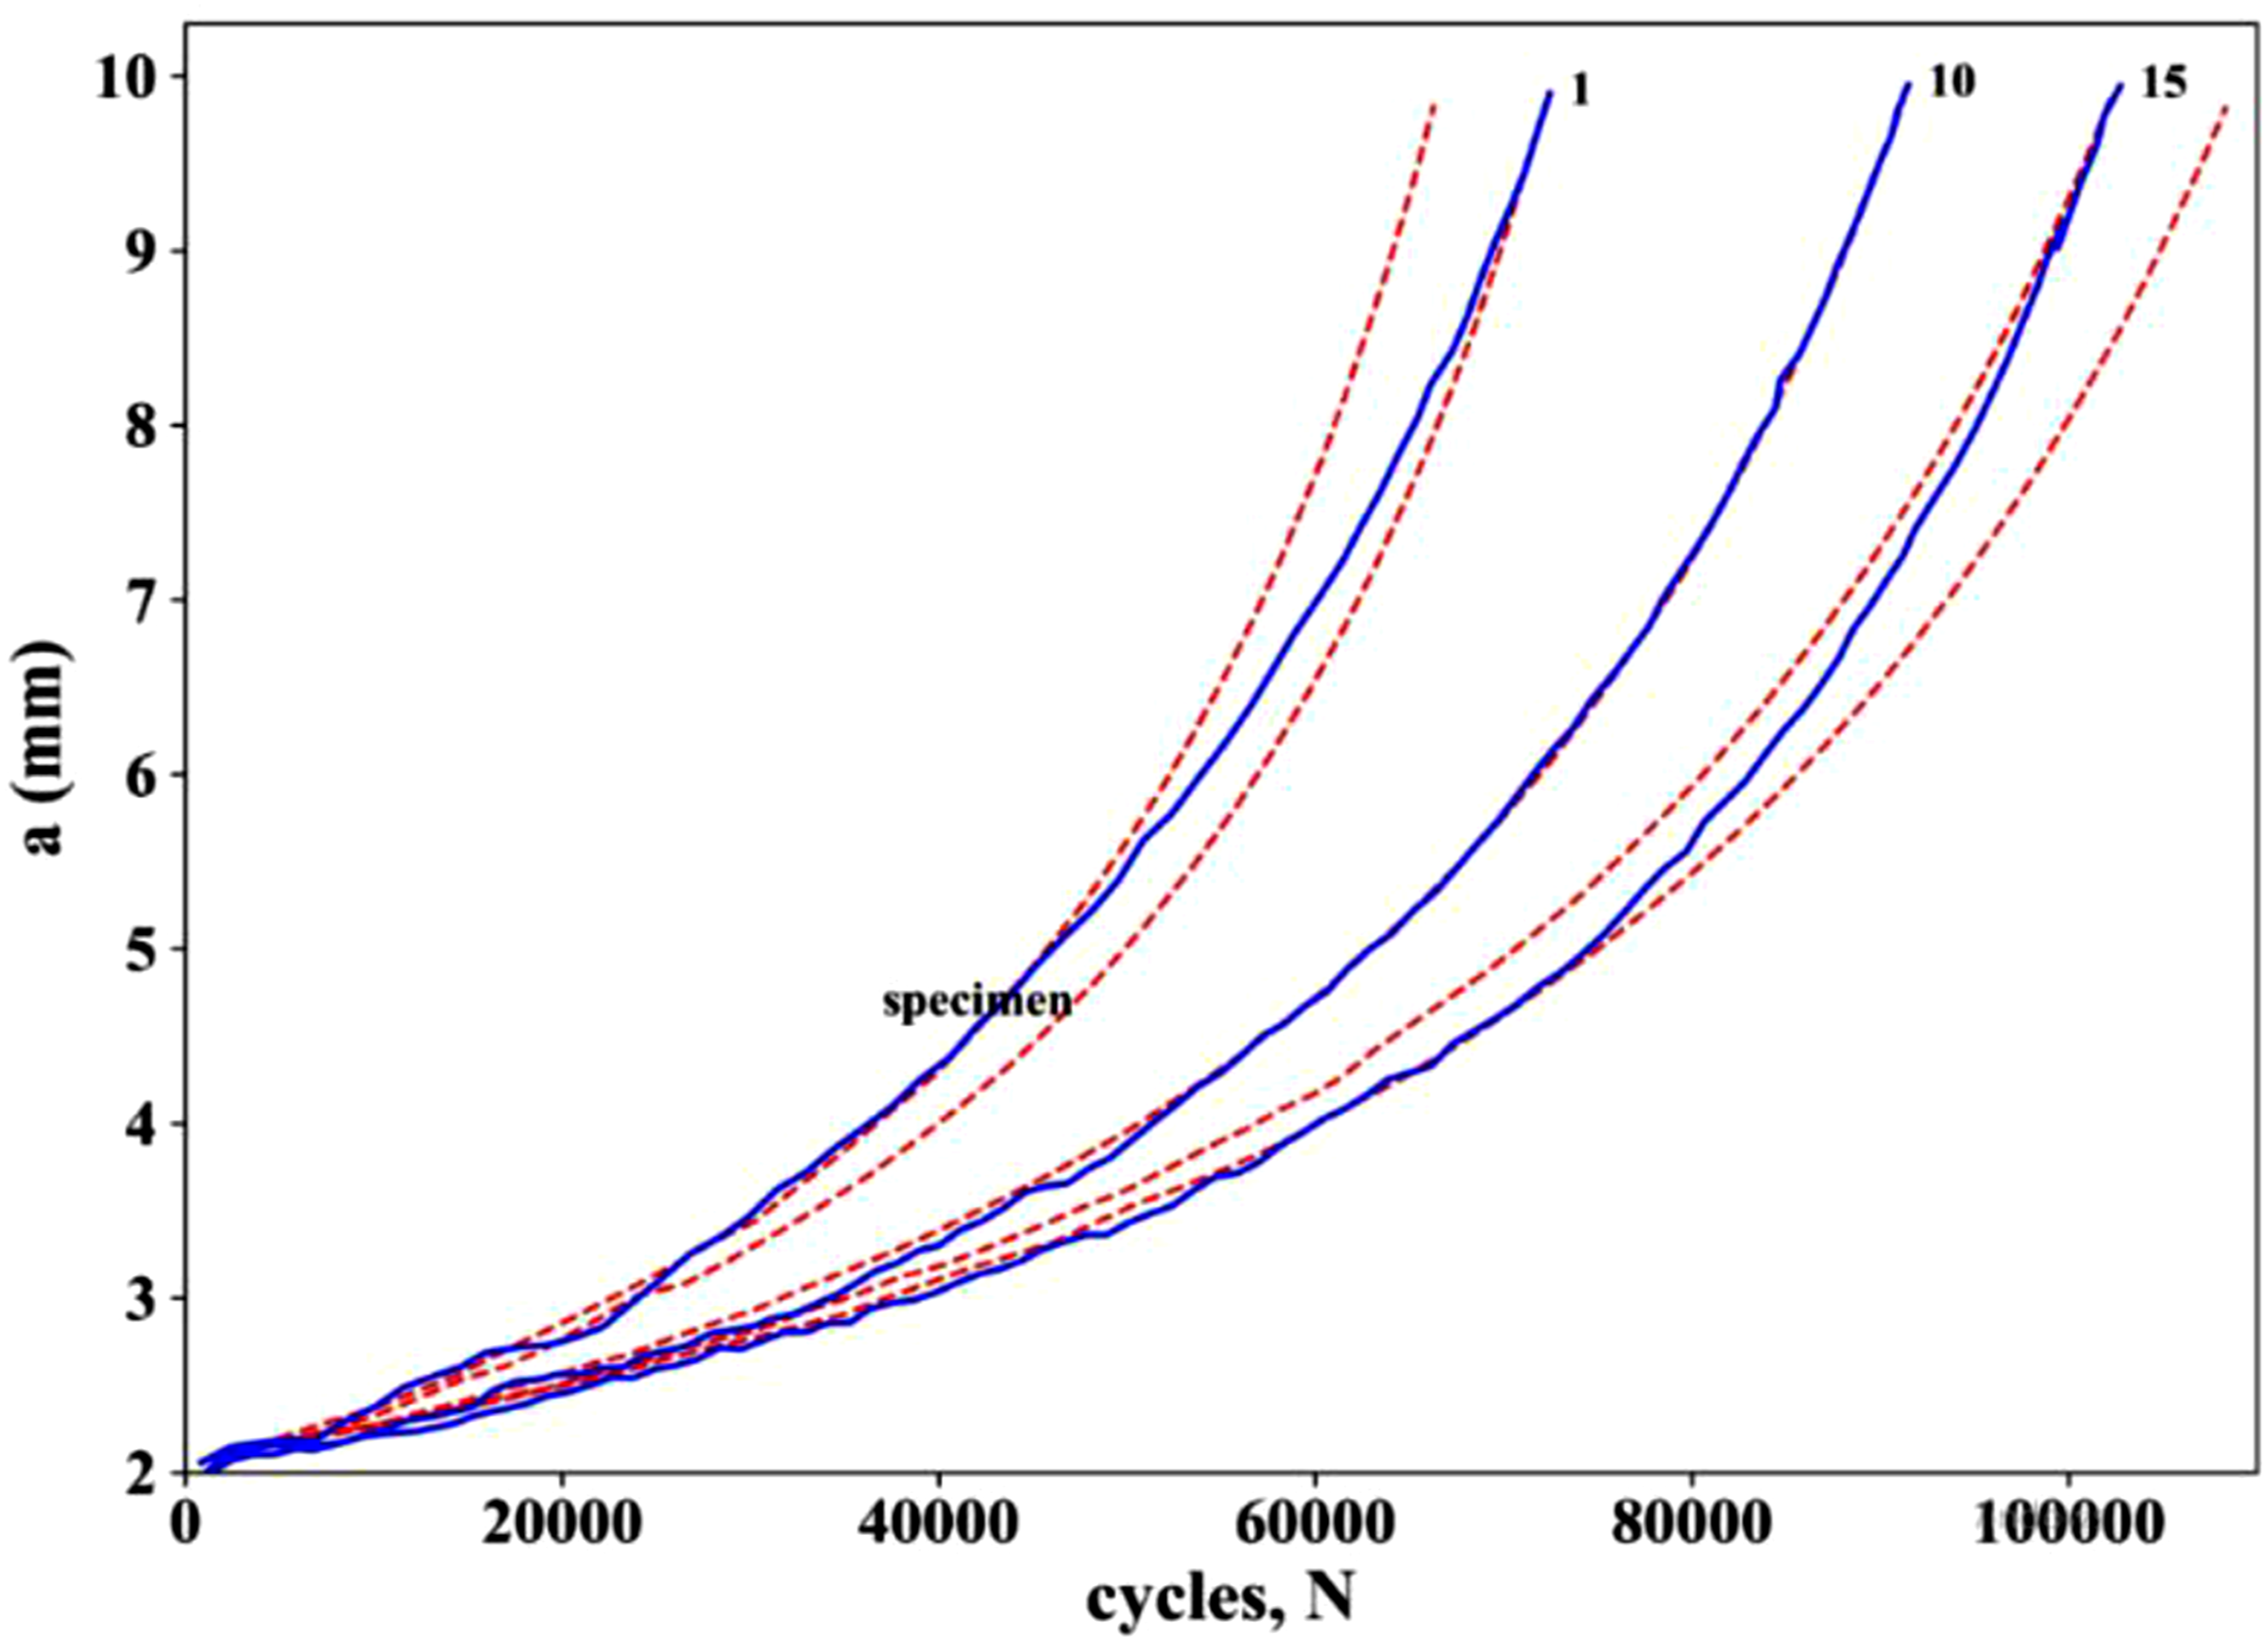
Figure 8 shows that as the period thickness increases with the material considered to be Al, hardness and elastic modulus decrease. The material has a hardness of approximately 42 GPa and an elastic modulus of approximately 375 GPa with its highest values at the lowest period thickness tested of 4 nm. These values reduce to about 40 GPa in hardness and 360 GPa in elastic modulus with an increase in period thickness to 6 nm. At higher thickness, the trend is decreasing. At 10 nm, the elastic modulus is approximately 340 GPa, and the hardness is approximately 35 GPa. The characteristics keep on decreasing to approximately 31 GPa (hardness) and 325 GPa (elastic modulus) at a thickness of 15 nm, and finally to 25 GPa (hardness) and 300 GPa (elastic modulus) at the highest thickness of 20 nm. The correlation between the Al materials hardness and elastic modulus and period thickness.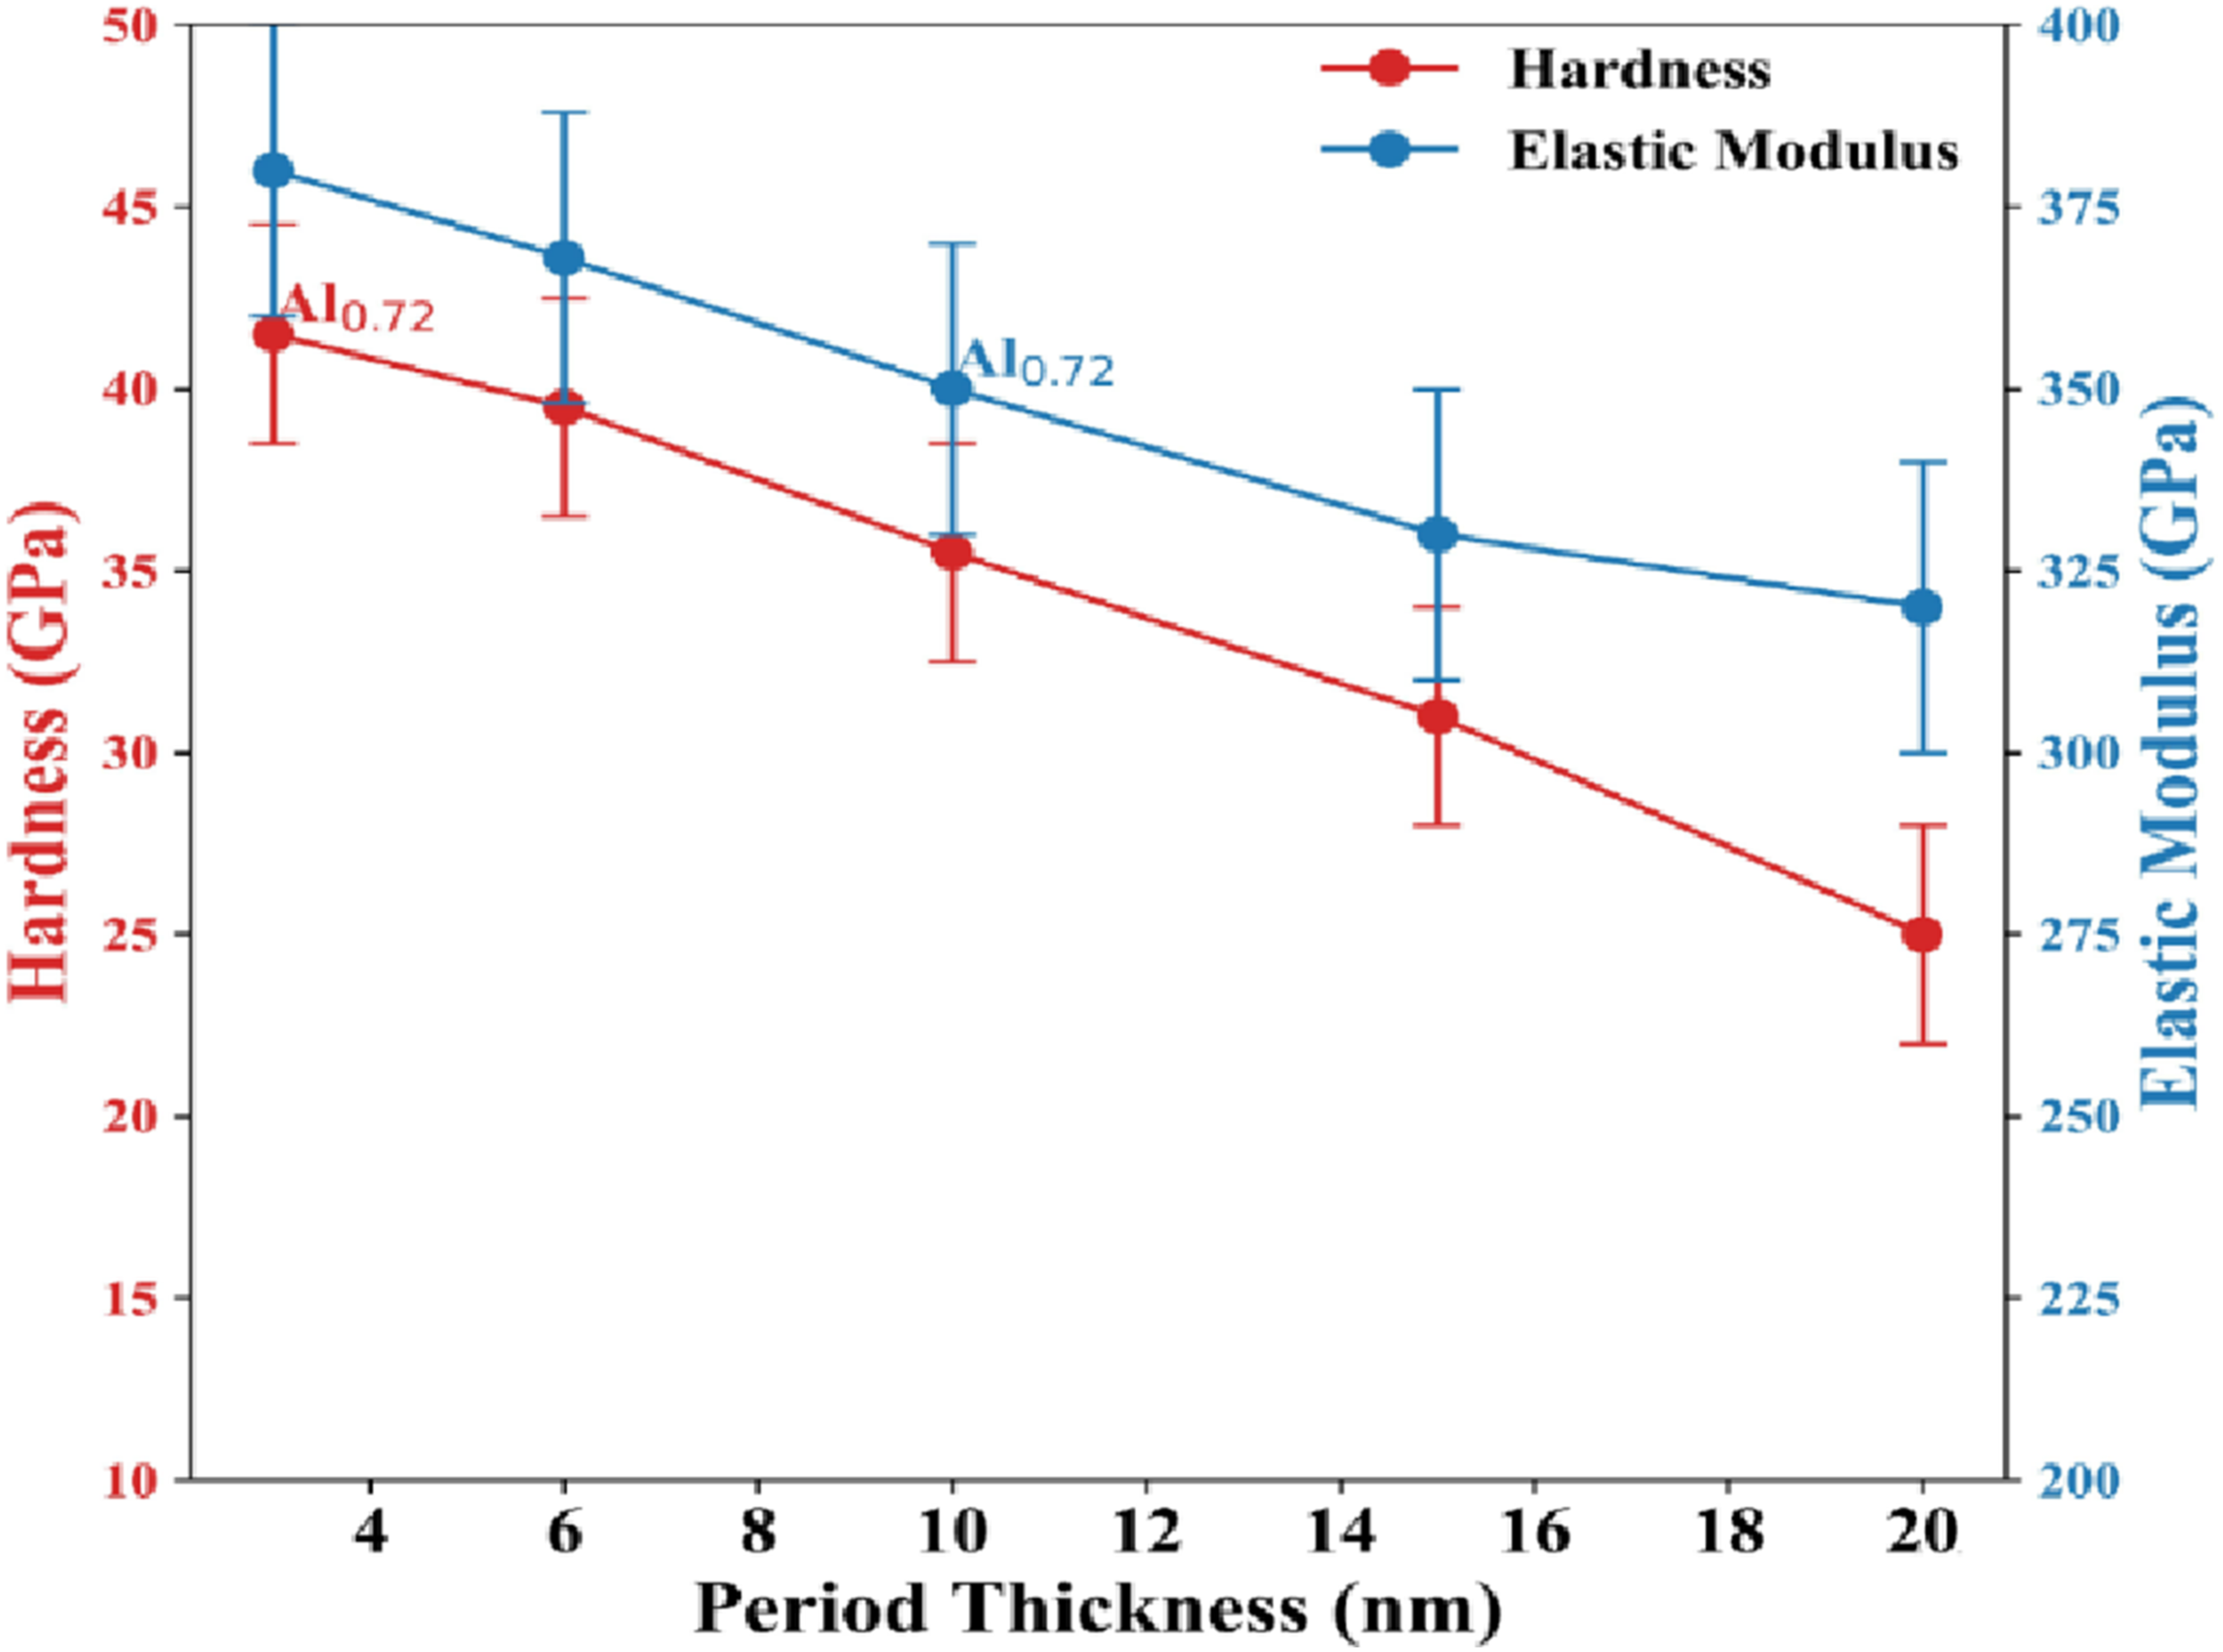
The load-depth curves from nanoindentation experiments on pure Al and five other tests are plotted in Figure 9 as a function of the indentation depth. The curve of mechanical response of pure aluminum is quite different from the other curves (blue, red, brown, green, and orange). The maximum depth of indentation for pure aluminum is about 5500 nm with peak indentation load of about 100 mN. The other curves have shallower peaks in general, from 2800 nm to 3200 nm, with the same load. The results obtained shows that the tested materials have a significantly greater resistance to penetration, and higher hardness and stiffness as compared to pure aluminum. For pure Al, the nanoindentation test produced a load Vs depth graph.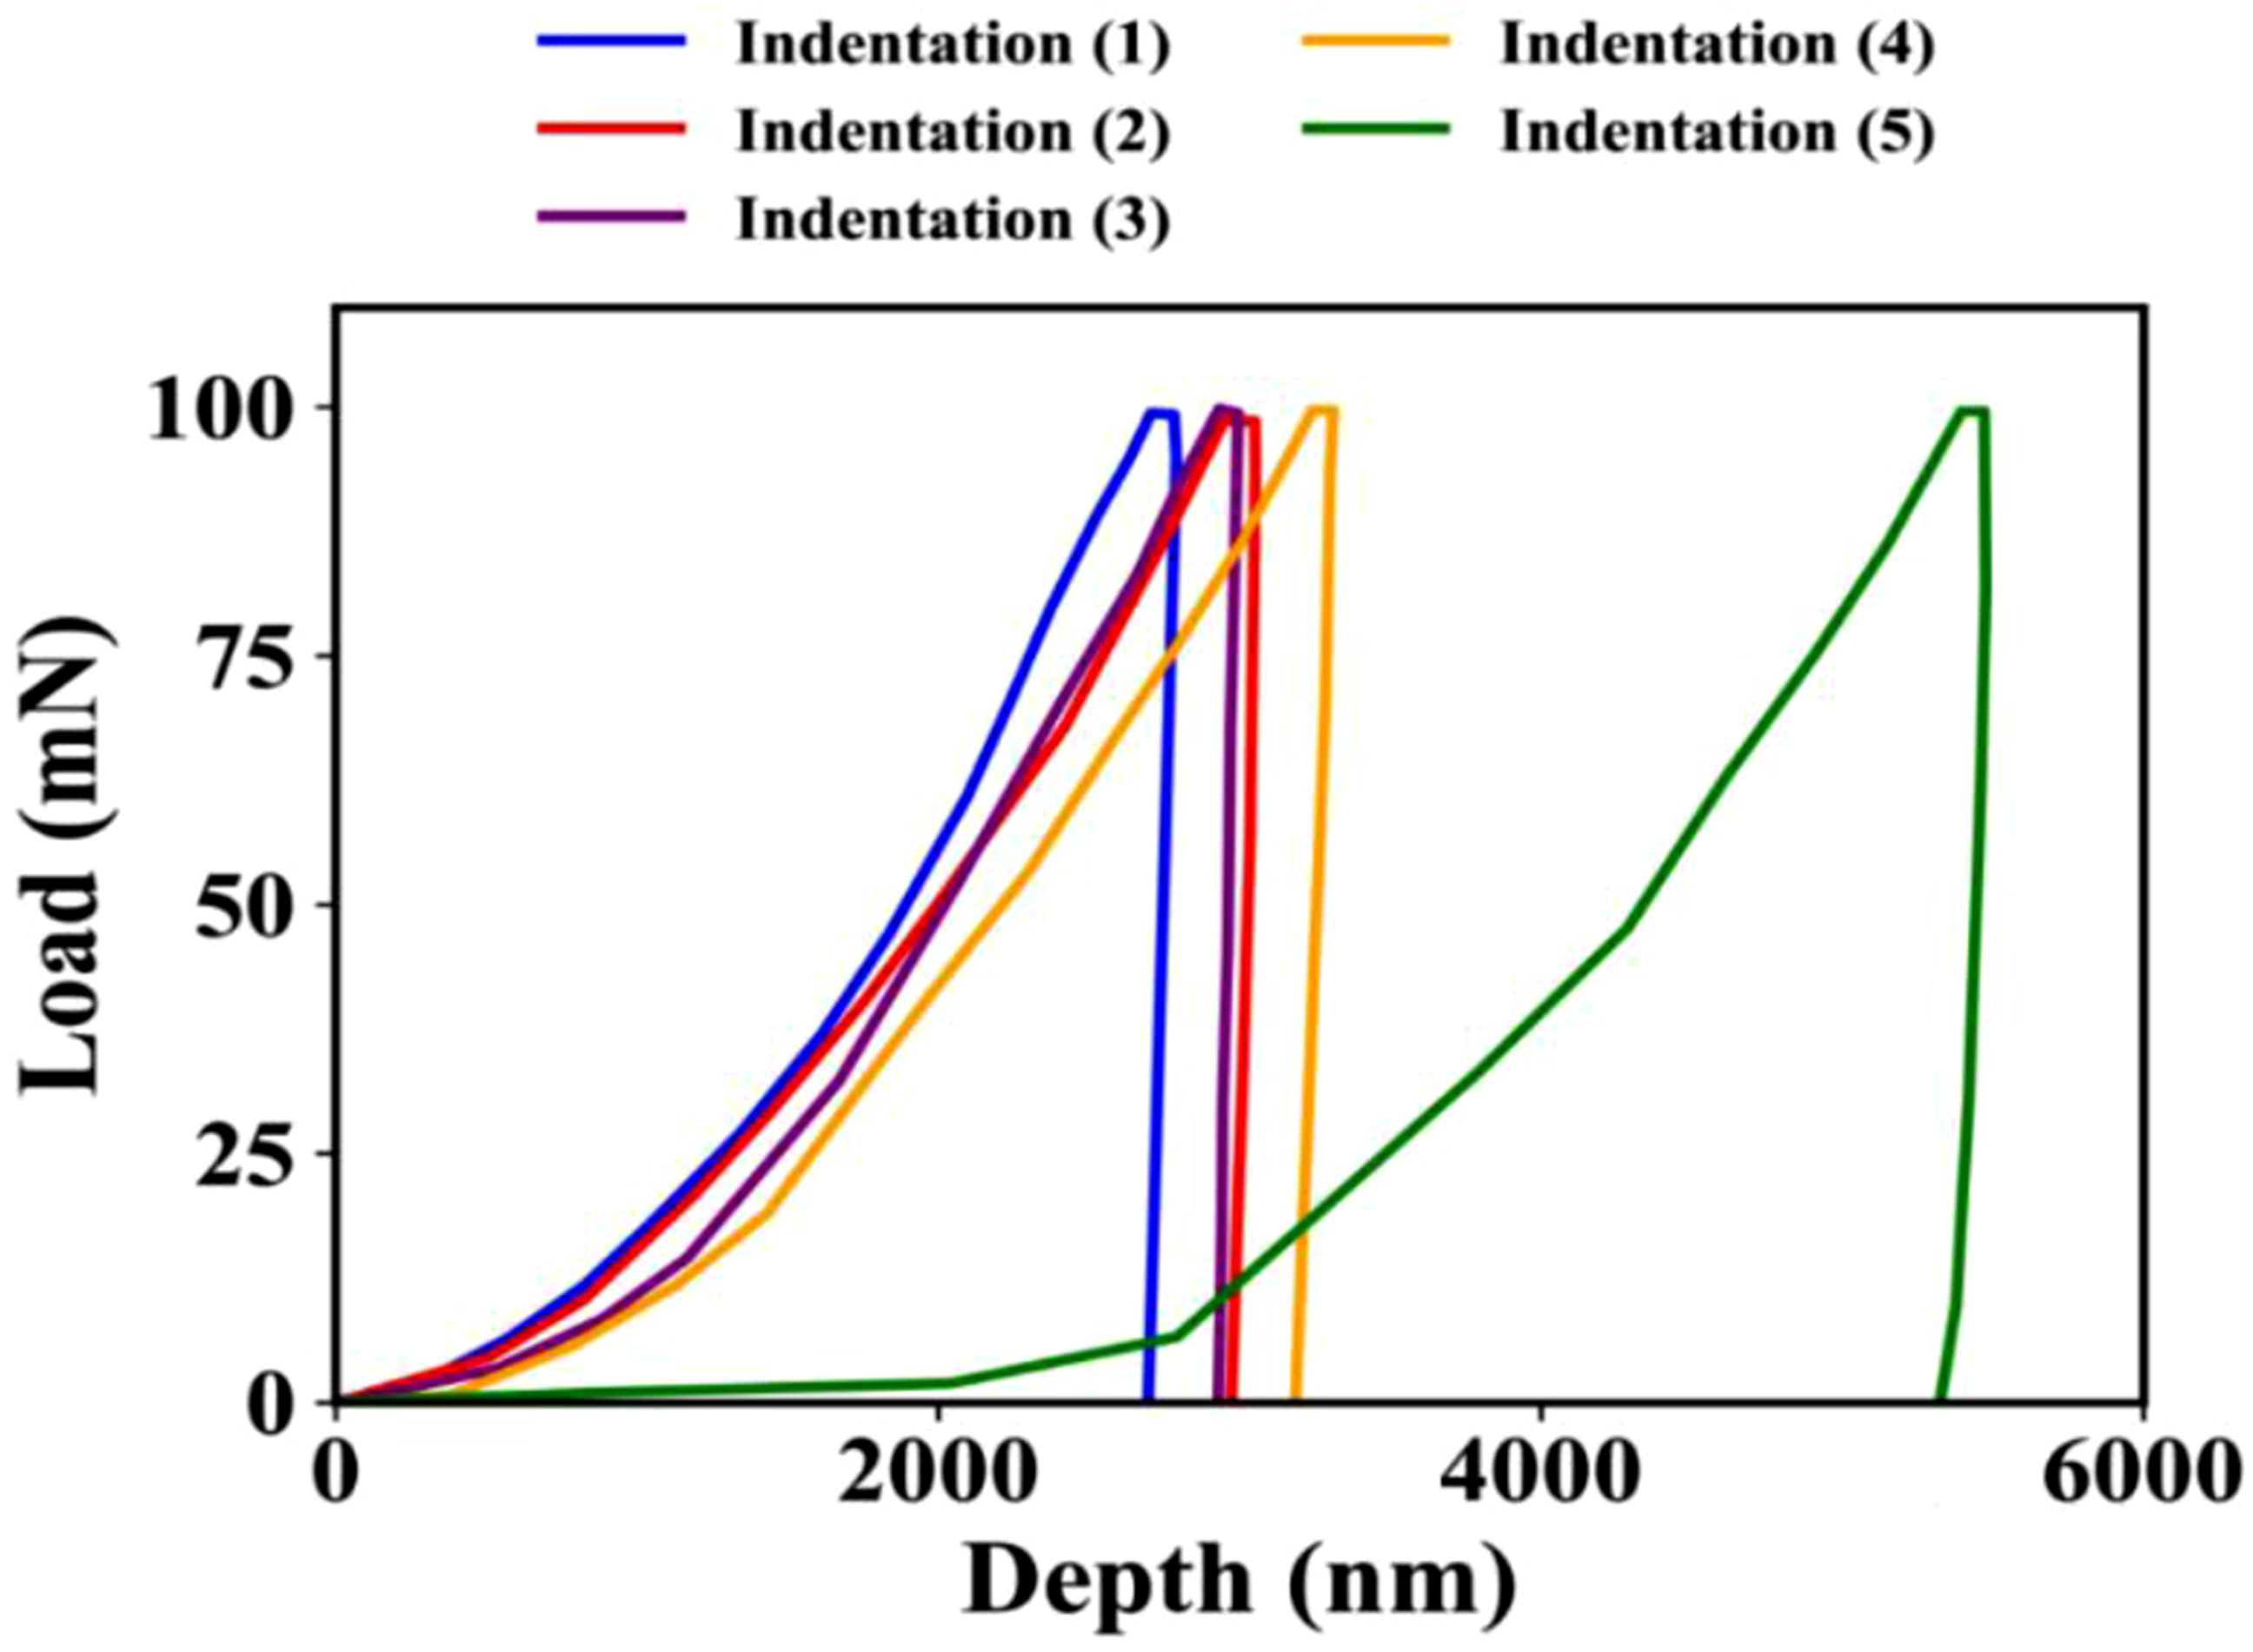
Figure 10 shows five load-displacement curves obtained from nanoindentation tests for Al+5% HGM MMC during loading and unloading. The maximum load applied to each indentation is around 100 mN and each curve shows the indentation depth (nm) changes with the applied load (mN). The range of the maximum indentations is from about 2500 nm up, varying with the properties of the material and the response of the indenter to indentation. The nanoindentation test yielded load Vs depth graph for Al+5% HGM MMCs.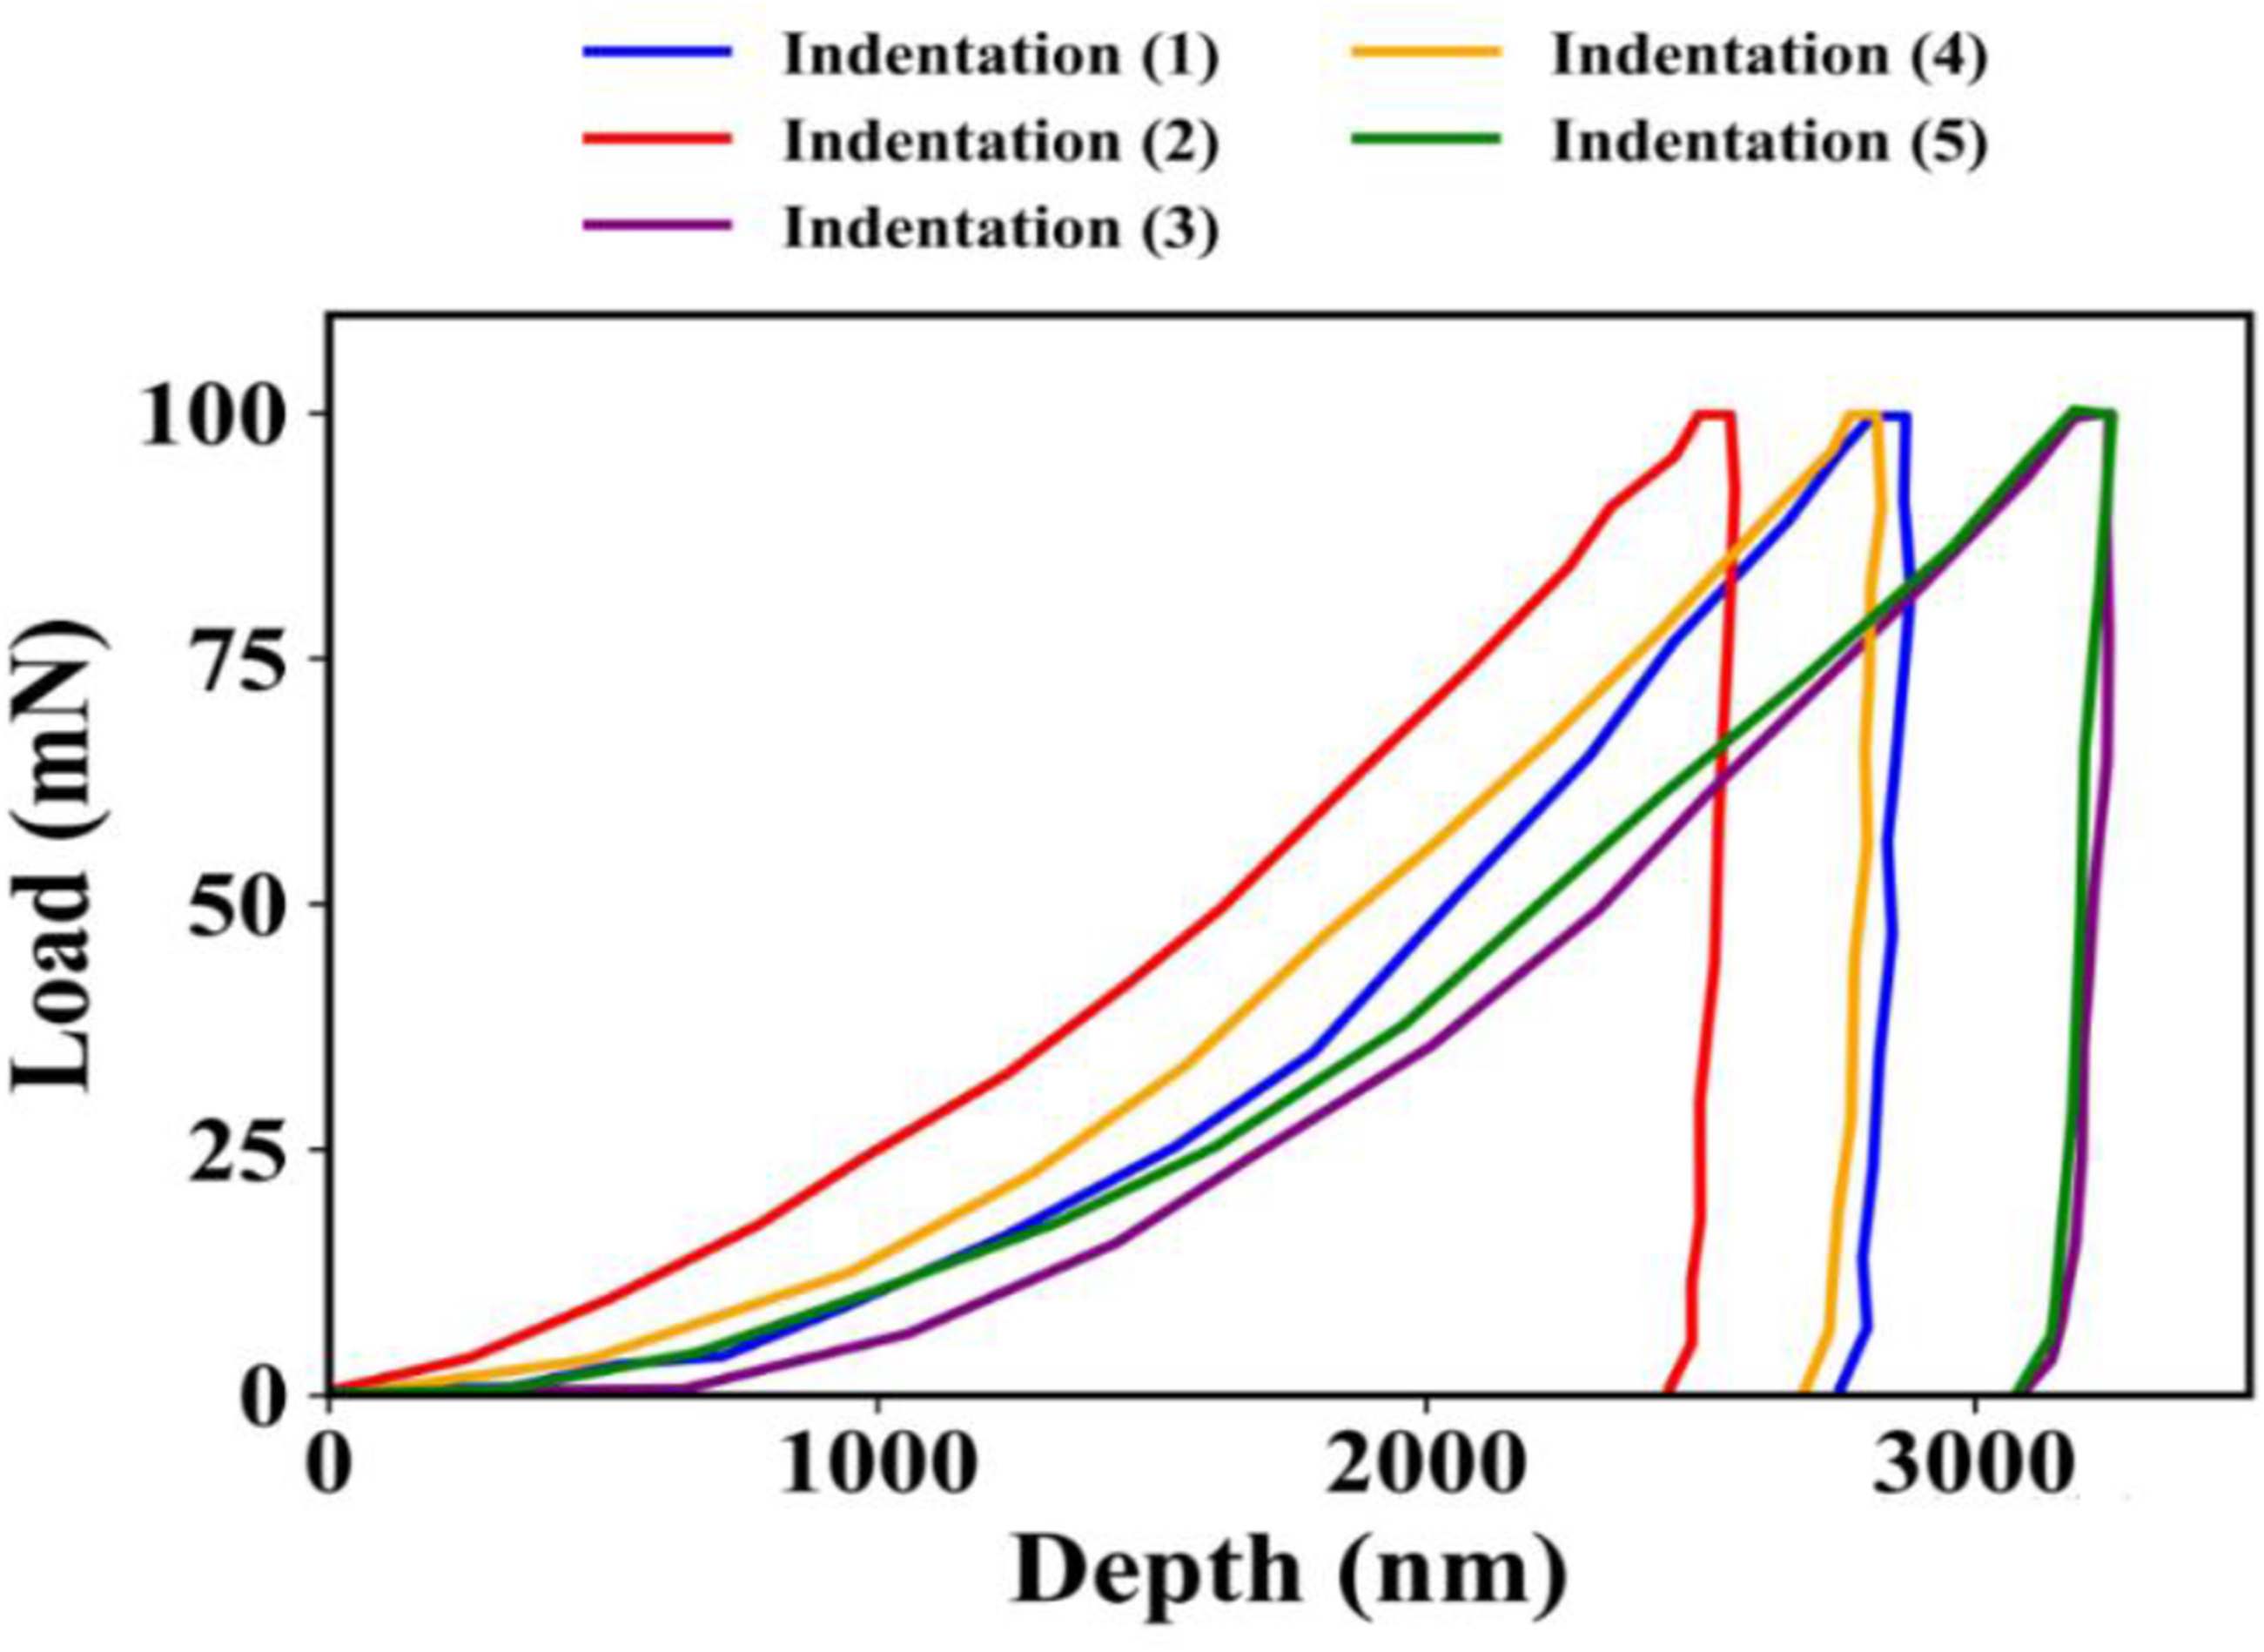
Figure 11 shows 5 nanoindentation tests, with penetration depth (nm) plotted against the applied load (mN). The differences in the load-displacement curves create significant material inhomogeneity. These four tests recover to a residual depth below 1000 nm, and peak to a max load of 100 mN. The fifth test (green) shows significant plastic deformation, with a residual impression depth of over 4500 nm at a peak load of 95 mN, and a depth of plastic deformation greater than 5000 nm. The nanoindentation test yielded load Vs depth graph for Al+15% HGM MMCs.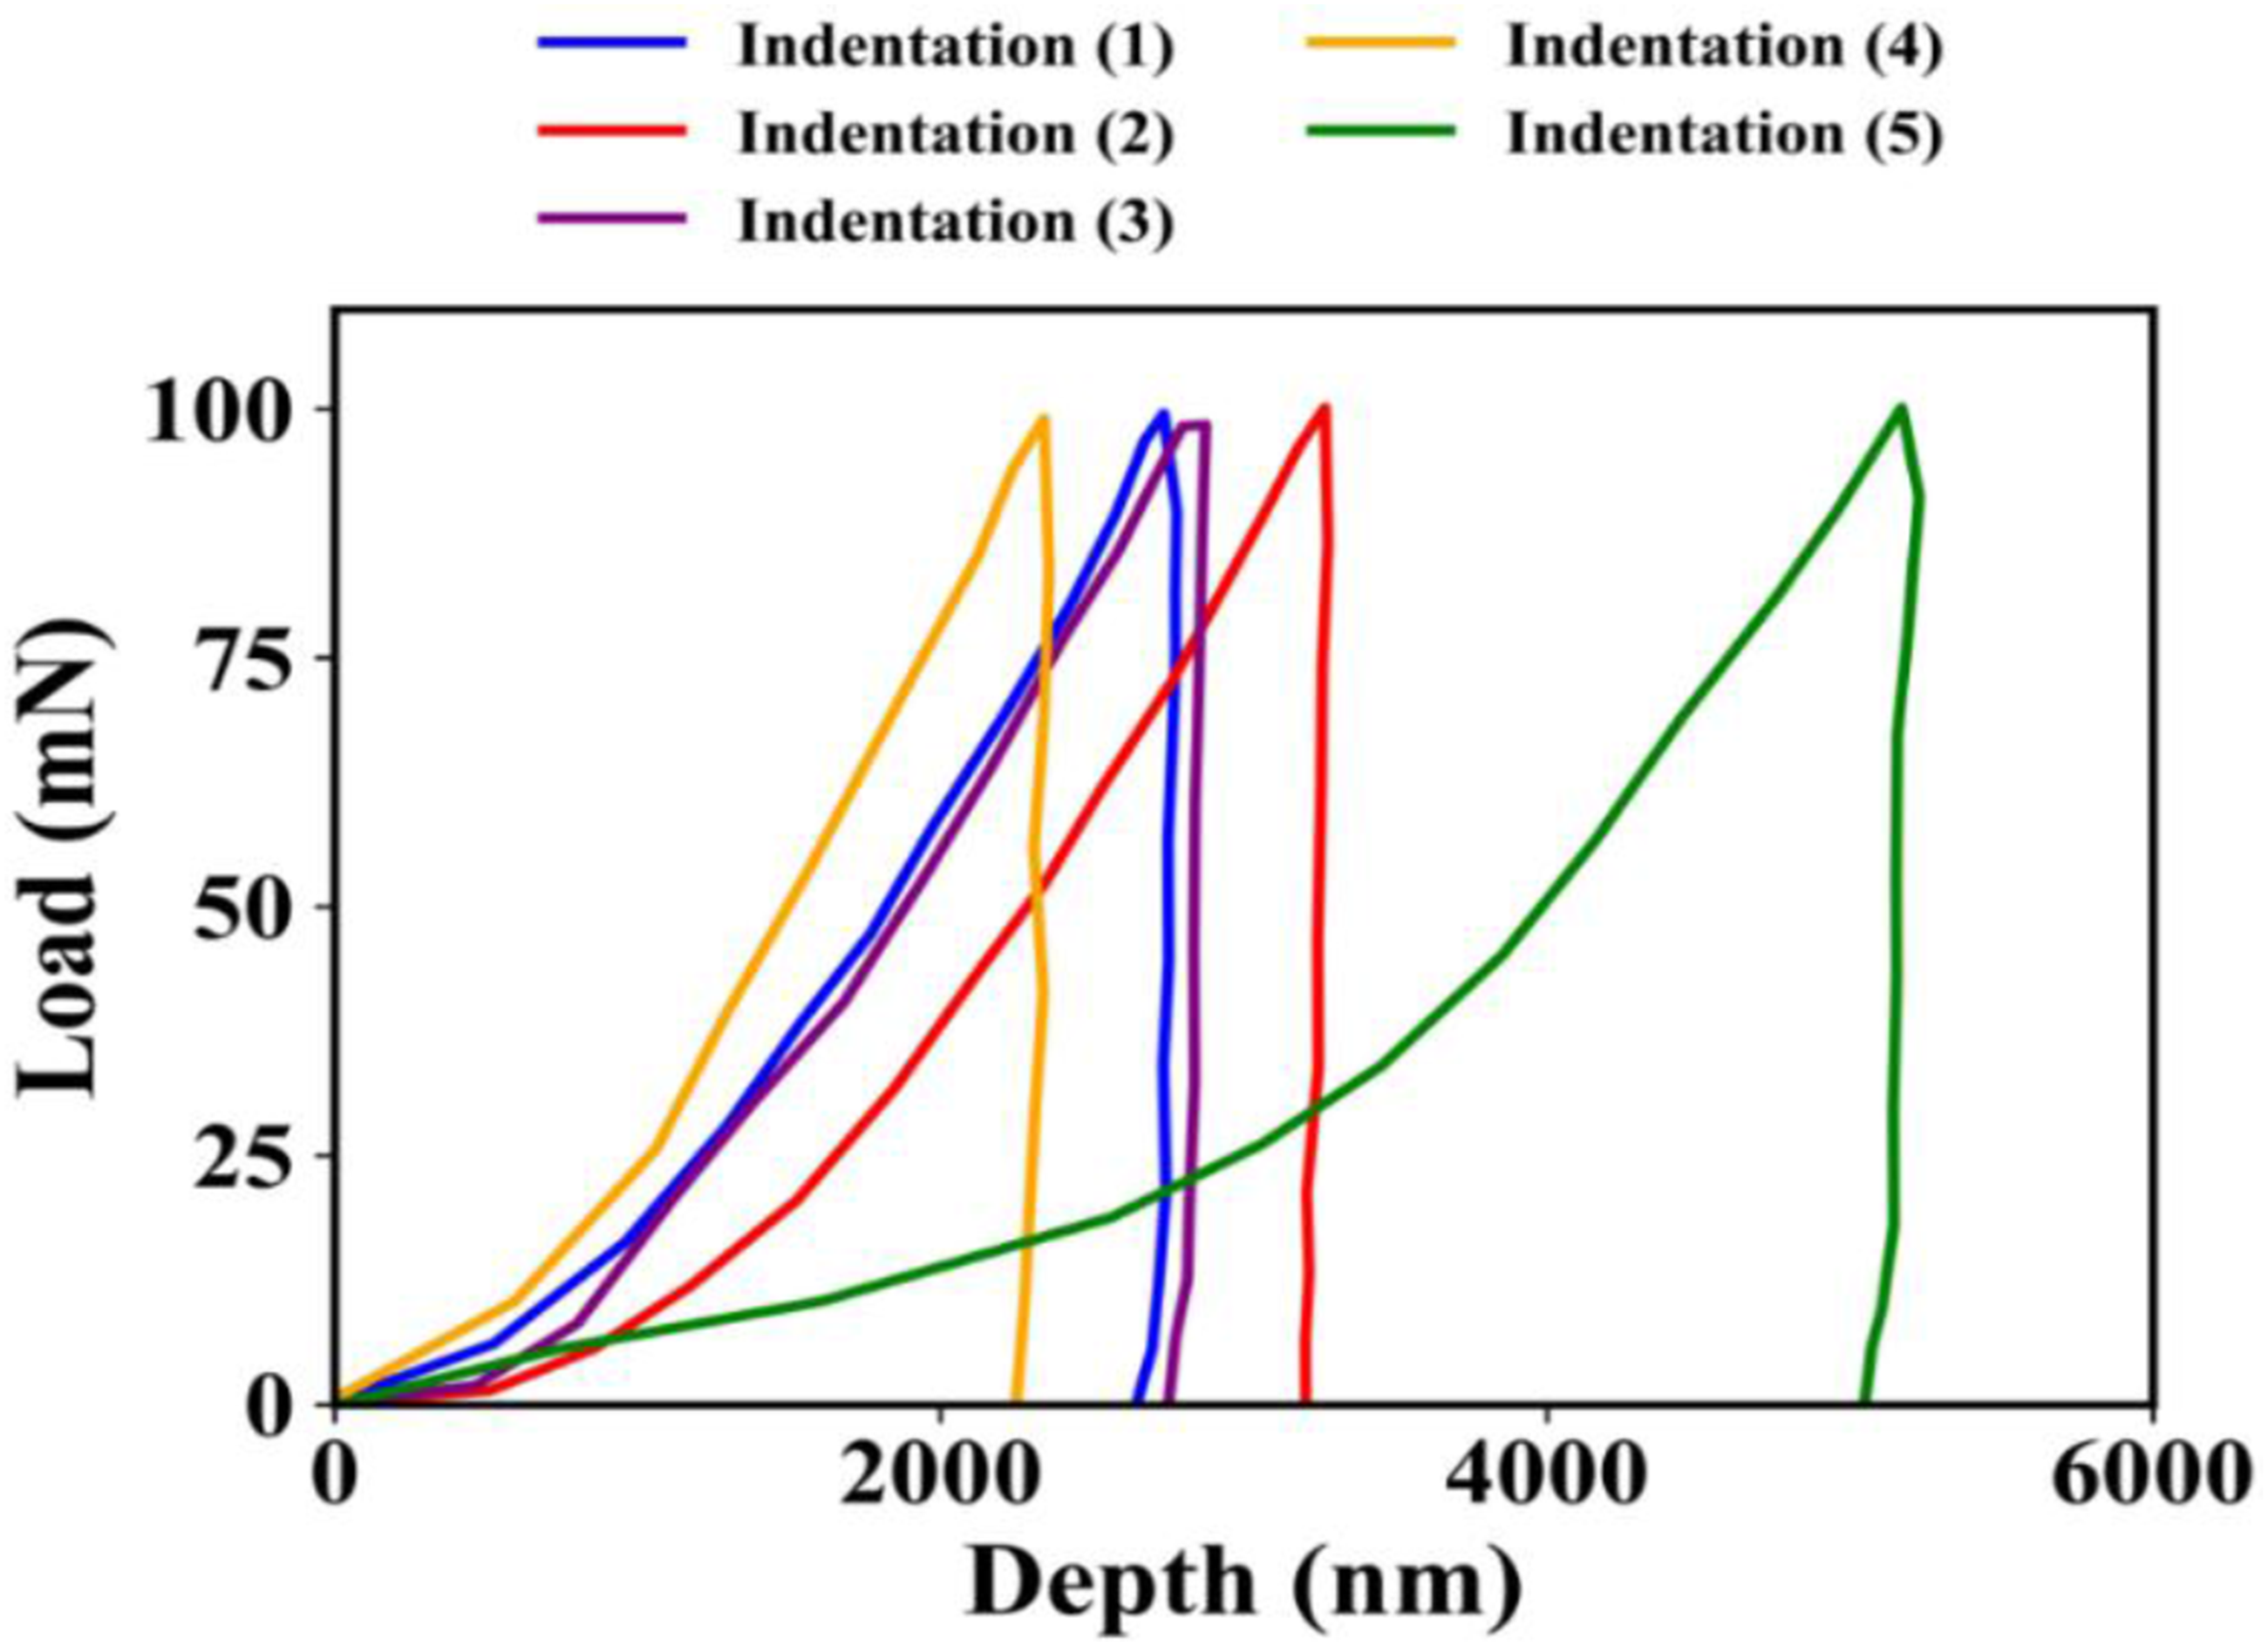
Five nanoindentation experiments are shown with the loading-unloading data in Figure 12 for a heterogeneous material. The softest area (lowest indentation) is shown in section 4, with a maximum depth of more than 5200 nm under 100 mN stress, and the largest permanent deformation upon unloading, which demonstrates high plastic deformation. By contrast, the latter (indentation 5) exhibits the hardest and stiffest response, the smallest residual indentation of 30 nm and a maximum indentation depth of 2600 nm at the same 100 mN load. Mechanical behavior lying between these extremes is represented in indentations (1), (2) and (3), with differing extents of elastic recovery and resistance to deformation. The nanoindentation test yielded load Vs depth graph for Al+30% HGM MMCs.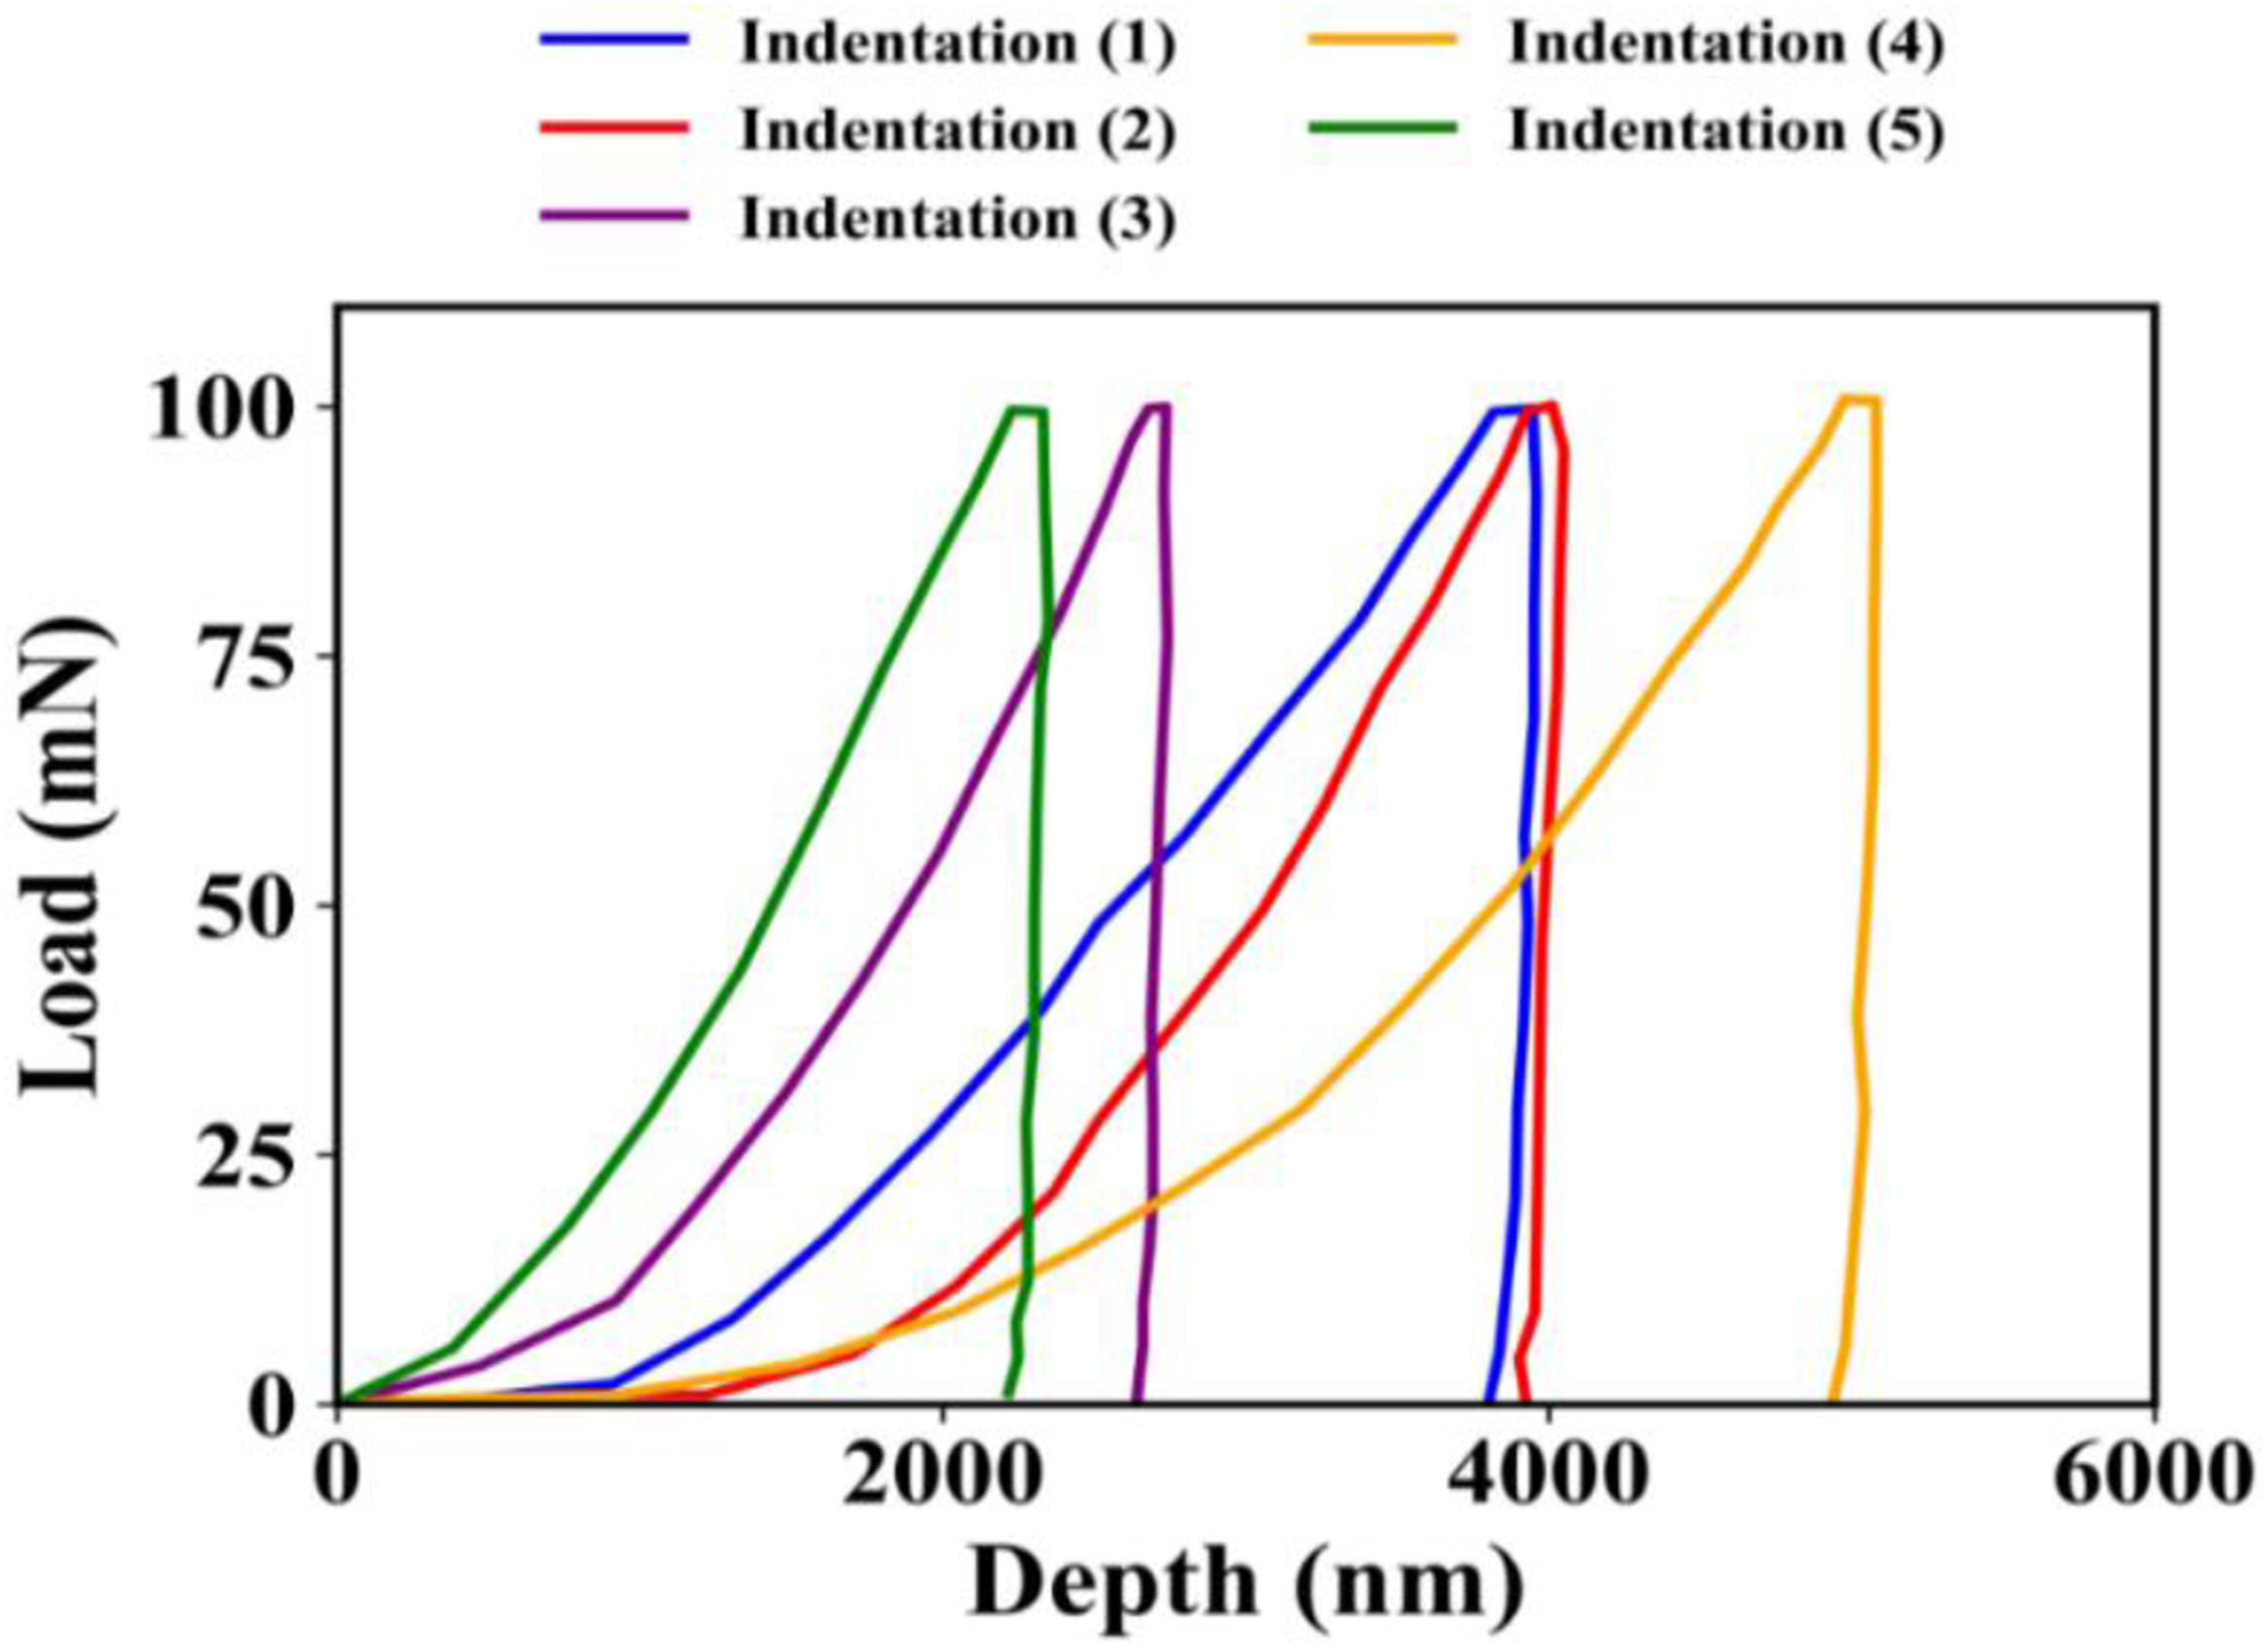
Figure 13(a) shows the relationship between crack size (mm) and the number of cycles. All materials begin with an initial crack of 7.5 mm length after 0 cycles. Pure aluminium shows a very high growth rate after approximately 60,000 cycles, to reach a growth of around 14.5 mm after 76,590 cycles. HGM-reinforced composites exhibit lesser crack growth rate as compared to other composites and a higher concentration of HGM (Al+25% and Al+30% HGM) shows a crack size of approximately 13 mm at the end which seems to have extended the fatigue life of the composite. In Figure 13(b) R = 0.2, which shows that the number of cycles before significant crack propagation is increased. The overall trend is similar to R = 0.1, but the crack growth rate increase in pure aluminum occurs at a higher number of cycles. The beneficial effect of reinforcement at moderate stress ratios is clearly demonstrated by HGM-reinforced composites, which exhibit delayed crack propagation. The fatigue response for a higher stress ratio (R = 0.3) is shown in Figure 13(c). For pure aluminum, the crack growth starts at a lower age and grows at a higher rate, while for the HGM composites, fatigue resistance is still acceptable. The composites exhibited a significant increase in the fatigue life and durability of the structure with increased reinforcement content, as the higher percentage of HGM material reduced the propagation of cracks. Overall, the three subfigures show that the performance of the stress ratio in terms of fatigue resistance is improved with the inclusion of HGM and that the HGM reinforced composites perform better than that of pure aluminum for higher stress ratios. Fatigue crack propagation in Al-HGM composites and pure aluminium at various stress ratio (R = 0.1, 0.2 and 0.3) are shown in (a) the a-N curve at R = 0.1, (b) curve at R = 0.2 and (c) curve at R = 0.3.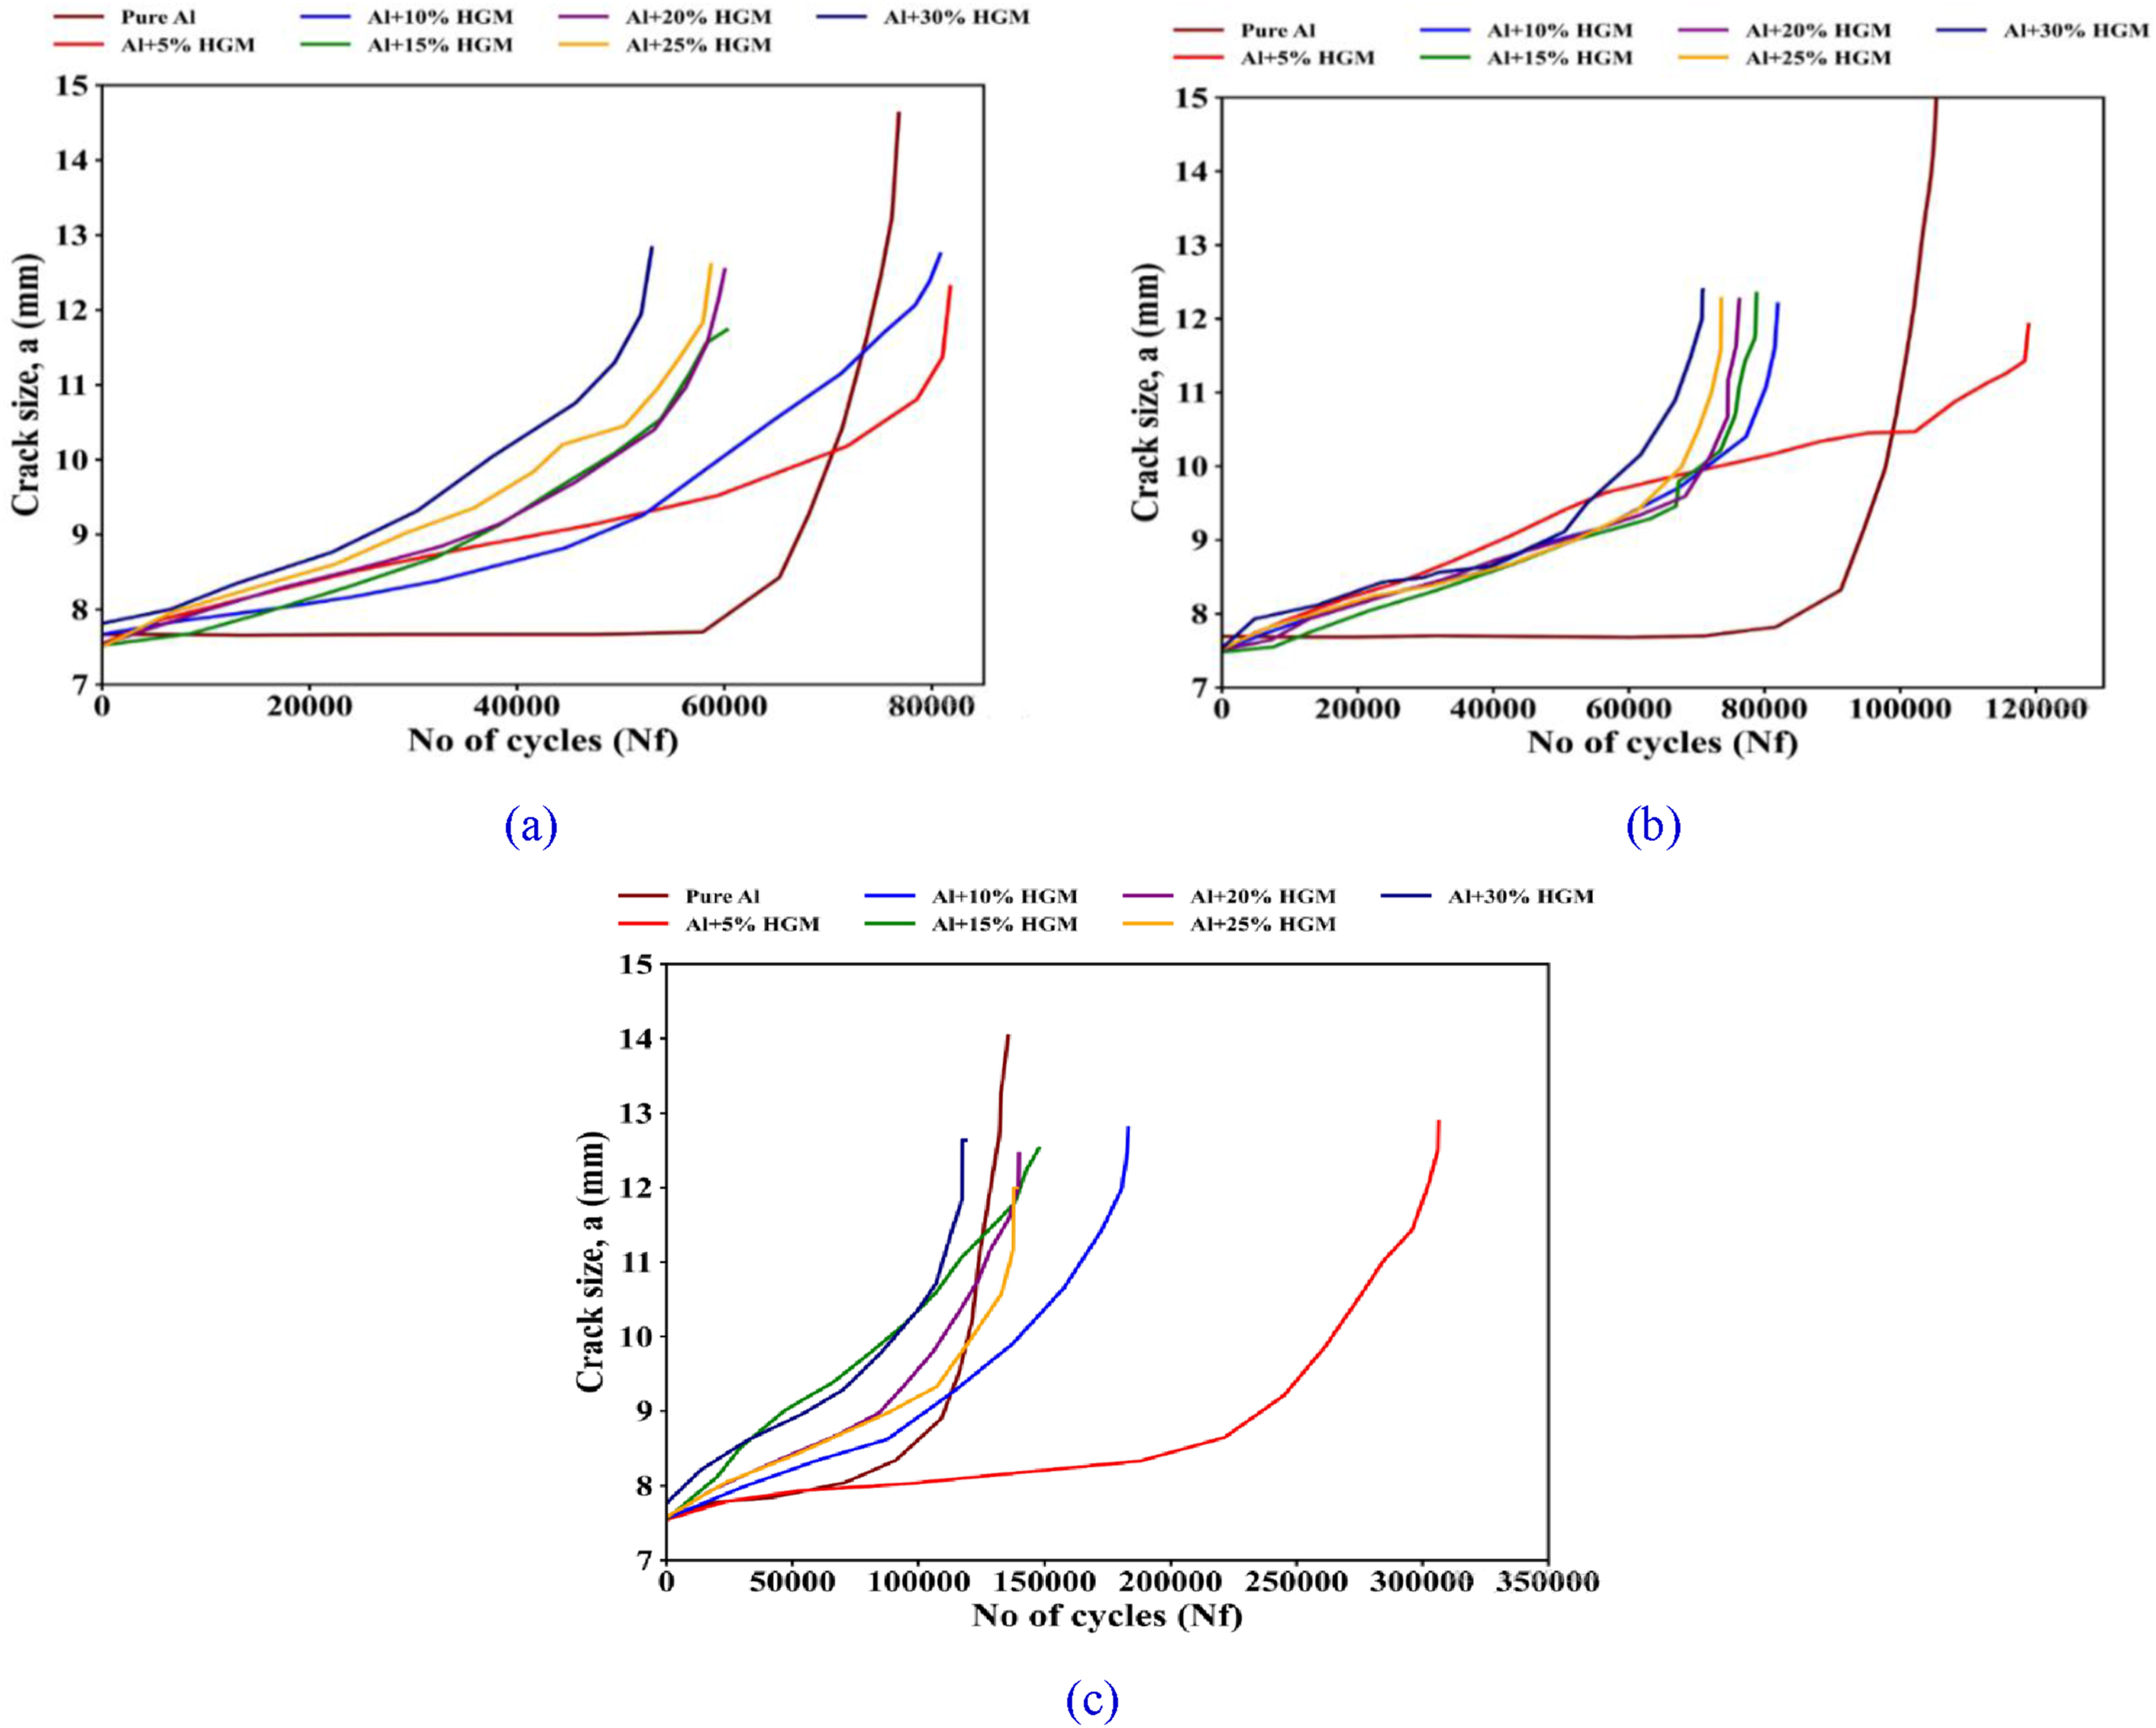
For pure aluminium and AMCs with different percentages of HGM MMCs, the rate of fatigue crack propagation in mm/cycle is plotted against the stress intensity factor range in Mpam using a log-log plot as shown in Figure 14. The R-ratio is kept constant in 0.1. In contrast to Al + HGM MMCs, like Al+10% HGM MMCs which show lower rates, about 3E-5 mm/cycle at the same ΔK, pure Al shows greater da/dN values, especially at lower ΔK. The fatigue crack development rates for HGM MMCs typically stay lower than or equivalent to pure Al when ΔK increases into intermediate area. Pure Al reaches 5E-4 mm/cycle, but Al+5% HGM MMCs retain da/dN about 2E-4 to 3E-4 mm/cycle. Data scatter increases at higher ΔK values especially for composites with higher HGM content. Growth rate of fatigue cracks against stress intensity factor range for Al-HGM and pure Al MMCs.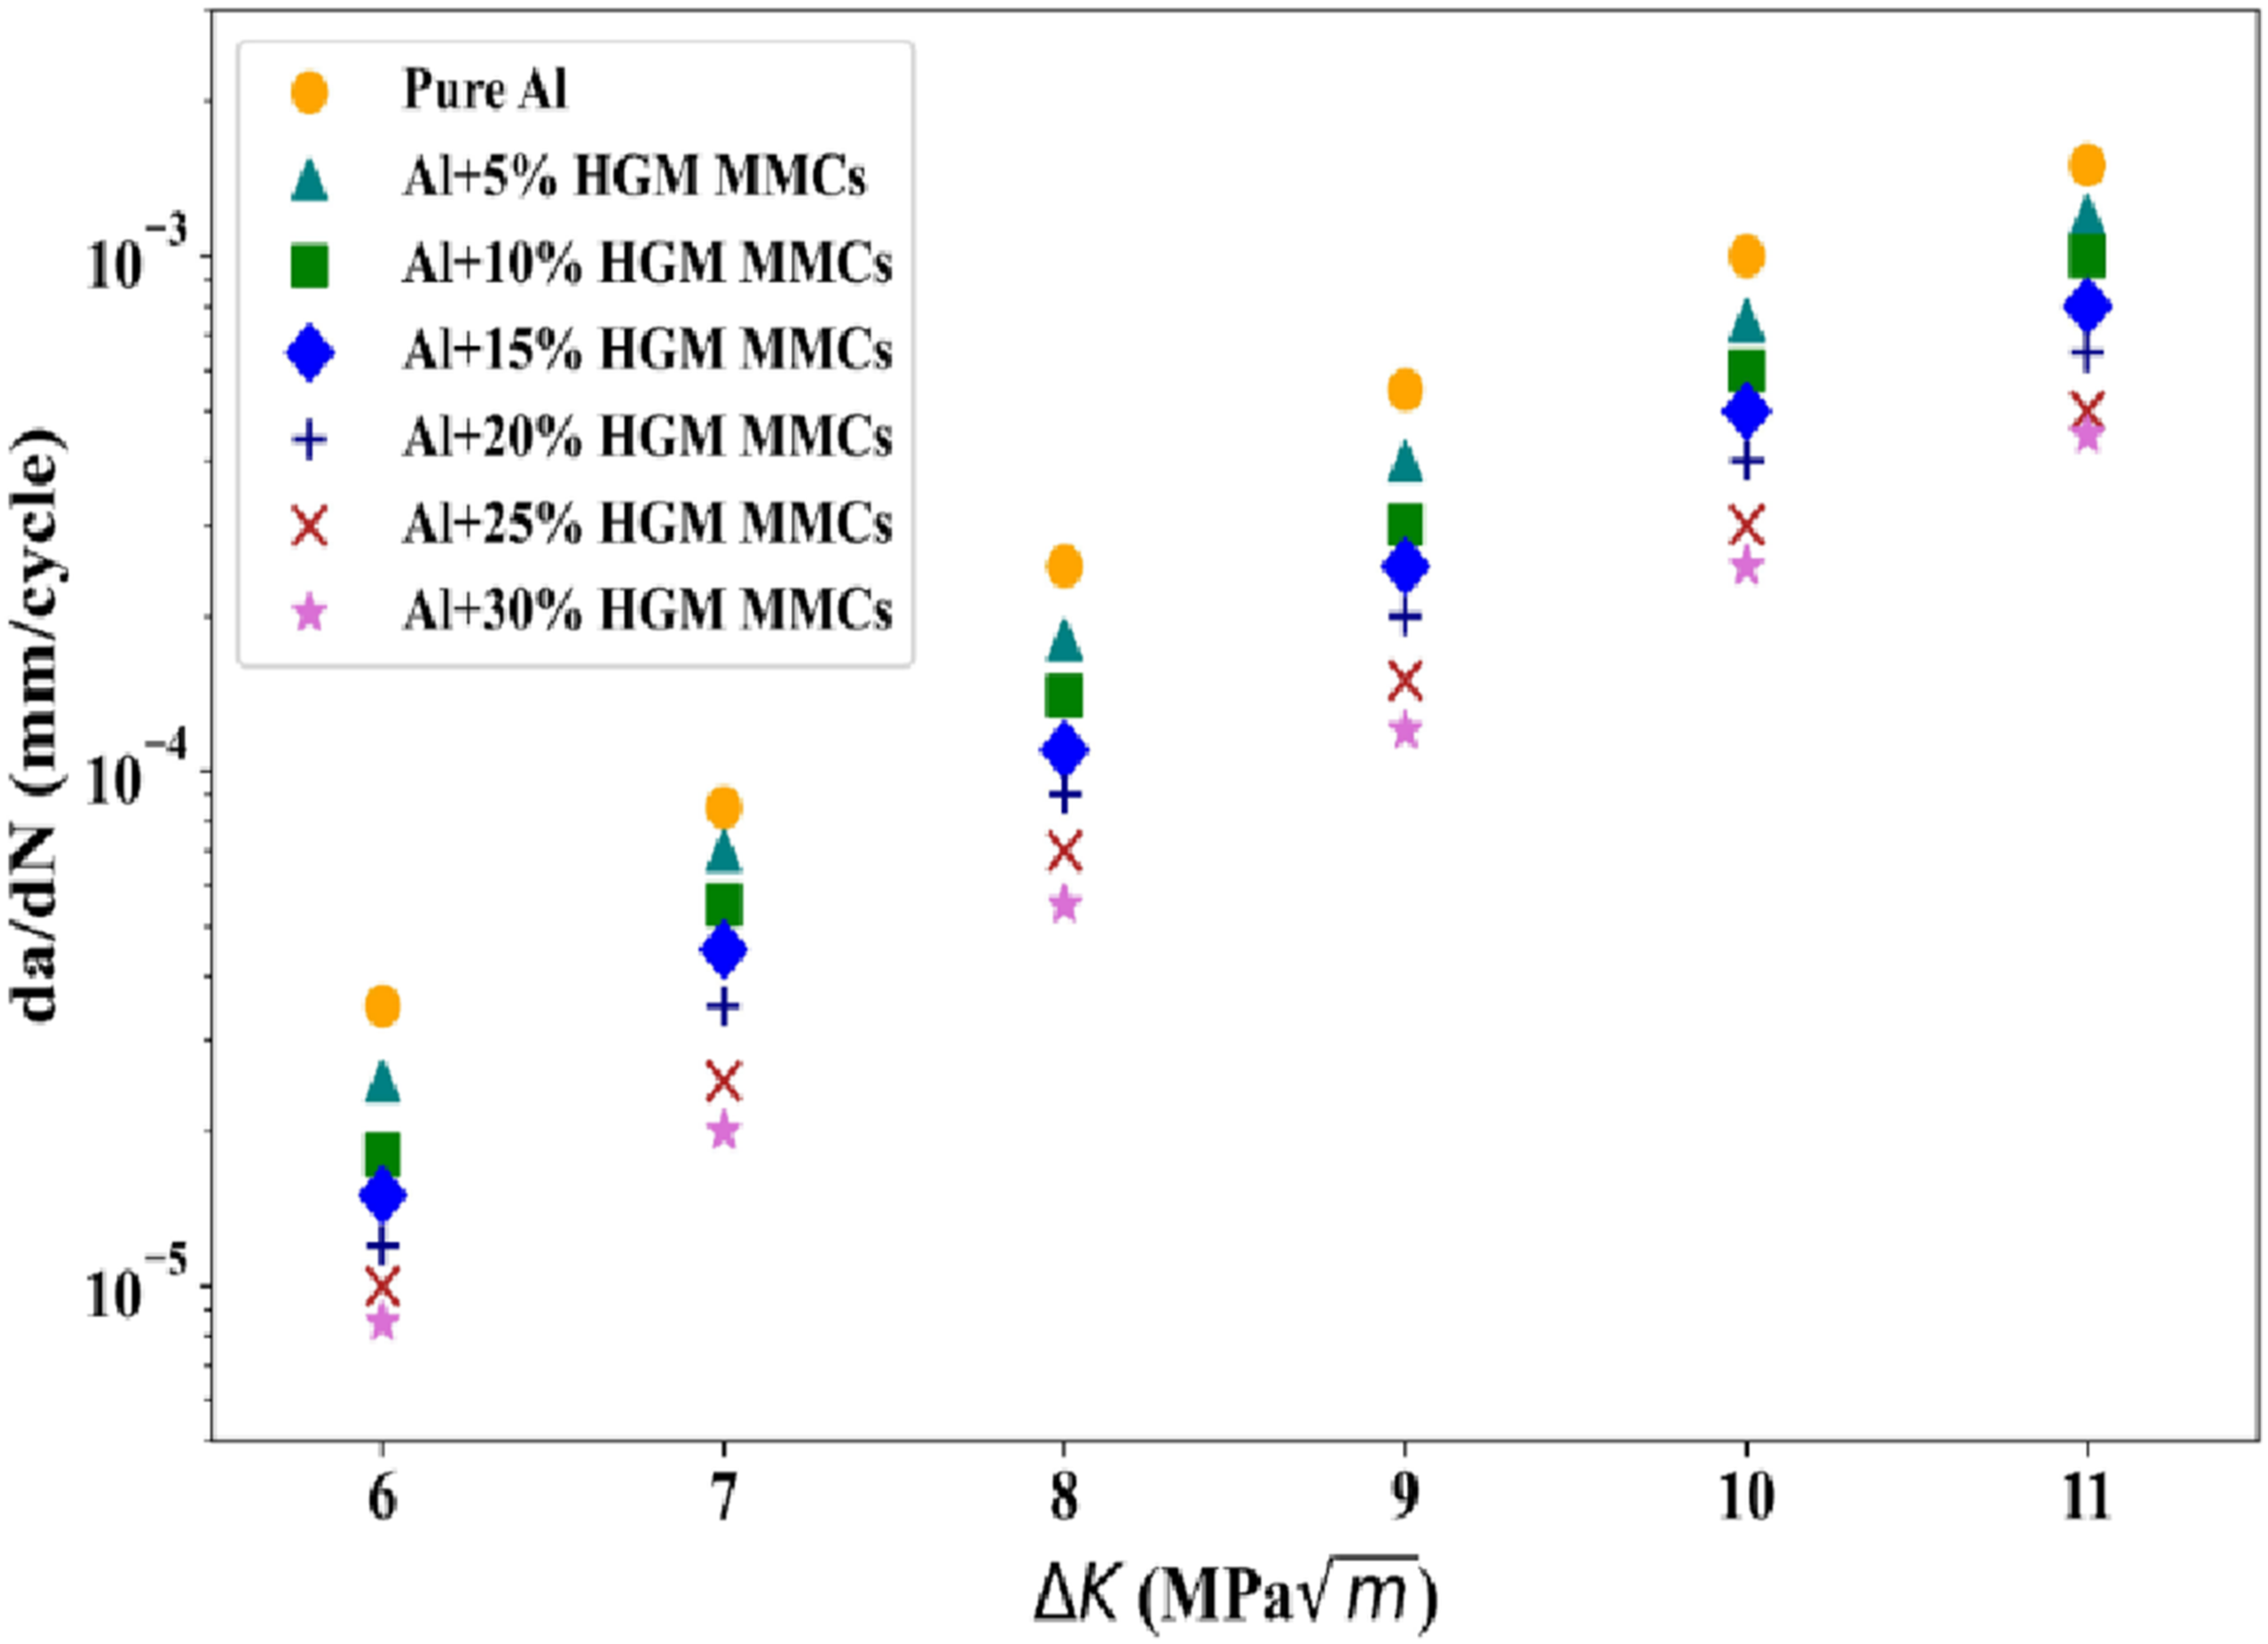
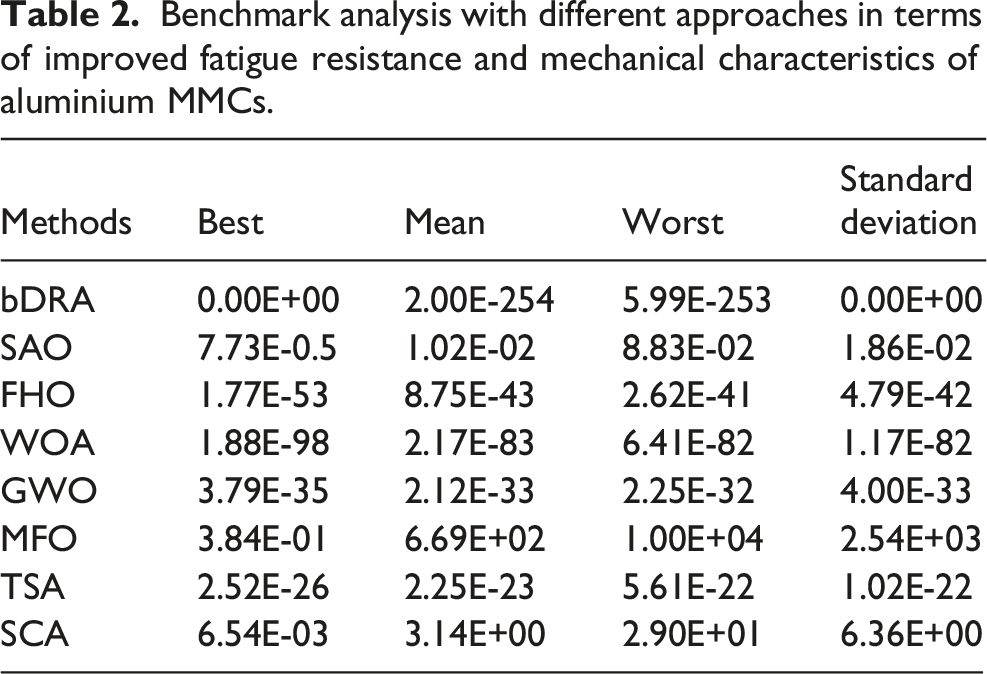
The optimization process for function 01 is demonstrated in Figure 15, where the fitness value is converging with iterations. The points on the x-axis correspond to each iteration from 1 to 450, which indicates the number of steps taken to improve the solution. The y-axis, which is on a logarithmic scale from 102 to 10-300, represents the values of the objective function that are to be minimized. The different colored lines represent different iterations of the algorithm. Optimization is said to be successful if the fitness value of the algorithm is the best among other algorithms such as Sine Cosine Algorithm (SCA), Tunicate Swarm Algorithm (TSA), Moth Flame Optimization (MFO), Grey Wolf Optimizer (GWO), Whale Optimization Algorithm (WOA), Fire Hawk Optimization (FHO), and Sailfish Algorithm Optimization (SAO). Benchmark functions convergence curves.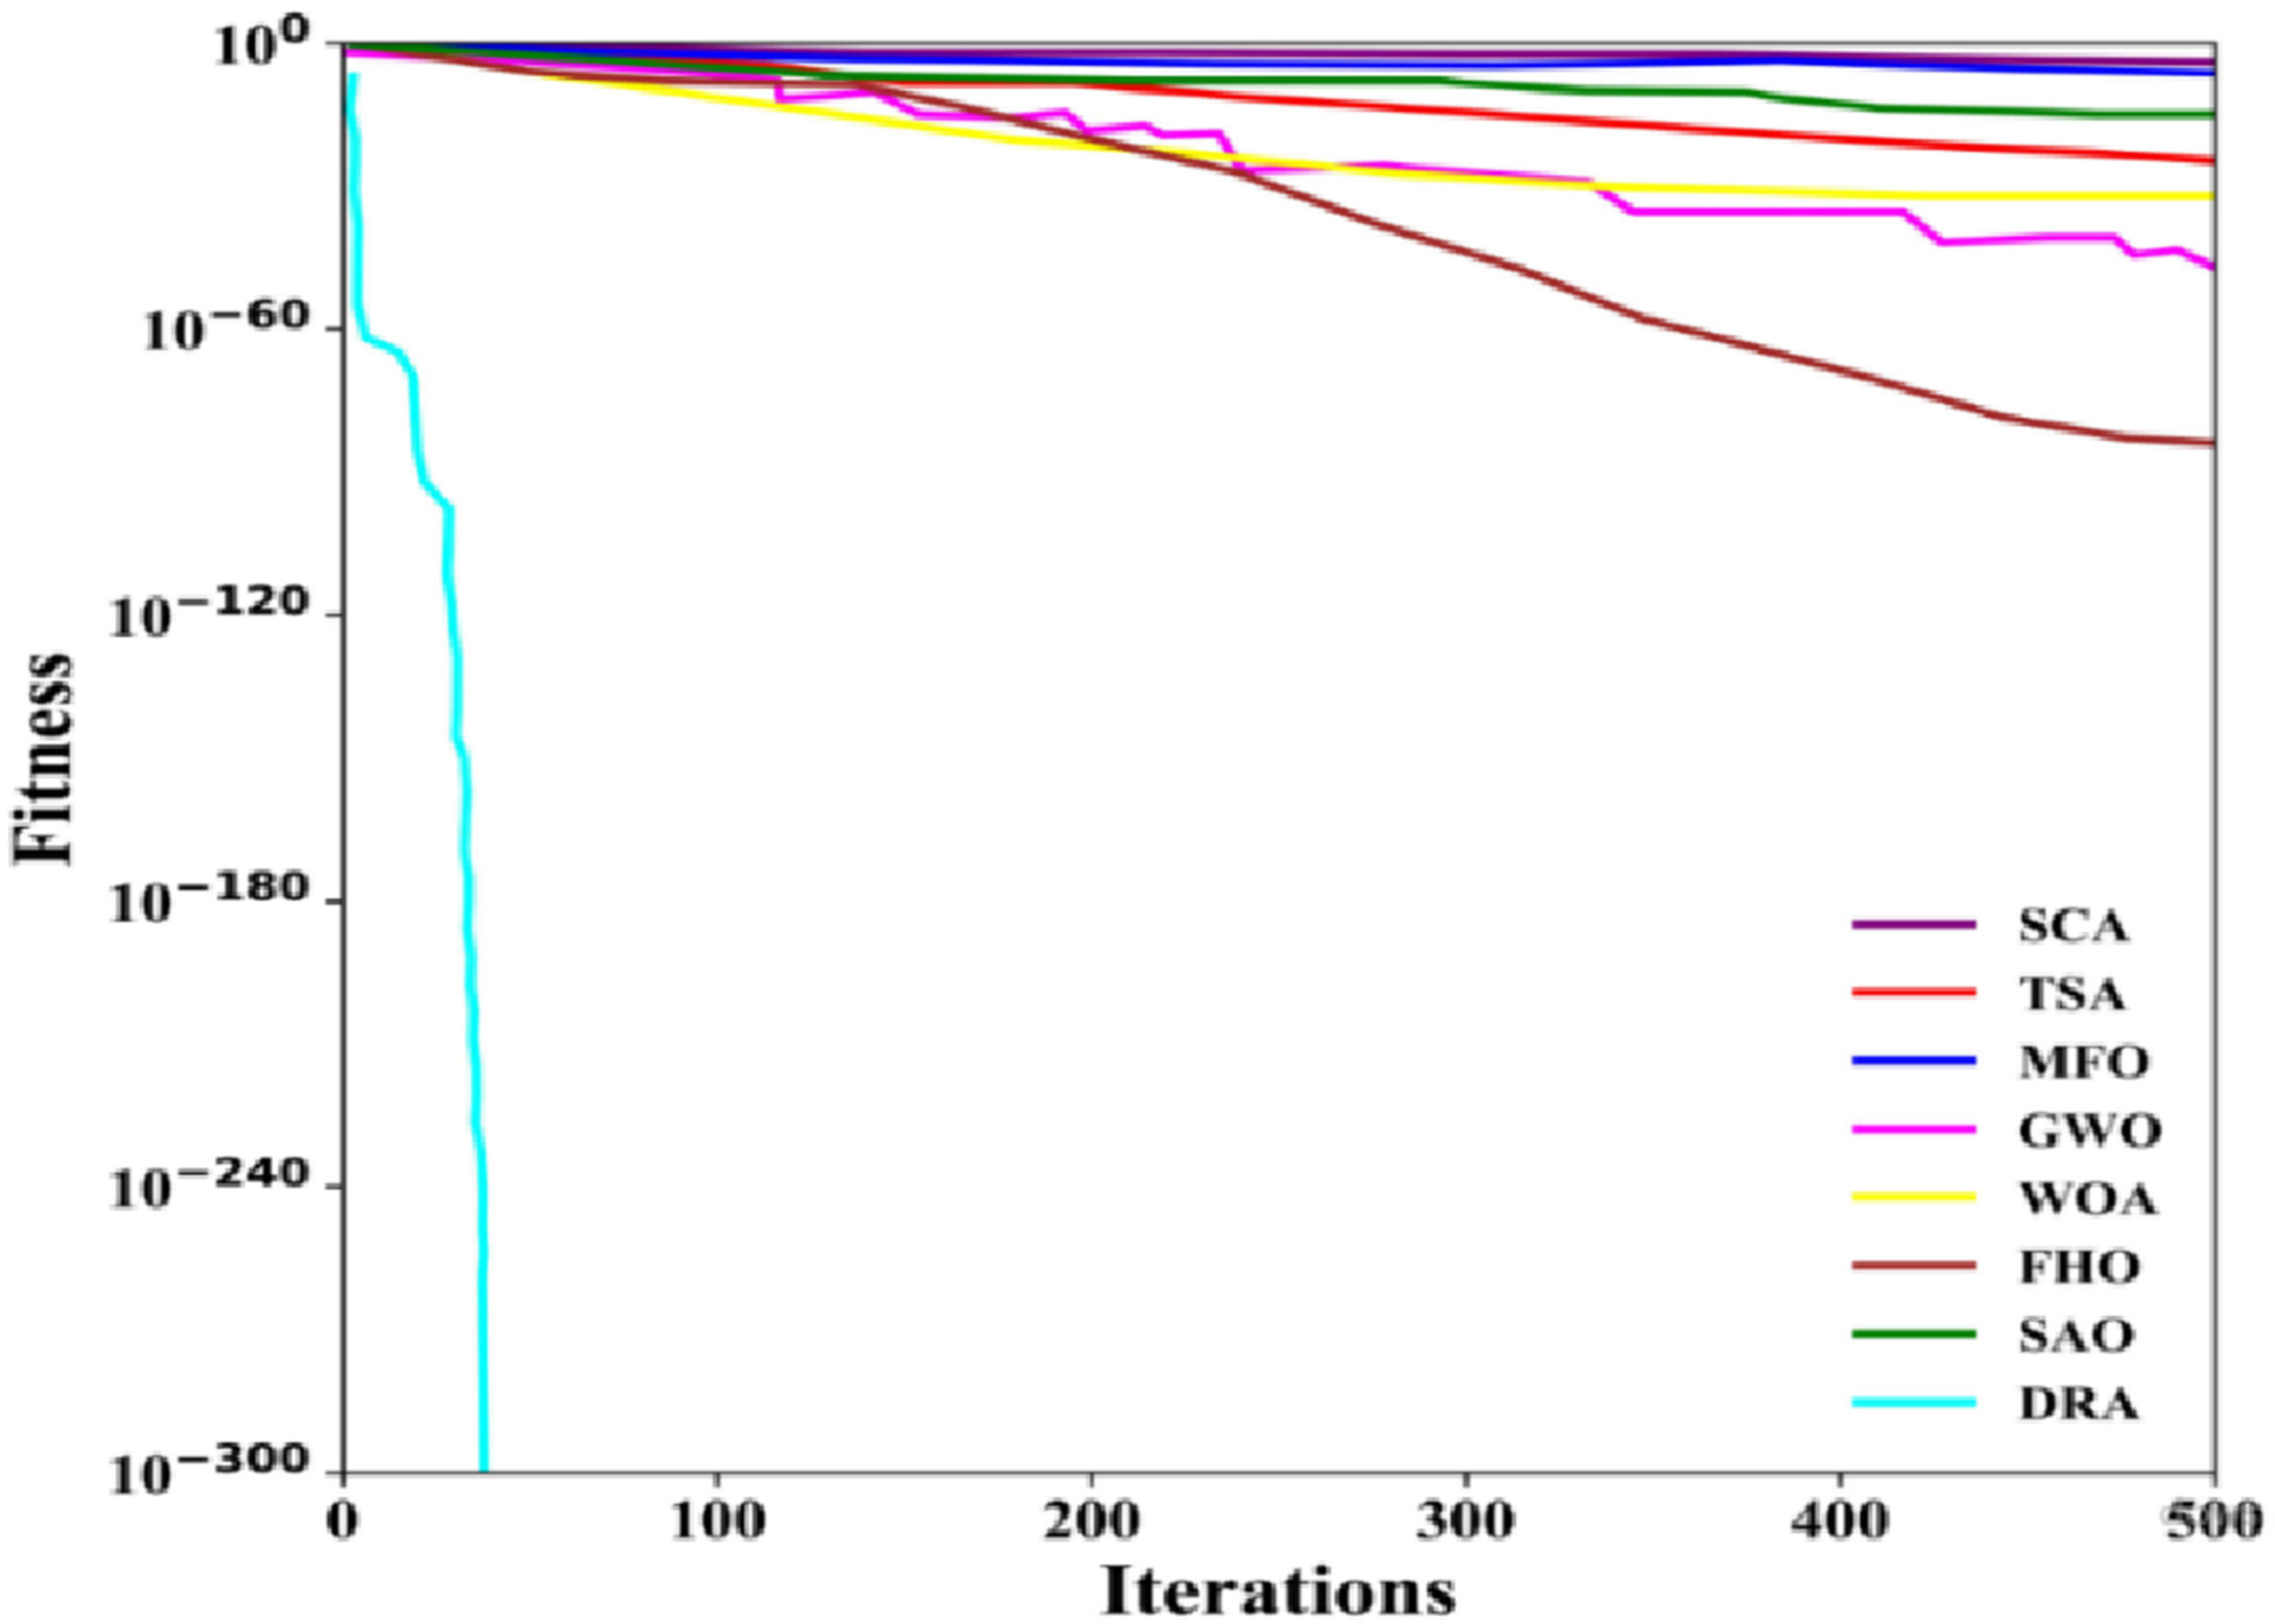
Benchmark analysis with different approaches in terms of improved fatigue resistance and mechanical characteristics of aluminium MMCs.
Conclusions
The research demonstrates a complex deep learning framework to accurately predict fatigue crack growth, based on the enhanced fatigue resistance and mechanical properties of aluminium MMCs. By combining important material and loading factors, the M2AM-Deep BiLSTM network optimized using a hybrid bDRA algorithm effectively predicts the intricate, non-linear interactions driving fatigue behaviour. This prediction ability is important in order to allow for faster and more advanced evaluation of fatigue performance of HGM and SiC reinforced aluminium composites. The model offers researchers an important tool for examining crack propagation and the remaining fatigue life at a finer scale. This accelerates the development of extremely durable, lightweight and purposeful structures for critical industries such as marine and aerospace. The proposed model is able to get error less than 5%. Compared with pure aluminium, MMCs containing 15% to 30% HGM show a shorter fatigue life while those containing 5% and 10% have longer fatigue life especially at higher stress ratio (R = 0.1). The graph of fitness value versus the number of iterations is a downward curve in the convergence graph. The best value obtained with the bDRA algorithm is 0.00E+00, the mean value is 2.00E-254, the STD value is 5.99E-00, indicating that the algorithm finds a best value solution with very little variation. bDRA provide the most dependable and efficient optimization. The future work of this research is to further the predictive framework towards applications, which are broader and relevant to industry. Multiscale modelling and physics informed AI will enhance accuracy and interpretability, while reinforcements like CNTs, graphene and HEAs will enhance applicability.
Footnotes
Funding
The authors received no financial support for the research, authorship, and/or publication of this article.
Declaration of conflicting interests
The authors declared no potential conflicts of interest with respect to the research, authorship, and/or publication of this article.
Data Availability Statements
Data sharing not applicable to this article as no datasets were generated or analyzed during the current study.