
Abstract
We investigated racial and ethnic disparities in learning disabilities (LD) identification in U.S. elementary schools including before and after proposal and implementation of the federal Equity in IDEA regulations. We analyzed repeated cross-sectional data from large samples of U.S. fourth graders participating in the National Assessment of Educational Progress (N = 1,607,010; ns = 103,150 to 205,860) across 2003 to 2022. Multivariable logistic regression models adjusting for potential confounds including student academic achievement, English Language Learner (ELL) status, family economic background, and school contextual factors yielded consistent evidence of LD under-identification of students of color in U.S. elementary schools. These disparities have been largely stable over time, particularly for Black students (adjusted odds ratio [aOR] range = 0.50 to 0.69) and students of other races or ethnicities (aOR range = 0.47 to 0.82). Hispanic students (aOR range = 0.45 to 0.83), girls (aOR range = 0.64 to 0.90), and ELLs (aOR range = 0.32 to 0.59) have also been consistently less likely to be identified. The size of these disparities has decreased over time. We observed no evidence of LD over-identification of students of color to support the Equity in IDEA regulations.
Keywords
Whether and to what extent racial and ethnic disparities in learning disabilities (LD) identification are occurring in U.S. elementary schools is currently unclear. Some studies report that schools are over-identifying students of color with LD. Analyses of cross-sectional data from three U.S. states indicate that students of color are more likely to be identified with LD in analyses adjusting for covariates including the student’s biological sex and English Language Learner (ELL) status as well as the district’s proportion of low-income students (Grindal et al., 2019). Longitudinal analyses of an urban California school district indicate that students of color are more likely to be identified with LD in analyses adjusting for student biological sex and language background, parental education level, and additional covariates (Cruz & Firestone, 2022). Mechanisms hypothesized to explain over-identification include “systemic bias” (Grindal et al., 2019, p. 543) and “discriminatory” (Skiba et al., 2005, p. 142) practices. Additional work argues that U.S. schools use special education to racially segregate students (Ferri & Connor, 2005a, 2005b). Special education is described as “a sorting system for children and students on the basis of race, ethnicity, culture, and social class and to re-segregate Black and other students of color” (Blanchett, 2025, p. 5).
Conflicting Evidence of Racial and Ethnic Disparities in LD Identification in U.S. Schools
Yet other studies repeatedly fail to find that schools over-identify students of color as LD (Morgan et al., 2015; Morgan, Farkas, Hillemeier & Maczuga, 2017; Shifrer, 2018). Instead, these studies find that students of color are under-identified relative to otherwise similar White students. Analyses based on nationally representative cross-sectional samples of fourth-, eighth-, and 12th-grade students indicate that Black, Hispanic, and Asian students are under-identified relative to White students in analyses adjusting for student academic achievement, biological sex, ELL status, and school contextual factors (Morgan, Farkas, Hillemeier & Maczuga, 2017). Studies of two nationally representative cohorts indicate that Black or Hispanic students attending U.S. elementary schools are under-identified for LD relative to White students in analyses adjusting for academic achievement, biological sex, non-English language use, and socioeconomic status (SES) (Morgan et al., 2015; Morgan et al., 2025). Analyses of a longitudinal sample attending U.S. high schools indicate that Black students are relatively less likely than White students to be identified with LD in analyses adjusting for student academic achievement, biological sex, ELL status, family SES, and school contextual factors. Hispanic students are no more likely to be identified than White students. These findings “do not support racially biased classification processes” (Shifrer, 2018, p. 393). Under-identification occurs in local contexts with histories of de jure and de facto segregation (Morgan et al., 2020). Unmeasured confounds are an unlikely explanation of observed LD under-identification (Morgan, 2021).
Findings from these other studies are consistent with the possibility that systemic bias and discriminatory practices occur in U.S. elementary schools, but in ways that may privilege White students. Hypothesized mechanisms include teachers being more likely to consider an underlying disability as an explanation of the academic difficulties of White students than of Black or Hispanic students (Cooc, 2017), disparities in the likelihood of attending racially segregated and under-resourced schools (Hibel et al., 2010; Stiefel et al., 2024), and federal legislation and policies requiring school districts to publicly report and address minority over-representation in special education (Morgan et al., 2015; Morgan, Farkas, Hillemeier & Maczuga, 2017). Stereotypes by school personnel may be limiting access to school-based supports including for students of color with disabilities (Rivera & Tilcsik, 2023). Minority over-representation in special education may instead be explained by the greater likelihood that students of color experience the risk factors for disabilities (e.g., low birthweight, lead exposure), including due to greater poverty exposure (Annie & Casey Foundation, 2024).
Importance of Understanding Whether Disparities in LD Identification are Occurring
Understanding whether students of color are being over- or under-identified with LD while attending U.S. elementary schools has important policy and practice implications. Evidence of over-identification would suggest that U.S. schools are biased in their eligibility procedures and further justify federal monitoring and compliance mandates. Alternatively, evidence of under-identification would suggest that these federal regulations may be misdirected. Students with disabilities of color and their families may instead be experiencing relatively greater difficulties accessing potentially beneficial disability services and supports to which they may be legally entitled. Special education services are reported to benefit students with disabilities (SWD), including those of color (for a review, see O’Hagan & Stiefel, 2025). For example, receipt of special education services delivered during the upper elementary grades increases the reading achievement of students with LD and speech or language impairments, including those of color, with estimated effect sizes between 0.29 and 0.67 of a SD (Woods et al., 2023). Elementary school students with high-incidence disabilities, including those from historically marginalized communities, who receive special education services are more likely to complete high school and enroll in college (Ballis & Heath, 2021). Evidence of under-identification would suggest the need for policies and practices that ensure equal access to special education services including for students of color.
Extant Work’s Methodological and Substantive Limitations
Yet whether over- or under-identification is occurring in U.S. elementary schools is currently unclear due to methodological and substantive limitations in existing work. Available studies reporting that students of color are over-identified with LD have not accounted for the strong confounds of between-group differences in factors most clinically relevant to LD identification and/or have analyzed samples with limited generalizability to the diverse U.S. school population (Cruz & Firestone, 2022; Grindal et al., 2019). Student academic achievement is an especially relevant factor for LD identification (American Psychiatric Association, 2024; Office for Civil Rights, U.S. Department of Education, 2016). Students with LD display lower academic achievement including across time (Daniel, 2024). Academic achievement is “the key variable in special education eligibility for most students” (Hosp & Reschly, 2004, p. 196). Accounting for racial and ethnic differences in academic achievement fully explains minority over-representation in special education (Farkas et al., 2020) including for LD (Morgan, Farkas, Hillemeier & Maczuga, 2017). Contrasts between similarly situated students including across factors clinically relevant to disability identification provide stronger evidence of whether U.S. schools are using biased or discriminatory practices including to racially segregate students (Institute of Medicine, 2003; Morgan et al., 2015; Morgan, Farkas, Hillemeier & Maczuga, 2017; National Research Council, 2004; Shifrer, 2018; Office for Civil Rights, U.S. Department of Education, 2016).
To date, few prior studies have adjusted for clinically relevant explanatory factors including student academic achievement (for reviews, see Morgan, Farkas, Cook, et al., 2017; Morgan et al., 2018). Of these few prior studies, most are based on analyses of relatively dated nationally representative samples (Hibel et al., 2010; Morgan et al., 2015; Morgan et al., 2025; Morgan, Farkas, Hillemeier & Maczuga, 2017; Shifrer, 2018). The most recently available estimates are based on a nationally representative sample last assessed in 2016 (Morgan et al., 2025). To what extent over- or under-identification is currently occurring in U.S. elementary schools is therefore unclear. Also unclear is whether and to what extent these disparities have changed over time including following the proposal of the federal Equity in the Individuals with Disabilities Education Act (IDEA) regulations in 2016 and their subsequent implementation in 2019. The regulations increased federal monitoring of the extent to which students of color are identified with disabilities including for LD (U.S. Department of Education, 2016). The percentage of local educational agencies flagged with significant disproportionality has increased following implementation of the regulations (Office for Civil Rights, U.S. Department of Education, 2023). U.S. schools may be attempting to avoid being flagged for significant disproportionality by identifying relatively fewer students of color as having LD. Analyses of state-level data suggest that policies artificially limiting access to special education services are associated with increased disability under-identification, particularly for students of color (Morgan, Woods, Wang, & Gloski, 2023). To date, however, no study has examined whether and to what extent racial and ethnic disparities in LD identification have decreased or increased following proposal and implementation of the federal Equity in IDEA regulations. Consistent evidence of LD under-identification by students of color would suggest that, at least during elementary school and so when most students are identified as having disabilities (Morgan et al., 2015), the regulations may not be empirically supported.
Study’s Purpose and Research Questions
We investigated racial and ethnic disparities in LD identification in U.S. elementary schools. We did so through analyses of ten nationally representative, cross-sectional samples of U.S. fourth-grade students repeatedly collected from 2003 to 2022. We statistically controlled for the strong potential confounds of student academic achievement (Morgan, Farkas, Hillemeier & Maczuga, 2017) as well as family economic background, language use, biological sex, and school contextual factors (Institute of Medicine, 2003; Stiefel et al., 2024). We investigated the following research questions:
Method
We analyzed student-level data from the National Assessment of Educational Progress (NAEP) reading assessments, administered biennially to nationally representative samples of fourth-grade students between 2003 and 2022 (https://nces.ed.gov/nationsreportcard/). Detailed information on the sample design is available at: https://nces.ed.gov/nationsreportcard/tdw/sample_design/. Between 30 and 60 fourth-grade students were sampled from about 100 eligible schools per jurisdiction for each assessment year (NCES Handbook of Survey Methods, 2017).
We first analyzed each assessment year separately across the ten available student-level datasets from 2003 to 2022 (collected every two years until the 2021 assessment was delayed until 2022 due to the COVID-19 pandemic). We examined trends across time by pooling these survey waves into a single combined dataset and using a categorical variable to indicate assessment year. We used 2015 as the reference year for the study’s trend analyses, which immediately preceded the proposal of the Equity in IDEA regulations in 2016. We restricted our analyses to students with valid reading scores, resulting in no missing data on other key covariates. This restriction ensured high data completeness. Over 95% of the total sample in each year had valid reading scores. The NAEP provides extensive accommodations (e.g., extended testing time, 1:1 test administration) for SWD and ELLs, resulting in high inclusion rates. Over 98% of SWD and/or ELLs provided valid reading scores (Kitmitto, 2011). The final analytic sample included a total of 1,607,010 fourth-grade students. Biennial sample sizes ranged from 103,150 to 205,860 (see Table 1).
Descriptive Statistics of the NAEP Fourth Grade Reading Assessments Across Years.
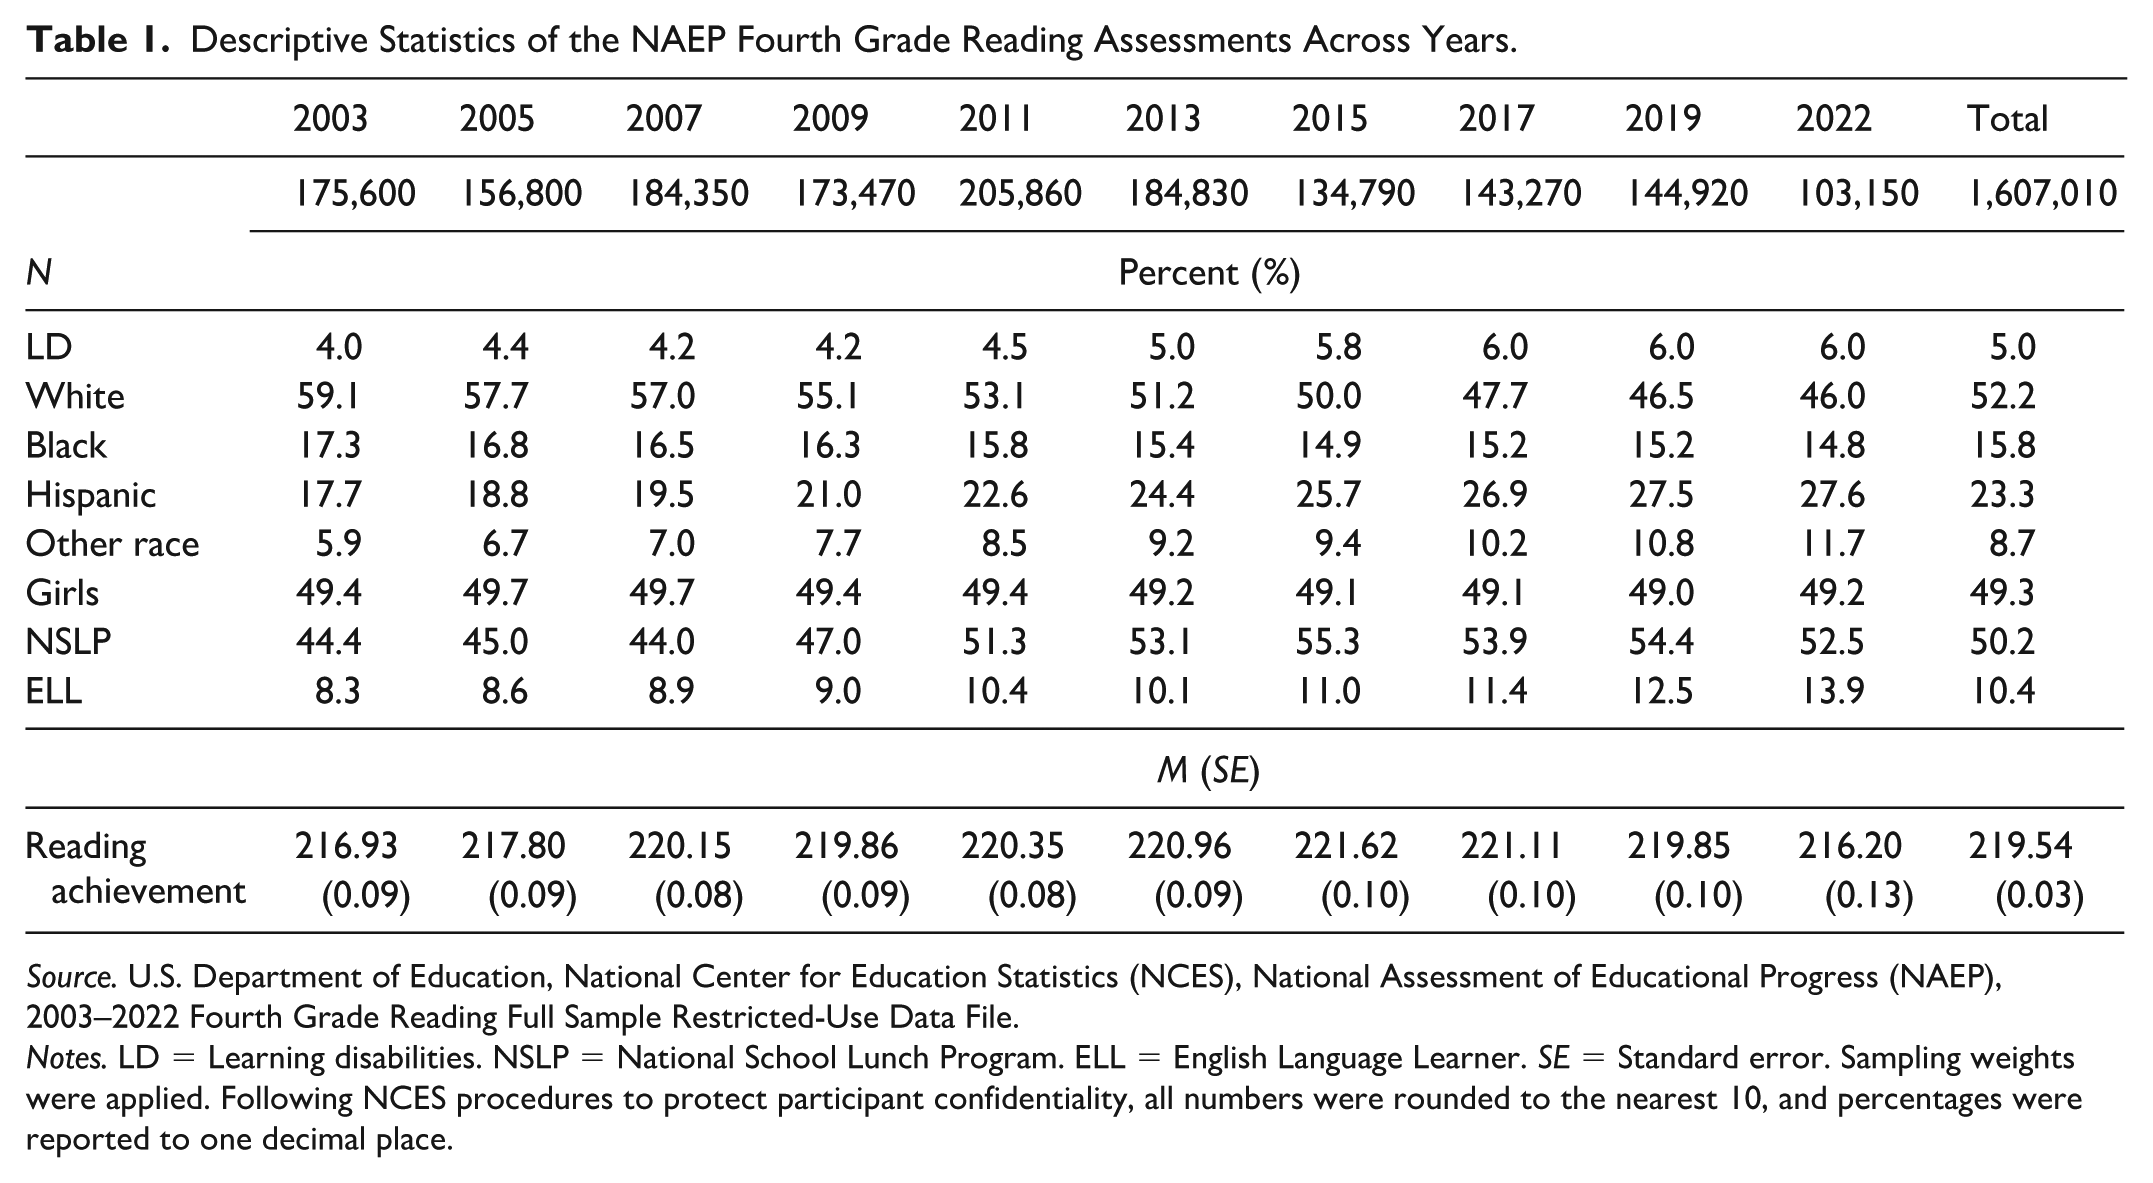
Source. U.S. Department of Education, National Center for Education Statistics (NCES), National Assessment of Educational Progress (NAEP), 2003–2022 Fourth Grade Reading Full Sample Restricted-Use Data File.
Notes. LD = Learning disabilities. NSLP = National School Lunch Program. ELL = English Language Learner. SE = Standard error. Sampling weights were applied. Following NCES procedures to protect participant confidentiality, all numbers were rounded to the nearest 10, and percentages were reported to one decimal place.
Measures
Specific Learning Disability
Student disability status was collected from school records. We identified SWD if they had an active Individualized Education Program (IEP) or an equivalent plan (e.g., a Section 504 plan) on file. Schools reported the primary disability condition for each student. We focused on students whose primary disability was LD.
Student Race or Ethnicity
Student race and ethnicity data were primarily collected through student self-reports and subsequently verified using school records. Since 2011, the available race/ethnicity categories have included: (a) White, non-Hispanic; (b) Black or African American, non-Hispanic; (c) Hispanic, any race; (d) Asian, non-Hispanic; (e) American Indian or Alaska Native, non-Hispanic; (f) Native Hawaiian or Other Pacific Islander, non-Hispanic; and (g) two or more races, non-Hispanic. In earlier assessment years (i.e., 2003 to 2009), NAEP combined Asian and Native Hawaiian or Pacific Islander students into a single category. To ensure consistency in coding across years, we combined groups (d) through (g) into a single “Other races, non-Hispanic” category. Our analyses used four mutually exclusive racial or ethnic categories: (a) White, non-Hispanic (reference group); (b) Black or African American, non-Hispanic; (c) Hispanic, any race; and (d) Other race, non-Hispanic.
Student Biological Sex, ELL Status, and Family Economic Resources
Additional student sociodemographic characteristics were collected from student self-reports and validated by school administrative records. Biological sex was a dummy variable with boys as the reference group. The ELL status was a dummy variable indicating a student’s current ELL classification status based on the school record. Non-ELL status was the reference group. Family economic resources were indicated by eligibility for the National School Lunch Program (NSLP). Families earning less than 130% of the federal poverty level qualify for free lunch. Those earning less than 185% qualify for reduced-price lunch. In the 2021–2022 school year, these thresholds corresponded to annual household incomes below $34,450 and $49,025, respectively, for a family of four (U.S. Department of Agriculture, Food and Nutrition Service, 2021). Students not eligible for the program were the reference group.
Student Reading Achievement
The NAEP’s fourth-grade reading assessments evaluate a range of literacy skills using grade-level passages across literary and informational genres. These assessments measure vocabulary knowledge; the ability to locate and recall information; and the capacity to interpret, integrate, and critically evaluate textual content (NCES Handbook of Survey Methods, 2017). Additional details about the reading framework, assessed domains, and sample items are available at: https://nces.ed.gov/nationsreportcard/reading/. The NAEP assessments display strong psychometric properties including high interrater reliability, construct validity, and measurement consistency over time (Oranje & Kolstad, 2019). The NAEP used item response theory models to estimate student proficiency, which yield robust ability estimates while accounting for item characteristics and student response patterns. The NAEP reported plausible values, which are multiple imputations representing a student’s latent reading ability, to reduce bias and support accurate population-level inference. The NAEP reported five plausible values per student for assessments from 2003 through 2011. This number increased to 20 beginning in 2013. We duplicated each of the five reported plausible values prior to 2013 three times, resulting in 20 plausible scores from 2003 to 2011. We then combined the 2003 to 2022 NAEP reading test datasets into one dataset. Following NAEP’s analytic guidelines, we treated the plausible score values as multiply imputed data and used Rubin’s rules to compute pooled estimates and standard errors in our statistical models (Oranje & Kolstad, 2019). We standardized the reading achievement scores within each assessment year to allow for interpretation of the results in SD units.
Analyses
We began by conducting descriptive analyses using the 2022 NAEP dataset to examine the distribution of LD identification rates across reading achievement levels by racial and ethnic groups. Students were divided into deciles based on their reading test scores. The percentage of students identified with LD was calculated within each decile for each racial or ethnic group. We then conducted proportion z-tests to compare non-White students to White students within each decile. Table 2 displays these results.
Percent (%) of Racial, Ethnic Group with LD, by Reading Test Score Decile, 2022 NAEP, Fourth Grade (N = 103,150).
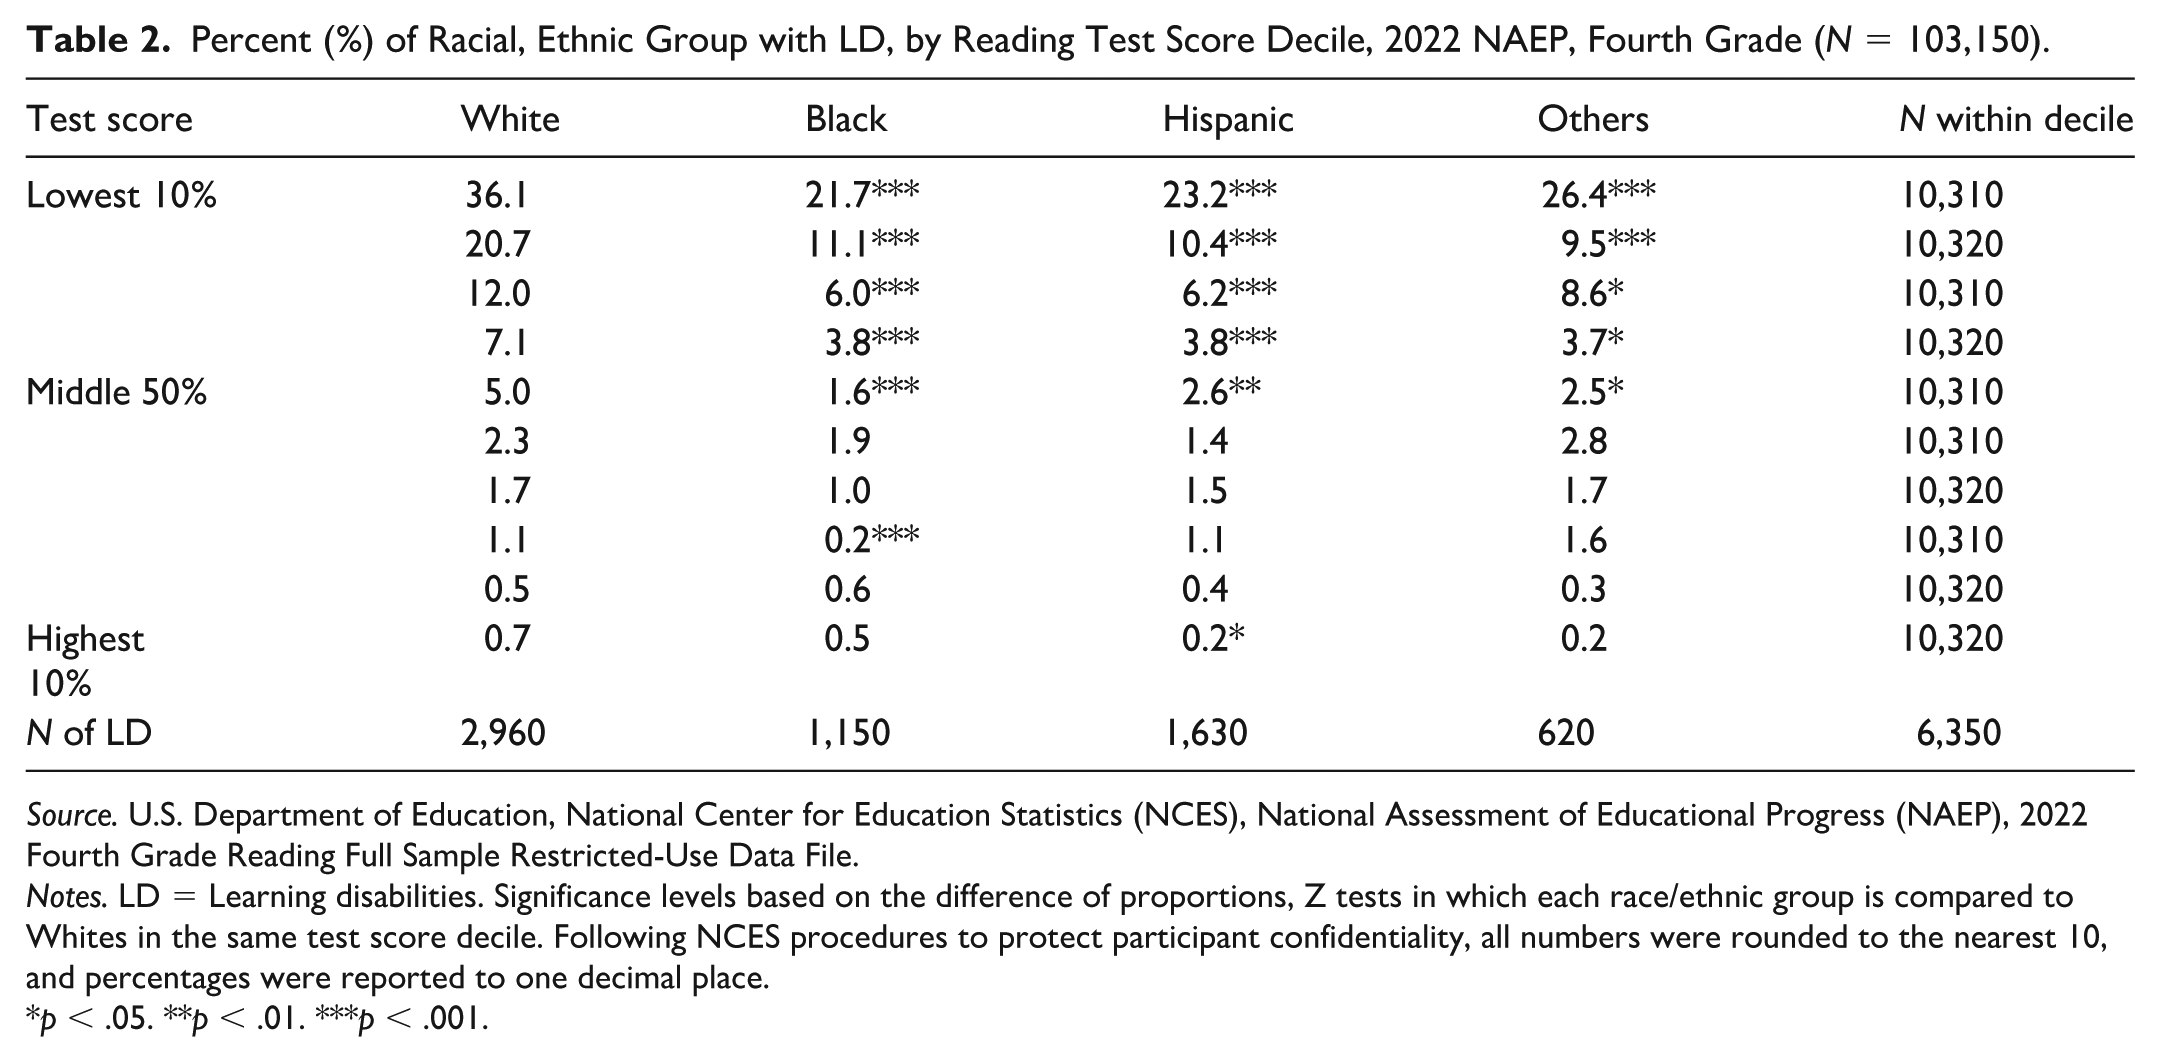
Source. U.S. Department of Education, National Center for Education Statistics (NCES), National Assessment of Educational Progress (NAEP), 2022 Fourth Grade Reading Full Sample Restricted-Use Data File.
Notes. LD = Learning disabilities. Significance levels based on the difference of proportions, Z tests in which each race/ethnic group is compared to Whites in the same test score decile. Following NCES procedures to protect participant confidentiality, all numbers were rounded to the nearest 10, and percentages were reported to one decimal place.
p < .05. **p < .01. ***p < .001.
We next used logistic regression to analyze data from each assessment year to identify explanatory factors of LD identification. Model 1 was an unadjusted model including only student race or ethnicity. Model 2 was a fully adjusted model controlling for reading achievement and additional sociodemographic characteristics (i.e., biological sex, ELL status, and NSLP eligibility) and using school fixed effects to contrast students attending the same elementary schools. We used school fixed effects to control for school contextual factors. Table 3 displays these year-specific results.
Year-Specific Odds Ratios for Learning Disabilities Identification: Unadjusted and Fully Adjusted Models With School Fixed Effects, NAEP Fourth Grade Reading Assessment.
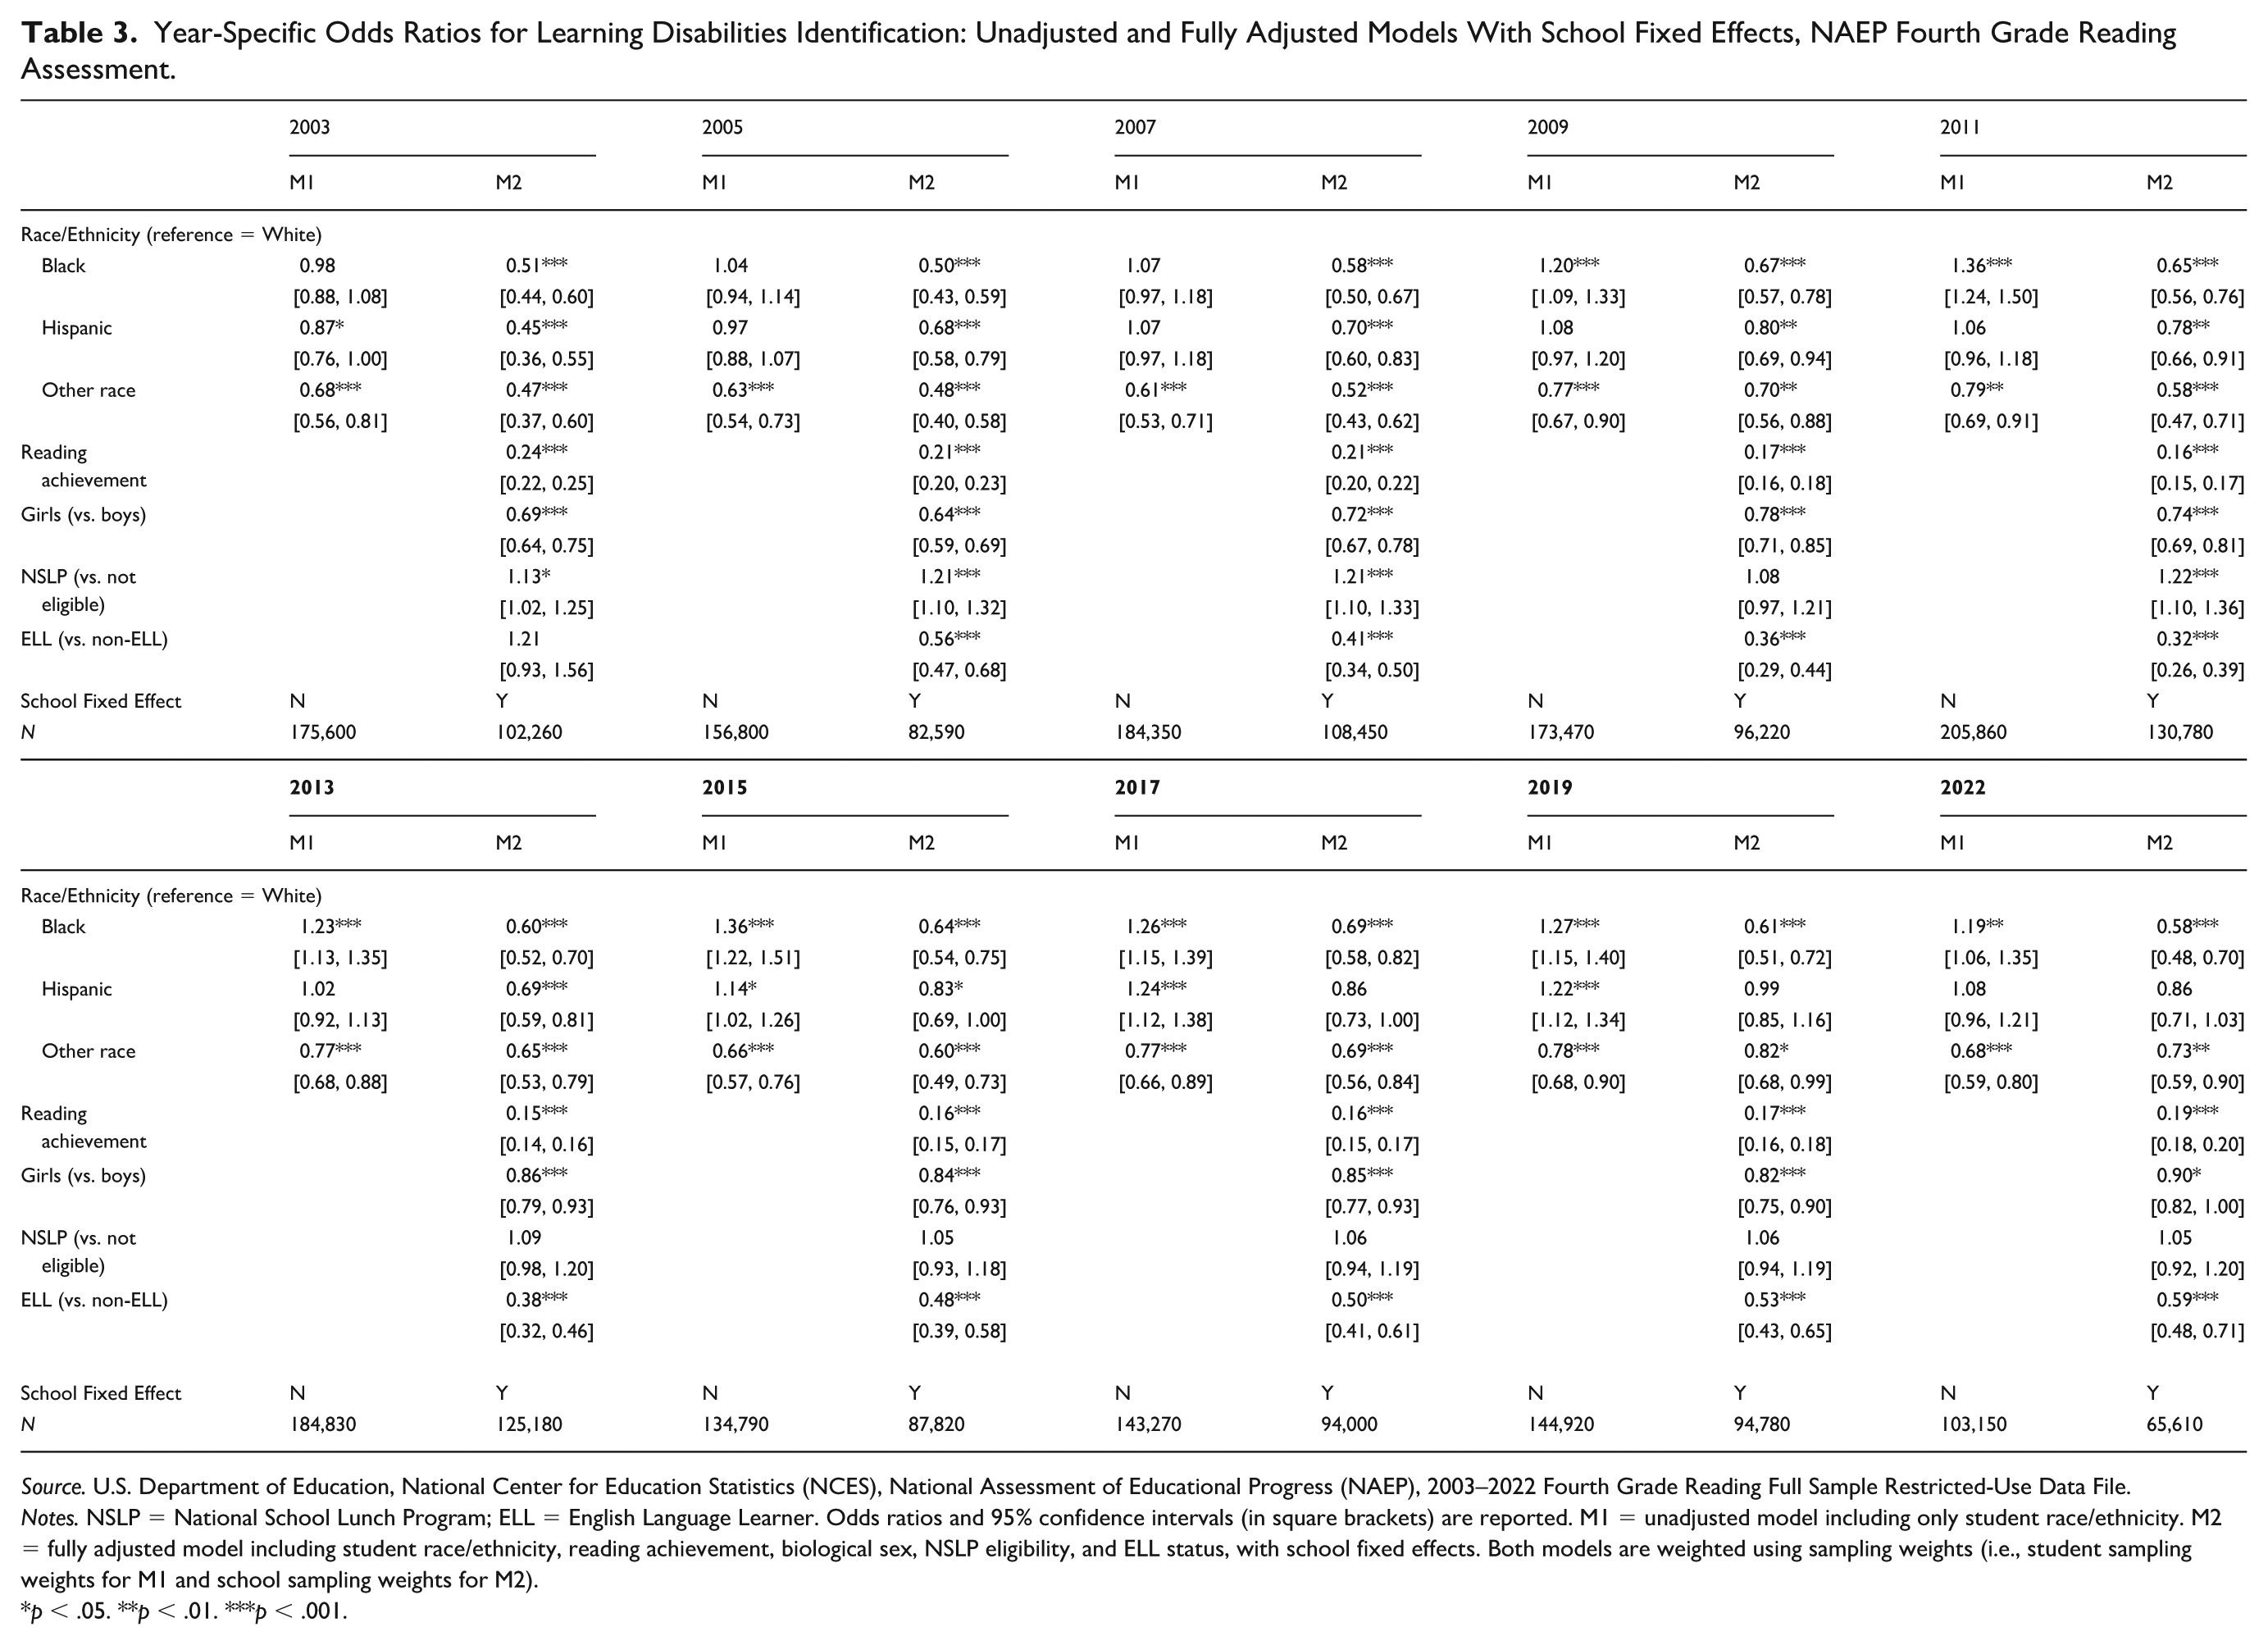
Source. U.S. Department of Education, National Center for Education Statistics (NCES), National Assessment of Educational Progress (NAEP), 2003–2022 Fourth Grade Reading Full Sample Restricted-Use Data File.
Notes. NSLP = National School Lunch Program; ELL = English Language Learner. Odds ratios and 95% confidence intervals (in square brackets) are reported. M1 = unadjusted model including only student race/ethnicity. M2 = fully adjusted model including student race/ethnicity, reading achievement, biological sex, NSLP eligibility, and ELL status, with school fixed effects. Both models are weighted using sampling weights (i.e., student sampling weights for M1 and school sampling weights for M2).
p < .05. **p < .01. ***p < .001.
We also pooled the survey waves into a single dataset and used a binary indicator for the post-2015 period (coded 0 for 2003 through 2013 and 1 for 2015, 2017, 2019, and 2022). We did so to examine whether the racial and ethnic disparities have changed across time, as indicated by the relative change in the size of the disparities before and after the proposal and subsequent implementation of the Equity in IDEA regulations. We estimated three models in the pooled analyses. Model 1 included student race or ethnicity, the post-2015 indicator, and interaction terms. Model 2 adjusted for reading achievement. Model 3 further adjusted for biological sex, ELL status, and NSLP eligibility as well as their interactions with the post-2015 indicator. We also estimated a supplemental model including individual year indicators (with 2015 as the reference year) and their interactions with sociodemographic characteristics to examine more detailed year-to-year variation. Supplemental Table S1 displays results from this additional model. To aid interpretation of interaction terms and estimate predicted disparities over time, we used Stata’s margins command to compute model-based predicted probabilities of LD identification across years for different student subgroups. Figures 1 to 4 display the adjusted predicted probability results by race and ethnicity, biological sex, ELL status, and NSLP eligibility, respectively. We used Stata v. 18.0 to conduct the analyses. We adjusted for sampling weights and used cluster-robust standard errors at the school level, except for the school fixed effect models. As a robustness check, we replicated the primary analyses using mathematics achievement instead of reading achievement as a statistical control. These models used NAEP mathematics data from 2003 to 2022 and identical specifications to the main analyses. Results were substantively similar and are reported in Supplemental Tables S2 and S3.
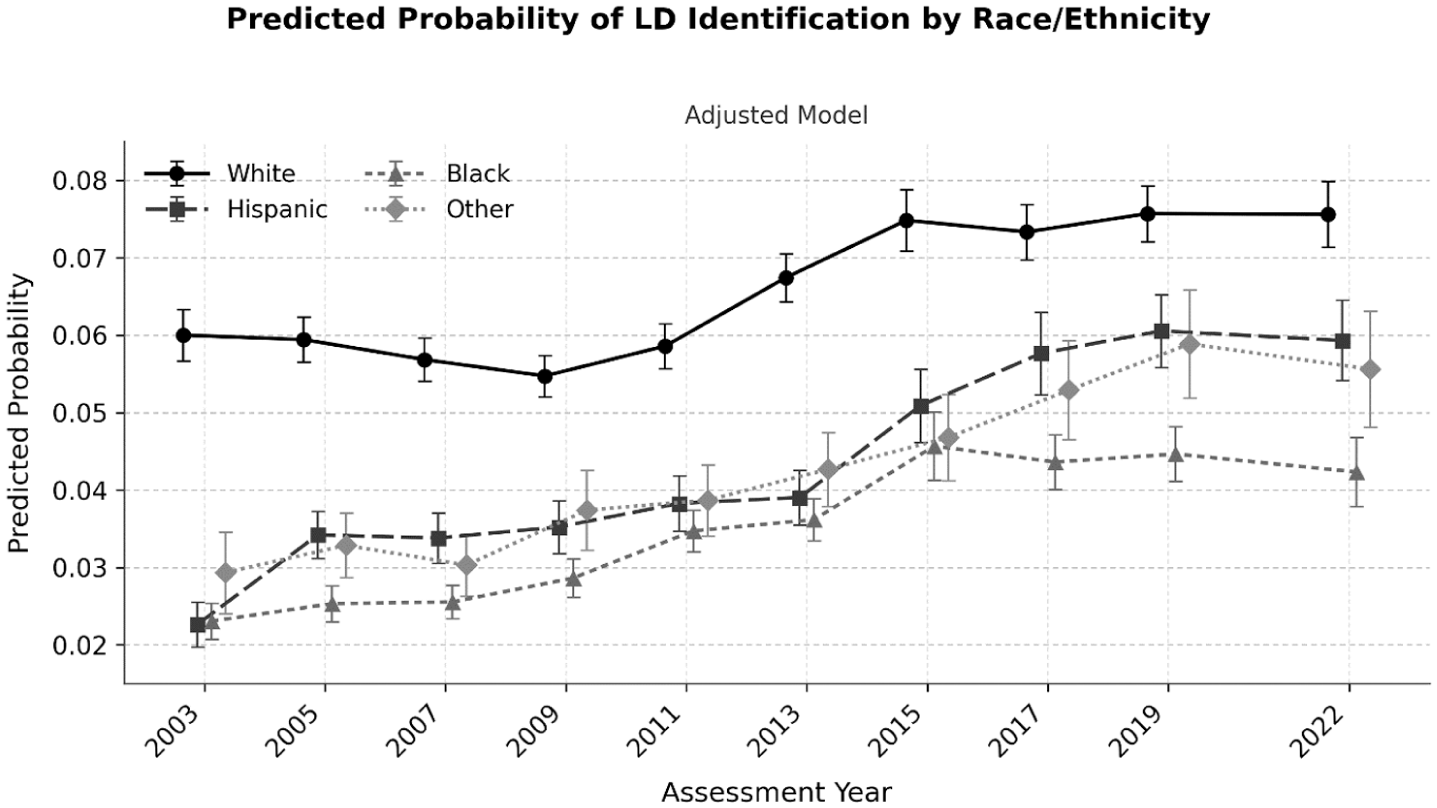
Predicted Probability of Learning Disabilities Identification by Race/Ethnicity and Assessment Year
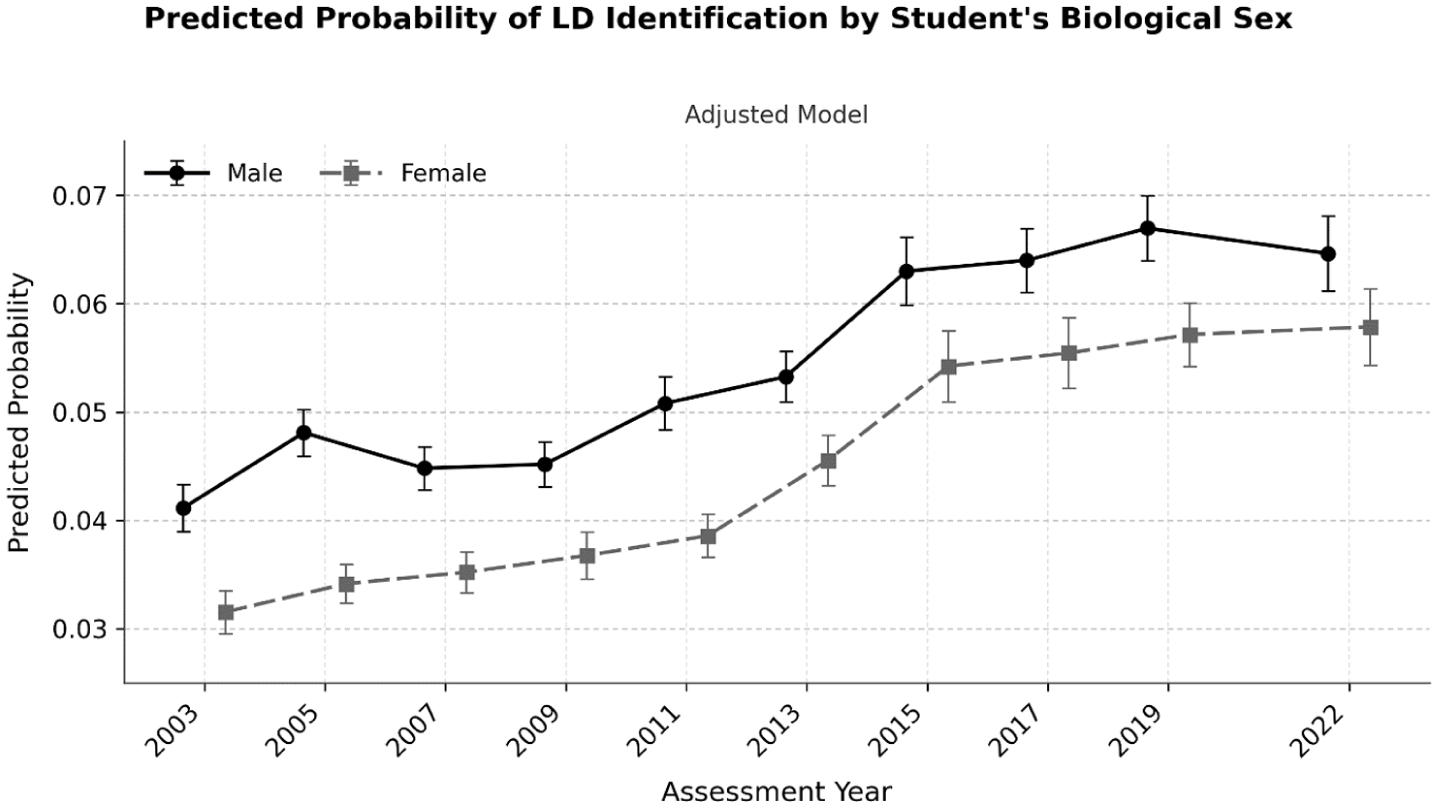
Predicted Probability of Learning Disabilities Identification by Student’s Biological Sex and Assessment Year
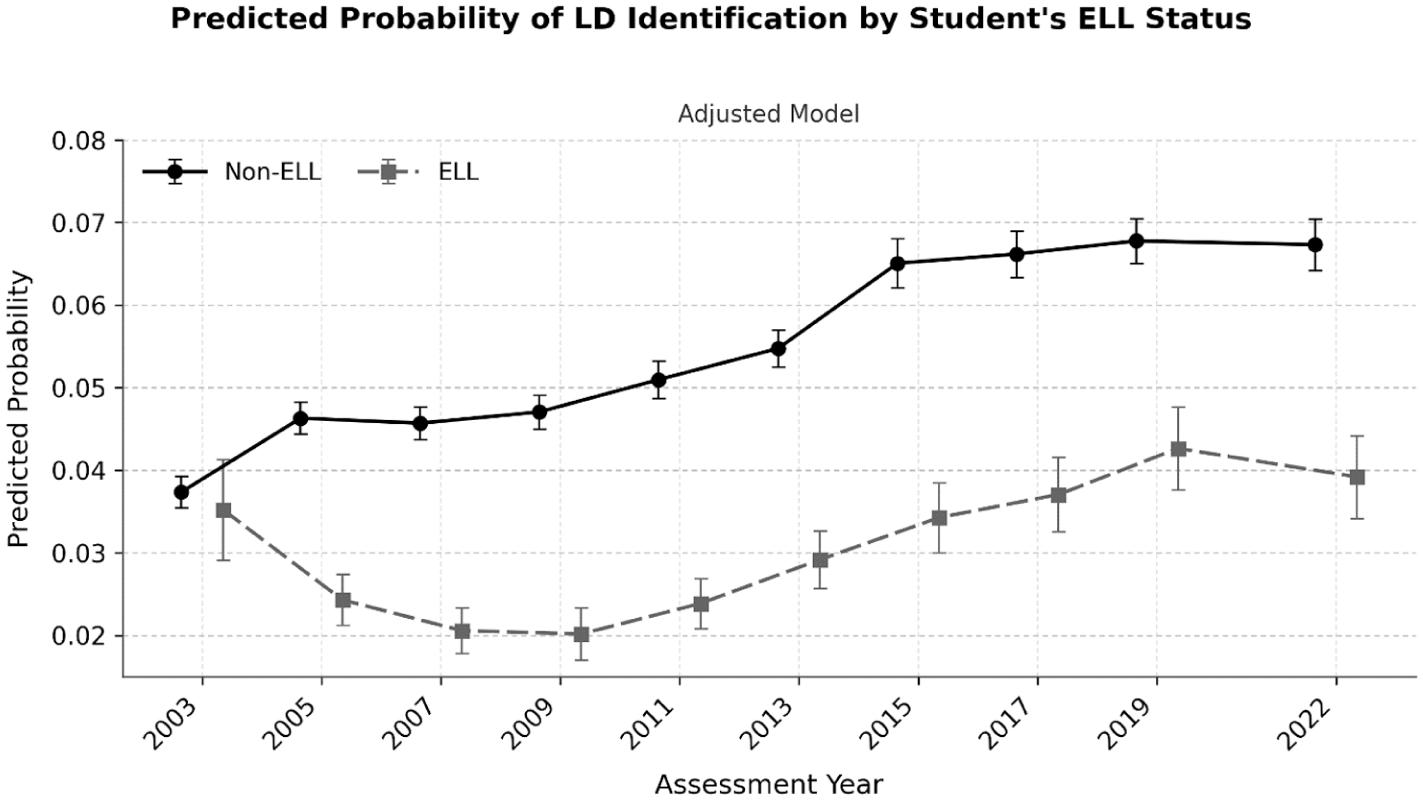
Predicted Probability of Learning Disabilities Identification by Student’s English Language Learner (ELL) Status and Assessment Year
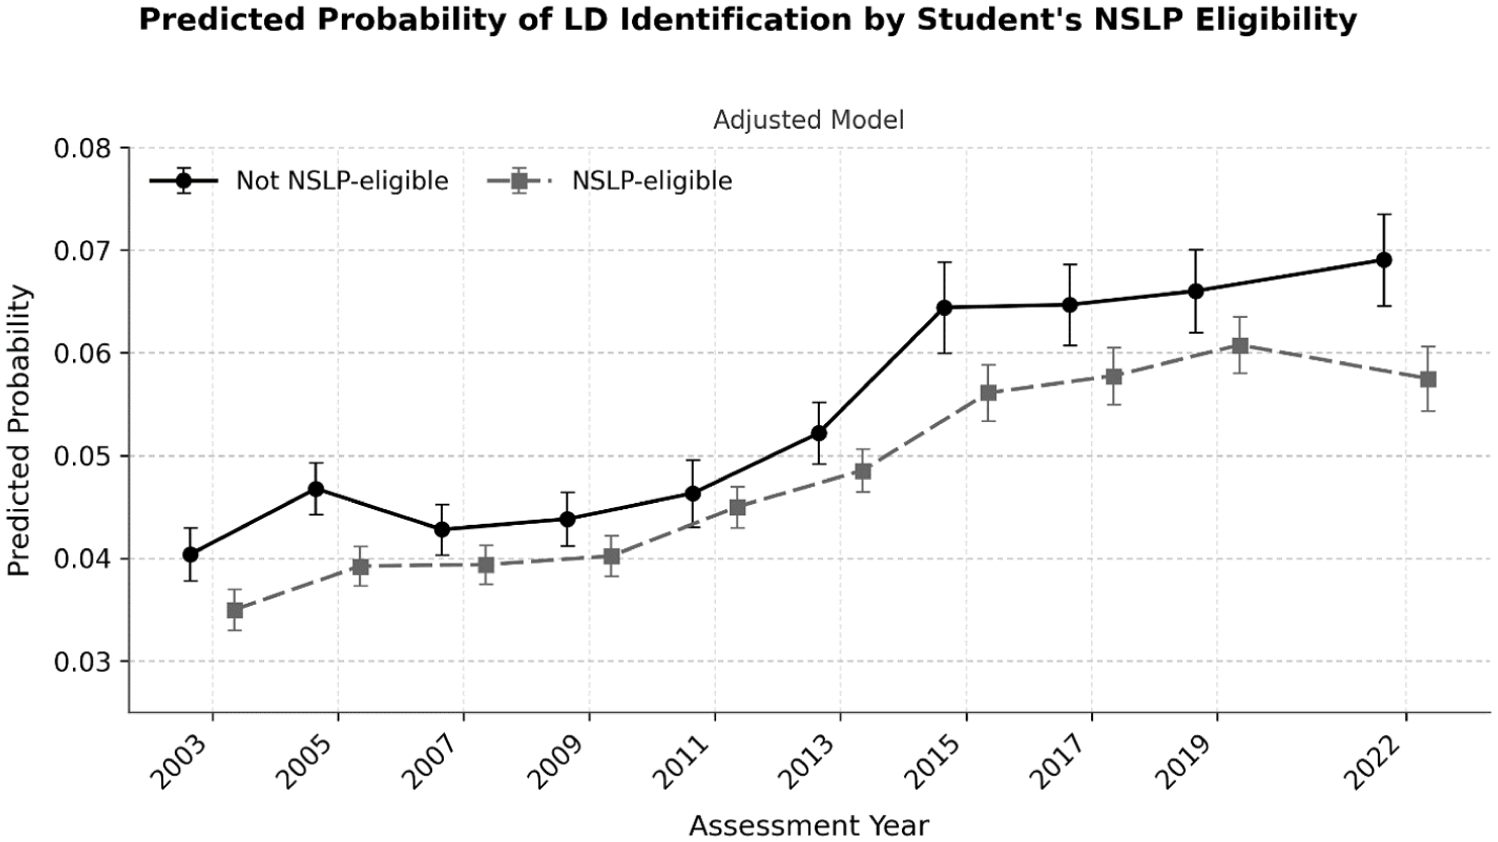
Predicted Probability of Learning Disabilities Identification by Student’s National School Lunch Program Eligibility (NSLP) and Assessment Year
Results
Descriptive Statistics
Table 1 displays descriptive statistics for fourth-grade students who completed the NAEP reading assessments between 2003 and 2022. On average, 5% of students were identified with an LD. This rate increased from 4% in 2003 to 6% in 2017. There were clear demographic shifts over this period. The percentage of White students participating in the NAEP declined from 59% to 46%. The percentage of Black students declined from 17% to 15%. In contrast, the percentage of Hispanic students increased from 18% to 28%. The percentages of ELL students or those eligible for the NSLP steadily increased. Average reading achievement scores improved from 2003 to 2017 but declined in 2019 and again in 2022.
Table 2 displays descriptive analyses of the percentages of students by race and ethnicity identified with LD across the reading achievement distribution in 2022. The percentages of students identified with LD decreased as reading achievement increased. This was the case for each racial and ethnic group. Within each reading achievement decile, the percentages of students identified with LD were consistently lower for Black, Hispanic, and other race or ethnicity students compared to similarly achieving White students. These percentage differences were statistically significant across the deciles in the lowest 50% of the reading achievement distribution. For example, among those displaying reading achievement below the 10th percentile, consistent with reading disabilities prevalence (Di Folco et al., 2021; Snowling et al., 2021), 36% of White students were identified with LD. The contrasting percentages for similarly achieving Black, Hispanic, or other race or ethnicity students were 22%, 23%, and 26%, respectively.
Year-Specific Analyses With School Fixed Effects
Table 3 displays odds ratios (OR) and 95% confidence intervals (CI) from the logistic regression models, separately estimated for each of the ten survey waves. In Model 1’s unadjusted analyses, Black and Hispanic students generally had similar or somewhat higher odds of LD identification than White students. For example, in 2011, Black students had higher odds (OR = 1.36, 95% CI [1.24, 1.50]), while Hispanic students showed no significant difference (OR = 1.06, 95% CI [0.96, 1.18]), compared to White students. In fully adjusted models (Model 2) that included reading achievement, biological sex, NSLP eligibility, ELL status, and school fixed effects, Black, Hispanic, and other race or ethnicity students were repeatedly less likely to be identified with LD than similarly situated White students. Black students had significantly lower odds of LD identification than White students in each of the ten survey waves (e.g., 2011: adjusted OR [aOR] = 0.65, 95% CI [0.56, 0.76]; 2019: aOR = 0.61, 95% CI [0.51, 0.72]). The Black-White aORs ranged from 0.50 to 0.69. Hispanic students had consistently lower odds than White students. The Hispanic-White aORs ranged from 0.45 to 0.83. These disparities were not statistically significant in data from 2017, 2019, and 2022 (e.g., 2022: aOR = 0.86, 95% CI [0.71, 1.03]). Other race or ethnicity students had consistently lower odds than White students (e.g., 2015: aOR = 0.60, 95% CI [0.49, 0.73]), with the aORs ranging from 0.47 to 0.82. Girls consistently had lower odds of LD identification than boys across each of the ten assessment waves (e.g., 2005: aOR = 0.64, 95% CI [0.59, 0.69]; 2022: aOR = 0.90, 95% CI [0.82, 1.00]). The female-male aORs ranged from 0.64 to 0.90. The ELL students have been less likely to be identified than similarly situated non-ELL students since 2005. These aORs ranged from 0.32 to 0.59. NSLP eligibility was not consistently associated with LD identification.
Pooled Analyses of Pre- and Post-2015 Periods
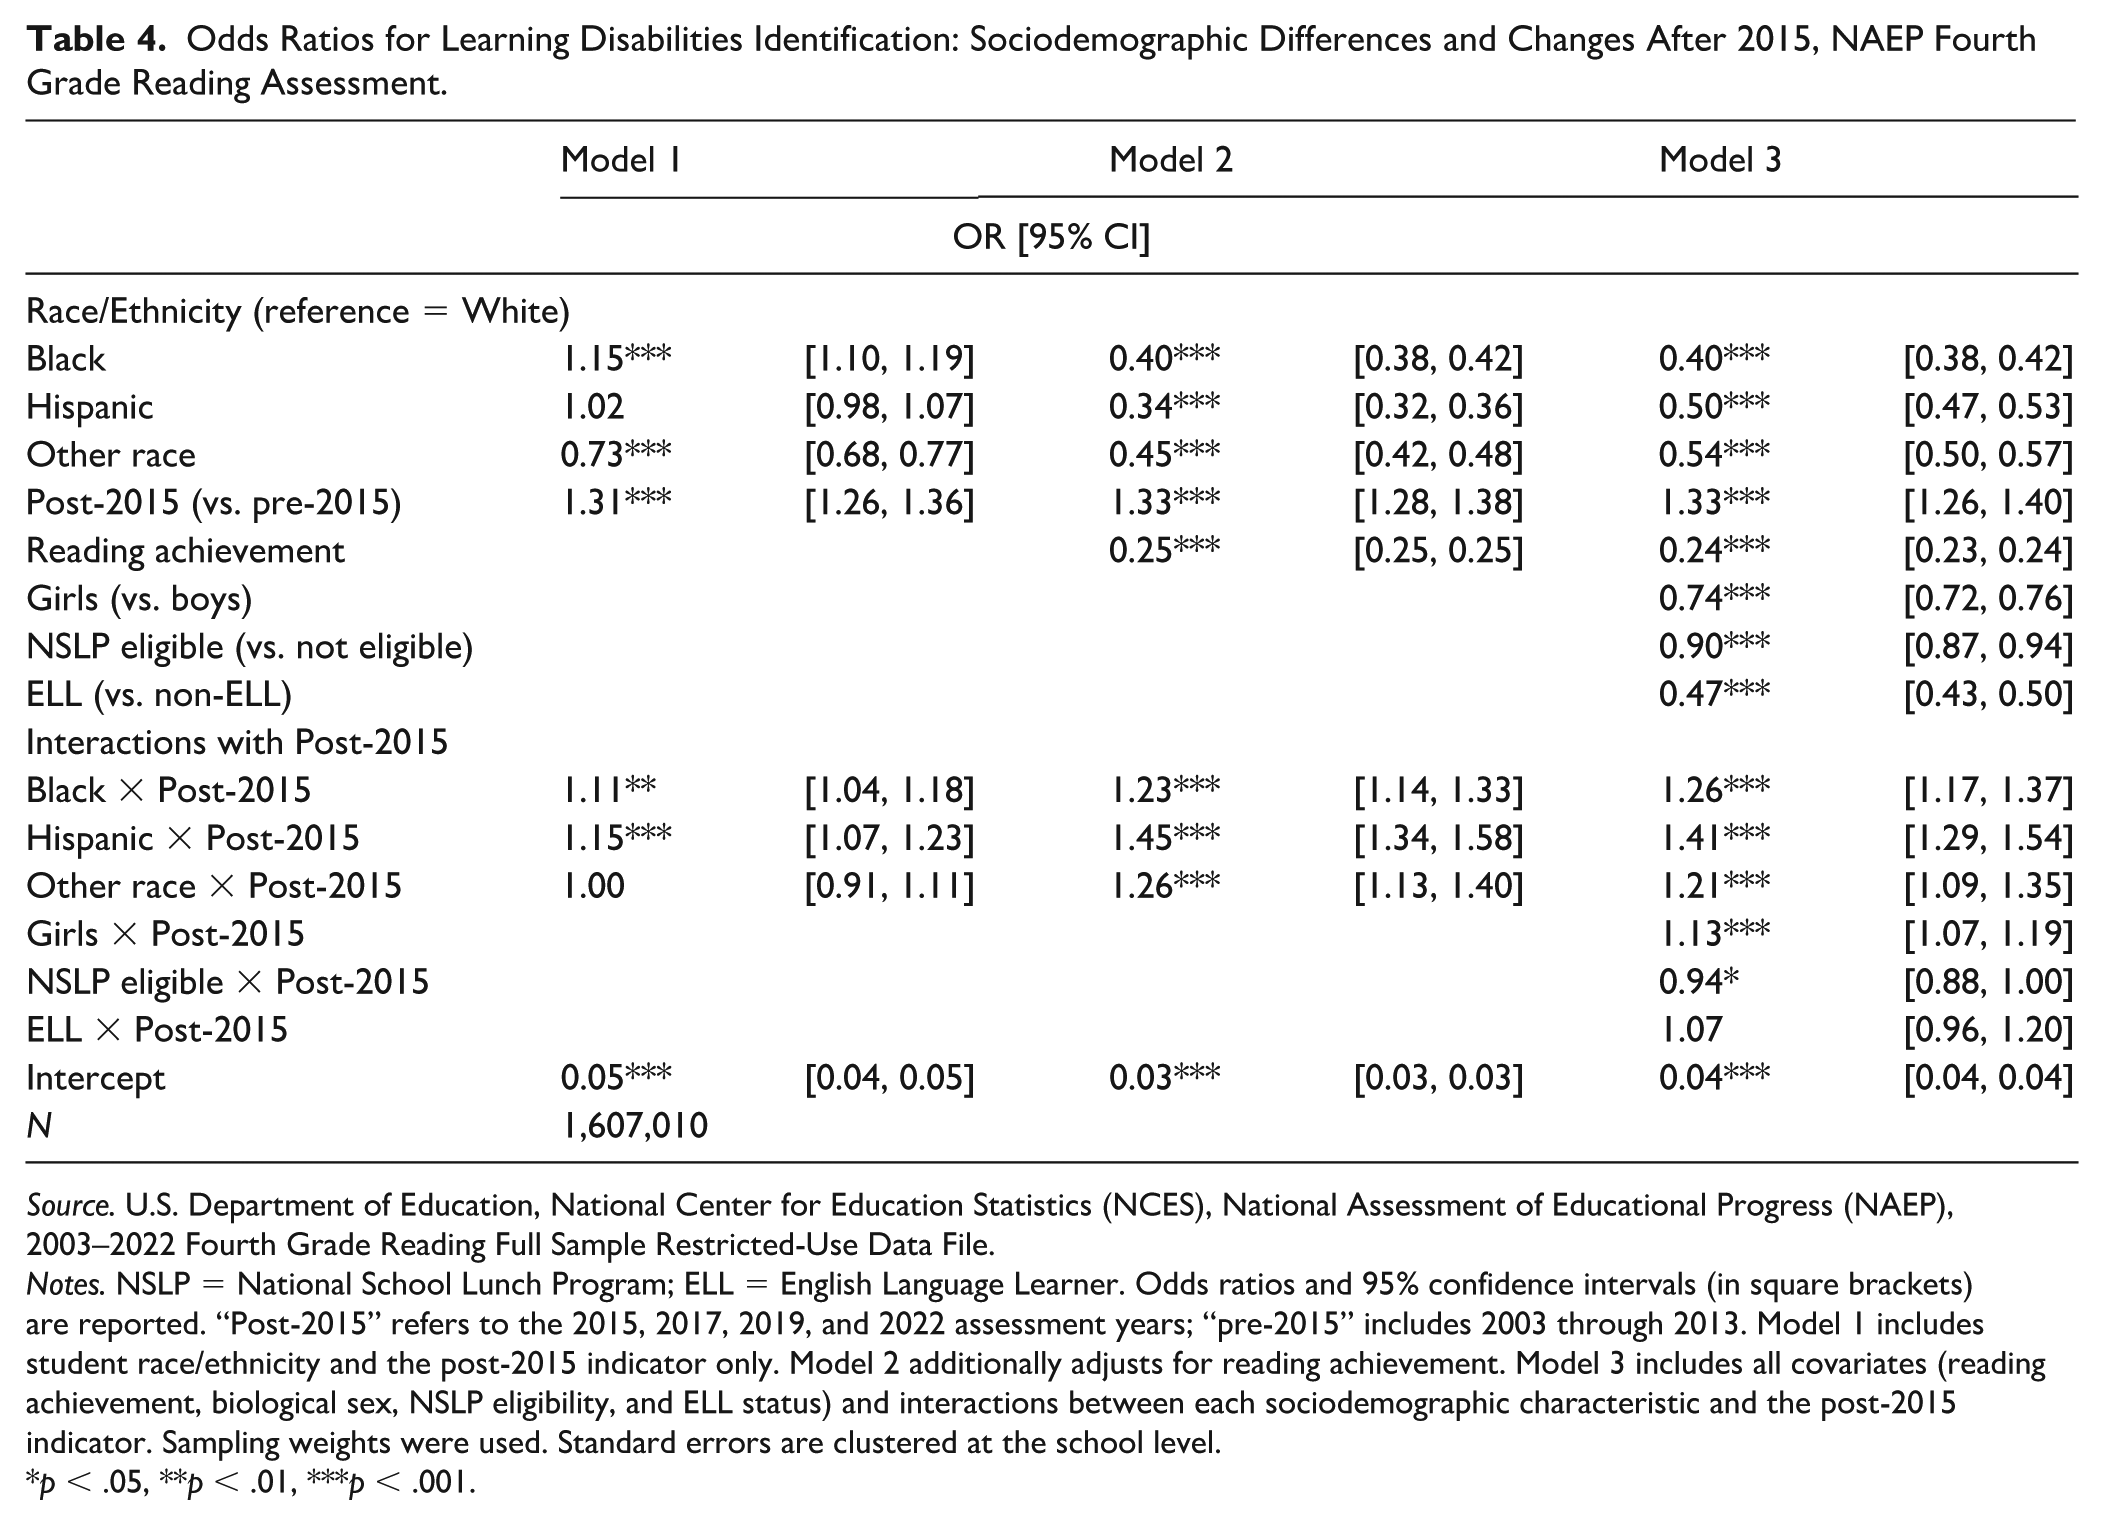
Table 4 displays results from the pooled logistic regression models comparing the pre- and post-2015 periods. The main effects for race or ethnicity indicate differences in odds of identification relative to White students before 2015. The main effects for biological sex, NSLP eligibility, and ELL status represent differences relative to their respective reference groups before 2015. In Model 1, the post-2015 term reflects the change in odds for White students after 2015 compared to before 2015. In Model 2, the post-2015 term reflects the change for White students after adjusting for reading achievement. In Model 3, the post-2015 term reflects the change across the full set of reference groups (i.e., White students, boys, non-NSLP, non-ELLs) in analyses accounting for reading achievement. The interaction terms (e.g., Black students × post-2015 or girls × post-2015) show how the odds between each subgroup and the reference group changed post-2015 relative to pre-2015.
Odds Ratios for Learning Disabilities Identification: Sociodemographic Differences and Changes After 2015, NAEP Fourth Grade Reading Assessment.
Source. U.S. Department of Education, National Center for Education Statistics (NCES), National Assessment of Educational Progress (NAEP), 2003–2022 Fourth Grade Reading Full Sample Restricted-Use Data File.
Notes. NSLP = National School Lunch Program; ELL = English Language Learner. Odds ratios and 95% confidence intervals (in square brackets) are reported. “Post-2015” refers to the 2015, 2017, 2019, and 2022 assessment years; “pre-2015” includes 2003 through 2013. Model 1 includes student race/ethnicity and the post-2015 indicator only. Model 2 additionally adjusts for reading achievement. Model 3 includes all covariates (reading achievement, biological sex, NSLP eligibility, and ELL status) and interactions between each sociodemographic characteristic and the post-2015 indicator. Sampling weights were used. Standard errors are clustered at the school level.
p < .05, **p < .01, ***p < .001.
In the unadjusted Model 1, and before 2015, Black students had 15% higher odds of LD identification compared to White students (OR = 1.15, 95% CI [1.10, 1.19]), Hispanic students had similar odds to White students (OR = 1.02, 95% CI [0.98, 1.07]), and other race or ethnicity students had 27% lower odds compared to White students (OR = 0.73, 95% CI [0.68, 0.77]). Post-2015, White students had 31% higher odds of identification compared to before 2015 (OR = 1.31, 95% CI [1.26, 1.36]). The interaction terms indicated that, relative to White students, Black (OR = 1.11), Hispanic (OR = 1.15), and other race or ethnicity students (OR = 1.00) were more likely to be identified after 2015, suggesting slight changes in the disparities. In Model 2 that adjusted for reading achievement, and before 2015, Black students had 60% lower odds of LD identification relative to White students (aOR = 0.40, 95% CI [0.38, 0.42]), Hispanic students had 66% lower odds (aOR = 0.34, 95% CI [0.32, 0.36]), and other race or ethnicity students had 55% lower odds (aOR = 0.45, 95% CI [0.42, 0.48]). After 2015, White students again had higher odds of identification (aOR = 1.33, 95% CI [1.28, 1.38]). The interaction terms indicated that, relative to White students, Black (aOR = 1.23), Hispanic (aOR = 1.45), and other race or ethnicity students (aOR = 1.26) were relatively more likely to be identified after 2015, reflecting a partial reduction in the size of the disparities. In Model 3, which further adjusted for biological sex, NSLP eligibility, and ELL status, indicated that before 2015, Black students had 60% lower odds of LD identification relative to White students (aOR = 0.40, 95% CI [0.38, 0.42]), Hispanic students had 50% lower odds (aOR = 0.50, 95% CI [0.47, 0.53]), and other race or ethnicity students had 46% lower odds (aOR = 0.54, 95% CI [0.50, 0.57]). After 2015, White students had 33% higher odds of identification (aOR = 1.33, 95% CI [1.26, 1.40]). The interaction terms indicated that, relative to White students, Black (aOR = 1.26), Hispanic (aOR = 1.41), and other race or ethnicity students (aOR = 1.21) were relatively more likely to be identified, suggesting that the racial and ethnic disparities have lessened over time after 2015 including following the proposal of the Equity in IDEA regulations.
To aid interpretation of the interaction terms, Table 5 presents model-based predicted probabilities of LD identification before and after 2015, using Stata’s margins command. In the fully adjusted Model 3, Black and Hispanic students displayed substantial increases in predicted probabilities post-2015 (+1.58% and +2.31%, respectively), with Hispanic students experiencing the largest relative gain. We observed similar results across biological sex, NSLP eligibility, and ELL status, although disparities between the student groups continued to occur. These results suggest that the relative likelihoods of LD identification increased across the sociodemographic populations including for students of color after 2015. Figures 1 to 4 display the adjusted predicted probability results and 95% CIs from 2003 to 2022 by race and ethnicity, biological sex, ELL status, and NSLP eligibility, respectively.
Predicted Probabilities of Learning Disabilities Identification Before and After 2015 by Student Characteristics and Model Specification (Corresponding to Table 4’s Interaction Estimates).
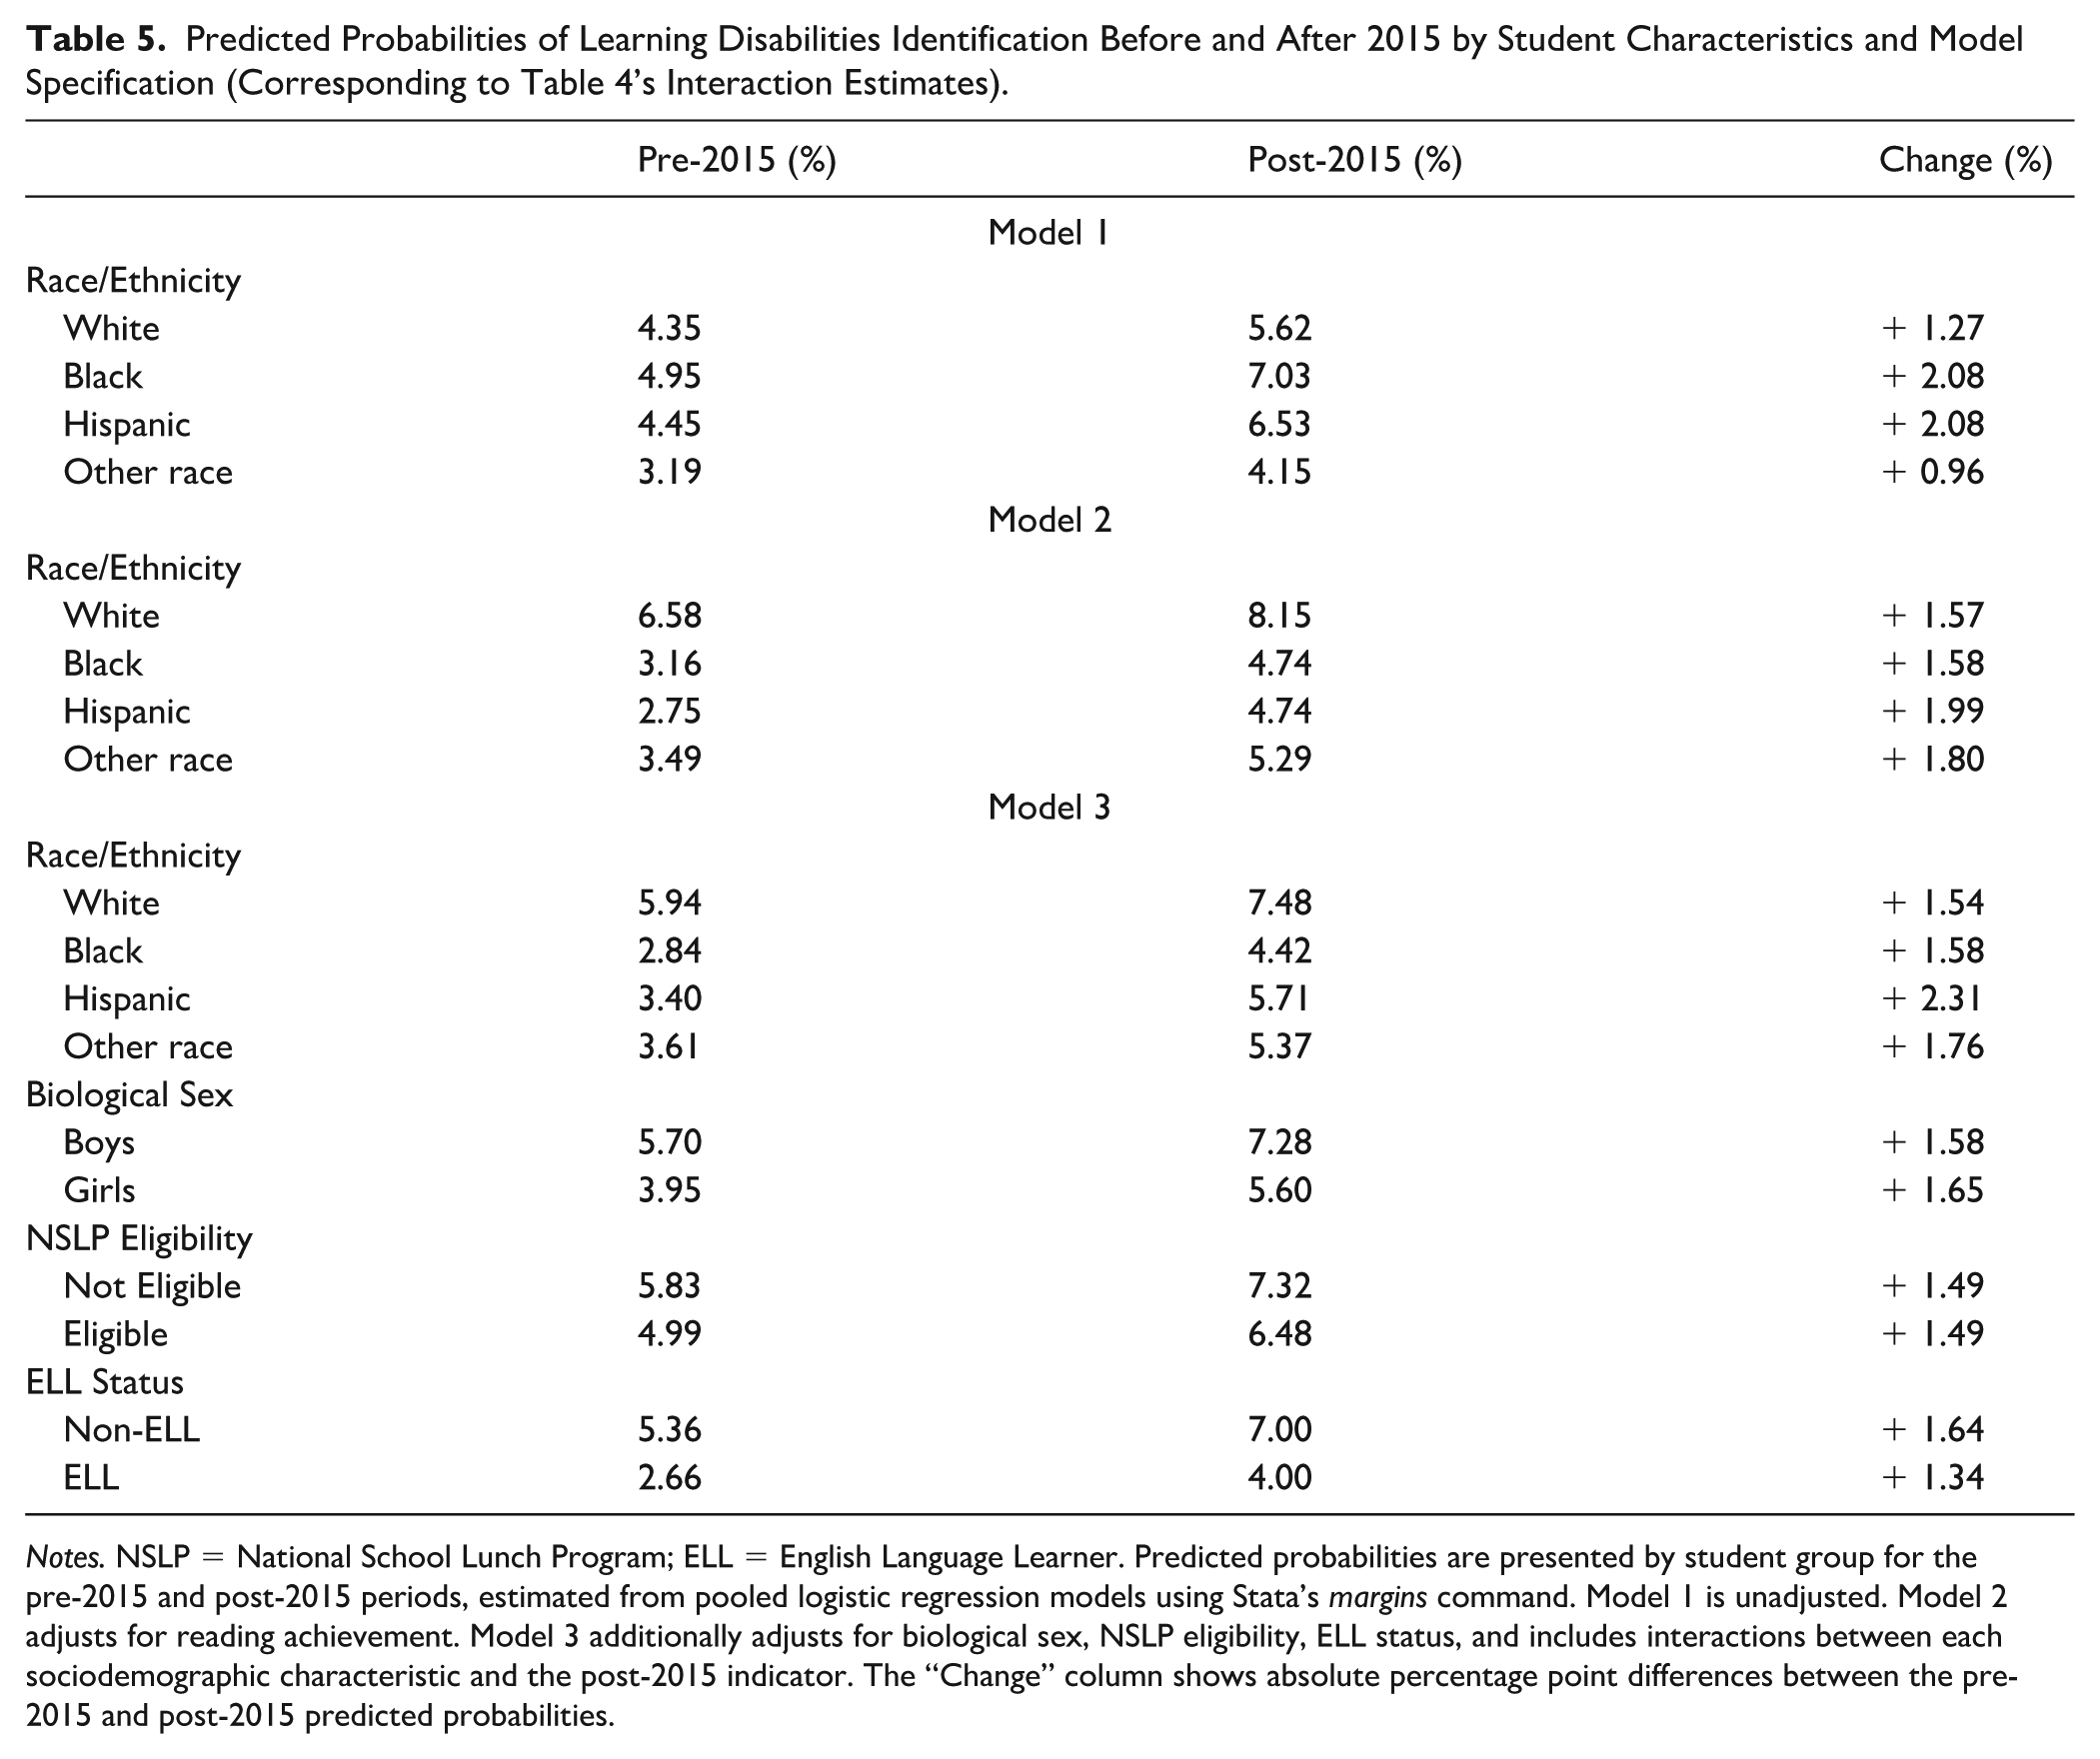
Notes. NSLP = National School Lunch Program; ELL = English Language Learner. Predicted probabilities are presented by student group for the pre-2015 and post-2015 periods, estimated from pooled logistic regression models using Stata’s margins command. Model 1 is unadjusted. Model 2 adjusts for reading achievement. Model 3 additionally adjusts for biological sex, NSLP eligibility, ELL status, and includes interactions between each sociodemographic characteristic and the post-2015 indicator. The “Change” column shows absolute percentage point differences between the pre-2015 and post-2015 predicted probabilities.
Discussion
Analyses of ten repeated cross-sectional surveys yielded repeated evidence of sociodemographic disparities in LD identification in U.S. elementary schools. Black students were less likely than similarly situated White students to be identified with LD across each of the ten survey waves. Hispanic students also have been less likely to be identified, although these disparities have not been statistically significant in more recently collected data. Both girls and ELLs are consistently less likely to be identified than similarly situated boys and non-ELLs. We did not observe evidence to support the Equity in IDEA regulations, as repeatedly indicated by the lack of findings of LD over-identification of students of color relative to similarly situated White students. We also did not observe that the regulations are associated with relative declines in the likelihoods that students of color are identified with LD. The likelihood of LD identification has generally increased after 2015 including for Black and Hispanic students, students of other races and ethnicities, and girls, possibly because of the general trend of increasing prevalence of LD in students attending U.S. elementary schools (U.S. Department of Education, 2024).
Strengths and Limitations
Our study has several strengths. We extend the limited extant work by examining for under-identification in more recently collected data including the period following the proposal and implementation of the Equity in IDEA regulations. Prior work has examined district- or state-specific samples of more limited generalizability to the diverse U.S. student population (Cruz & Firestone, 2022; Grindal et al., 2019) or analyzed relatively dated nationally representative samples including those collected prior to the proposal and implementation of the Equity in IDEA regulations (Hibel et al., 2010; Morgan et al., 2015; Morgan et al., 2025; Morgan, Farkas, Hillemeier & Maczuga, 2017; Shifrer, 2018). Our study adds to the limited prior work analyzing nationally representative samples and using statistical controls for strong confounds including student academic achievement and family economic resources (Morgan, Farkas, Hillemeier & Maczuga, 2017; Morgan et al., 2018). Prior work has not evaluated the extent to which racial and ethnic disparities in LD identification have changed in U.S. elementary schools across time. We do so with data repeatedly collected from 2003 to 2022.
Our study also has limitations. We were unable to evaluate the quality of the services provided to students with LD including variation across sociodemographic subpopulations. Students with LD attending schools in segregated and under-resourced schools may receive relatively lower quality special education services. However, the limited work currently available suggests that students with LD including those of color benefit from receipt of these services (O’Hagan & Stiefel, 2025; Schwartz et al., 2021; Woods et al., 2023). We did not examine for racial and ethnic disparities in special education placements. Such work is reported elsewhere (Morgan et al., 2023). The factors resulting in heterogeneity in student academic achievement are likely multifaceted. Evidence of learning difficulties is one aspect of whether students have LD. School multidisciplinary teams also assess whether these difficulties primarily result from psychological processing disorders and not from environmental, cultural, or economic disadvantage. Data on the specific processes used by school multidisciplinary teams to make eligibility decisions are unavailable for analysis in the NAEP. Our use of school fixed effects limited the analyses to contrasts between students attending the same schools. These estimates, therefore, may have relatively less generalizability (Hill et al., 2020). Our use of school fixed effects precludes examination of how specific school contextual factors interact with student race or ethnicity to increase or decrease the likelihood of disability identification. Our study does not support causal inferences. We report associations between LD identification and race or ethnicity, biological sex, and ELL status in cross-sectional analyses adjusting for the strong confounds of student academic achievement, family economic disadvantage, and school contextual factors.
The NAEP’s data collection following the proposal of the Equity in IDEA regulations was limited to three survey waves. Additional trends may be observed as additional survey waves become available. We examined disparities during elementary school. Future studies that examine disparities in LD identification across the entire K–12th grade period are warranted including those based on state administrative datasets (Gilmour & Stiefel, 2025). Researchers have yet to quantitatively assess for intersectional disparities in LD identification across race and ethnicity, family income, gender, and language use. This is despite the potential for such analyses to better inform health and educational policies (Younas et al., 2025). Also lacking are well-designed qualitative studies reporting on the experiences of families of color raising children with LD as they navigate the U.S. special education system. Analogous studies have been repeatedly conducted in public health but are largely lacking in special education (e.g., Rivera-Figueroa et al., 2022; Singh & Bunyak, 2019).
Study’s Contributions and Implications
We consistently fail to find the evidence of LD over-identification attributable to systemic bias or discriminatory practices (Grindal et al., 2019; Skiba et al., 2005). Our results run contrary to assertions that U.S. schools are using special education to racially segregate students of color (Blanchett, 2025; Ferri & Connor, 2005a, 2005b). Instead, our repeatedly replicated results suggest that explanations of minority over-representation in special education as the result of systemic bias, discriminatory practices, or deliberate attempts by U.S. schools to racially sort and segregate students are not empirically supported. Such findings are likely spurious and may result from failing to account for strong confounds including the clinically relevant factor of student academic achievement (Morgan et al., 2015; Morgan et al., 2025). Alternatively, it is possible that prior reports of over-identification may be specific to local contexts. This would suggest that the available empirical evidence of over-identification may have limited generalizability. Other work investigating over-identification in local contexts where racial segregation might be expected to occur repeatedly finds that students of color are less likely to be identified including for LD in adjusted analyses (Morgan et al., 2020).
Our findings replicate other studies reporting that Black or Hispanic students are less likely to be identified with LD than similarly situated White students (Morgan et al., 2025; Morgan, Farkas, Cook, et al., 2017). We provide additional empirical support for suggestions that special education services in U.S. schools, which are costly to provide and in increasing demand (Kaput & Schiess, 2024; U.S. Department of Education, 2024), are more likely to be provided to White, English-speaking students than to similarly situated Black, Hispanic, or non-English-speaking students (Elder et al., 2021; Farkas et al., 2020; Morgan et al., 2015; Morgan & Hu, 2023), including due to the possibility of biased classification processes (Morgan et al., 2025). Our findings are consistent with mechanisms hypothesized to result in students of color being less likely than similarly situated White students to be identified with LD while attending U.S. schools. Examples include teachers being more likely to consider an underlying disability as an explanation for the academic difficulties of White students (Cooc, 2017), the greater likelihood of Black and Hispanic students to attend racially segregated and under-resourced schools (Hibel et al., 2010; Stiefel et al., 2024), and stereotypes by school personnel that limit access to supports by students of color with disabilities (Rivera & Tilcsik, 2023).
Our results have policy and practice implications. The lack of appropriate LD identification in diverse student populations may be resulting in educational, health, and societal inequities including lower achievement, greater risks for exclusionary discipline and involvement with the criminal justice system, and lower educational attainment (Ballis & Heath, 2021; Basch, 2011; O’Hagan & Stiefel, 2025; Woods et al., 2023). Our results provide additional empirical support for educational and health policies designed to ensure equal access to school-based disability services and supports. Example practices that may help to address under-identification include disseminating evidence-based information about disabilities, due process and eligibility procedures in schools that are widely accessible to parents across diverse racial, ethnic, economic, and language backgrounds, and greater access to interpreters and culturally sensitive providers who share accessible information about special education’s eligibility procedures to families of color (Cycyk et al., 2025; Morgan et al., 2015; Morgan, Farkas, Cook, et al., 2017; Morgan & Hu, 2023).
We find no empirical support for the Equity in IDEA regulations, as indicated by a repeated lack of evidence of LD over-identification attributable to race, ethnicity, or national origin across 2003 to 2022. Although we observe some evidence that the size of the disparities has decreased over time, our analyses indicate the LD under-identification of students of color is continuing to occur in U.S. elementary schools. Collectively, our results suggest greater attention to inequities in the U.S. special education system that may be inadvertently privileging access to services and supports by White, English-speaking students and their families.
Supplemental Material
sj-docx-1-ldx-10.1177_00222194261453914 – Supplemental material for Racial and Ethnic Disparities in Learning Disabilities Identification in U.S. Elementary Schools
Supplemental material, sj-docx-1-ldx-10.1177_00222194261453914 for Racial and Ethnic Disparities in Learning Disabilities Identification in U.S. Elementary Schools by Paul L. Morgan and Eric Hengyu Hu in Journal of Learning Disabilities
Footnotes
Funding
The study’s analyses were supported by the U.S. Department of Education’s Institute of Education Sciences (grant number R324A220271) and the National Institute on Minority Health and Health Disparities (grant number #MD003373) to the University at Albany, State University of New York. The opinions expressed are those of the authors and do not represent the views of the Institute of Education Sciences or the National Institute on Minority Health and Health Disparities.
Declaration of Conflicting Interests
The authors declared no potential conflicts of interest with respect to the research, authorship, and/or publication of this article.
References
Supplementary Material
Please find the following supplemental material available below.
For Open Access articles published under a Creative Commons License, all supplemental material carries the same license as the article it is associated with.
For non-Open Access articles published, all supplemental material carries a non-exclusive license, and permission requests for re-use of supplemental material or any part of supplemental material shall be sent directly to the copyright owner as specified in the copyright notice associated with the article.