
Abstract
This study aimed to validate a fluency-based curriculum-based measurement (CBM) tool for identifying kindergarten students at risk for mathematics learning disabilities within a Spanish-speaking context, addressing the need to examine early numeracy screening beyond predominantly English-speaking environments. A sample of 302 kindergarten students was assessed at three intervals (beginning, middle, and end of the year) using fluency-based measures targeting skills such as quantity discrimination, quantity array, missing number, number identification, and counting aloud. The number identification task and a composite score emerged as particularly strong predictors of risk status, demonstrating adequate reliability, concurrent validity, and predictive validity. Receiver operating characteristic (ROC) analysis and hierarchical linear modeling confirmed the accuracy of this screening tool in identifying students at risk and capturing growth across the year. Longitudinal measurement invariance analyses further confirmed that a stable latent factor was consistently represented across kindergarten benchmarks. These findings are discussed in light of the need for context-specific validation within Spanish-speaking educational settings.
Keywords
Early numeracy skills are widely recognized as key predictors of future academic success and have been the focus of substantial research (Beliakoff et al., 2025; Jordan et al., 2022). These skills encompass a broad range of abilities, including counting, number recognition, magnitude comparison, symbolic understanding, and simple arithmetic operations. Within this broader domain, number sense is considered a foundational component. It refers to the intuitive understanding of numbers and their relationships and typically emerges before formal schooling (Ghazali et al., 2021; Jordan et al., 2022). Importantly, early weaknesses in these foundational skills are strongly associated with persistent mathematics difficulties, underscoring the need for accurate identification of students at risk as early as kindergarten (Morgan et al., 2009).
Furthermore, number sense in kindergarten has been shown to predict not only later calculation fluency and mathematics achievement (Jordan et al., 2010; Nguyen et al., 2016; Ten Braak et al., 2022) but also broader academic and life outcomes (Morgan et al., 2016; Ritchie & Bates, 2013). Research further shows that targeted numeracy instruction in kindergarten can significantly improve outcomes and reduce later difficulties (Clarke et al., 2015; Doabler et al., 2021). Because difficulties that emerge early tend to persist and intensify without timely intervention, kindergarten represents a critical window for the valid identification of students at risk and for informing early instructional decision-making (Akther et al., 2025; Beliakoff et al., 2025; Nelson et al., 2025). Thus, kindergarten screening plays a central role in both prevention and the timely allocation of instructional support.
This growing body of evidence underscores the need for comprehensive and developmentally appropriate assessment tools, such as curriculum-based measurement (CBM), that can capture key components of number sense through brief, fluency-based tasks. Although CBMs can serve various purposes, including screening and progress monitoring, it is critical to distinguish between these applications, as they require different types of evidence (Nelson et al., 2025). The current study focuses solely on the use of CBMs for universal screening, not for progress monitoring, which typically requires more frequent measurement points and different methodological considerations. In this context, recent reviews have identified the core skills most predictive of mathematics difficulties, namely counting, symbolic number knowledge, and magnitude comparison, emphasizing their value for screening purposes (Akther et al., 2025; Lin & Powell, 2023).
The validation framework proposed by Fuchs (2004) provides the conceptual basis for the present study. This framework delineates three key stages for CBM research: (a) evidence that the CBM tasks measure the intended construct, (b) evidence that the slope of growth is meaningful and reliable, and (c) evidence that the measure supports instructional decision-making. This three-part framework offers a clear structure for evaluating the technical adequacy of CBM tools and aligns well with the goals of this study.
Stage 1: Evidence That the CBM Measures the Intended Construct
The first stage of validation involves demonstrating that the tasks reflect the targeted construct, in this case, early numeracy skills. The CBM is well established as an effective tool for assessing early mathematics performance (Nelson et al., 2023; VanDerHeyden & Solomon, 2023), and prior research has validated its technical adequacy for the early identification of at-risk students (Martinez et al., 2009; Seethaler & Fuchs, 2011; VanDerHeyden et al., 2006). Fluency-based CBM tasks, such as quantity discrimination, missing numbers, number identification, and counting, have consistently shown strong predictive validity for mathematics achievement (Clarke et al., 2020; Conoyer et al., 2016; Laracy et al., 2016; Martinez et al., 2009; Purpura & Lonigan, 2015; Seethaler & Fuchs, 2011; VanDerHeyden et al., 2006). These tasks are especially useful for early screening and have been shown to significantly increase classification accuracy (Kiss & Christ, 2019; Nelson et al., 2023; Sutherland et al., 2021). In addition, VanDerHeyden and Solomon (2023) reported that, in CBM contexts, fluency, defined as the rate of correct responses per minute, tends to be more reliable than accuracy-only indices. Although both formats can be administered with time limits, fluency scores are rate measures (correct responses per minute), whereas accuracy-only metrics summarize the number or proportion correct without a rate component.
Building on this evidence, Nelson et al. (2025) demonstrated the reliability of a brief early numeracy CBM system (ASPENS), confirming its strong internal consistency, test–retest reliability, and diagnostic accuracy in identifying at-risk students across the school year. Their study also showed that brief fluency-based tasks such as quantity discrimination and numeral identification achieved high classification accuracy and Area under the ROC curve (AUC) values, reinforcing their value in universal screening protocols. Despite this growing support, recent reviews have highlighted gaps in the psychometric quality of early numeracy screeners. Outhwaite et al. (2024), in a review of 41 assessments, reported that few demonstrated strong validity or reliability, and only four showed adequate sensitivity for identifying at-risk children. Similarly, Speyer et al. (2024) found limited content validity in many assessments. In contrast, Beliakoff et al. (2025) reported that brief number sense screeners can maintain strong diagnostic accuracy from pre-K to Grade 1.
These findings underscore the urgent need for culturally and linguistically appropriate CBM tools such as the Indicadores de Progreso de Aprendizaje en Matemáticas–Educación Infantil (IPAM-EI) for Spanish-speaking kindergarten populations, which remain underrepresented in the literature despite increasing global interest in early identification. Establishing the construct validity of the IPAM-EI, therefore, represents a critical first step in building a culturally appropriate early numeracy screener for Spanish-speaking kindergarten populations.
Stage 2: Evidence That the CBM Captures Meaningful Growth
The second validation stage concerns the extent to which CBMs can detect developmental progress over time. Although this study does not aim to evaluate CBMs for continuous progress monitoring, universal screeners must nevertheless demonstrate sensitivity to growth across benchmark periods (e.g., fall to spring). Measures that fail to capture such developmental change may be less useful for distinguishing students who respond adequately to instruction from those requiring more intensive support (Compton et al., 2010).
Empirical evidence indicates that CBM slopes can be used to quantify learning rates and predict subsequent academic outcomes (Fuchs, 2004; Seethaler & Fuchs, 2011). Reliable estimates of growth have been obtained even with as few as three benchmark assessments across the school year (Seethaler & Fuchs, 2011). More recently, Nelson et al. (2023) demonstrated that CBM tasks differ in their sensitivity to growth, with higher slopes observed for oral counting and numeral identification and lower slopes for tasks such as quantity discrimination and missing number. These findings highlight the importance of considering task-specific responsiveness when evaluating CBMs for early numeracy screening.
Stage 3: Evidence That the CBM Supports Decision-Making
The third stage of validation concerns the practical utility of CBMs for educational decision-making. A robust CBM tool should accurately identify students at risk for poor academic outcomes, which requires evidence of diagnostic accuracy, including sensitivity, specificity, and predictive values derived from external criteria (VanDerHeyden et al., 2006). The AUC analyses are commonly used to evaluate the classification performance of screening instruments (Hosp et al., 2016). Prior research has supported the diagnostic accuracy of fluency-based early numeracy tasks; however, relatively few studies have examined their performance in Spanish-speaking populations or across multiple benchmark periods within the same academic year. Establishing such evidence is therefore essential to ensure that CBMs can be reliably used for universal screening in diverse linguistic and cultural contexts.
The Present Study
The current study aims to evaluate the technical adequacy of a set of five curriculum-based measures (CBMs) of early numeracy in Spanish, developed for universal screening in kindergarten. These fluency-based tasks include Quantity Discrimination, Quantity Array, Missing Number, Number Identification, and Counting Aloud, which are part of the Indicadores de Progreso de Aprendizaje en Matemáticas–Educación Infantil (IPAM-EI), a screening tool developed for Spanish-speaking children. In line with Fuchs’ (2004) framework, the study examines evidence related to construct representation, sensitivity to growth, and diagnostic accuracy to establish the validity of the IPAM-EI as a universal screener.
Despite strong consensus regarding the importance of early numeracy for later academic success, the empirical basis for identifying risk in early mathematics is drawn predominantly from English-speaking contexts. As Vázquez et al. (2024) noted, few CBM screening tools have been developed in languages other than English, limiting their applicability in diverse contexts. This raises important questions about the extent to which findings derived from these contexts can be generalized to other linguistic and educational systems. Although mathematics is often viewed as a universal domain, accumulating evidence indicates that early numeracy development is shaped by language structure, curricular sequencing, instructional practices, and home numeracy environments, all of which vary across cultural and linguistic contexts (Bonifacci et al., 2021; Cankaya & LeFevre, 2016; Dowker & Nuerk, 2016; Silver & Libertus, 2022; Susperreguy et al., 2022). Consequently, screening tools validated in English may not adequately capture risk in Spanish-speaking kindergarten populations without context-specific validation.
Some tools, such as DUCMa (Cruz et al., 2024) and ENT-r (Menacho et al., 2024), have recently emerged in Europe, and additional work has been conducted in Spanish-speaking primary settings (de León et al., 2022; de León, Jiménez, García, & Gutiérrez, et al., 2021; de León, Jiménez, García, Gutiérrez, & Gil, 2021). However, no CBM instruments have been validated for kindergarten in Spanish. Tools such as EasyCBM have not been standardized for this population (Outhwaite et al., 2024), and none fully meet the CBM criteria of brevity, repeatability, and curricular alignment. Validating screening tools for Spanish-speaking kindergarteners is, therefore, essential to ensure accurate and contextually valid identification of students at risk within early educational systems.
Although interest in early mathematics screening is increasing, few fluency-based tools have been validated in Spanish, and most available measures are adapted from English versions that may not adequately support accurate risk identification within Spanish-speaking kindergarten contexts. Furthermore, little is known about whether such tools demonstrate longitudinal invariance or sensitivity to change, both of which are key for evaluating students’ improvement across the kindergarten year. Recent studies highlight the promise of fluency-based screening tasks (Clarke et al., 2020; Kiss & Christ, 2019; Sutherland et al., 2021) while also raising concerns about limited content validity (Speyer et al., 2024). Growth in early numeracy is shaped by individual and demographic factors (Clarke et al., 2018; Lembke et al., 2016; Lembke & Foegen, 2009), and timely interventions can significantly improve outcomes (Dyson et al., 2013).
This study addresses these gaps by validating a fluency-based CBM tool designed for Spanish-speaking kindergarteners. While prior research has examined diagnostic accuracy or sensitivity to growth, the present study integrates both aspects and extends them by evaluating longitudinal measurement invariance. This comprehensive approach builds on the work of Nelson et al. (2025), who emphasized the predictive stability of early numeracy assessments over time.
In line with this perspective, we examine whether performance across the selected tasks reflects a common foundation of early numeracy. Specifically, our factorial structure validation and longitudinal invariance analyses aim to capture consistent performance across essential domains, such as quantity discrimination, quantity array, missing number, number identification, and counting aloud, throughout the kindergarten year (Aunio & Räsänen, 2015). Although number sense has often been described as multidimensional, the present investigation does not aim to test a multifactorial model. Rather, our objective was to empirically evaluate the latent structure of the IPAM-EI and determine whether the tasks align with a one-factor representation of early number sense. Both exploratory and confirmatory factor analyses were therefore conducted, prioritizing parsimony while remaining open to future evaluation of alternative structures.
Growth modeling provides insight into typical and atypical developmental trajectories (Toll & Van Luit, 2014), whereas classification analyses evaluate the tool’s capacity to support early identification and intervention, as shown in prior work (Laracy et al., 2016; Nelson et al., 2023). Ultimately, this study seeks to strengthen early intervention efforts, as prevention is more effective and cost-efficient than later remediation (de León, Jiménez, Gutiérrez, et al., 2021; Jiménez et al., 2021). By focusing on key number sense skills as a core foundation of early numeracy, the study aims to validate a screening tool that reliably identifies Spanish-speaking kindergarten students at risk for mathematics difficulties, captures growth across the school year, and addresses the current lack of validated CBM tools in Spanish.
Research Questions and Hypotheses
Following the three-stage validation framework of Fuchs (2004), the study addresses the following research questions:
Method
Participants
A total of 302 kindergarten students (164 male and 138 female; Mage = 62.7 months (5.2 years); SD = 5.5 months) from six schools in Tenerife, the Canary Islands (Spain), participated in this study after students with special educational needs (i.e., intellectual, motor, visual, and hearing disabilities; autism spectrum disorders; and severe behavior disorders) were excluded. These students were excluded because the IPAM-EI was developed as a Tier 1 universal screening tool for the general education population and has not been validated for use with students with identified sensory, motor, or intellectual disabilities. The schools were randomly selected to reflect the general distribution of school types and geographic locations in the region. Approximately 69% of the sample attended public schools, and 31% attended state-subsidized private schools, mirroring the typical enrollment proportions in the Canary Islands. In terms of setting, 69% of the students were enrolled in urban schools, and 31% were enrolled in schools located in peripheral areas. All the participating children were native Spanish speakers. The students were classified into two groups, at-risk (n = 36) and not at risk (n = 266), by using the 10th percentile of the Spanish version of the Test of Early Mathematics Ability, 3rd edition (TEMA-3; Ginsburg & Baroody, 2003; adapted by Núñez & Lozano, 2007), as the cutoff score. The 10th percentile is commonly used in CBM research to identify students at high risk for mathematics difficulties, as it reduces false positives and improves early identification. Morgan et al. (2009), using a nationally representative sample, reported that students below this threshold in kindergarten had a 70% chance of remaining in the lowest decile 5 years later, with mathematics scores two standard deviations below their peers. Similarly, Nelson and Powell (2017), in a review of 35 longitudinal studies, concluded that stricter cutoffs (e.g., <10th percentile) improve identification accuracy and reflect more stable mathematics difficulties over time. Accordingly, our use of the 10th percentile ensures that preventive efforts are directed toward students most likely to need sustained support. There was no significant difference in the distribution of sex across the at-risk and not-at-risk groups, χ2(1) = .038, p = .845.
Measures
The students were assessed with two measures: (a) the CBM Indicadores de Progreso de Aprendizaje en Matemáticas–Educación Infantil (IPAM-EI [Indicators of Basic Early Math Skills for Kindergarteners], Jiménez & de León, 2019) and (b) the criterion measure the Spanish version of the TEMA-3 (Núñez & Lozano, 2007).
IPAM-EI
The IPAM-EI is a brief screening tool designed to assess early numeracy skills among Spanish-speaking kindergarten students. The selection of tasks was based on previous research supporting their validity and reliability for early numeracy assessment (e.g., Clarke et al., 2011; Conoyer et al., 2016; Lembke & Foegen, 2009; Seethaler & Fuchs, 2011). The IPAM-EI consists of five fluency-based and individually administered measures: quantity discrimination (QD), quantity array (QA), missing number (MN), number identification (NI), and counting aloud (CA). The IPAM-EI comprises three equivalent alternate forms (i.e., fall, winter, and spring), which are administered throughout the school year. Each task was administered for 1 minute, and total correct responses were recorded. Students’ proficiency was measured by the total number of correct answers in each task. Tasks were designed following principles of curriculum alignment and developmental appropriateness.
Quantity Discrimination
Students are presented with 64 pairs of numbers between 0 and 20 and are asked to choose the largest number (e.g., 3–5). The items were developed considering the distance effect (short-distance vs. long-distance), compatibility effect (compatible numbers vs. incompatible numbers), and order of presentation (ascending vs. descending order). The stimulus pairs included 50% unit–unit (UU), 25% unit–ten (UT), and 25% ten–ten (TT) combinations. Each type included equal numbers of compatible and incompatible pairs, as well as short and large numerical distances. For UT pairs, items appeared in both direct and inverse order. Sixteen items were presented per page in a fixed sequence covering all combinations.
Quantity Array
The students are presented with a total of 36 boxes, which include some dots inside them. They are asked to tell aloud the number of dots included in each box. The items were designed considering the number of dots included in each box (1–10) and the numerical distance between them. Specifically, (a) 12 items included a single set with 0 to 5 dots, (b) 6 items included two sets with 0 to 5 dots, (c) 12 items included a single set with 6 to 10 dots, and (d) 6 items included two sets with 6 to 10 dots. Twelve items were presented on each page, combining all possible item types in a fixed order. Additionally, the size and distance between dots were stable, as was the size of the box.
Missing Number
The students are presented with 36 sequences of three numerals, ranging from 0 to 20, where the first, middle, or last numeral of the sequence is missing. They must identify the missing number. To do this, three options are provided, with one pointing to the correct choice (e.g., sequence: __, 3, 4; options: 0, 2, 5). The items were designed to vary the position of the missing number, which can appear in the first (e.g., __, 2, 3), second (e.g., 13, _, 15), or third place (e.g., 6, 7, _) within the sequence. All sequences are presented in ascending order. Task difficulty was controlled using two criteria: sequence range (low: 0–10; medium: 10–20; high: 0–20) and missing number position (low: first; medium: second; high: third). Twelve items per page covered all the combinations in a fixed order.
Number Identification
For this measure, the students are presented with a total of 63 numbers ranging from 0 to 20. The numbers are distributed in seven rows and nine columns. Students are asked to name all the numbers following the order of the rows. For the design of the measure, numbers were placed randomly, alternating one-digit and two-digit numbers. The frequency of each number was also controlled.
Counting Aloud
The students were asked to count aloud as far as they know, starting from 1. Numbers are considered to be correct when they are named consecutively, following the number line (i.e., 1, 2, 3, 4. . .), and incorrect when they are not in the correct order (e.g., 5, 7, 12. . .).
The IPAM-EI was developed for Spanish-speaking kindergarten students and uses simple, consistent oral instructions and visual supports to minimize language-related bias, ensuring that scores reflect mathematical understanding rather than verbal proficiency.
TEMA-3
The Spanish version of the TEMA-3 (Ginsburg & Baroody, 2003; Núñez & Lozano, 2007) is a standardized, norm-referenced tool that assesses procedural and conceptual number sense in children aged 3 to 8 years, 11 months. It closely follows the American edition, with mostly literal translations and minor adaptations, such as replacing monetary items with culturally relevant equivalents and adjusting item order on the basis of Spanish difficulty data. The TEMA-3 has been used in a wide array of studies to assess kindergarten students’ mathematics competency (e.g., Clarke et al., 2015; Doabler et al., 2021). The Spanish version of the TEMA-3 reports a Cronbach’s alpha of .91 for 5-year-old children. In the present study, the TEMA-3 served as the external criterion for evaluating concurrent validity (RQ2) through correlations with both the individual IPAM-EI tasks and the composite score, and predictive validity (RQ5) through diagnostic accuracy analyses.
Teacher Rating of Mathematical Competence (ARS-M)
The ARS-M is a 12-item teacher-rated scale adapted from the Academic Rating Scale – Mathematics (ECLS-K; Rock & Pollack, 2002) and extended on the basis of prior studies (e.g., Furnari et al., 2017; Kilday et al., 2012). It assesses early mathematics skills (e.g., number recognition, counting, comparison, measurement, patterning) via a 5-point Likert scale from 1 (“Not yet”) to 5 (“Proficient”), which is based on teacher observations across the school year. The scale was translated and adapted to the Spanish curriculum and was completed nearly a year-end. The internal consistency was excellent (α = .961), supporting its reliability in capturing observed mathematical competence. In the present study, the ARS-M was used as an external validity criterion for RQ2, providing convergent evidence by correlating teacher-rated competence with performance on the IPAM-EI tasks.
Procedure
This study was conducted in accordance with the guidelines of the Research Ethics Committee of Universidad de La Laguna. Parental and school consents were obtained prior to data collection. Twelve trained research assistants administered the IPAM-EI and the TEMA-3, while teachers completed the ARS-M near the end of the academic year. The IPAM-EI tasks were administered individually to each child at three benchmark periods: fall (October), winter (February), and spring (May). The TEMA-3 and the ARS-M were administered only in spring to provide external validity criteria. All sessions took place in quiet school classrooms and lasted approximately 15 minutes per child. The order of the IPAM-EI tasks was counterbalanced within each school.
Before each administration period, research assistants received a 3-hour training session conducted by a member of the research team, which included instruction, practice, and questions and answers. A researcher was present at each school to assist during the assessments, and assistants were consistently assigned to the same schools to reduce bias. All protocols were reviewed for scoring accuracy. Although direct fidelity data were not collected for the IPAM-EI at the kindergarten level, the administration procedures were standardized and closely aligned with those employed in previous studies at the primary level (Grades 1–3) in the Canary Islands, which demonstrated high implementation fidelity (Jiménez et al., 2021). This prior evidence supports the robustness of the administration procedures applied in the present study.
Data Analysis
The present study is grounded in Fuchs’ (2004) CBM-specific validation framework, which guided the structuring of the analyses and the presentation of findings. This framework outlines three progressive stages: (a) examining whether the measures adequately capture the intended construct, (b) evaluating the slope of performance to determine sensitivity to student growth over time, and (c) assessing the utility of the measures for instructional decision-making, particularly their accuracy in identifying students at risk. These stages align closely with the research questions of the present study, which focus on the latent structure of the IPAM-EI tasks, longitudinal measurement invariance, diagnostic classification accuracy, and sensitivity to growth trajectories. Consistent with the Standards for Educational and Psychological Testing (American Educational Research Association, American Psychological Association, & National Council on Measurement in Education [AERA, APA, & NCME], 2014) and the ITC Guidelines on Test Use (International Test Commission [ITC], 2018), we additionally treat validity as an argument supported by multiple sources of evidence, complementing Fuchs’ framework in aspects not explicitly addressed there.
Analyses were conducted at two complementary levels. First, we examined each of the five IPAM-EI tasks (QD, QA, MN, NI, and CA) individually to evaluate their descriptive properties, diagnostic accuracy, and sensitivity to growth. Second, we tested whether these tasks reflect a common underlying construct of early number sense. Confirmatory factor analyses supported a one-factor model, which justified the creation of a composite score (C-IPAMu). This composite was then used in invariance and growth analyses to capture overall trajectories of early numeracy development. By structuring the analyses at both the task and construct levels, we provide evidence regarding the unique contribution of each task as well as the broader utility of the IPAM-EI as a screening tool represented by a single latent factor.
All analyses were conducted using R. For RQ1 and RQ2, we adduced validity evidence based on internal structure (i.e., exploratory and confirmatory factor analyses and longitudinal measurement invariance) and on relations with other variables (i.e., correlations with TEMA-3 and teacher ratings on the ARS-M). To address RQ3 and RQ4, we modeled growth trajectories to capture typical and atypical numeracy development during kindergarten. Finally, to address RQ5, we analyzed diagnostic accuracy using ROC curves. Most analyses were performed at both the task and composite levels, with the exception of the exploratory and confirmatory factor analyses and the longitudinal measurement invariance tests, which were conducted on the individual task scores to examine the dimensionality of the IPAM-EI and the stability of its structure across the three assessment points.
Exploratory and Confirmatory Factor Analysis
Given the novelty of the IPAM-EI in Spanish-speaking kindergarten populations and the absence of prior evidence regarding its latent structure in this context, an exploratory factor analysis (EFA) was conducted prior to confirmatory factor analysis (CFA) to empirically examine the underlying dimensionality of the screening measures. The study sample was randomly split into two halves. The first half was used for EFA, which was conducted via the parallel analysis method (Horn, 1965) and the visual scree test (Cattell, 1966) to determine the number of factors to retain. Parallel analysis effectively identifies factors that explain the variance in the data while accounting for chance findings. This initial analysis enabled us to examine factor loadings and assess the measures’ adequacy in capturing the intended constructs of the IPAM-EI. The second half of the sample was used for CFA, which validated the EFA-identified factor structure by testing it against observed data and evaluating model fit. Model fit indices, including the chi-square test, comparative fit index (CFI), Tucker‒Lewis index (TLI), root mean square error of approximation (RMSEA), and standardized root mean square residual (SRMR), were used to assess the goodness of fit.
Longitudinal Measurement Invariance
To ensure that changes in student scores reflect true development rather than measurement changes, we conducted a longitudinal measurement invariance analysis using the full sample. This process verifies that the IPAM-EI assesses the same construct consistently over time, providing a valid basis for interpreting growth. Following Milfont and Fischer (2010), we tested a sequence of increasingly restrictive models: configural, metric, scalar, and strict invariance. Configural invariance confirms structural consistency across time; metric invariance tests the stability of factor loadings; scalar invariance assesses intercept equivalence, enabling latent mean comparisons; and strict invariance adds equality of residual variances, indicating stable item reliability. Models were estimated via standardized IPAM-EI scores and evaluated via nested model comparisons and incremental fit indices (Newsom, 2015).
Growth Models
To examine changes in early numeracy skills over time and evaluate individual- and group-level variability (i.e., RQ3 and RQ4), hierarchical linear modeling (HLM; Raudenbush & Bryk, 2002) was used. This type of analysis allows us to establish a growth pattern for both groups (at-risk and not-at-risk) and to determine whether differences between groups increase or decrease throughout the school year. Three-level models were estimated: student outcomes at level one, differences among students at level two, and differences among schools at level three. Two model types were used: unconditional and conditional. The unconditional model explored variability between schools and students, whereas the conditional model included the group factor (i.e., at-risk or not-at-risk) as a second-level predictor. A stepwise method (Peugh & Heck, 2017; Raudenbush & Bryk, 2002) was used to select the most parsimonious model. The likelihood-ratio test and deviance statistics were used to determine the best-fitting HLM model (Raudenbush & Bryk, 2002). In cases of detected collinearity (r < −.80 or r > .80) between the intercept and time as random effects at both levels, only time was retained as a random effect (Barr et al., 2013). These models were estimated for each IPAM-EI measure, and a composite score was calculated via the percent of maximum possible (POMP) method (Cohen et al., 1999), scaling each measure from 0 to 100. Because each task was administered for a fixed duration (1 minute) and included a finite number of items per form, the maximum attainable score corresponded to the total number of scorable items available within that task format. POMP-transformed scores allow easy interpretation as percentages of the maximum possible score (Moeller, 2015). The C-IPAMu composite score was calculated by averaging the POMP scores of each screening measure to examine differences between students at risk and students not at risk throughout the school year. The use of POMP scores, rather than rate-based metrics (e.g., correct responses per minute), was intended to facilitate comparisons across tasks with different maximum raw scores and to support the creation of a composite score. This approach is particularly suitable for longitudinal designs and hierarchical linear modeling, where differences in scale or distribution can complicate the analysis. The resulting POMP values, expressed on a 0 to 100 scale, reflect each student’s proportion of correct responses relative to the maximum possible score for a given task, enabling consistent interpretation across tasks and time points. Students were classified as at-risk or not at-risk based on a percentile cutoff at or below the 10th percentile on the TEMA-3 in spring.
Diagnostic Accuracy
For RQ5, receiver operating characteristic (ROC) curve analyses were conducted for each time point and each task, using the 10th percentile on the TEMA-3 as the criterion measure to define students’ risk status.
The diagnostic evaluation of the CBM IPAM-EI tasks was conducted in fall, winter, and spring, using key metrics to assess their ability to identify students at risk for mathematics difficulties. The ROC curve visualized the test’s discrimination between students at-risk and students not at risk, plotting sensitivity (true positive rate) against 1 − specificity (false positive rate). The AUC was used to quantify the overall discriminative ability, with values closer to 1 indicating better performance. Sensitivity measures the proportion of true positives detected, whereas specificity assesses the proportion of true negatives, thereby reflecting accuracy in correctly identifying students who are not at risk. The positive predictive value (PPV) indicates the likelihood that identified at-risk students truly have difficulties, and the negative predictive value (NPV) indicates the likelihood that students who screen negative do not. Additionally, the analysis reported true positives (TPs), true negatives (TNs), false positives (FPs), and false negatives (FNs) for a comprehensive view of diagnostic accuracy. To select the optimal cutoff score for each task and measurement point, two criteria were applied: (a) the Youden index (J) was used to maximize the combined value of sensitivity and specificity (Smolkowski & Cummings, 2015), and (b) a minimum sensitivity threshold of 0.80 was established (Silberglitt & Hintze, 2005). To avoid inflating the rate of false positives, only cutoff scores with specificity values ≥0.70 were considered acceptable (Silberglitt & Hintze, 2005).
Results
Stage 1: Evidence That the CBM Measures the Intended Construct
RQ1: Internal Structure and Longitudinal Invariance
Table 1 presents the descriptive statistics for the IPAM-EI measures and the composite measure C-IPAMu, including the mean, standard deviation, minimum and maximum values, skewness, and kurtosis, across three time points: fall, winter, and spring. The descriptive statistics for all IPAM-EI measures across the three assessment periods indicate that the distributions of the measures exhibit acceptable levels of skewness and kurtosis for further statistical analyses. According to Kline (2016), skewness values between −2 and 2 and kurtosis values between −7 and 7 are generally considered acceptable for structural equation modeling (SEM) and hierarchical linear modeling (HLM). On the basis of these criteria, the distributions observed in our data are within acceptable ranges, suggesting that the measures used in this study meet the assumptions required for the planned analyses.
Descriptive Statistics for the Indicators of Basic Early Math Skills for Kindergarteners (IPAM-EI) Measures and Composite Measure C-IPAMu.
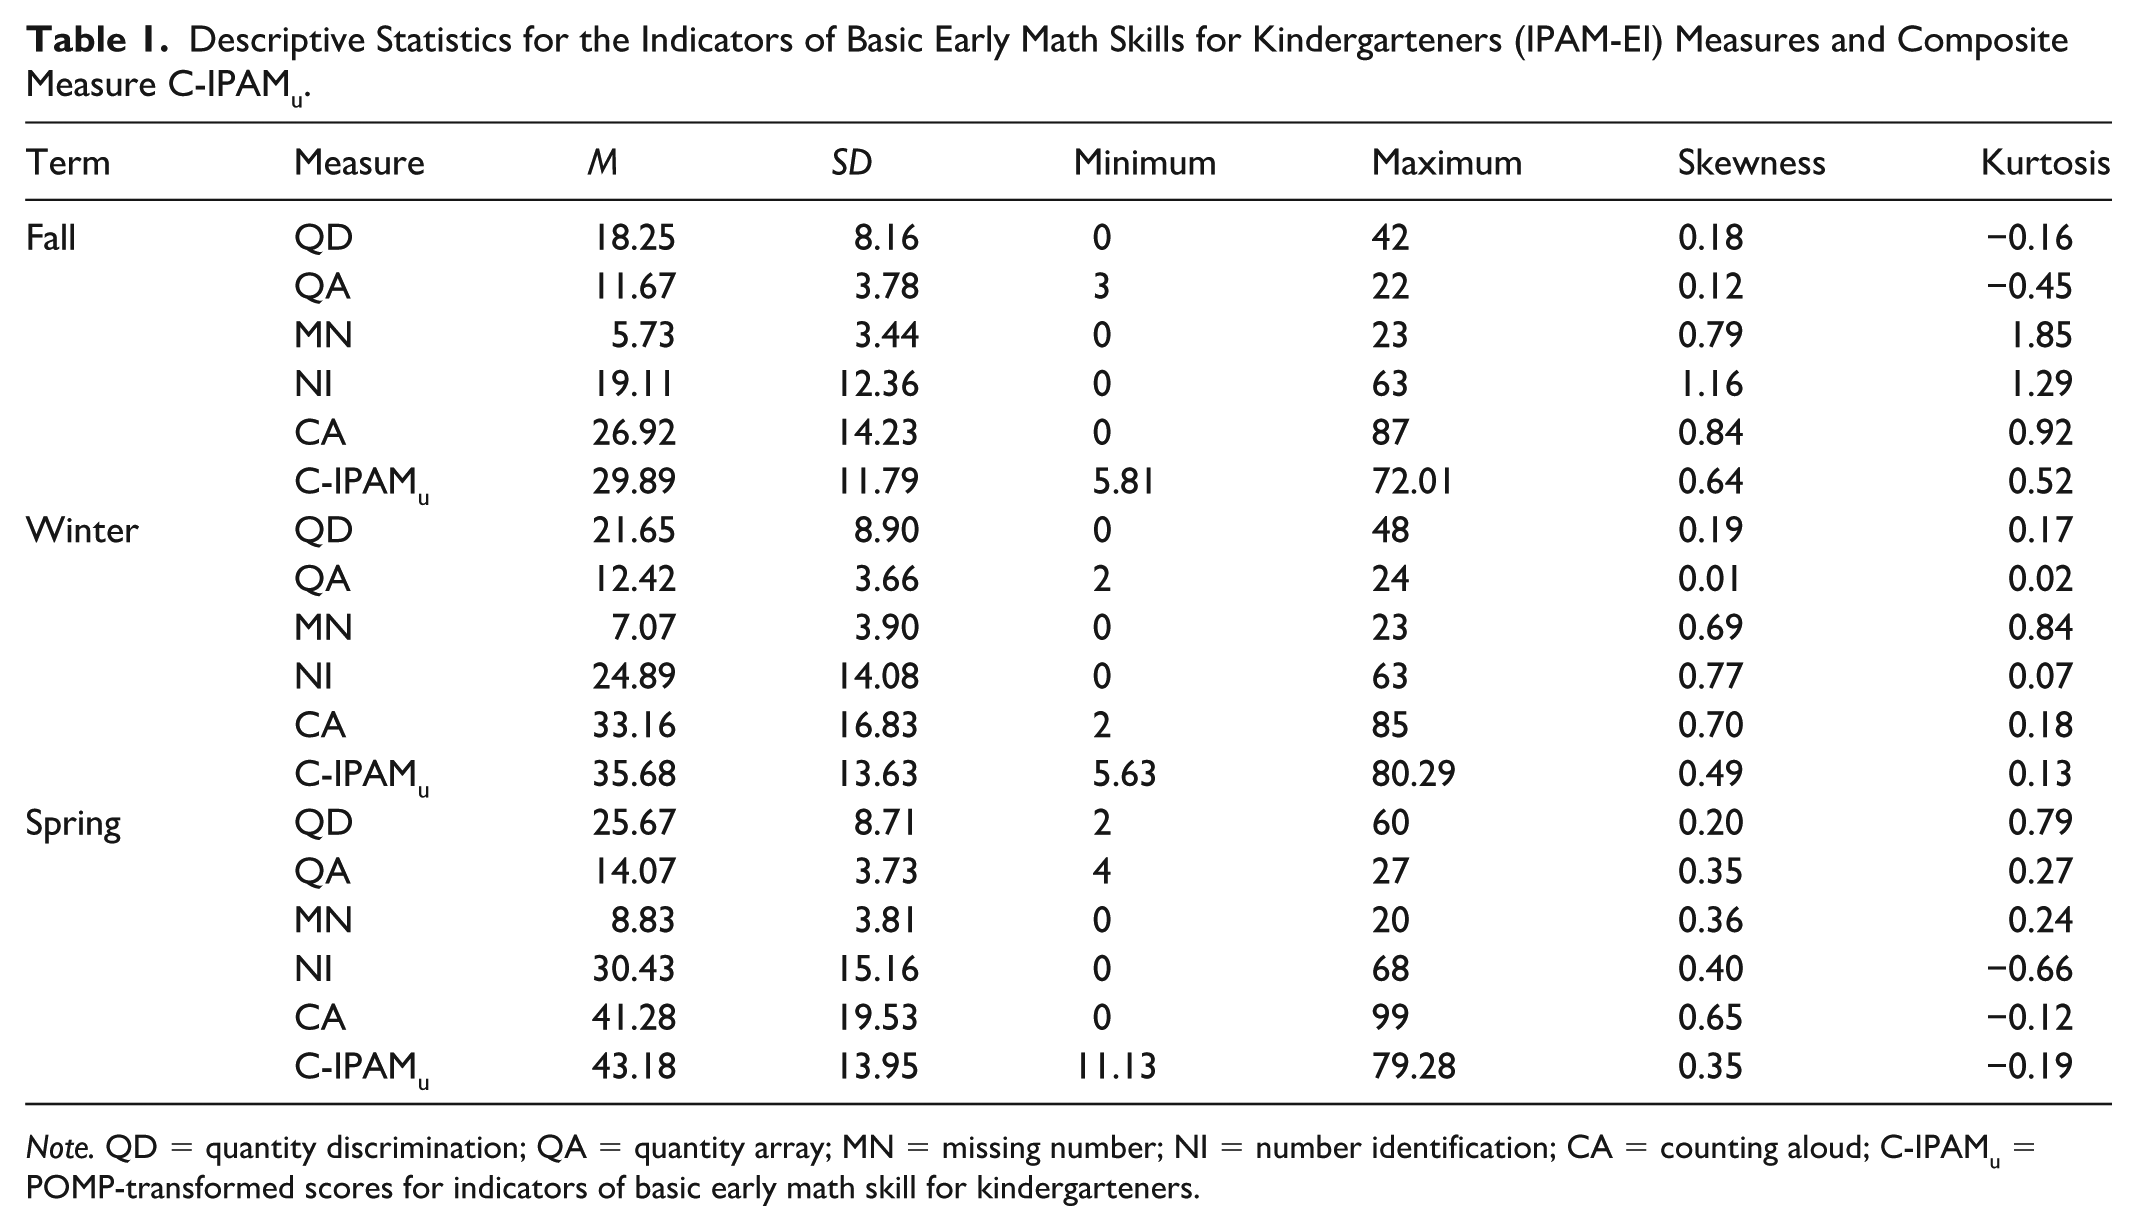
Note. QD = quantity discrimination; QA = quantity array; MN = missing number; NI = number identification; CA = counting aloud; C-IPAMu = POMP-transformed scores for indicators of basic early math skill for kindergarteners.
Exploratory and Confirmatory Factor Analysis
Exploratory factor analysis (EFA) of the IPAM-EI measures, administered at three time points during the school year (fall, winter, and spring), supported a consistent one-factor solution at each time point. Table 2 shows the factor loadings and uniqueness estimates for the IPAM-EI measures across three time points. The factor accounted for a substantial proportion of the variance across time points (49.1% in fall, 56.8% in winter, and 53.4% in spring). The assumptions for factor analysis were met, as evidenced by high Kaiser‒Meyer‒Olkin (KMO) values (0.845 in fall, 0.862 in winter, and 0.854 in spring) and significant Bartlett’s test of sphericity results (p < .001) at all time points. Scree plot analysis supported the extraction of a single dominant factor, with eigenvalues of 2.46 (fall), 2.84 (winter), and 2.67 (spring), whereas the subsequent eigenvalues remained below 1, consistent with a one-factor solution. Taken together, the EFA results indicate that the IPAM-EI tasks are well represented by a single latent factor at each benchmark.
Factor Loadings and Uniqueness Estimates for the Indicators of Basic Early Math Skills for Kindergarteners (IPAM-EI) Measures Across Three Time Points.
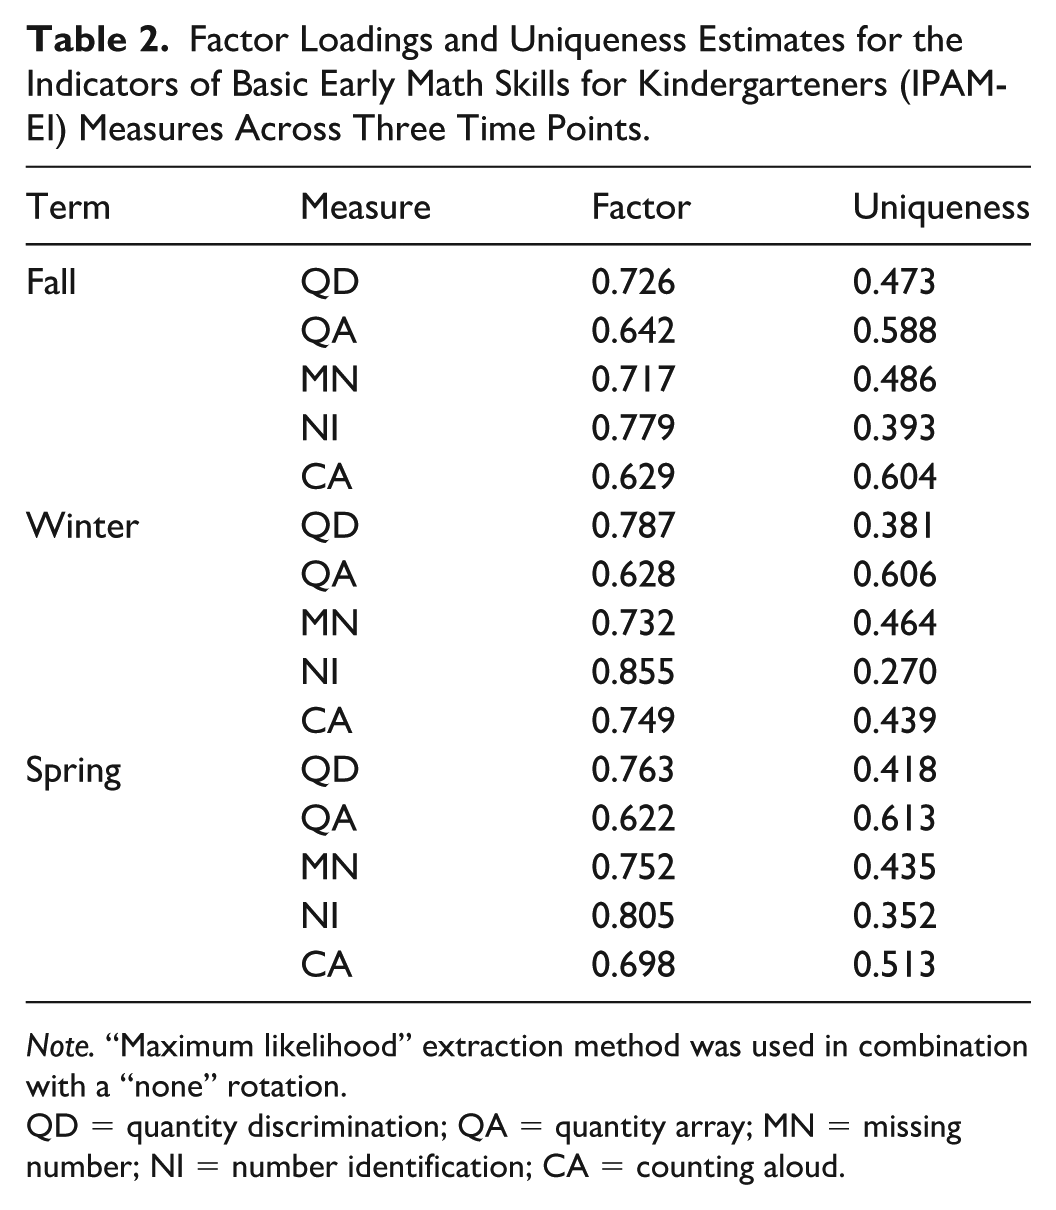
Note. “Maximum likelihood” extraction method was used in combination with a “none” rotation.
QD = quantity discrimination; QA = quantity array; MN = missing number; NI = number identification; CA = counting aloud.
Confirmatory factor analysis (CFA) results (see Table 3) showed good fit for a one-factor model at all three assessment points (fall, winter, and spring). Standardized loadings for the individual tasks were statistically significant (p < .001), indicating that the IPAM-EI tasks are valid indicators of a common early number sense factor. In fall, model fit was good, χ2 = 6.41, df = 5, p = .268, CFI = 0.997, TLI = 0.994, RMSEA = 0.031. Similar patterns were observed in winter and spring, with nonsignificant chi-square tests (p > .05), CFI values exceeding 0.99, and RMSEA values remaining below 0.05, supporting the adequacy of the one-factor structure at each benchmark. Although EFA and CFA results support a one-factor solution in the present data, we treat this as the most parsimonious representation and do not preclude the possibility that multidimensional structures may emerge in future studies with larger and more diverse samples.
Confirmatory Factor Analysis Results for the Indicators of Basic Early Math Skills for Kindergarteners (IPAM-EI) Measures Across Three Time Points.
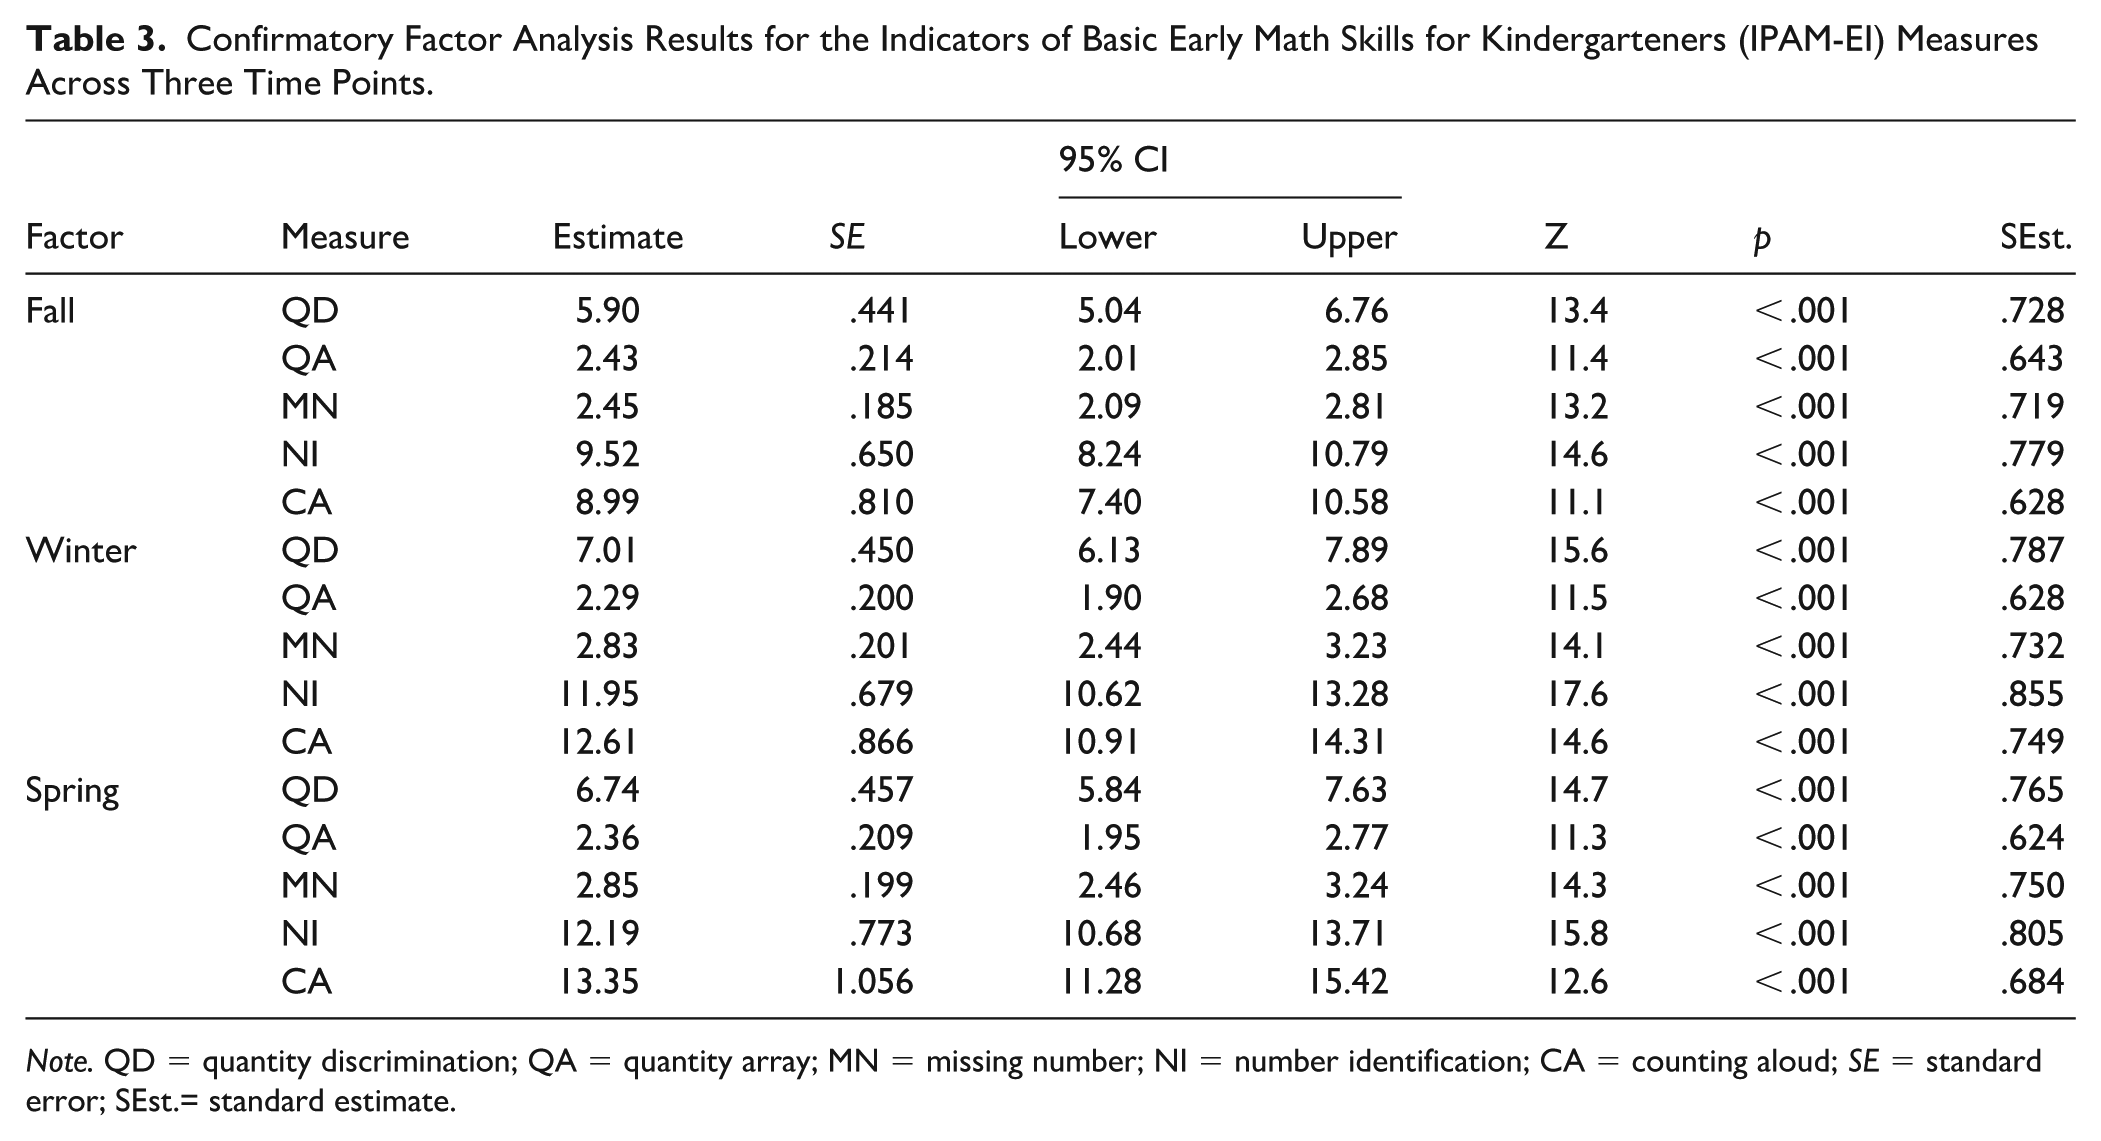
Note. QD = quantity discrimination; QA = quantity array; MN = missing number; NI = number identification; CA = counting aloud; SE = standard error; SEst.= standard estimate.
Longitudinal Measurement Invariance
Longitudinal measurement invariance of the IPAM-EI across kindergarten benchmarks was assessed through a series of increasingly restrictive models: configural, metric, scalar, and strict invariance, with the fit indices presented in Table 4. The configural model showed excellent fit, χ2(72) = 79.527, CFI = 0.997, TLI = 0.996, RMSEA = 0.019, indicating that the same factor structure held across time points (see Figure 1). The metric model revealed no significant deterioration in fit, Δχ2(8) = 14.224, p = .08, suggesting that factor loadings were invariant over time. The scalar model also fit well, χ2(88) = 107.319, CFI = 0.993, TLI = 0.991, RMSEA = 0.028, with no significant change relative to the metric model, Δχ2(8) = 13.704, p = .09, confirming that both factor loadings and intercepts are invariant. Although the strict model fit adequately and the χ2 difference relative to the scalar model was not significant, Δχ2(9) = 8.94, p = .44, modification indices suggested localized residual-variance misfit for CA at spring. Freeing this parameter yielded a partial strict invariance model with improved fit, Δχ2(1) = 30.91, p < .001, and no meaningful change in substantive conclusions. Taken together, these findings support configural, metric, and scalar invariance, as well as partial strict invariance, indicating that the latent factor underlying the IPAM-EI tasks is consistently represented across time points.
Model Fit Indices for Confirmatory Factor Analysis of the Indicators of Basic Early Math Skills for Kindergarteners (IPAM-EI) Across Different Levels of Invariance.
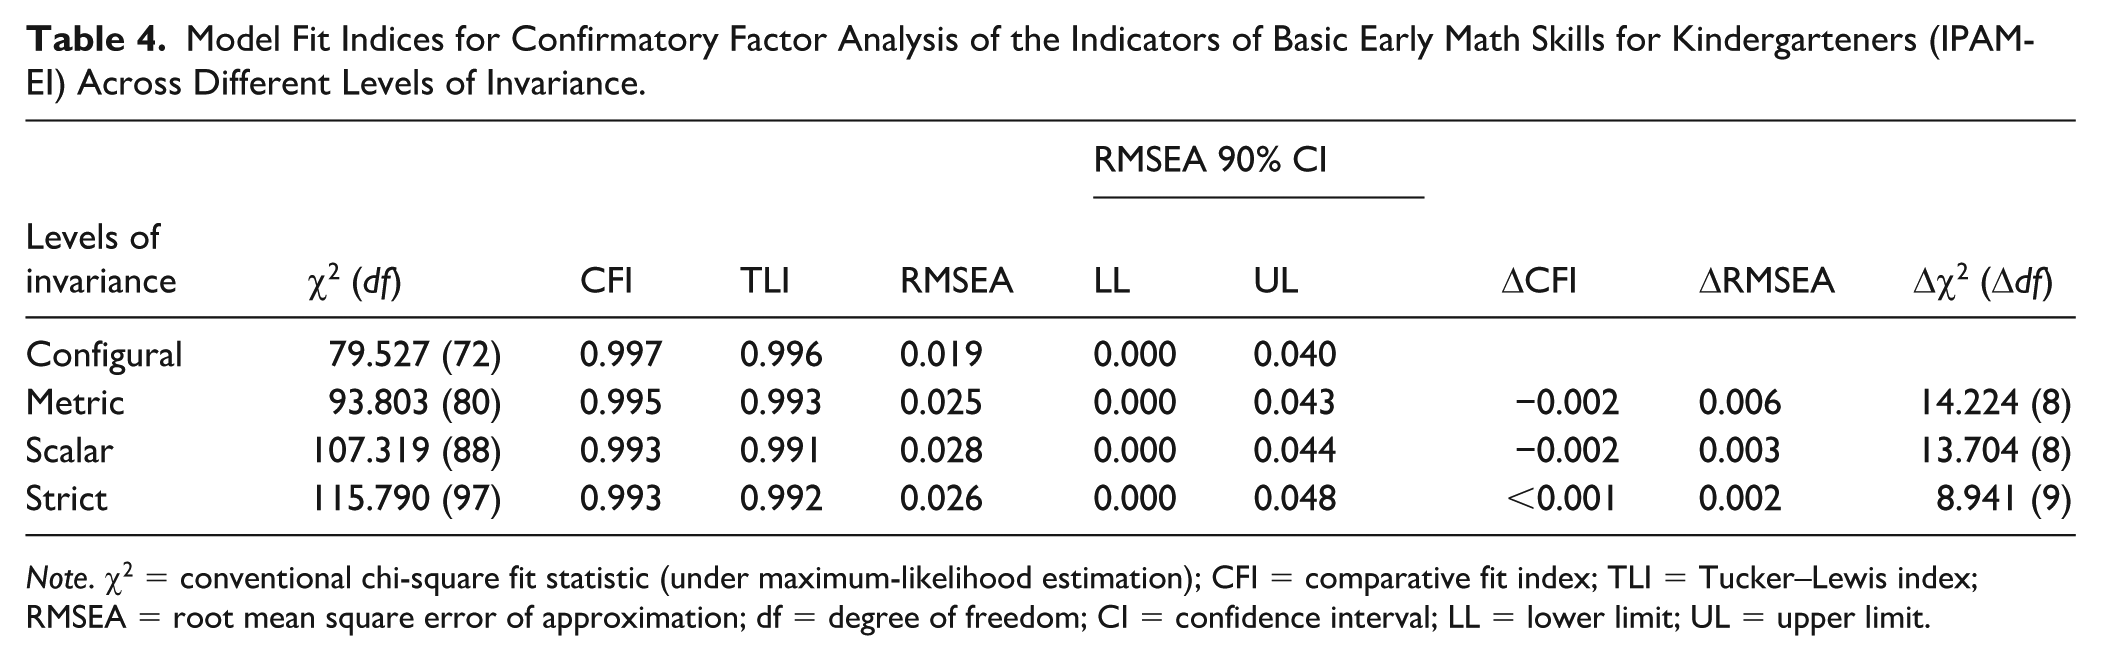
Note. χ2 = conventional chi-square fit statistic (under maximum-likelihood estimation); CFI = comparative fit index; TLI = Tucker–Lewis index; RMSEA = root mean square error of approximation; df = degree of freedom; CI = confidence interval; LL = lower limit; UL = upper limit.
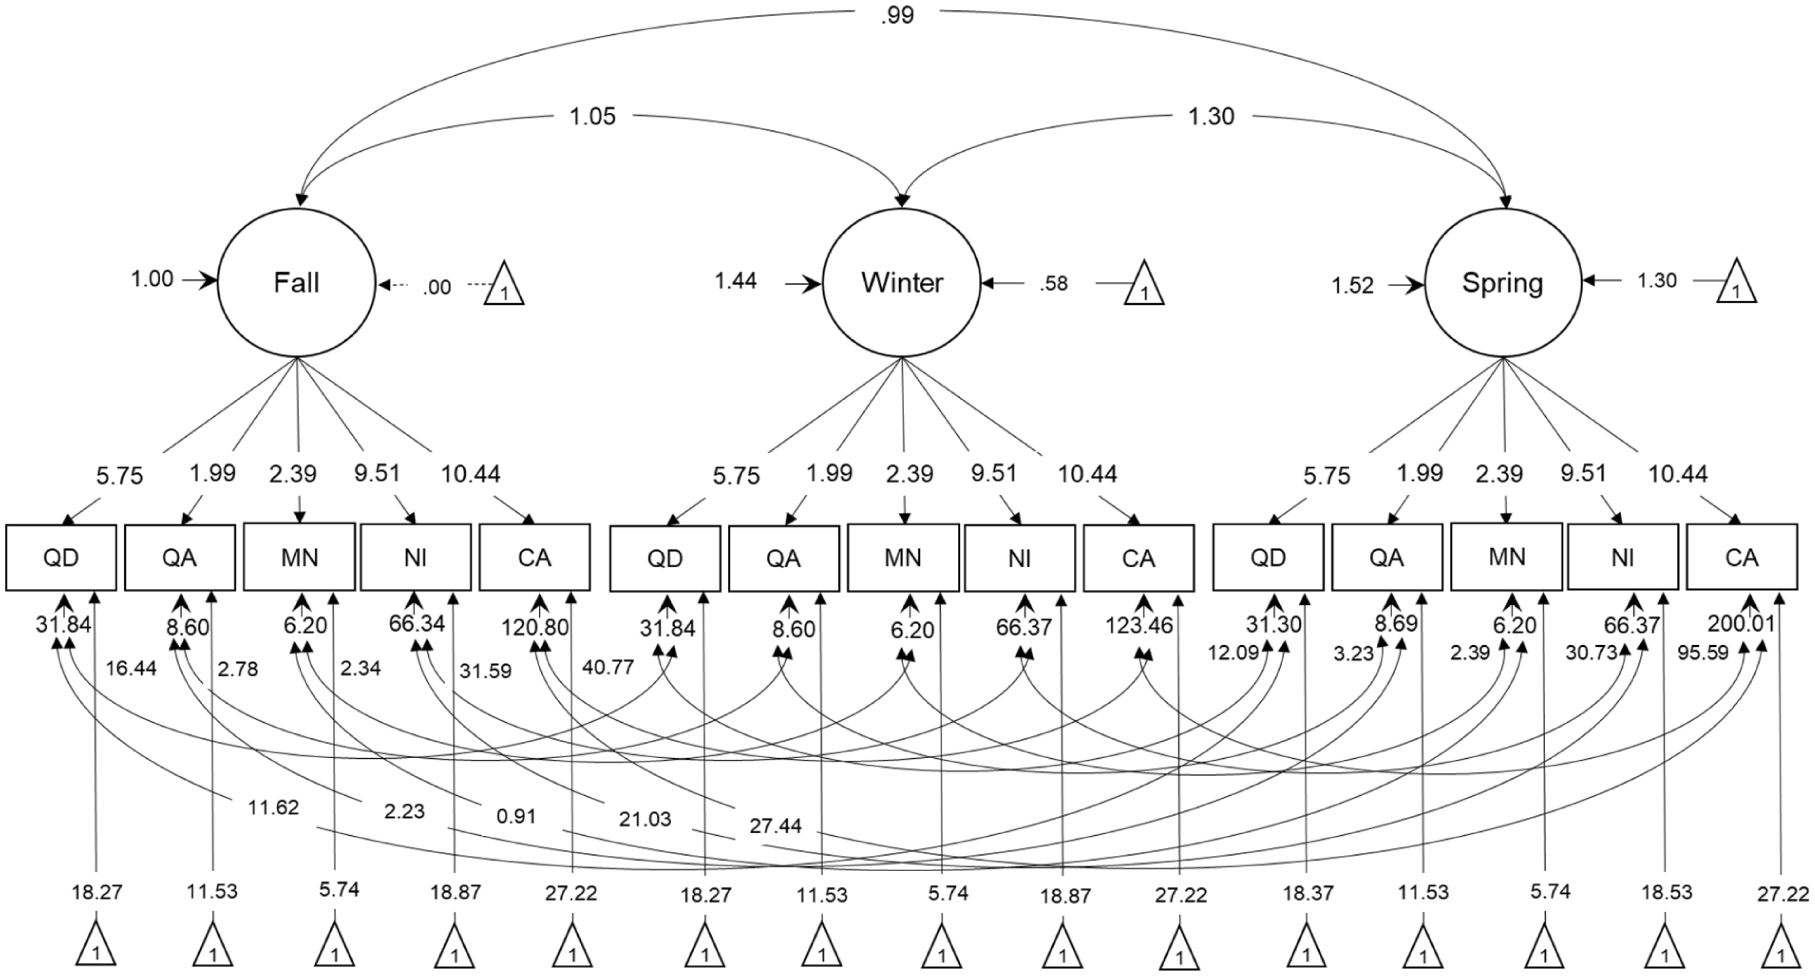
Longitudinal measurement invariance model
RQ2: Relations With External Measures (TEMA-3 and ARS-M)
Table 5 shows the correlation coefficients, reliability, and validity evidence for the IPAM-EI screening measures. The correlation analysis of the IPAM-EI screening measures revealed strong positive relationships among the tasks, with the C-IPAMu showing the highest correlations and reliability across time points (r = .779 to .877), indicating its robustness as a composite measure. The individual tasks also demonstrated temporal stability (r = .697 to .725) and significant concurrent validity with the TEMA-3 scores (r = .708 to .748), supporting the IPAM-EI as a reliable tool for assessing early numeracy skills. Additionally, moderate correlations with teacher ratings on the ARS-M (r = .333 to .538) suggest alignment with objective measures.
Correlation Coefficients, Reliability, and Validity of the Indicators of Basic Early Math Skills for Kindergarteners (IPAM-EI) Screening Measures With the Test of Early Mathematics Ability, Third Edition (TEMA-3) and Teacher Rating of Mathematical Competence (ARS-M).
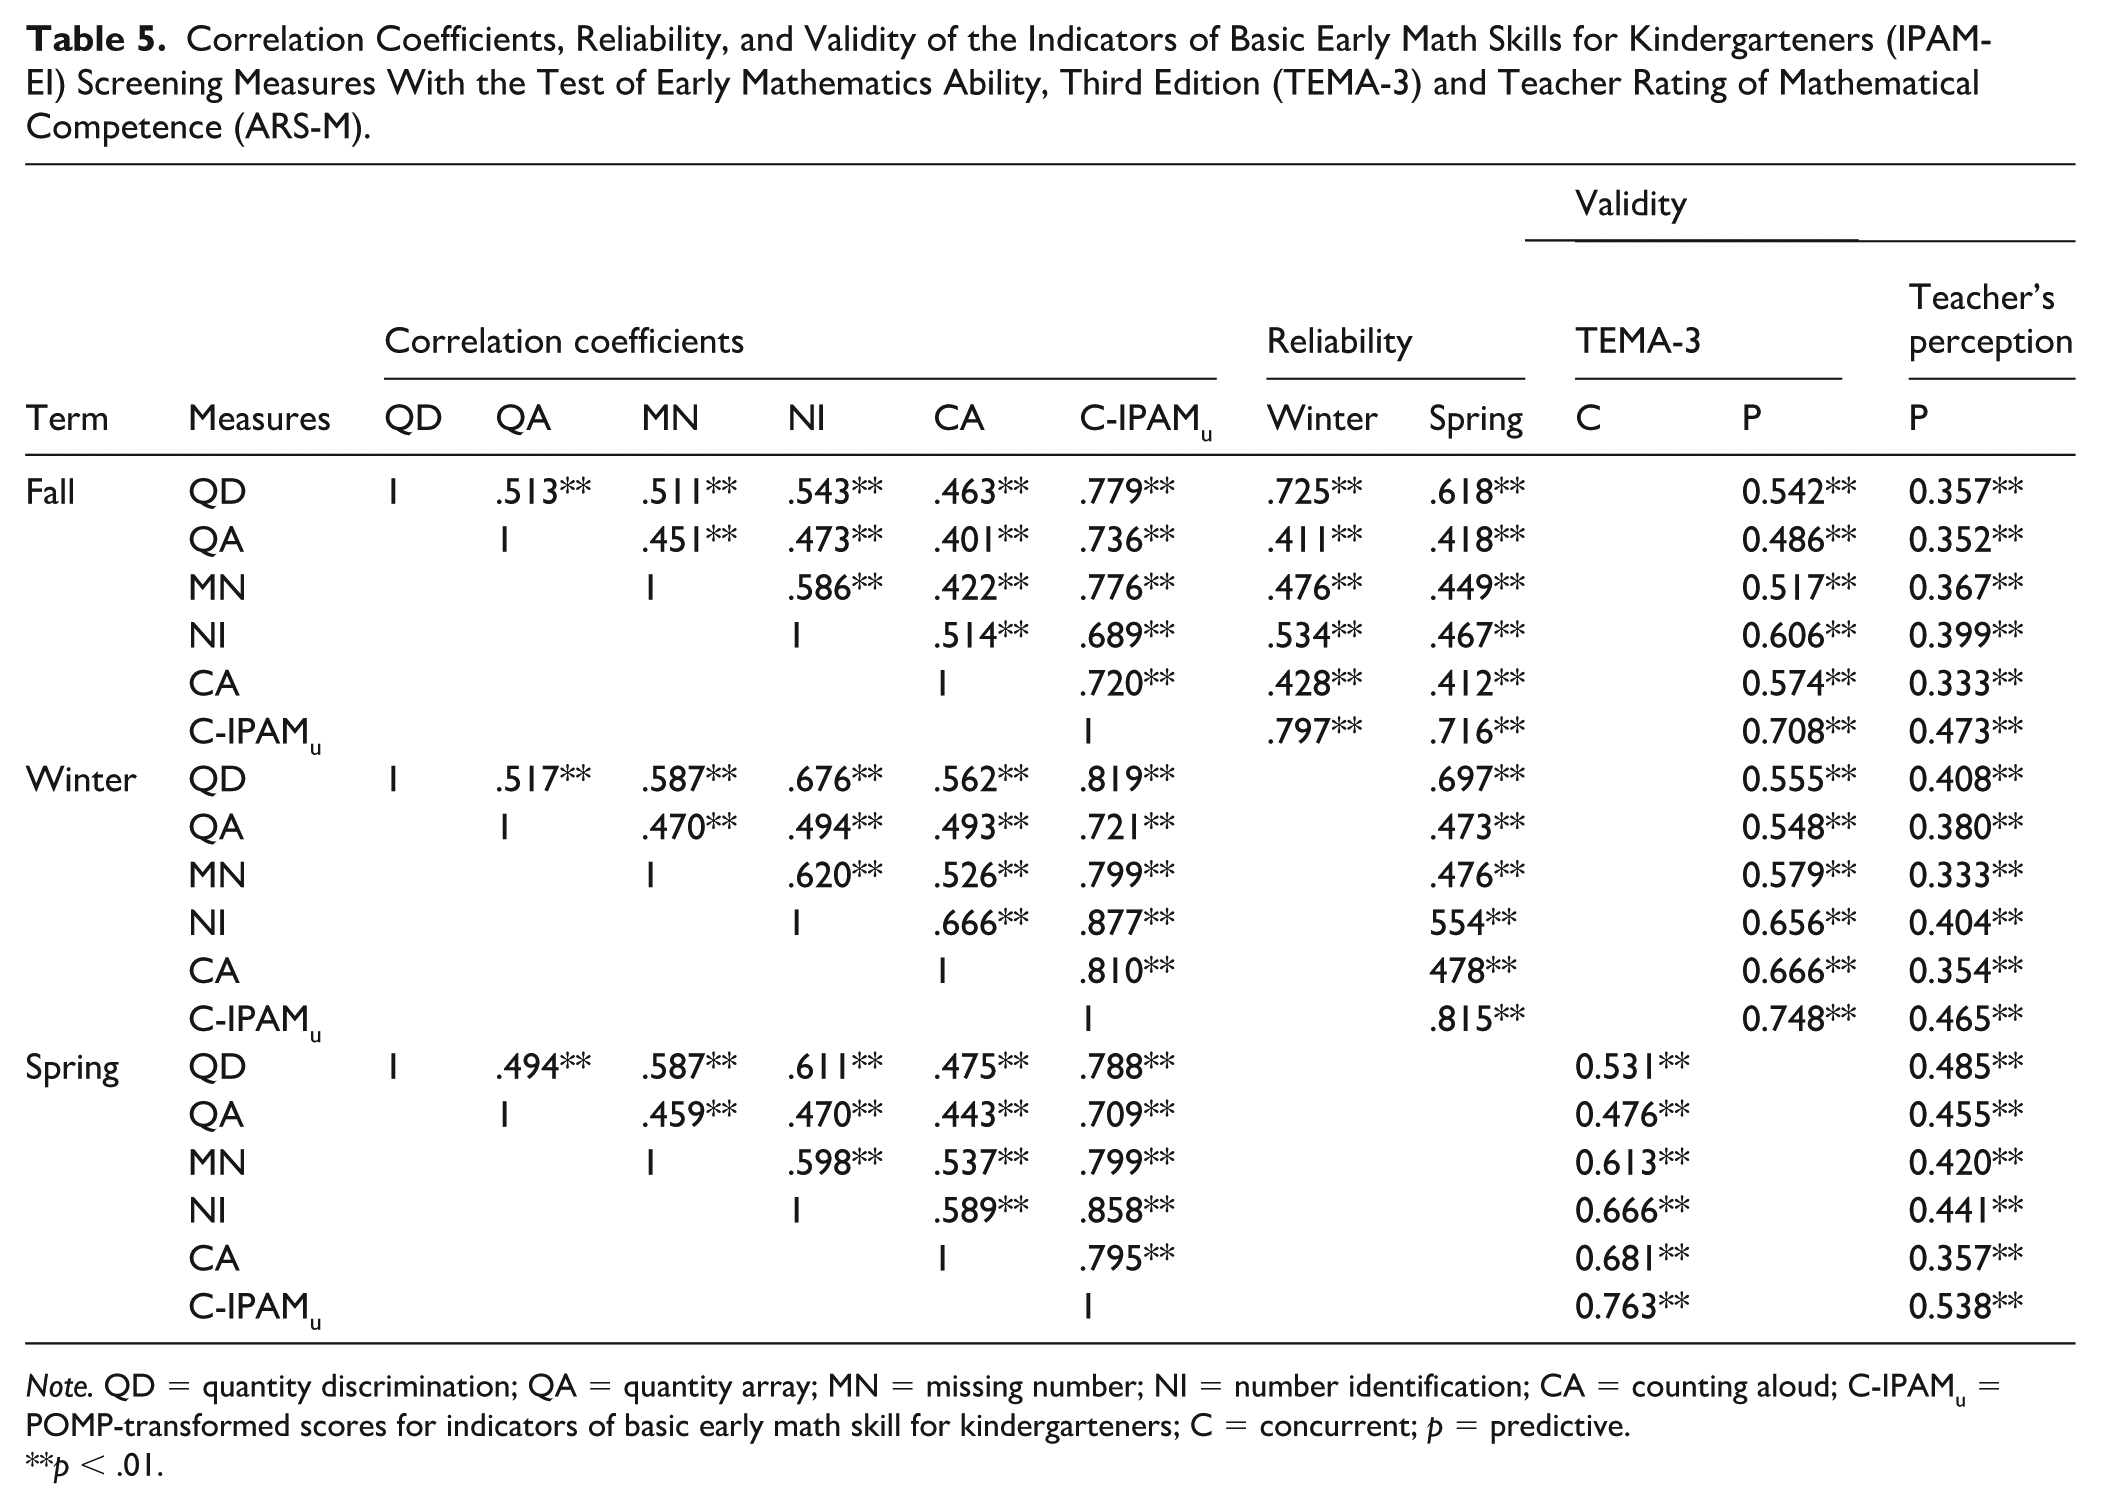
Note. QD = quantity discrimination; QA = quantity array; MN = missing number; NI = number identification; CA = counting aloud; C-IPAMu = POMP-transformed scores for indicators of basic early math skill for kindergarteners; C = concurrent; p = predictive.
p < .01.
Stage 2: Evidence That the CBM Captures Meaningful Growth
Hierarchical linear modeling (HLM) analysis was used to examine the growth trajectories of kindergarten students for each fluency-based task within the IPAM-EI framework, with a focus on differences between students at risk and students not at risk (see Table 6 for detailed results). Students’ risk status was determined based on the TEMA-3 administered in the spring, as described in the “Participants” section.
Growth Curves for the Indicators of Basic Early Math Skills for Kindergarteners (IPAM-EI) Screening Measures Throughout the School Year.
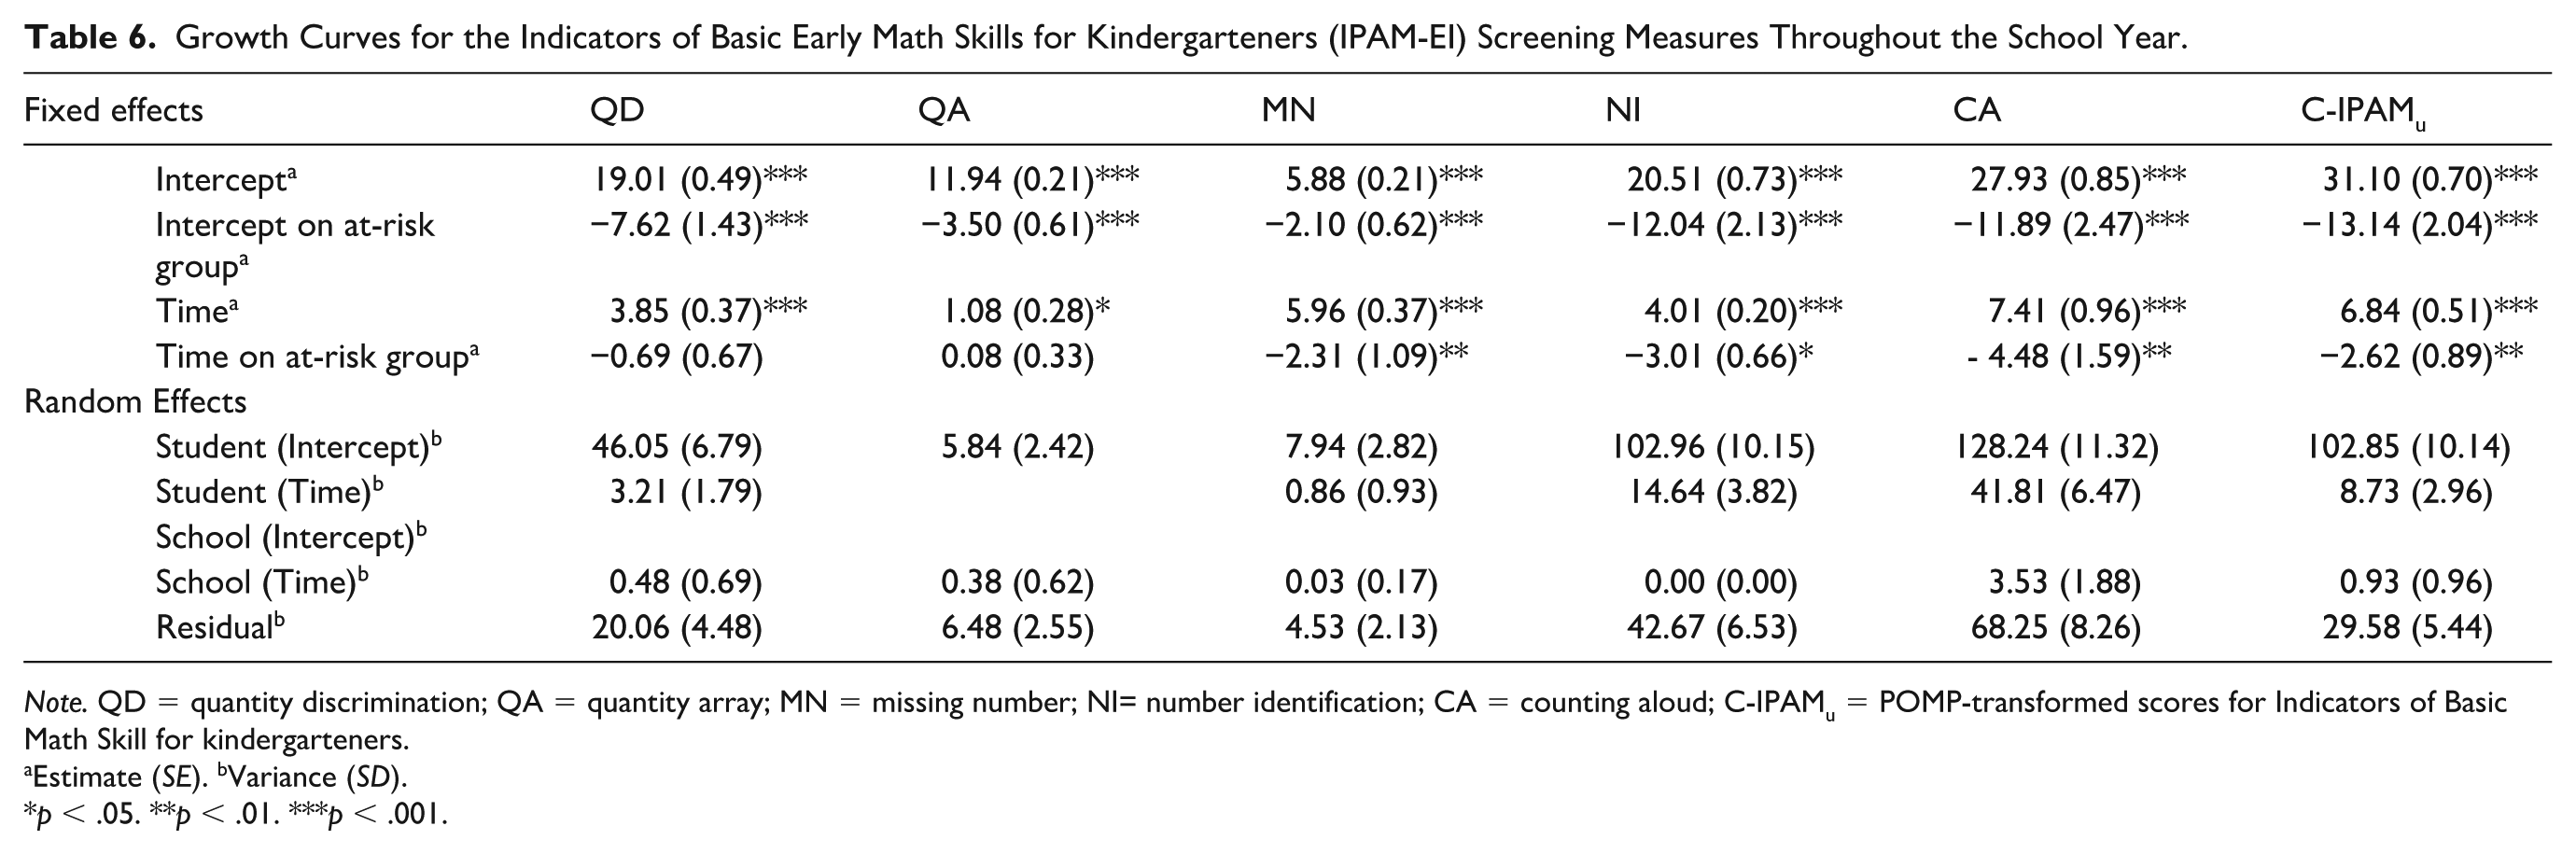
Note. QD = quantity discrimination; QA = quantity array; MN = missing number; NI= number identification; CA = counting aloud; C-IPAMu = POMP-transformed scores for Indicators of Basic Math Skill for kindergarteners.
Estimate (SE). bVariance (SD).
p < .05. **p < .01. ***p < .001.
The analysis included both fixed and random effects to account for variability at the student and school levels, with model fit assessed via the likelihood-ratio test on deviance statistics (Raudenbush & Bryk, 2002).
RQ3: Growth Across Benchmark Periods
Table 6 presents the fixed and random effects from these models. All five tasks showed significant positive time effects (p < .001), indicating that students improved from fall to spring. This finding suggests that the IPAM-EI tasks are sensitive to growth across benchmark periods, even with three administrations.
RQ4: Growth by Risk Status
Risk status (at risk vs. not at risk) was defined using spring TEMA-3 scores (see the “Method” section). The fixed-effects analysis revealed significant positive intercepts for all tasks, indicating that students not at risk began the academic year with strong performance (e.g., intercept = 19.01, SE = .49, p < .001 for QD). In contrast, at-risk students had significantly lower intercepts across all tasks (e.g., intercept for at-risk group = −7.62, SE = 1.43, p < .001 for QD), suggesting a performance gap at the start of the year. Significant growth over time was observed for all tasks, as evidenced by positive coefficients for time (e.g., Time = 3.85, SE = .37, p < .001 for QD). However, the interaction between time and at-risk status revealed that students at risk exhibited slower growth than their peers not at risk did. Specifically, students at risk presented reduced growth rates in tasks such as MN (time in the at-risk group = −2.31, SE = 1.09, p < .01), NI (time in the at-risk group = −3.01, SE = .66, p < .05), CA (time in the at-risk group = −4.48, SE = 1.59, p < .01), and C-IPAMu (time in the at-risk group = −2.62, SE = .89, p < .01), indicating that while students at risk improved over time, their progress was significantly slower. The random effects analysis revealed considerable variability at the student level, with substantial differences in both baseline performance and growth trajectories across tasks. For example, the random effect for Student (Intercept) was 46.05 (SE = 6.79) for QD and 102.85 (SE = 10.14) for C-IPAMu, highlighting the individual variability in baseline scores. Furthermore, variability in growth trajectories was particularly evident in tasks such as CA (random effect for Student [Time] = 41.81, SE = 6.47), suggesting that students showed diverse patterns of improvement. Minimal random effects were observed at the school level, indicating that individual-level factors played a more prominent role in explaining the variability in student performance than did school-level factors.
Stage 3: Evidence That the CBM Supports Instructional Decision-Making
RQ5: ROC and Classification Indices (AUC, Sensitivity/Specificity, PPV/NPV)
The diagnostic accuracy of the IPAM-EI screening measures, assessed through receiver operating characteristic (ROC) curve analysis, is summarized in Table 7. Students’ risk status was determined based on the TEMA-3 administered in the spring, as described in the “Participants” section.
Cut Scores and Classification Accuracy Metrics for the Indicators of Basic Early Math Skills for Kindergarteners (IPAM-EI) Measures.
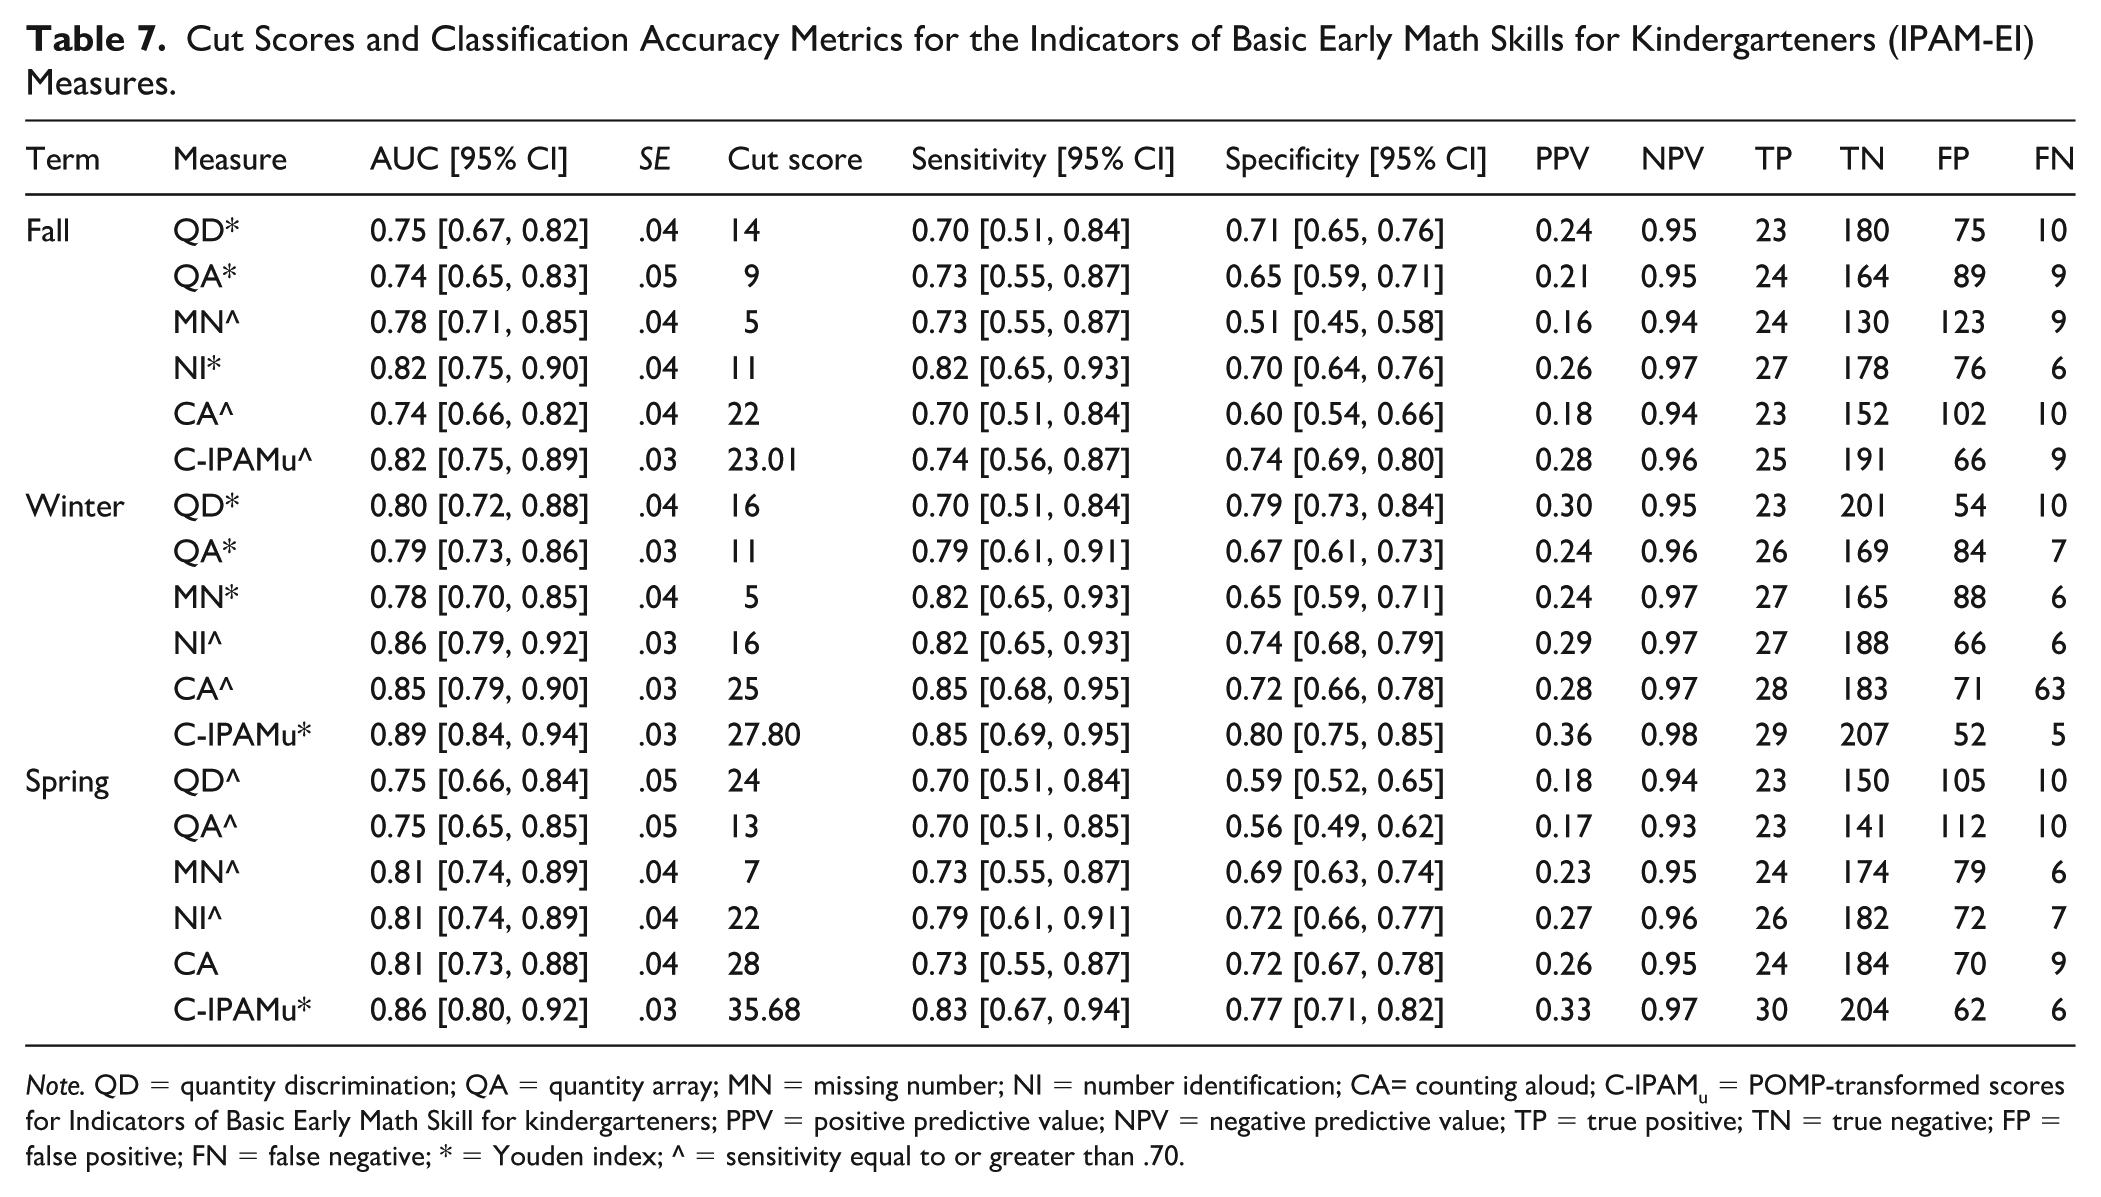
Note. QD = quantity discrimination; QA = quantity array; MN = missing number; NI = number identification; CA= counting aloud; C-IPAMu = POMP-transformed scores for Indicators of Basic Early Math Skill for kindergarteners; PPV = positive predictive value; NPV = negative predictive value; TP = true positive; TN = true negative; FP = false positive; FN = false negative; * = Youden index; ^ = sensitivity equal to or greater than .70.
Across all time points (fall, winter, and spring), the NI and the C-IPAMu score consistently demonstrated the highest diagnostic accuracy. In fall, the NI had an AUC of 0.82, with a sensitivity of 0.82 and a specificity of 0.70, and the C-IPAMu also showed AUC = 0.82 (sensitivity = 0.74, specificity = 0.74). As the year progressed, the diagnostic accuracy generally improved. By winter, the NI AUC had increased to 0.86, whereas the C-IPAMu had an excellent AUC of 0.89, with increases in both sensitivity and specificity. In spring, the C-IPAMu maintained a strong AUC of 0.86, and the NI remained highly effective (AUC = 0.81). Other tasks, such as CA, showed moderate improvements over time. While PPV values were relatively low (ranging from 0.16 to 0.36), indicating a lower precision in identifying at-risk students, NPV values remained consistently high (above 0.90) across all tasks, confirming that the IPAM-EI measures were highly effective in correctly identifying students who were not at risk. These findings highlight the effectiveness of the IPAM-EI, particularly the C-IPAMu and NI, as valid screening tools for the early identification of kindergarten students at risk for mathematics difficulties, with generally improved diagnostic accuracy over the course of the academic year.
Discussion
Unlike much of the existing CBM literature, which is predominantly based on English-speaking samples, the present findings provide direct empirical support for the use of a fluency-based screening tool within a Spanish-speaking kindergarten population. In doing so, this study responds to recent calls for culturally and linguistically grounded validation research in early numeracy screening (e.g., Outhwaite et al., 2024; Vázquez et al., 2024), where validated CBMs for kindergarten use in Spanish remain scarce. By examining diagnostic accuracy, longitudinal growth, and factorial stability within this context, the current study extends the CBM validation framework to a Spanish-language educational setting that has been comparatively underrepresented in prior research.
In accordance with Fuchs’ (2004) three-stage framework for curriculum-based measurement, we interpret our findings in terms of construct representation, sensitivity to growth, and decision-making utility. Analyses were conducted at two complementary levels. At the task level, we examined descriptive properties, convergent relations, diagnostic accuracy, and sensitivity to growth for each measure. At the construct level, we tested a one-factor model of early number sense (via CFA), derived a composite score (hereafter, the IPAM-EI composite, C-IPAMu), and evaluated longitudinal invariance and growth trajectories. We then discuss the findings in relation to the research hypotheses, noting the strengths and limitations of universal screening for mathematics difficulties.
Stage 1 (RQ1–RQ2): Do the IPAM-EI Tasks Represent the Intended Construct?
With respect to internal consistency and convergent validity (RQ1 and RQ2), our findings align with prior research showing that fluency-based measures, such as those in the IPAM-EI, exhibit high reliability and strong relations to external criteria. Seethaler and Fuchs (2011) reported reliability coefficients above .80 for early numeracy CBM tasks; similarly, our results indicate strong internal consistency and robust correlations with a standardized measure of early mathematics (TEMA-3) alongside moderate correlations with teacher ratings. These patterns suggest that the tasks capture core components of early numeracy, including number identification, symbolic magnitude understanding, and counting within Spanish-speaking kindergarten settings.
An exploratory factor analysis supported a one-factor solution, which was subsequently corroborated via confirmatory factor analysis; all five tasks loaded positively on a single latent factor. This evidence justified deriving and using an IPAM-EI composite score (C-IPAMu) for screening purposes.
Crucially, the one-factor structure remained stable across the school year, as evidenced by longitudinal measurement invariance, indicating that the same construct was measured consistently at each benchmark. Although previous work has examined early numeracy structures (e.g., Jordan et al., 2006; Kolkman et al., 2013), fewer studies have evaluated their stability over time. Relatedly, Nelson et al. (2025) reported predictive stability for early numeracy assessments across time points, which is consistent with the goals of our longitudinal validation.
We do not claim that number sense is inherently unidimensional as a theoretical construct. Rather, our results indicate that, for the specific set of five fluency tasks included in the IPAM-EI, a single-factor model provides a parsimonious representation of their shared variance for screening purposes across fall, winter, and spring. Accordingly, the unidimensional solution should be interpreted as a psychometrically supported and pragmatic representation for universal screening, rather than as a definitive statement about the multidimensional nature of early numeracy. This aligns with accounts suggesting that numerical abilities are not yet fully differentiated at this developmental stage (e.g., Sasanguie et al., 2014) while leaving open the possibility that multidimensional structures (e.g., distinguishing symbolic and nonsymbolic components; see Friso-van den Bos et al., 2014) may emerge with broader task batteries or at later ages. Future work should test alternative specifications (e.g., bifactor or correlated factors) in larger and more diverse samples.
Finally, in line with Kiss and Christ (2019) and Clarke et al. (2020), our findings reinforce the importance of task specificity in screening instruments: IPAM-EI tasks such as quantity discrimination and number identification captured core numeracy processes consistently across benchmarks, addressing concerns about content validity and psychometric robustness raised by recent reviews (e.g., Speyer et al., 2024).
Stage 2 (RQ3–RQ4): Do the IPAM-EI Capture Meaningful Growth?
Hierarchical linear modeling analysis was used in this study to examine the growth trajectories of kindergarten students in fluency-based numerical tasks, distinguishing between those classified as at risk and not at risk. This approach builds upon and confirms previous research, which has shown that early numerical fluency measures are effective in identifying students who may benefit from targeted interventions (Clarke et al., 2020; Seethaler & Fuchs, 2011). The IPAM-EI tasks showed significant growth across benchmark periods (RQ3), suggesting they are sensitive to developmental change in early numeracy skills. This pattern held across all five tasks, supporting their utility for capturing trajectories at fall, winter, and spring benchmarks, even though the instrument is intended for benchmark screening rather than high-frequency monitoring.
Regarding group differences (RQ4), fixed-effects estimates indicated lower intercepts at the beginning of the year for students classified as at risk across all tasks. These results are consistent with findings of Lembke and Foegen (2009), who reported that at-risk students tend to have weaker number identification and quantity discrimination skills at the start of the school year. Furthermore, Lembke et al. (2016) examined early numeracy growth trajectories and noted that demographic factors, such as gender and socioeconomic status, influence these patterns, highlighting the urgency of implementing early, differentiated interventions. We also observed significant time by risk interactions, with slower growth for at-risk students on several tasks such as MN and NI, echoing findings that kindergarten fluency measures can flag students who are likely to require sustained instructional support (Laracy et al., 2016). Although students in the at-risk group improved over time, the persistent differences in slopes underscore the need for early, targeted instruction and systematic Tier 2 supports within multi-tiered service-delivery frameworks (de León, Jiménez, Gutiérrez, et al., 2021).
Random-effects estimates showed substantial variability at the student level, both in initial scores and growth trajectories, which aligns with research by VanDerHeyden et al. (2006), emphasizing that individual factors contribute more to performance variability than school-level differences do. Collectively, these results highlight the value of fluency-based CBMs for universal screening: they (a) capture growth across benchmark periods and (b) differentiate initial status and trajectories by risk classification, information that can inform timely instructional decision-making.
Stage 3 (RQ5): Do the IPAM-EI Tasks Support Instructional Decision-Making?
The ROC analyses (RQ5) revealed strong discriminatory power for the C-IPAMu (AUC = 0.82–0.89), comparable to the results of Laracy et al. (2016; AUC = 0.65–0.82) and Sutherland et al. (2021; AUC = 0.95 for ASPENS). These findings align with the broader evidence that a composite (omnibus) score generally achieves higher diagnostic accuracy than individual tasks. A consistent pattern was the combination of high NPVs and moderate PPVs, especially early in the year, an expected trade-off in early screening (Clarke et al., 2020; Nelson et al., 2025). While some overidentification occurs, the screener still differentiates effectively between students at risk and those not at risk. Taken together, these results show that the IPAM-EI combines broad coverage of key early numeracy skills with strong psychometric properties. In line with recent evidence from tools such as ASPENS (Sutherland et al., 2021), the IPAM-EI offers a valuable screener for early identification and intervention planning.
Educational Implications
The validation of the screener enhances educators’ ability to reliably assess number sense at benchmark periods in young learners. The longitudinal aspect of this study offers critical insights into the stability and growth across the kindergarten year, an area often overlooked but essential for early mathematics development. By offering a screener that is sensitive to developmental change across benchmark periods, the IPAM-EI can guide instructional decisions and resource allocation within multi-tiered systems of support, ultimately fostering early numeracy. Research shows that early, targeted interventions improve number sense, ease transitions to primary education, and reduce long-term mathematics difficulties (Dyson et al., 2013).
In addition to its theoretical contribution, this study offers practical tools tailored to the linguistic and cultural context of Spanish-speaking students. These implications are further supported by prior implementation experiences in the Canary Islands, where the IPAM was used as a CBM for universal screening in early primary education (Grades 1–3) as part of a large-scale RtI pilot project. Teachers received web-based training through the Primate platform and implemented Tier 2 instruction via the Instructional Activities for Early Math Improvement (IAEMI) program. The intervention, delivered with high fidelity, led to significant gains in at-risk students’ mathematics performance (Jiménez et al., 2021). While those studies focused on primary grades, they provide real-world evidence for integrating the IPAM-EI into school-based systems. The current study extends this approach to kindergarten, reinforcing its value for early identification and timely support.
Limitations and Future Directions
Although conducted in a Spanish-speaking context, our findings align with those from English-speaking settings, suggesting that core early numeracy skills, such as quantity discrimination and number identification, are comparable across linguistic and cultural backgrounds. This supports the notion that, while screening tools require cultural-linguistic adaptation, the underlying number sense constructs are stable and informative for identifying at-risk children. Despite these strengths, the study has several limitations. First, although our sample comprised monolingual Spanish-speaking children, Spain is a multilingual country in which regional languages (e.g., Catalan, Galician, and Basque) coexist with Spanish. Future research should consider how linguistic and cultural diversity may influence early numeracy development and screening effectiveness. Second, we focused on only five numeracy tasks. Given evidence that additional skills may be relevant in early mathematics, future studies should include a broader battery to enhance the quality and coverage of the screener. Third, the external criterion (TEMA-3) was administered only once, in the spring, limiting examination of predictive relationships across time; multiple administrations across benchmarks would strengthen inferences. Fourth, we did not include domain-general cognitive measures (e.g., working memory, processing speed), which can improve the predictive validity of early numeracy screeners (Cirino, 2011; Clarke et al., 2018). The inclusion of such measures may help differentiate students who require more intensive, individualized support within an RtI framework. Fifth, the relatively low PPV reflects a common trade-off in universal screening: prioritizing sensitivity to avoid missed cases can increase overidentification, especially early in the year. Future research should explore multistage screening or adjusted cut scores to improve the balance between sensitivity and precision. Sixth, although our analyses supported a parsimonious one-factor model for the five IPAM-EI tasks, the present study was not designed to directly compare competing factorial models. Subsequent research should evaluate alternative structures (e.g., multidimensional, correlated factors, bifactor) with broader task sets and larger, more diverse samples. Future studies should also consider demographic moderators and expand the range of assessed skills, including cognitive predictors, to evaluate long-term validity and generalizability across diverse populations. Finally, although administration procedures were standardized and examiners received prior training, formal inter-rater reliability estimates and systematic fidelity monitoring were not collected during the kindergarten administration. While the IPAM-EI tasks involve objective scoring procedures that minimize examiner judgment, the inclusion of formally documented reliability and fidelity metrics would have further strengthened the present study.
Footnotes
Acknowledgements
The authors would like to thank all the participating schools, teachers, students, and families. The authors used ChatGPT (OpenAI) to assist with language editing and improving the clarity of the manuscript. All scientific content, interpretations, and final decisions remain the sole responsibility of the authors.
Funding
This work has been made possible thanks to funding from the National R&D&i Plan of the Ministry of Economy and Competitiveness, with reference PID2019-108419RB-I00, with the first author serving as Principal Investigator.
Declaration of Conflicting Interests
The authors declared no potential conflicts of interest with respect to the research, authorship, and/or publication of this article.