
Abstract
As fundraising has become a key component of American public school music educators’ professional responsibilities, in many places, parent organizations have taken an increasingly outsized role in raising private funds to supplement public school music budgets. The purpose of this study was to understand the finances of public school music parents’ associations and music booster groups and to understand the relation between the socioeconomic status of school communities and the amount of money raised by their local music booster groups. Using Internal Revenue Service (IRS) fiscal 2015 data for 5,575 music booster groups throughout the United States, we found evidence that, collectively, music booster groups raised at least $215 million in support of public school music education. At least four groups raised over $1,000,000; at least 31 raised over $500,000; and at least 723 raised over $100,000 each. We found that total booster revenues were significantly associated with local median household income. Each additional $1,000 of local median household income was associated with an additional $305 in revenue for booster groups filing IRS Form 990-EZ (“short form”) and with an additional $1,637 in revenue for booster groups filing the full IRS Form 990.
Keywords
When asked, American public school music teachers at all levels often report that fundraising takes up an inordinate amount of time, effort, and energy. Abril and Bannerman (2015) found that budgetary constraints were commonly reported as an obstacle to excellent music teaching. In a recent national survey (Give a Note Foundation, 2017), a majority of music teachers in urban schools (58%) endorsed the statement that fundraising was necessary “to offer adequate music instruction” rather than the statement that fundraising provided “an enrichment to the music program”; yet, no music teacher working in an urban school reported fundraising totals more than $10,000 annually. Among music teachers working in other locales (suburbs, towns, and rural areas), the majority endorsed the notion that fundraising “enriched” the music program rather than being a necessity to provide adequate instruction, and far more reported fundraising efforts netting $10,000 or more annually. Taken together, these survey results are suggestive that private fundraising efforts to supplement school music budgets likely vary widely from place to place and may, in some instances, serve to exacerbate inequalities of access to high-quality music instruction.
Although funding for American public schools traditionally falls within the purview of the local, state, and federal governments, there is a large and growing cadre of nongovernmental organizations contributing fundraised dollars to public schools and, in many cases, the music programs within those schools. These organizations have long been one of many sources providing “nontraditional revenue” financing American public education (Addonizio, 2000). Hansen (2012) created a comprehensive typology of these organizations: (1) school-based organizations, such as PTAs, alumni clubs, and booster clubs; (2) school foundations; (3) local education funds; (4) community foundations; (5) local businesses; (6) independent foundations; and (7) large corporations. Hansen noted that financial assistance is not the only kind of contribution nongovernmental organizations give to schools. For certain organizations, “the value of volunteer time or other in-kind contributions, for example, may far outweigh their monetary assistance” (p. 315). The Hansen typology is useful as it adequately covers organizations as diverse as the large and well-resourced Bill and Melinda Gates Foundation and the small local music booster associations familiar to many practicing music educators. Nelson and Gazely (2014) coined the term school-supporting nonprofits to refer to “parent teacher associations (PTAs), parent teacher organizations (PTOs), alumni associations, booster clubs, school foundations, and local endowments” operating primarily to support one local school or district (p. 544).
The extent to which school-supporting nonprofits supplement public school budgets has received recent attention from researchers (e.g., Brown, Sargrad, & Benner, 2017; Hansen, 2012; Nelson & Gazley, 2014; Nisbet, 2018; Posey-Maddox, 2015) and the popular press (e.g., Goldstein, 2017; McKenna, 2016). Popular press accounts suggested that parents resist allowing their fundraising efforts to benefit all students in a larger district, preferring their contributions to directly support their own children (Goldstein, 2017), and that the well-meaning contributions of wealthy parents increase school inequality (McKenna, 2016). In the research literature, Nelson and Gazely (2014) showed that between the years 1995 and 2010, the number of school-supporting nonprofits filing nonprofit tax returns in the United States increased about 230%, from 3,475 to 11,453. Revenue from these organizations grew nearly 350%, from $197 million to $880 million, over the same period. While Nelson and Gazely examined a broad range of school-supporting nonprofits, estimates of the total sums raised by PTAs in particular seem staggering: Using federal tax return data, Brown et al. (2017) found that the nation’s PTAs collectively raised at least $425 million in the 2013–2014 school year alone and that the “fifty richest” PTAs in the nation raised $43 million that year.
Despite the seeming enormity of these dollar totals, Greene (2005) contended that voluntary parent contributions to school funding make a relatively minuscule impact on school finance overall, especially when these fundraised totals are compared with the many billions of local, state, and federal tax dollars supporting the nation’s public school budgets. Greene’s assertion notwithstanding, the sheer amounts that some school-supporting nonprofits raise annually has caused some scholars and others to raise concerns that these parent contributions might serve to exacerbate preexisting funding disparities between schools and districts serving richer and poorer student populations (Nisbet, 2018). Brunner and Imazeki (2005), for example, documented a strong relationship between voluntary contributions to California public schools and the average family income in the community served by the school.
At present, there is scant empirical evidence about the extent to which private funds supplement—or supplant—public school budgets for music education. Fitzpatrick (2011) found that the “local control” policy of empowering school principals to allocate school budget funds mostly as they saw fit created wide funding disparities for instrumental music programs across high schools in the Chicago Public Schools. She similarly documented wide variation in the amount of support earned through annual fundraising across different high schools. Costa-Giomi and Chappell (2007) found that parental support for and successful fundraising by band booster groups in the middle and high schools of a Central Texas urban school district was associated with the school community’s average socioeconomic status and the proportion of students of color served by the school. Booster groups have received attention in the practitioner literature (Elpus, 2008; Hoffer, 1988), likely because, as the Give a Note Foundation (2017) found, fundraising is a key concern of many in-service music educators. Despite these concerns and in contrast to the outsized attention given to music budget cuts and program eliminations (Shaw, 2017), there has been very little research systematically examining the public or private financing of school music.
In the only such study appearing in the research literature, Fermanich (2011) analyzed the public expenditures for the music education program of a large suburban district in the western United States. For the analysis, Fermanich combined existing district administrative data from the 2008–2009 school year (music staffing, music equipment and supply procurement, and course offering) with data from two novel sources: a survey of music teachers and principals and a set of semistructured focus group interviews with nine school and district administrators, 16 music teachers, and 21 parents. Fermanich found considerable variation among schools in the district in the per-pupil expenditures for music expended from the district general fund and considerable variation among schools in the amount of supplemental fundraising and donations used to support music. This variation was not significantly related to the school’s proportion of students from racial and ethnic minorities or the school’s proportion of students eligible for free or reduced-price meals. Rather, the between-school variation in school music spending was related to differences in teacher staffing costs (more experienced and more educated teachers being compensated more highly), the size of the individual school’s budget, and the rate of music participation among students in the school. The wide latitude given to principals to increase or decrease support for any particular element of the “elective” programs within a school was a salient factor influencing financing for school music from district budget allocations. Additionally, the will and capacity of the community to fundraise successfully for music influenced the total amount spent on music education from fundraised sources. Considered as a whole, the district spent about $12.4 million of its operating budget on music education, representing just 1.6% of the annual budget. The majority of the district’s public funds for music education (90%) were allocated toward teacher staffing costs (salaries and benefits). The $12.4 million public budget allocation represented about 90% of the total district expenditures for music education at all levels, with the remaining 10% of total district music expenditures coming from various fundraised sources. Importantly, school-level music booster club accounts—at some schools representing balances in the tens of thousands of dollars or more—were not included in Fermanich’s spending analyses, suggesting that he likely underestimated the proportion of total music education financing in the district obtained from fundraising. Focus group data showed that teachers and administrators believed that the fundraised dollars were essential to maintain the quality of music education offered in the district.
Purpose of the Study and Research Questions
Given that fundraising appears to be a significant factor in the financing of public school music education and that music parents’ associations and booster groups appear to be successful vehicles for raising private funds to support public school music education, we sought to document the nature and extent of parent booster group music fundraising. For our study, we defined a “music booster group” as a school-supporting nonprofit organized to benefit the music program of one or more local public schools, regardless of the name of the organization. The purpose of this study was to understand the finances of public school music parents’ associations and music booster groups and to understand the relation between the socioeconomic status of school communities and the amount of money raised by local music booster groups. Based on nonprofit tax return data from the U.S. Internal Revenue Service (IRS), our study was guided by the following research questions:
(1) What were the key financial and demographic characteristics of music booster groups in the United States for fiscal 2015? How did these characteristics vary by location?
(2) What was the overall economic impact of music booster groups on the private funding of public music education during fiscal 2015?
(3) What was the relation between the amounts raised by music booster groups and the median household income of the school communities served by the booster group during fiscal 2015?
Method
Data Sources
To answer our research questions, we needed a national data set of music booster group finances. Seeing as there is no such existing data set, we set about the task of creating a new unique data set by combining several sources of publicly available information on nonprofit organizations in the United States and searching through these data to isolate those organizations that were clearly music booster groups. As part of the requirements for organizations to be declared exempt from federal taxation in the United States, each organization must file with the IRS a Form 1023 seeking a determination of nonprofit status and annually file an informational tax return detailing the organization’s finances. These informational returns are open to public inspection; the public may request a copy of the return from an organization directly, download the information on the return as raw data from the IRS, or use a third-party database service (e.g., GuideStar.org) to view the return as filed. Additionally, IRS Publication 78 lists the registered name, the IRS-assigned federal employer identification number (EIN; sometimes referred to as a “tax ID number”), and the city and state for all organizations that have been granted tax-exempt status in the United States.
To assemble our analytic data set, we started from the complete list of 1.03 million not-for-profit organizations listed in the 2016 edition of IRS Publication 78. We created a comprehensive dictionary of keywords in three categories: music (“band,” “choir,” “choral,” “music,” etc.), school (“elementary,” “high school,” etc.), and entity/organizational (“boosters,” “friends of,” “parents association,” etc.). We applied this dictionary to a complex automated keyword search of the organization names listed in IRS Publication 78. Initial results from the automated keyword search yielded 9,676 individual organizations that were possible matches for our definition of a music booster group. Of these matches, the keyword search identified 3,921 organizations that were definite matches based on the organization name including both the name of a music ensemble (“band,” “orchestra,” “choir,” etc.) and the word “booster.” These organizations were flagged for inclusion in our data set without further review.
The remaining organizations (n = 5,755) were flagged by our keyword search for a further manual review. The organizations flagged for manual review contained a keyword from our music category and either a keyword from our school category or a keyword from our organizational/entity category. For our manual review, we searched each listed organization on GuideStar.org to view the organizational mission statements, activities, and exempt purposes listed on its nonprofit federal tax return. This manual review ensured that we included music booster groups that had relatively unique names and that we excluded local arts organizations that supported, for example, local symphony orchestras or community choirs. Organizations for which any of these data were missing on GuideStar.org were further searched via Google to determine whether the organization met our operational definition of a music booster group. Of the 5,755 organizations that we manually reviewed, we confirmed that 1,251 met our operational definition. After our initial keyword search and manual review, we identified 5,172 organizations nationally that we confirmed were music booster groups.
Upon completion of our manual review, we discovered one additional source of eligible booster organizations: a third-party commercial compliance service marketed to school-supporting nonprofits. For an annual subscription fee, this compliance service handles many of the accounting and registration requirements associated with operating a tax-exempt nonprofit. Booster groups employing this service do not need to file their own Federal Form 1023, as they become eligible for tax-exempt status under a “group determination letter” granted to the compliance service by the IRS. Because these booster organizations do not seek their own determination letter, they are not directly listed in IRS Publication 78. However, we were able to identify all organizations registered under the group determination letter via GuideStar.org, and we manually identified an additional 403 music booster groups that held nonprofit status under this group determination letter. This brought our total data set of confirmed music booster organizations to 5,575.
After identifying and verifying our list of booster groups from Publication 78 and the roster of organizations under the third-party commercial compliance service’s group determination letter, we set about gathering financial data from each organization. We focused exclusively on the finances reported by organizations for their fiscal years beginning at any point in calendar 2015 and for which they filed an IRS Form 990 (Return of Organization Exempt From Income Tax). All organizations ruled exempt from federal income tax by the IRS file one of three versions of Form 990, based on the annual gross receipts of the organization. Organizations with total income from all sources not exceeding $50,000 can file Form 990-N (the “e-Postcard” return), which is a short form providing minimal information. Organizations with total receipts from $50,001 to $199,999 can file Form 990-EZ, a short form that contains considerably more detail than the 990-N e-Postcard but considerably less detail than the full Form 990, which is required of exempt organizations earning $200,000 or more per year. Organizations may choose to file a longer version of the form than required but may not step down to a shorter form once the gross receipt thresholds are met. We obtained Form 990 data for fiscal year 2015 from the IRS Statistics of Income annual extract of tax-exempt organization financial data, which are transcripts of the organizational returns. We retained complete information for the verified music boosters based on organizational EIN. For the 2,072 organizations filing the 990-EZ (n = 1,517) and the full 990 (n = 555), we observed complete annual fundraising, contribution/donation, and spending data. For organizations filing the 990-N e-Postcard (n = 3,503), we were not able to observe any specific financial data.
We next sought to merge booster group financial data with U.S. Census data for annual household income. To determine household income in the areas served by the music booster groups, we obtained U.S. Census data for median household income by ZIP code for calendar 2015. To properly merge the census data with the organizational finance data, we needed to obtain the registered address of each music booster organization. Although IRS Publication 78 does include each organization’s city, state, and EIN, Publication 78 does not include the organization’s mailing address or ZIP code. This contact information is also not included in the Statistics of Income tax-exempt organization extract data. To expedite the process of locating and merging accurate mailing addresses and ZIP codes, we coded a tool in Google Sheets that executed an XML search query in the Google Maps application programming interface using organization name, city, and state as search terms. The search tool returned addresses and ZIP codes for just under three-quarters of the organizations (n = 4,133), leaving the remaining 1,442 organization addresses and ZIP codes for our research team to manually retrieve from GuideStar.org.
Our final data task involved the choice of regional grouping most appropriate for our analyses. As our data already included city and state, we needed to determine whether it would be more appropriate to categorize organizations by the four U.S. Census Bureau regions (northeast, midwest, south, and west) or another regional identification method. We decided that the most appropriate regional grouping was the regional system used by the Bureau of Economic Analysis (BEA) of the U.S. Department of Commerce, which groups the states and the District of Columbia into eight geographically contiguous regions (except for the obvious exceptions of Alaska and Hawaii) that share commonalities among an assortment of key economic and social characteristics. The eight BEA regions are as follows: (1) New England (Connecticut, Maine, Massachusetts, New Hampshire, Rhode Island, and Vermont), (2) the Mid-Atlantic (officially called by BEA the “Mideast region,” comprising Delaware, the District of Columbia, Maryland, New Jersey, New York, and Pennsylvania), (3) the Great Lakes (Illinois, Indiana, Michigan, Ohio, and Wisconsin), (4) the Plains (Iowa, Kansas, Minnesota, Missouri, Nebraska, North Dakota, and South Dakota), (5) the Southeast (Alabama, Arkansas, Florida, Georgia, Kentucky, Louisiana, Mississippi, North Carolina, South Carolina, Tennessee, Virginia, and West Virginia), (6) the Southwest (Arizona, New Mexico, Oklahoma, and Texas), (7) the Rocky Mountains (Colorado, Idaho, Montana, Utah, and Wyoming), and (8) the Far West (Alaska, California, Hawaii, Nevada, Oregon, and Washington).
Empirical Approach
After creating and cleaning our analytic data set, we calculated various descriptive statistics to answer Research Questions 1 and 2. To answer Research Question 3, we examined the median household incomes of communities with booster groups, and we used analysis of variance (ANOVA) to understand how the average value of median household incomes differed across various communities with booster groups. Additionally, we used fixed effects regression modeling to estimate the magnitude and direction of the relation between median household income and annual booster group revenues. We make use of fixed effects regression so that we can account for the nesting inherent in our data: individual booster groups are nested within states, each of which has similar policy environments for school music and school fundraising, which may affect the relation between median household income and booster group revenues and should therefore be included in our model.
Results
National Impact
We identified at least one music booster group in each of the 50 states plus one group in the U.S. Virgin Islands. We identified no music booster groups in the District of Columbia. There is an arts magnet high school within the District of Columbia Public Schools that is run as a public–private partnership, and although the foundation that administers the partnership was identified in our keyword search, it was excluded from our analyses once we determined that the mission and structure of the foundation did not meet our operational definition of a music booster group. Table 1 shows the distribution of music booster groups by state, BEA region, and gross receipts as indicated by the Form 990 that the group filed during calendar 2015.
Frequencies of Identified Music Booster Groups by BEA Region, State, and Filing Status.
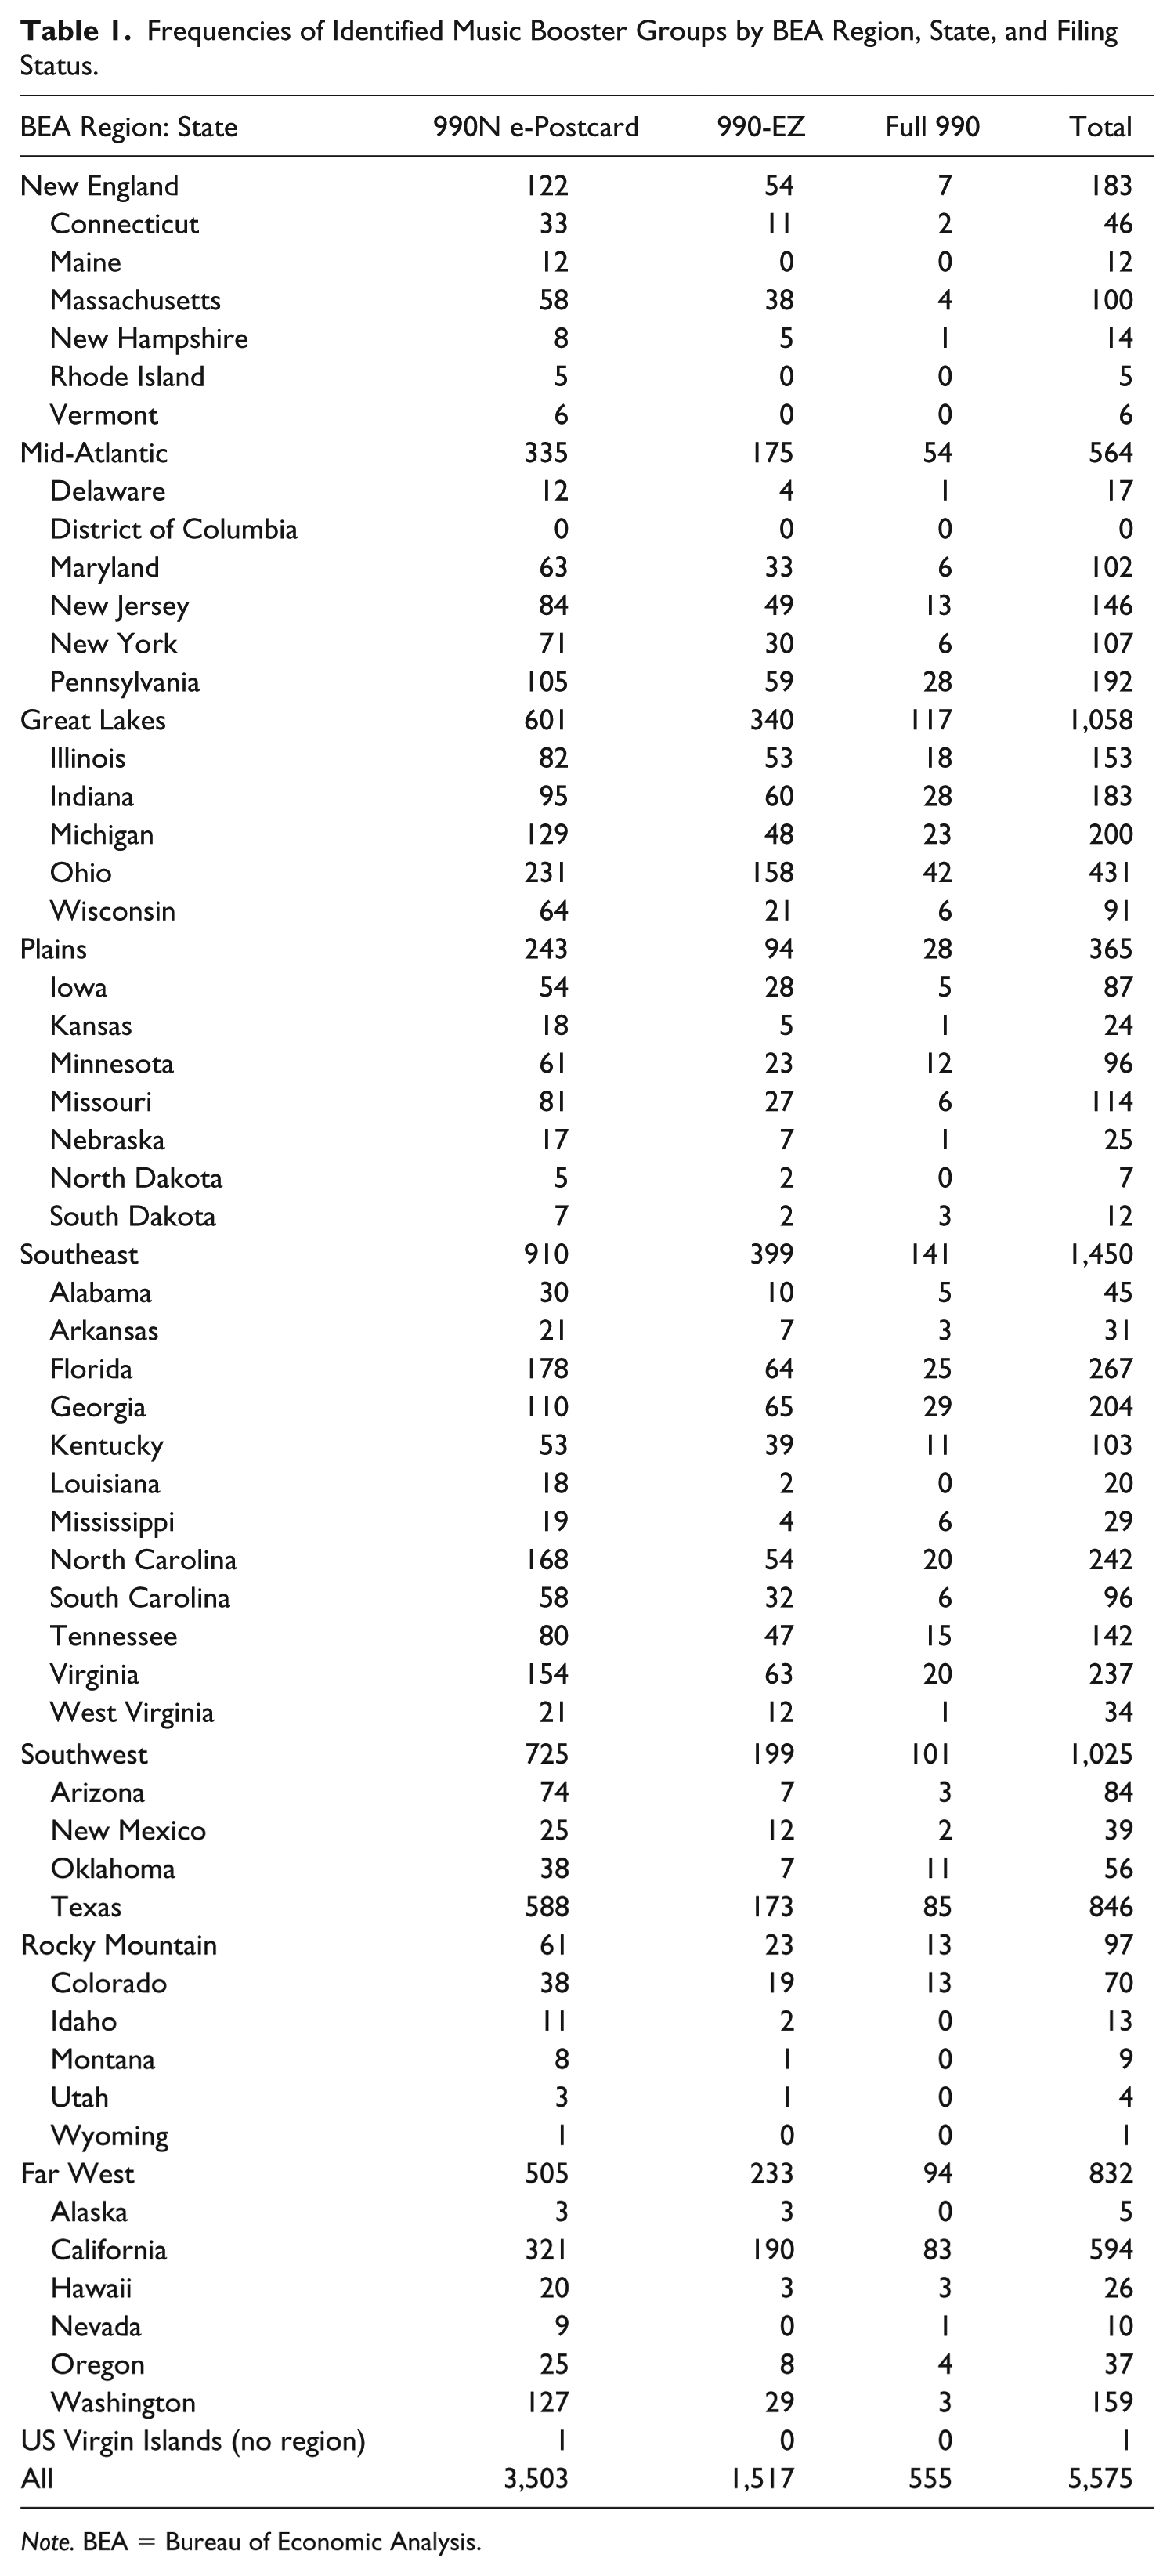
Note. BEA = Bureau of Economic Analysis.
We found that in 2015 all music booster groups in the United States collectively raised at least $215 million 1 supporting public school music education in their communities. This figure represents a lower bound on a reasonable estimate of money raised by music booster groups nationally, as it is based only on the revenue totals reported by the 2,072 booster groups that filed the Form 990-EZ or the full Form 990 during 2015. Given that the 3,503 Form 990-N e-Postcard filers could have raised up to $50,000 each, the potential exists for an additional $175 million in 2015 fundraising by e-Postcard filers. As it is not likely that most e-Postcard filers raised amounts hewing so closely to the 990-EZ filing limit, this suggests a potential extreme upper bound on our estimate of the fundraising by music booster groups of $385 million, with the true national total likely much closer to $215 million.
Nationally, the mean annual revenue total for Form 990-EZ filers was $66,089 (SD = $42,354); the median was $58,268. The mean annual revenue total for full Form 990 filers was $206,327 (SD = $170,743); the median was $174,156. We found regional differences in the average amounts raised by booster groups across the nation. Table 2 reports revenue averages for music booster groups by BEA region and by filing status. Variation in total revenues by region was significant for full 990 filers, F(7, 547) = 6.65, p < .001, η2 = .08, and for 990-EZ filers, F(7, 1509) = 5.27, p < .001, η2 = .02.
Mean Booster Group Annual Revenues by BEA Region and Filing Status.
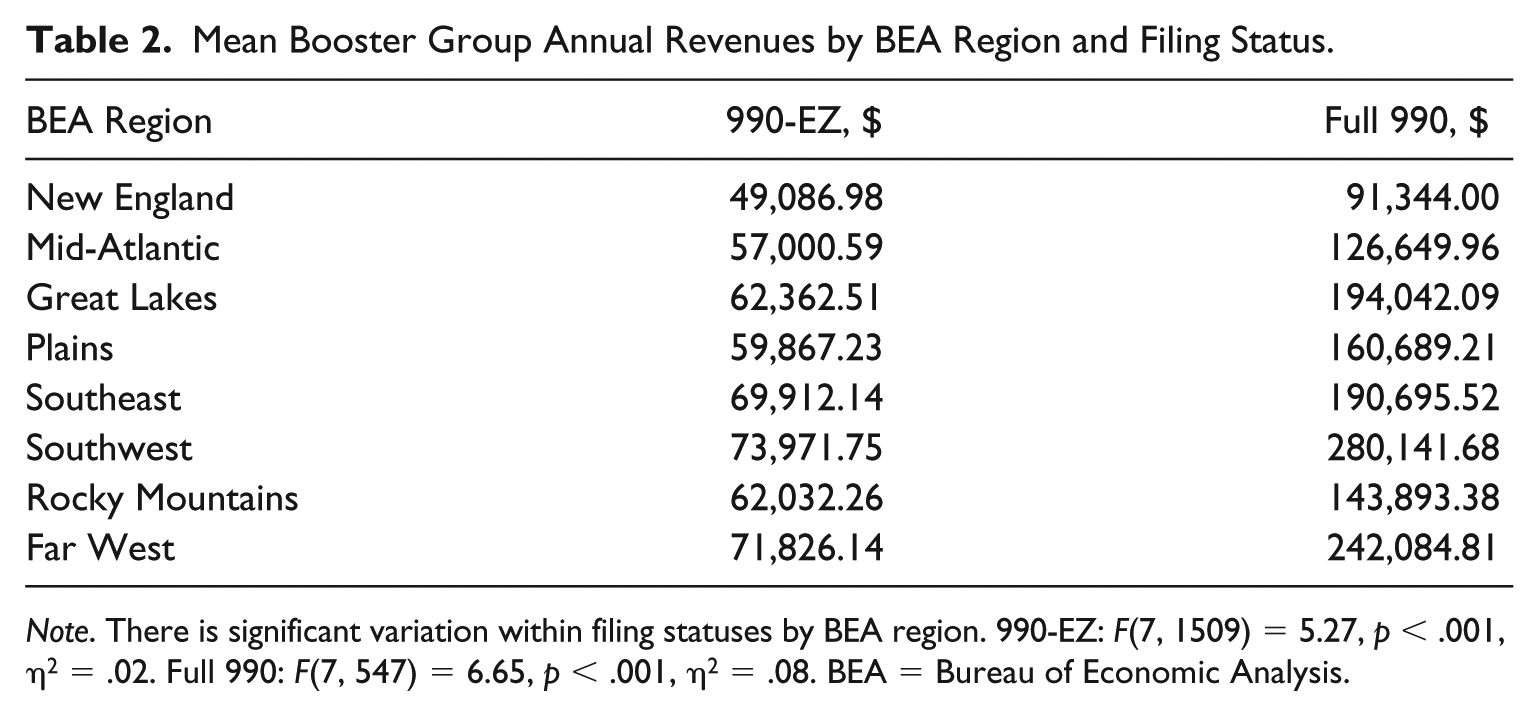
Note. There is significant variation within filing statuses by BEA region. 990-EZ: F(7, 1509) = 5.27, p < .001, η2 = .02. Full 990: F(7, 547) = 6.65, p < .001, η2 = .08. BEA = Bureau of Economic Analysis.
Given the wide variation in revenues for organizations, it makes sense to examine organizations at the extremes of the distribution as well. The 50 booster groups with the largest revenues in 2015 collectively raised $30,178,278, for an average of $603,566 each and a median of $542,805. We identified four music booster groups that earned over $1,000,000 in revenue; each organization was located in Texas or California. We identified 31 booster groups that raised over $500,000 each and 723 that raised over $100,000 each. The single music booster group with the largest reported revenue was located in Texas, and it raised $1.34 million in fiscal 2015. Further examination of the organization’s Form 990, which includes revenue data for 2011 to 2014, revealed that 2015 was somewhat of an outlier for that group. This organization, which supports the entire cost of all cocurricular band and guard activities for about 350 students annually, typically has revenues between $500,000 and $700,000. The booster organization with the second-highest reported revenue was located in California, and it raised $1.24 million, an amount consistent with this group’s revenues reported in the years prior to and after 2015. A further examination of that booster group’s Form 990 and website revealed that this group was responsible for raising funds to provide annual salary and benefits for multiple music teachers in the district’s elementary and middle schools, which would not have had music ensembles in the absence of private fundraising. Many of these funds were raised by mandatory contributions from the families of students enrolled in music education.
Variation by Community Affluence
Although we had no financial information for those booster groups filing the 990-N e-Postcard, we still sought to understand if there was an association between booster group revenues and the median household income within a ZIP code where a music booster group is located. Across the United States, the 2015 median household income was $55,775. Among ZIP codes where we identified any music booster group, the average value of the median household income was considerably higher: $63,198. In ZIP codes with a booster group that filed the 990-N e-Postcard, the average value of the median household income was $62,284; in ZIP codes with a booster group that filed a 990-EZ, the average value of the median household income was $66,603. The average value of the median household income was highest ($74,126) in communities where a music booster group filing the full 990 form was located. ANOVA showed significant differences among these averages, F(2, 5572) = 38.01, p < .0001, η2 = .013. Tukey honestly significant difference post hoc analysis showed that the 990N, 990-EZ, and full 990 average median values are all significantly different from one another.
As the ANOVA results were suggestive of an association between booster group revenues and median household income, we estimated a fixed effects regression model to understand the magnitude and direction of the association. We included state fixed effects in the model to account for unobserved variation at the state level (e.g., school fundraising policies, state music education policies, and traditional roles for booster groups within the state) that is potentially associated with music booster group revenues. To account for the nested nature of the data, we estimated our model using adjusted standard errors robust to clustering at the state level. We estimated the model shown in Equation 1 for booster groups filing the full 990 and 990-EZ (i.e., groups where we observed total annual revenues):
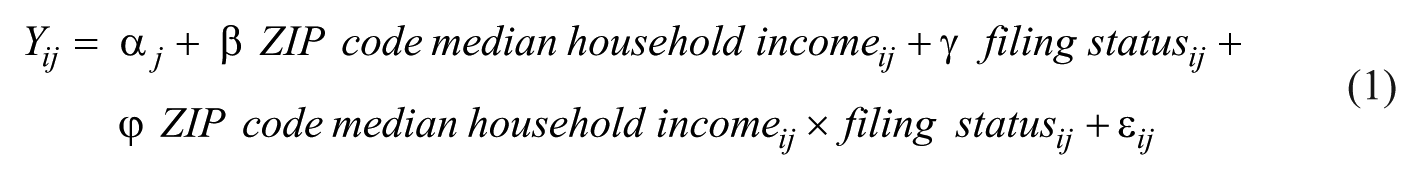
In Equation 1, Yij is the reported annual revenue total for the ith music booster group in the jth state; α j is the state-specific intercept for state j; β and γ are the regression coefficients for the variables indicated; φ is the coefficient for the interaction of median household income within the booster group’s ZIP code and the booster group’s filing status; and εij represents the error in the model. The interaction term φ allows the slopes of the association between median household income and booster group revenue to differ between 990-EZ filers and full 990 filers; therefore, our estimate of the association between household income and booster revenues is β for 990-EZ filers and β + φ for full 990 filers. For this analysis, we used a grand mean–centered version of our variable for median household income in the booster group’s ZIP code, expressed in thousands of 2015 dollars. By using a mean-centered version of the variable, the reported intercept of the model is the expected booster group revenue for a 990-EZ filing organization at the mean-observed median household income. Note that the average value of median household income in ZIP codes with booster groups filing a full 990 or a 990-EZ (and therefore included in this analysis) was $69,682, considerably higher than the national median household income in 2015.
Table 3 reports the regression results. For comparison, we show estimated models with and without state-level fixed effects. Our preferred estimates, including the state fixed effects, are shown in the table as Model 2. As seen in the table, our results indicated that at the average median household income for booster group ZIP codes, we expect that a booster group filing Form 990-EZ will report annual revenues of $66,767 and that a booster group filing the full Form 990 will report annual revenues of $189,978. For each additional $1,000 in the median household income, a Form 990-EZ–filing booster group will raise an additional $305 annually, and a full Form 990–filing booster group will raise an additional $1,637 annually. Figure 1 displays the significant interaction effect by illustrating the marginal effects of median household income on the revenues of Form 990-EZ– and Form 990–filing music booster groups.
Regression Models for Effect of Median Household Income on Booster Group Annual Revenues.
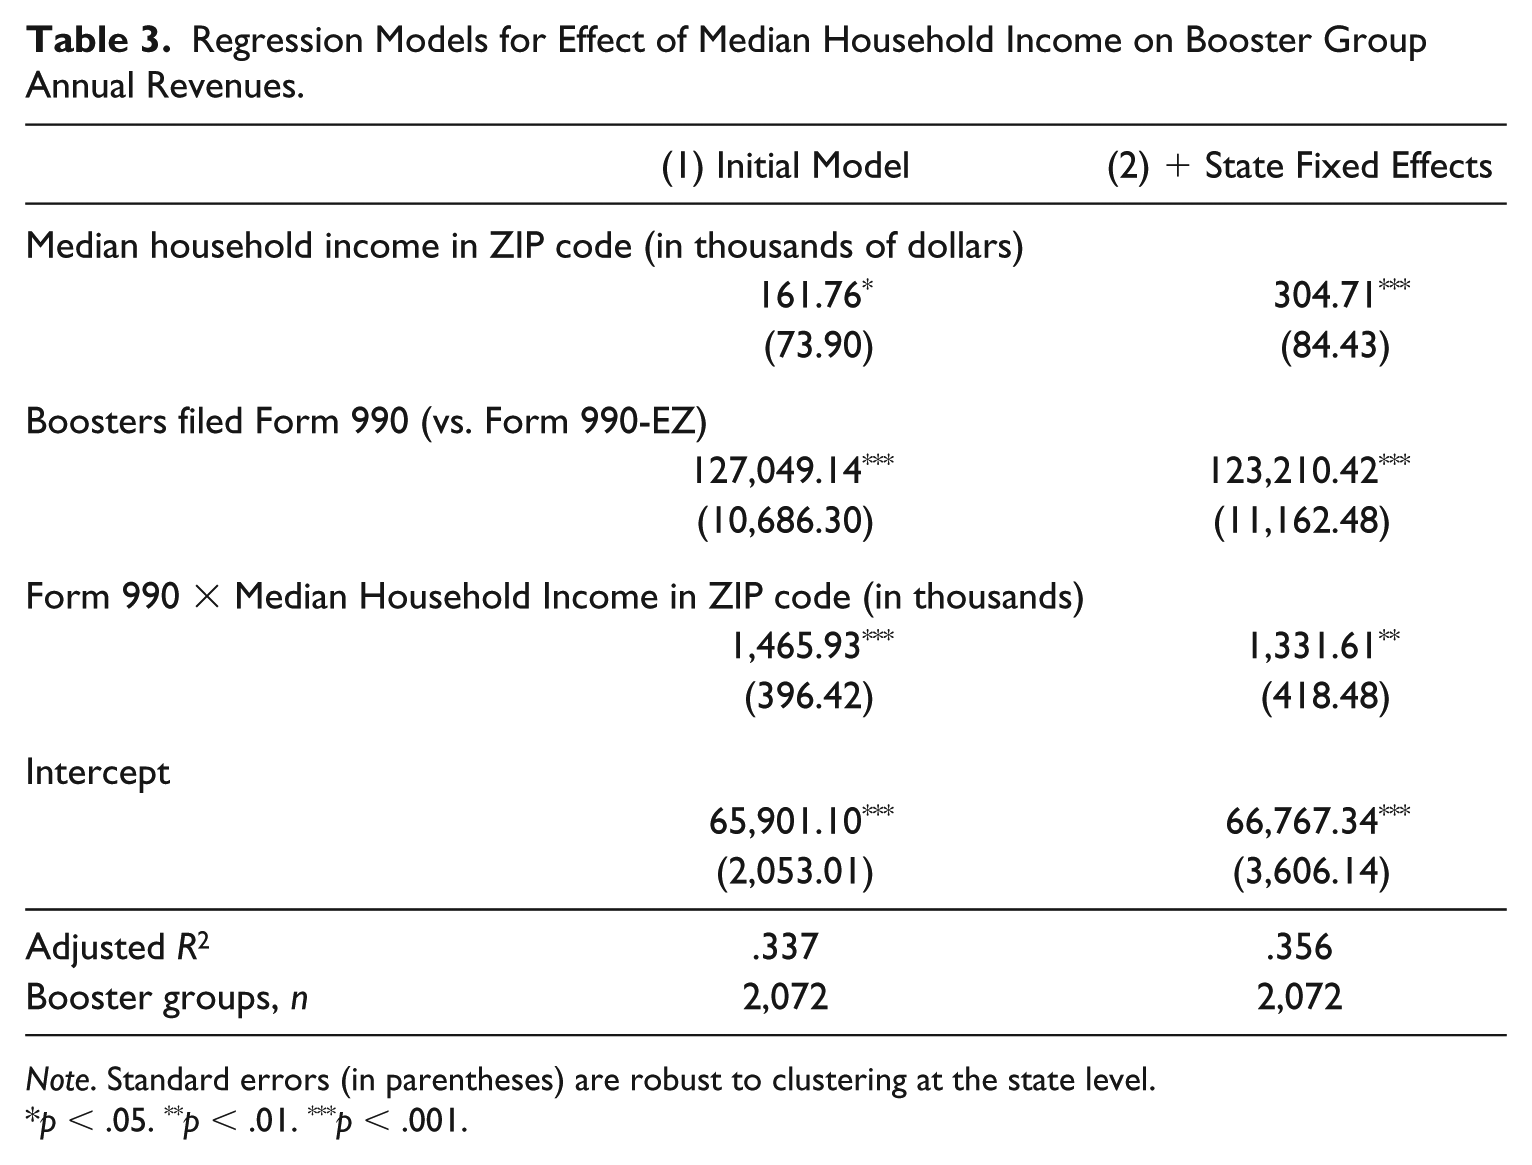
Note. Standard errors (in parentheses) are robust to clustering at the state level.
p < .05. **p < .01. ***p < .001.
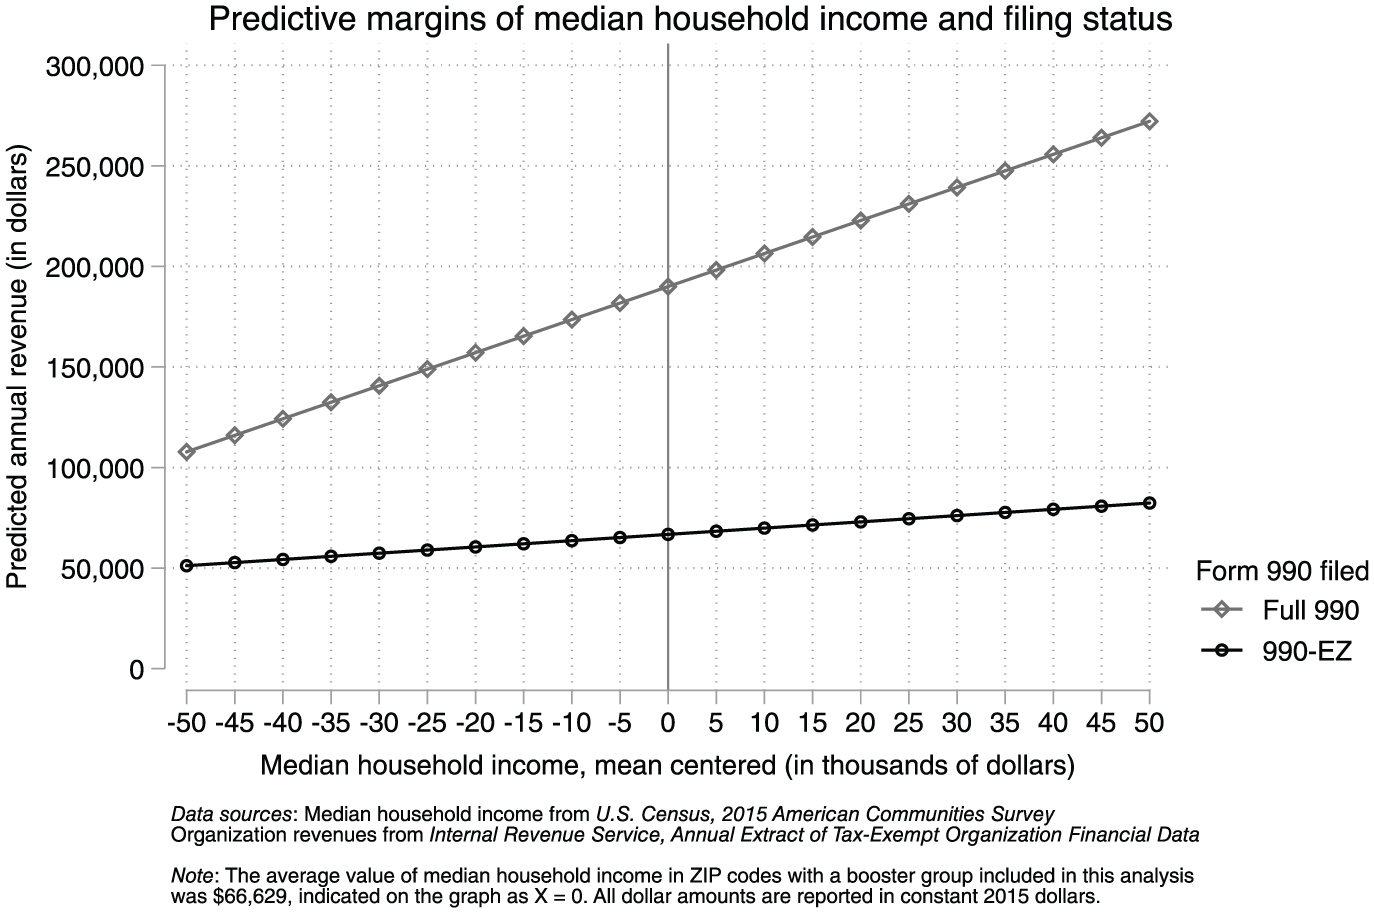
Predicted annual revenue totals for Form 990-EZ– and Form 990–filing booster groups, showing the significant interaction between median household income and the type of form filed. The association between median household income and booster organization total revenues is greater for full 990 filers than for 990-EZ filers.
Discussion
In the present study, we sought to estimate the impact of music booster groups on the private financing of public music education at the national and local levels. Our results indicate that, nationally, music booster groups raised at least $215 million in annual revenues during 2015. Our estimate represents a lower bound on the possible national impact of music booster groups for two important reasons: (1) Nonprofit groups with revenues below $50,000 are not required to report detailed financial information to the IRS and are thus excluded from our estimate; (2) there exists the possibility that there are many more music booster groups operating in the nation that do not (yet) hold a federal tax-exempt determination letter and are therefore not required to file any version of Form 990.
Locally, we found that some music booster groups are quite successful at raising very large sums of money, with at least 723 groups nationwide raising at least $100,000. Echoing prior work on private parent contributions to public education (Brunner & Imazeki, 2005), we found a strong association between the median household income within a ZIP code and the total revenues raised by a music booster group—and this association is significantly stronger for groups that raise enough to meet the full Form 990 filing threshold. This evidence strongly suggests that successful music booster groups are contributing money to the music education programs of schools that are serving the students living in wealthier communities. Local public funding for schools in the United States tends to be highly correlated with the wealth of the community (Chingos & Blagg, 2017), with state and federal funding serving in most districts to supplement the relatively low levels of local resources allocated to the education of poorer students. In many districts, strategic deployment of state and federal funding does serve to close the gap between public resources dedicated to richer and poorer students (Shores & Ejdemyr, 2017), but the private donations of wealthy parents and parent-led school-supporting nonprofits can serve to rewiden the spending gap (Brown et al., 2017; Nisbet, 2018), even if this is a wholly unintended effect of wealthier parents’ support of their local public schools (Posey-Maddox, 2015).
As this is the first study to examine booster group revenues on a national scale with government data, there remain some important limitations to our work that we must acknowledge. While we believe that we successfully identified most music booster organizations that were registered with the IRS as bona fide tax-exempt nonprofit organizations and that were identifiable per the organizational name listed in Publication 78, there is likely a considerable number of music booster groups in operation that are missing from our data set. This means that we are likely understating the national impact of music booster group revenues. One reason why groups may be missing from our analyses is that they are seeking but have not yet received a tax-exempt status “determination letter” from the IRS, which would preclude their listing in IRS Publication 78. It is possible for organizations to operate under a “group determination letter” and not be individually listed in Publication 78; we identified one such set of geographically disperse music booster groups under one “group determination letter,” but others may exist. Other organizations may be operating as incorporated entities that do not wish to be considered tax exempt, which would again cause them to be missing from our data set. Still others may be operating only as loose organizations without formally registering or incorporating as business entities. These organizations, too, would not be listed in IRS Publication 78. Combined with the lack of detailed financial data on those organizations that are listed in IRS Publication 78 but do not gross $50,000 or more in revenues, our estimates represent the lowest possible nationwide revenue totals but accurately reflect the available evidence. Another limitation from our study lies in the nature of the evidence itself. Figlio and Kenny (2009) point out several challenges in using 990 data—most notably, that organization revenues may not precisely align with the contributions made to support the schools. Although their criticisms are not without merit, IRS 990 data are the most comprehensive available source of national data on school-supporting nonprofits and, as such, provide a valuable evidentiary base for research such as that presented here.
Music teachers reported that they perceive fundraising to be an important component of providing a quality music education to their students (Give a Note Foundation, 2017). Our results suggest that coordinated parent efforts to raise funds in support of music education can provide substantial nongovernmental support for public music education; however, the most common uses of music booster organization funds remain an open question. For example, some booster groups may seemingly raise large amounts of money that are held essentially in discrete “accounts” intended to support individual student costs associated with music participation for the exclusive benefit of the student who raised the money. Other booster groups may subsidize—or purchase outright—instruments, technical equipment, or uniforms that are beyond the means of public budget allocation for music. Others may support teacher salaries and benefits directly. Ultimately, it is unknown whether the majority of music booster organization funds are used to supplement public budget allocations or substitute for nonexistent public budget allocations. Clearly, more systematic research into the typical uses of music booster funds is warranted. A clearer understanding of the scope of private support for public music education can help inform local policy decisions about music funding and potentially help alleviate inequalities in the opportunities for students to participate in well-funded music education.
Footnotes
Acknowledgements
We are grateful to Rose Alon, a University of Maryland undergraduate student in music education at the time when this study was completed, for invaluable research assistance provided to this project. We gratefully acknowledge additional research assistance from University of Maryland music education graduate students Grace Chris, Tyra Flotte, and Dana Varona.
Declaration of Conflicting Interests
The authors declared no potential conflicts of interest with respect to the research, authorship, and/or publication of this article.
Funding
The authors received no financial support for the research, authorship, and/or publication of this article.
Data Availability Statement
An anonymized version of the data analyzed for this study and the statistical code to replicate the analyses are available at the Digital Repository at the University of Maryland, doi:10.13016/ M25X25H02.