






Abstract
School funding has become more economically progressive but remains unequal by race/ethnicity. As desegregation efforts decline, school finance reforms (SFRs) are increasingly important for addressing racial/ethnic funding disparities, but their implications are unclear. We build on existing work by estimating SFR effects on funding by income, race, and ethnicity, extending analysis through 2022, using recently developed difference-in-differences models to address variation in SFR timing, and examining additional and recent SFRs. We find that SFRs increased funding equality by income but at best had only modest benefits for equality by race/ethnicity. SFRs were more effective at reducing racial funding inequality in states with low initial inequality and low race-by-income segregation. Results highlight limitations of class-based state reforms to address racial/ethnic disparities.
Introduction
School funding became more economically progressive over the last 5 decades, but it remains unequal by race and ethnicity, due largely to between-state differences in funding and demographics as well as within-state distribution of funding (Lee et al., 2022). Districts with high shares of Black and Hispanic students currently receive 16% (about $2,700) less state and local funds per pupil than districts with low shares of Black and Hispanic students (Morgan, 2022, p. 5). This racial gap in state and local funding is larger than the gap between districts with high versus low shares of students in poverty (5%, or about $800 per pupil), and it has increased from 13% (about $1,800) per pupil in 2018 (Morgan, 2022, p. 7; Morgan & Amerikaner, 2018).
Racial inequality in school funding is substantially driven by the coupling of unequal district funding with between-district racial segregation, which remains high in much of the United States (Darling-Hammond, 2013; Owens, 2020; Sosina & Weathers, 2019; Welner & Carter, 2013). Policy remedies to address between-district segregation have been limited for decades, and desegregation policy at all levels has receded (Fiel & Zhang, 2019; Orfield & Lee, 2007). This leaves efforts to reduce district-level funding disparities, despite racial segregation, as a key tool for policy makers to address racial funding inequality.
Progressive school finance reforms (SFRs) are common. Many states have loosened the link between school funding and district property tax revenue and directed more funds to high-need districts (Corcoran & Evans, 2015; Picus et al., 2015). On average, these SFRs have increased equality of state funding across districts by income (Shores et al., 2022) and increased state revenue slightly more in districts with higher proportions of Black and Hispanic students (Rothbart, 2020). However, because the distribution of local revenue can offset progressive state or federal funding changes (Baicker & Gordon, 2006; Boustan et al., 2013; Condron & Roscigno, 2003; Gordon, 2004; Rothbart, 2020), the implications of SFRs for overall racial/ethnic funding equality are unclear. These implications are further complicated by the ways state demographic and economic changes influence school finance policy (Oberfield & Baker, 2022). For example, states with greater racial and economic diversity are less likely to have progressive school funding formulas, perhaps reflecting the politics of redistribution, which can widen racial funding gaps (Alvord & Rauscher, 2021; Oberfield & Baker, 2022). Furthermore, there is heterogeneity in the nature of SFRs, and research tends to focus on state supreme court decisions (Jackson et al., 2016; Shores et al., 2022), despite evidence showing the importance of legislative changes and other events (Candelaria et al., 2022; Shores et al., 2022). Hence, how SFRs affect racial funding disparities depends on how policies of variable progressivity are (or are not) implemented in states with variable racial and ethnic composition.
How have recent SFRs influenced inequality of school funding by race/ethnicity? First, we replicate Lafortune, Rothstein, and Schanzenbach (LRS, 2018) to estimate SFR effects on spending by district income from 1990 to 2012. Second, we use the same approach to estimate effects on spending by district racial and ethnic composition in the same time period. Third, we extend the time period to examine SFR effects on spending by district income and racial/ethnic composition from 1990 to 2022. Fourth, we use recently developed difference-in-differences (DID) models that address methodological challenges due to variation in treatment timing to estimate SFR effects on spending by income and racial/ethnic composition in both time periods. Fifth, we expand the definition of SFRs to identify the most economically progressive SFR event in each state between 1990 and 2017 and estimate their effects on spending by district income and racial/ethnic composition.
This approach establishes an upper-bound estimate for the effects of recent SFRs on racial equality of funding. To understand how these policies fit in the broader landscape of racial funding inequality, we also probe whether SFR effects on racial funding disparities vary across states depending on their pre-existing racial funding disparities and racial-economic segregation and whether effects vary by the type of SFR (court-ordered or legislative). To preview our results, we find at best only modest benefits and in some cases negative effects of economically progressive SFRs for racial/ethnic funding equality, highlighting the limitations of class-based reforms to address racial educational disparities.
Theoretical and Empirical Background
School Funding
School funding has significant benefits for student achievement, educational attainment, and adult earnings (Candelaria & Shores, 2019; Cellini et al., 2010; Jackson et al., 2016; Lafortune et al., 2018; Rauscher, 2020). Debates remain about mechanisms, but evidence suggests that school funding achieves these benefits by reducing student-teacher ratios and class sizes, boosting teacher salaries and quality, and lengthening the school year (Chetty et al., 2014; Fredriksson et al., 2013; Jackson et al., 2016). School funding has historically been unequal by income and race, due largely to segregation and reliance on local property tax revenue (Cascio & Reber, 2013; Corcoran & Evans, 2015; Timar & Roza, 2010; Walters, 2001), and funding levels and disparities shape inequality of student outcomes (Raudenbush & Eschmann, 2015). For example, Jackson et al. (2016, p. 193) find that a 10% increase in school spending across all 12 years of school increased the likelihood of high school graduation by about 10 percentage points for low-income students compared to about 2 points for high-income students. In short, unequal funding contributes to unequal student achievement and attainment, and more progressive funding can reduce these disparities (Biddle & Berliner, 2002; Condron & Roscigno, 2003; Condron et al., 2013; Johnson, 2011; Rauscher, 2020; Rauscher & Shen, 2022; Reber, 2010; Sosina & Weathers, 2019; Weathers & Sosina, 2022).
School Finance Reforms
SFRs address unequal school funding by increasing state revenue for districts with low property values or high proportions of students in poverty (Corcoran & Evans, 2015; Duncombe & Yinger, 1998; Picus et al., 2015). Contemporary state funding formulae incorporate district variation in revenue potential (e.g., property tax base) and costs (e.g., enrollment; low-income, special education, or English language learner students) to determine how to allocate resources across school districts (Berne & Stiefel, 1999; National Research Council, 1999). SFRs improve equity largely by revising these formulae. SFRs vary in their goals and effectiveness, with some aiming to increase funding equity, funding adequacy, or funds for particular districts or groups of students (Corcoran & Evans, 2015; Verstegen, 1998). Despite substantial heterogeneity, SFRs have generally increased equality of funding by district residents’ income levels (Candelaria & Shores, 2019; Candelaria et al., 2022; Card & Payne, 2002; Corcoran & Evans, 2015; Jackson et al., 2016; Lafortune et al., 2018; Murray et al., 1998; Shores et al., 2022). For example, districts in the top income quintile spent about $1,000 per pupil more than the lowest-income districts in 1990 but now spend about the same or even slightly less than low-income districts (Bischoff & Owens, 2019; Lafortune et al., 2018).
These reforms have been fairly common. Jackson et al. (2016) report that in over half the states in the United States, state courts ruled their school finance systems unconstitutional between 1971 and 2010, and several others passed legislative reforms that made funding more progressive. Scholars often distinguish two phases (Corcoran & Evans, 2015; Murray et al., 1998): equity-based reforms from the 1970s and 1980s aimed to decouple local property wealth and school funding and redistribute resources; adequacy-based reforms since 1990 have aimed to lift the floor on spending to ensure sufficient opportunities for the neediest students, implying equity implications for both phases. Most states have faced adequacy-based lawsuits since 1990, with plaintiffs winning about half the time (Condron, 2017). We focus on these post-1990 adequacy reforms to learn how recent reforms have mattered for racial inequality in funding.
SFRs and Inequality of School Funding by Race/Ethnicity
Evidence is clear that SFRs have increased equality of funding by income (Shores et al., 2022), but less is known about their effects on funding equality by race/ethnicity. The potential implications of progressive SFRs for racial inequality of funding depend on demographic distribution, political processes, and adaptive responses.
Demographic Distribution
Whether SFRs reduce racial funding disparities depends partly on the specifics of how the policies redistribute funding and partly on how students are already distributed across districts. Because racial funding disparities are driven by the uneven distribution of state and local revenue alongside persistent between-district segregation, and because SFRs typically redistribute these revenue sources more evenly across districts, SFRs seem suited to reduce racial funding inequality. But race and class are not always tightly correlated. Substantial economic inequality and income segregation occur among people of the same race (Reardon & Bischoff, 2011), and evidence indicates that income-based school desegregation would do little to reduce racial segregation (Reardon et al., 2006). Class-based SFRs can only mitigate racial funding inequality to the extent that districts are segregated with respect to class and race, and that these segregation patterns overlap. Slippage in these patterns may help explain why SFRs’ ability to reduce income-based achievement disparities did not carry over to racial achievement gaps (Lafortune et al., 2018).
Political Processes
The design, implementation, and impact of SFRs are contingent on many political factors. The fact that SFRs are ostensibly race neutral may make them more politically palatable than race-based policies, which often generate animosity and “whitelash” (Smith, 2020). Affirmative action for low-income students, for example, is currently more politically palatable than race-based affirmative action. This was illustrated in media discussions of the recent Students for Fair Admissions Inc. v. President & Fellows of Harvard College (2023) Supreme Court decision (Kahlenberg, 2023; Saul, 2023). Hence, SFRs may be able to avoid some of the political conflicts that undermine race-based policies, enabling long-term progress.
But SFRs require policy makers to reallocate scarce resources in ways that can appear to create new “winners and losers,” and they are highly attentive to the potential political conflicts that might result from even subtle changes in funding formulas (Malen et al., 2015). Progressive reforms often include concessions such as hold harmless clauses for political feasibility, which can limit their potential equalizing effects (Liu, 2024). Even if apparently progressive SFRs seem race neutral on their face, policy makers may not behave as if they are. Relative to more conservative state governments, more liberal ones have been shown to provide more state educational funding overall and to allocate relatively more of it to districts with large shares of minority students (Favero & Kagalwala, 2024; Hill & Jones, 2017). Yet both liberal and conservative state governments provide more state funding to higher-poverty than lower-poverty districts (Favero & Kagalwala, 2024). Hence, politics may shape the subtleties of SFRs in ways that decouple economic and racial progressivity.
Strategic Adaptation
Other scholars suggest that race-neutral policies have little potential to increase racial equality due to systemic racism and adaptive responses (Bell, 2008; Jones & Nichols, 2020; Maye, 2022). High-resource or high-status actors may adapt strategically to policy changes, undermining seemingly progressive efforts (Alon, 2009). In one example, removing questions about criminal records from employment applications increased, rather than decreased, racial inequality in hiring and callback rates (Agan & Starr, 2018; Doleac & Hansen, 2020). In another, White enrollments shifted toward predominantly minority schools after automatic admissions policies increased college-going opportunities at those schools (Fiel, 2022). Adaptive behavior has also undermined race-conscious policies, as when school integration efforts were countered by within-school sorting via tracking and manipulation of disability categories (Lucas, 2001; Saatcioglu & Skrtic, 2019).
Adaptive behavior may follow class-based SFRs as well. Chakrabarti and Roy (2015) found evidence that a Michigan SFR decoupling property taxes from school district funding altered class-based residential sorting across districts; this reform may have done more to reduce funding disparities if residential patterns did not change. Brunner et al. (2012) also find changes to residential sorting after a school choice program. If White families have more resources or face fewer barriers in choosing schools or neighborhoods, they may respond to SFRs by sorting in ways that offset a more equitable redistribution of funding across districts.
This discussion outlines the complex set of factors that can influence the potential impact of SFRs. Given this complexity, it remains unclear how class-based SFRs impact the racial inequality of school funding. We examine whether SFRs reduce, increase, or have no effect on the racial inequality of school funding. By focusing on the SFRs in each state that were most economically progressive, we provide an upper-bound estimate on the potential of class-based SFRs to reduce racial inequality.
Heterogeneity of SFR Impacts
These same factors could also create variation in the impact of SFRs on racial funding disparities. From the demographic perspective, states vary in their degree of racial and economic segregation, in their school funding systems, and in the reforms they have implemented over the past half-century. SFRs may be most effective at reducing racial funding disparities in states with the largest pre-existing racial funding gaps and in states with high race-by-income segregation, where race and district economic resources are tightly coupled (e.g., segregation that produces racial differences in school poverty; Reardon et al., 2024). If SFRs target low-income districts and those districts have high shares of Black and Hispanic students, then SFRs that increase equality of funding by income should also increase equality by race/ethnicity. Growing evidence shows that school funding has larger effects for students and districts with fewer initial resources and more room for improvement (Jackson et al., 2016; Rauscher, 2020; Rauscher & Shen, 2022). Based on this evidence, we expect that states with high race-by-income segregation and with the most room for growth (with larger initial racial funding inequality) will experience larger effects of SFRs.
From the political and adaptation perspectives, SFRs may be least effective in states with high race-by-income segregation and with the largest pre-existing racial funding gaps if the processes that created and sustained racial disparities in the past persist. Recently, scholars have documented variation in systemic racism across states, with long-term implications for people’s health and well-being (Brown et al., 2022; Chantarat et al., 2022; Homan & Brown, 2022). This could entail political processes that block racially progressive reforms, or adaptive responses that undermine them.
Effects may also differ by the type of SFR. Court-ordered SFRs may be less sensitive to electoral politics, and thus have more ability to effect change. Court-ordered SFRs can supersede legislation, often spurring legislative action, and can stem from legislative inaction or unequal legislative policy around school funding. We therefore expect that court-ordered SFRs are more effective at reducing racial inequities than legislative SFRs.
Contributions
Existing research rarely examines the effects of class-based SFRs on racial funding equality, with two valuable exceptions. Following state SFRs between 1990 and 2002, Sims (2011) finds that total revenue increased more in districts with a higher proportion of low-income students but not in districts with a higher proportion of non-White students. Rothbart (2020) finds that SFRs between 1996 and 2011 increased state revenue slightly more in districts with higher proportions of Black, Hispanic, and American Indian students, but those increases were partially offset by reductions in local revenue.
We build on these studies in several ways. First, we replicate and then expand on existing research to examine a longer time period and apply recently developed DID methods that avoid biased estimates due to variation in effects over time. These contributions are important for understanding SFR effects because there may be delays in implementation or enforcement that cause delayed effects and because SFR effects may vary over time due to differences in implementation, demographic or political context, or strategic adaptation. Second, we examine White–Hispanic inequality in school funding. This contribution is important because of the growing share of school-age children who are Hispanic (26% in 2020, up 3 percentage points from 2010; Pena et al., 2023) and because Hispanic students receive less funding per pupil than Black students, on average.
Third, we provide an upper-bound estimate for SFR effects on racial inequality of funding by following and extending LRS (2018) and examining relatively strong SFRs. Existing research often includes relatively weak SFR events. A court order to overhaul a funding formula, for example, could meet resistance from state legislatures or be weakened by being underfunded. The relatively weak effects of SFRs on racial disparities identified in past work could reflect the inclusion of SFR events that had little effect on economic disparities. We address this limitation by developing an inclusive database of SFRs from 1990 to 2017, identifying the most economically progressive SFR event in each state, and estimating their effects on state-level racial disparities in K–12 funding. By examining the effects of strong SFR events, we provide an upper-bound estimate of whether class-based SFRs will reduce racial funding disparities.
Contributing to literature on systemic racial inequality (Brown et al., 2022; Chantarat et al., 2022; Homan & Brown, 2022), this study tests whether some of the most popular class-based reforms in contemporary educational policy improve racial equality of K–12 funding. This is important in part because evidence shows that increasing equality of funding can improve equality of educational opportunities (Johnson, 2011), and in part as a test case for the potential of race-neutral reforms to address racial disparities in education. We also examine whether class-based SFRs have different effects on racial inequality depending on the type of SFR, race-economic segregation, and previous racial inequality of K–12 funding. This speaks to the potential reasons SFRs may or may not reduce racial inequality and how they could be better leveraged to do so.
Methods
To estimate SFR effects on racial/ethnic funding equality, we begin by replicating analyses by LRS (2018) that estimate SFR effects on spending by district income from 1990 to 2012. We use their same SFR events and the same approach to estimate effects on spending by district racial and ethnic composition in the same time period, then extend their analyses to estimate effects on spending by district income and racial/ethnic composition over a longer time period (1990–2022). We also build on their work by applying recently developed DID models for these analyses. These models address variation in the timing of SFR events while avoiding problematic comparisons that can introduce bias in conventional two-way fixed effects (TWFE) models (Callaway & Sant’Anna, 2021; Sant’Anna & Zhao, 2020). DID applications are rapidly adopting these new approaches. To give just a few examples, applications include studies of the effects of Facebook on student mental health (Braghieri et al., 2022), school masking requirements on the spread of Covid-19 (Cowger et al., 2022), and exposure to police violence on educational outcomes (Ang, 2021). Results often differ from the traditional TWFE approach (A. C. Baker, Larcker & Wang, 2022; Wood et al., 2020). To our knowledge, research on the effects of SFRs has not yet incorporated these methods.
Finally, we expand the definition of SFRs to identify the most economically progressive SFR event in each state between 1990 and 2017 and estimate their effects on spending by district income and racial/ethnic composition. To include additional SFRs, we first identify potential SFR events in each state from 1990 to 2017. We then identify the most economically progressive SFRs in each state: the SFRs from 1990 to 2017 that most increased the relationship between district child poverty and current spending per pupil or state spending per pupil. In some states, these SFRs may be the same. In states where they differ, we use the earlier SFR. Next, we estimate the effects of these economically progressive SFRs on spending by income and racial/ethnic composition. Finally, we examine heterogeneous effects by state characteristics and by type of SFR.
Data
Our data include the LRS database of SFR events, district finance data, district demographic characteristics, including racial and ethnic composition, 1990 Census data on district mean household income, and district child poverty rate from the Census Small Area Income and Poverty Estimates (SAIPE) data. We also develop an expanded database of potential SFR events to examine effects of alternative reforms, including more recent SFR events.
District Funding and Composition
We use the National Center for Education Statistics (NCES) ID number to link school districts to Public Elementary–Secondary Education Finance Data from 1990 and 1992–2022 to the Census Finance Survey (F-33; unavailable for 1991). F-33 data include annual revenue, expenditure, and enrollment information for each school district. LRS uses the NCES version of school funding data. We use the Census F-33 data because they release annual data earlier and in a consistent format. We follow guidance from the EdFund Data Dictionary (https://data-dictionary.ed-fund.org/) to adjust state and local revenues from 2021 and 2022 to match the NCES version (this affects only five states). Using the Census F-33 data creates very small differences between our estimates and those of LRS. Annual district-level student racial and ethnic composition is from the NCES Common Core of Data (CCD), 1990–2022.
Income
We assess SFR progressivity based on the association between district funding and district mean household income or child poverty in each state and year. We use district-level household income data from the 1990 Census to replicate LRS analyses. To develop our extended set of economically progressive SFRs, we use annual district-level child poverty rates from the Census SAIPE program for years 1995–2022. These data are appealing because they are available annually from the same source for consistency over time, except for 1996, which we impute using the average of the two adjacent years (1995 and 1997). All currency measures are adjusted for inflation to 2013 dollars (for consistency with LRS estimates) using consumer price index (CPI) data.
State Characteristics
To examine effect heterogeneity by state characteristics, we use CCD and F-33 data to measure state-level racial funding gaps in 1994, which is the year with the largest number of districts and the year LRS uses to create measures. We also use CCD data to calculate between-district race-by-income segregation, based on the state-specific correlation between the proportion of Black or Hispanic students and the proportion of students eligible for free or reduced-price lunch (FRL). States with a higher correlation between students who are Black or Hispanic and eligible for FRL have higher race-by-income segregation. We identify states above and below the national median for racial funding gaps and race-by-income segregation in 1994.
Measures
Funding
Our key dependent variables are income and racial disparities in state-level per pupil revenue and spending in each year 1990 and 1992–2022. We follow LRS and calculate funding and spending measures separately by income quintile based on the 1990 mean household income using district F-33 funding data. We also calculate funding and spending measures separately by racial/ethnic composition quintile in 1994. All funding measures are adjusted for inflation to 2013 dollars using monthly CPI data, for consistency with LRS. We use the same funding measures as LRS, including per pupil total revenue, state revenue, local revenue, federal revenue, total expenditures, current spending (including operational spending on elementary/secondary education, but excluding spending on capital outlays, debt service, and non-elementary/secondary programs), mean teacher salary, student–teacher ratio, and spending on teacher salaries and benefits, student support, capital, non-instructional expenses, and other spending. To measure inequality of funding, we calculate annual state-level quintile gaps in funding as the mean funding value for quintile 1 minus quintile 5. For income gaps, a positive value indicates that low-income districts receive more funding than high-income districts (economically progressive funding). For racial/ethnic gaps, a positive value indicates that low-Black/Hispanic districts receive more funding than high-Black/Hispanic districts (racially regressive funding).
Replication SFR Events
We use the same SFR events as LRS to replicate their analyses, to estimate comparable effects on spending by racial/ethnic composition, and to examine effects on spending through 2022. In the DID models that address variation in treatment timing, we make one minor change to meet the model requirement of observing at least one pre-treatment year: we change the event year to 1992 for the four SFR events that occurred in 1991. Sensitivity analyses excluding these observations yield substantively similar results.
Expanded SFR Events
We also examine effects using an expanded definition of SFRs that includes the most economically progressive SFR event in each state between 1990 and 2017. We begin by creating a list of potential SFR events, 1990–2017. We identify potential SFRs by drawing from Jackson et al. (2016), Lafortune et al. (2018), Rauscher and Shen (2022), Rebell (2009, 2017, 2019), B. D. Baker et al. (2021), and Biasi (2023). We added to this list using the EdBuild (2024) database, which includes information about school funding policies in each state. Prior studies have used a variety of approaches, some focusing on the first court decision in which a funding system was ruled unconstitutional, and others including state statutes that changed funding formulae. There is substantial complexity in deciding which SFRs to include or exclude, given the many ways funding reforms can be sparked or thwarted, including the threat of litigation, actual litigation, legislative changes, battles between courts and legislatures, voter referenda, and macroeconomic change.
We take an inclusive approach. As potential SFRs, we include all lawsuits, court decisions, settlements, voter referenda, and legislation that could have led to progressive school funding changes. We include judicial decisions that ruled state funding systems unconstitutional, or that ordered states to increase funding levels or make funding more equitable across districts, as well as legal settlements that purported to increase funding levels or equity. We also include any state bills or referenda that were passed and aimed to achieve adequate funding levels, make funding formulae more equitable, or supplement funding in high-need or low-income districts.
We identified 116 state-years with potential SFRs across 40 states between 1990 and 2017 (some state-years include multiple events, which we do not differentiate). These include 47 court decisions, 2 referenda, 57 statutes, and 10 instances with both court decisions and statutes. Below, we describe how we identify these progressive SFRs, which then serve as our treatment variable when examining effects of the expanded SFRs.
Identifying Expanded Progressive SFR Events
To identify additional progressive SFRs, we follow LRS and conduct analyses to detect SFR events that increased the economic progressivity of funding across districts within states (racial disparities do not factor into this stage of the analyses). For each state and year, we regress log-transformed district per-pupil current spending and per-pupil state revenue on district child poverty rates. We use child poverty rates rather than mean income because it is less sensitive to extreme income values, measures the share of students with high service needs who are likely to attend the public school district, and captures changes in district economic composition over time. These regressions are weighted by student enrollment and control for whether the district serves elementary grades, secondary grades, or both. A more positive child poverty coefficient indicates that higher-poverty districts spend more per pupil, which indicates more progressivity.
We save these state-year slope estimates as our progressivity measures and merge them with the list of potential SFR events. We then estimate time-series regressions for each state and each potential SFR event to assess whether the event increased funding progressivity (Lafortune et al., 2018). Regressions include a post-SFR dummy variable and a linear year term; we include data from all years before the potential SFR event and up to 5 years after. An increase in progressivity means an increase in the district child poverty slope coefficient (here treated as the outcome variable) from the prior current spending regression. Of the SFR events with progressive effects, we focus on the event in each state that has the most progressive effect on either current spending or state revenue in our timespan. If these SFR events are different in a state, we select the earlier of these two progressive events in each state. Hence, our treatment variable in these analyses is the implementation of each state’s earlier SFR that most increased overall funding progressivity (if any), specifically with respect to how per-pupil current spending or state funding was associated with district child poverty.
Analyses
We estimate the effect of SFRs on state-level income and racial/ethnic funding inequality using both TWFE models and DID models that address staggered treatment timing (“csdid” package in Stata; Callaway & Sant’Anna, 2021; Sant’Anna & Zhao, 2020). State-years are our unit of observation in all analyses.
TWFE models have been a familiar workhorse for DID estimation, so we use them as a benchmark. In Equation 1, we predict funding inequality in state (i) and year (t) with indicators for treatment (whether an SFR has occurred in state i by time t), with state and year fixed effects to account for general between-state differences and temporal changes in funding inequality. Robust standard errors are adjusted for state-level clustering:

If
Variation in treatment timing can bias TWFE estimates because these regressions compare newly treated observations with both not-yet-treated observations and already-treated observations for whom the SFR occurred earlier (Roth et al., 2023). Bias occurs when treatment effects vary over time or over observations (de Chaisemartin & D’Haultfoeuille, 2020; Goodman-Bacon, 2021), both of which are possible for SFRs. If SFR effects grow in magnitude over time, then TWFE estimates will likely be attenuated, as states treated earlier but being increasingly impacted are used as a comparison for states that were just treated.
Recently developed DID estimation strategies avoid this bias and account for variation in treatment timing by using never-treated cases and optionally not-yet-treated cases, but never using already-treated cases as controls (CSDID; Callaway & Sant’Anna, 2021; Sant’Anna & Zhao, 2020). This approach divides the data into treatment cohorts based on the year SFRs occurred, decomposes the analysis of each cohort into every possible two-by-two DID comparison in the data (e.g., treatment-control differences across 2 years), estimates the treatment effect for each component, and aggregates these estimates to calculate average treatment effects. For example, our application of CSDID (a) estimates the effect of SFRs that occurred in 1995 on 1996 funding outcomes in a standard DID, comparing post-treatment funding changes (since the pre-treatment year, 1994) among states that did and did not experience an SFR in 1995; (b) repeats step 1 for that same cohort’s outcomes in every subsequent post-treatment year; (c) repeats steps 1 to 2 for every treatment cohort; and (d) averages estimates across years within cohorts and then across cohorts.
This approach accommodates heterogeneous effects by treatment timing and makes clear which state-years are the control group (never-treated and optionally not-yet-treated; Roth et al., 2023). Never-treated states here are those that did not have a progressive SFR in the time period examined. We estimate average treatment on the treated (ATT) estimates using the CSDID regression procedure, using never-treated states as comparison cases. Sensitivity analyses use both never- and not-yet-treated states as comparison cases and yield very similar estimates. Our standard errors are adjusted for clustering within states and robust to heteroskedasticity.
Like other DID models, this approach still assumes parallel trends and no treatment anticipation (Roth et al., 2023). To test this assumption and examine potential time-varying treatment effects, we also estimate duration-specific effects (i.e., SFR effects 1 year after treatment, and 2 years after treatment), including pre-treatment years. Post-treatment effects are always estimated relative to the year preceding the SFR; we also estimate each pre-treatment effect relative to the year preceding the SFR (using the long2 option in Stata CSDID; Callaway & Sant’Anna, 2021; Sant’Anna & Zhao, 2020). Absence of significant pre-treatment differences is consistent with the assumption of parallel trends and no anticipation of treatment.
Heterogeneous Effects
To examine variation in SFR effects by state characteristics measured early in our observation period, we fit models separately for states above or below the 1994 median values of economic and racial funding inequality. We also fit models separately for states above or below the 1994 median value of race-by-income segregation (the share of Black or Hispanic students in the lowest income quintile districts). We test for significant differences between SFR coefficients from these separate models using z-tests (Clogg et al., 1995). For example, to test for different SFR effects by initial racial inequality, we calculate z statistics
Results
Summary Statistics
Figure 1 shows mean total revenue per pupil for districts in income quintiles 1 and 5 from 1990 to 2022. Quintile 1 incomes start below quintile 5 in 1990, after which they converge around 2000 and remain similar until 2022, when revenue in quintile 1 surpasses quintile 5, possibly because of federal COVID relief funds. Supplemental Appendix Figures A1 and A2 (available in the online version of this article) show total revenue per pupil for districts in quintiles 1 and 5 for the proportion of Black and Hispanic students. Revenue by share of Black students is very similar, except in 1990 and during the COVID pandemic, when districts with a high share of Black students had higher revenue. Revenue by share of Hispanic students is also similar until about 2003, when districts with a high proportion of Hispanic students begin to receive lower revenue than districts with a low share of Hispanic students. Supplemental Appendix Table A1 (available in the online version of this article) shows descriptive statistics for the full district-year dataset from 1990 to 2022, including mean spending and revenue in the top and bottom quintiles by income, percent Black, and percent Hispanic. Total revenue and spending are higher in districts with higher income and higher percent Black and Hispanic. These within-state differences do not match national comparisons, which find that districts with high shares of Black and Hispanic students receive lower state and local funds per pupil than districts with low shares of Black and Hispanic students (Morgan, 2022; Morgan & Amerikaner, 2018). Thus, much of the racial inequality of funding is between rather than within states.

Mean revenue per pupil for districts in the highest and lowest income quintiles.
TWFE Estimates: Replicating and Expanding
DID analyses assess what changes we can attribute to SFRs. Table 1 shows estimates replicating LRS analyses by income quintile (columns 1–4), in comparison with estimates by quintiles of percent Black and Hispanic students (columns 5–10). This includes two specifications: one including only a post-SFR treatment coefficient, and one including a post-SFR effect as well as a post-SFR shift in a linear trend. Our estimates are very similar to those of LRS. For example, our estimated effect of SFRs on mean state revenue/pupil is $892, compared to $912 in LRS. Our post-SFR estimates predicting state revenue for income quintiles 1 and 5 are $1,135 and $548, respectively, compared to $1,225 and $527 in LRS. These small differences are likely due to using F-33 Census data rather than NCES data. We find significant increases in the Q1–Q5 gap in revenue after the SFRs, consistent with LRS.
Estimated Effects of School Finance Reforms on Mean Funding by Income and Race/Ethnicity Quintiles

Note. State-year observations 1990–2012. Table shows TWFE estimates predicting mean state or total revenue/pupil in 2013 dollars. The three parameter models include a time trend (linear measure of years) and interaction between Post Event and the time trend. Column 1 predicts state mean revenue for all districts. Columns 2 and 3 predict means in the bottom and top quintiles based on district mean household income. Column 4 predicts the difference between Q1 to Q5. Columns 5–6 and 8–9 predict means in the bottom and top quintiles based on district percent Black or Hispanic students. Columns 7 and 10 predict the Q1–Q5 differences by percent Black and Hispanic students. A positive estimate predicting Q1 to Q5 Difference indicates more funding for districts with low income or low % Black/Hispanic students. Robust standard errors adjusted for state-level clustering in parentheses. TWFE = two-way fixed effects.
p < .10. **p < .05. ***p < .01.
Similar to effects by income, we find larger SFR effects on state and total revenue in districts with a low share of Black and Hispanic students. For example, SFRs increase state revenue per pupil by $1,070 in the lowest quintile of percent Black students, compared to $813 in the top quintile. This results in an increase of $258 in the quintile gap by percent Black students. However, this estimate is not statistically significant at the 95% level. Estimates predicting revenue by share of Hispanic students show a similar pattern. These results suggest that SFRs increase revenue more in districts with a low share of Black and Hispanic students. Post-SFR changes in the gaps between districts in the bottom and top quintiles by race and ethnicity are positive, but not statistically significant. Thus, SFRs increased the progressivity of funding by income, but not by race or ethnicity.
The remainder of our analyses include a single post-SFR effect. Table 2 shows TWFE estimates of SFR effects on revenue and spending measures by income and by race/ethnicity. The first four columns replicate LRS analyses, and our estimates are very similar. For example, we estimate that SFRs increase per pupil total, state, and federal revenue by $720, $892, and $47, respectively, compared to estimates of $829, $912, and $63 in LRS. Our estimates predicting revenue and spending in the lowest income quintile and Q1 to Q5 gaps are also consistent with LRS.
Estimated Effect of School Finance Reforms on Mean Revenue and Spending by Income and Race/Ethnicity Quintiles, 1990 to 2012

Note. State-year observations 1990–2012. Table shows TWFE estimates predicting mean revenue or spending per pupil in 2013 dollars. Column 1 shows the mean of the dependent variable. Column 2 shows estimates predicting the mean value for all districts. Columns 3 and 4 predict the mean in the bottom household income quintile and the difference between quintiles 1 and 5 by income (Q1–Q5 inc). Columns 5 and 7 predict means in the top quintiles based on district percent Black or Hispanic students. Columns 6 and 8 predict the Q1–Q5 differences by percent Black and Hispanic students. Robust standard errors adjusted for state-level clustering in parentheses. TWFE = two-way fixed effects.
p < .05. **p < .01.
The last four columns of Table 2 show estimates predicting mean revenue and spending in districts with high shares of Black and Hispanic students and the Q1–Q5 gaps by percent Black and Hispanic composition. These estimates indicate that SFRs increased revenue and spending less in districts with high Black and Hispanic enrollment compared to the mean district. For example, total spending increased by $701/pupil in high Black districts and by $690/pupil in high Hispanic districts after SFRs, compared to $759 in the average district. Based on estimates predicting quintile gaps, SFRs also increased the most funding and spending measures more in districts with low shares of Black and Hispanic students compared to districts with high shares. Spending on instruction and teacher salaries, and benefits increased slightly more in districts with high compared to low shares of Black and Hispanic students. The student–teacher ratio also changed in favor of districts with high shares of Black and Hispanic students. However, none of the estimates predicting gaps by race/ethnicity are significant at the 95% level.
In Table 3, we repeat the analyses in Table 2 when including an additional 10 years, through 2022. The results by income are very similar to those in Table 2, using a shorter time period. The results by race and ethnicity are generally consistent in the two time periods. However, when predicting the quintile gap in total spending by race, the estimate in the extended time period suggests SFRs slightly reduced racial inequality, reducing the spending advantage of low-Black districts by $19 per pupil in the longer time period, rather than increasing the spending advantage of low-Black compared to high-Black districts by $158 per pupil in the shorter time period. None of the estimates predicting funding gaps by race or ethnicity are significant at the 95% level, which suggests SFRs had no effect on funding gaps by race or ethnicity.
Estimated Effect of School Finance Reforms on Mean Revenue and Spending by Income and Race/Ethnicity Quintiles, 1990–2022

Note. State-year observations 1990–2022. Table shows TWFE estimates predicting mean revenue/spending per pupil in 2013 dollars. Column 1 shows the dependent variable mean. Column 2 shows estimates predicting the mean. Columns 3 and 4 predict the mean in the bottom household income quintile and the difference between quintiles 1 and 5 by income (Q1–Q5 inc). Columns 5 and 7 predict means in the top quintiles of % Black or Hispanic students. Columns 6 and 8 predict the Q1–Q5 differences by % Black and Hispanic students. Robust standard errors adjusted for state-level clustering in parentheses. TWFE = two-way fixed effects.
p < .05. **p < .01.
DID Estimates Addressing Variation in Treatment Timing
In Table 4, we use DID models that address variation in SFR timing to predict the same dependent variables in the same years (1990–2022) as the TWFE analyses in Table 3. The CSDID estimates are consistent with results of the TWFE models: SFRs increased mean total and state revenue and reduced local revenue and the student-teacher ratio. When accounting for variation in event timing, the CSDID models also indicate that SFRs increased the income progressivity of total spending and current instructional spending. The CSDID estimates are slightly smaller than the TWFE estimates, consistent with attenuation bias in cases where treatment effects vary over time (de Chaisemartin & D’Haultfoeuille, 2020; Goodman-Bacon, 2021). Despite these equalizing effects by income, the estimates indicate no significant change in revenue or spending gaps by race or ethnicity. SFRs increased state revenue and several spending measures in high-Black and high-Hispanic districts, but not more than low-Black or low-Hispanic districts. Thus, both the TWFE and CSDID models indicate that SFRs did not increase the progressivity of spending by race or ethnicity.
Estimated Effect of School Finance Reforms on Mean Revenue and Spending by Income and Race/Ethnicity Quintiles, 1990–2022: Addressing Variation in Reform Timing

Note. State-year observations 1990–2022. Table shows CSDID estimates predicting mean revenue/spending per pupil in 2013 dollars. Columns predict the same outcomes as columns 2–8 in Tables 2 and 3. Robust standard errors adjusted for state-level clustering in parentheses.
p < .10. *p < .05. **p < .01.
Table 5 shows estimates from CSDID models using our expanded definition of SFR events, which includes more recent SFRs and uses a time-varying measure of district child poverty to identify progressive SFRs. The estimates suggest that these progressive SFR events increased progressivity of funding by income even more than the LRS events. For example, the expanded SFRs increased total revenue per pupil by $841 more in the lowest income quintile than in the highest. The equivalent estimate using the LRS SFR events was $439. These expanded SFRs also increased the Q1–Q5 income difference in total spending, non-instructional spending, and student support spending by $1,355, $1,262, and $200, respectively. Using the LRS SFR events, the equivalent estimates are $545, $297, and $151.
Estimated Effect of Expanded School Finance Reforms on Mean Revenue and Spending by Income and Race/Ethnicity Quintiles, 1990–2022: Addressing Variation in Reform Timing

Note. State-year observations 1990–2022. Table shows CSDID estimates predicting mean revenue/spending per pupil in 2013 dollars. Columns predict the same outcomes as columns 2–8 in Tables 2 and 3. Robust standard errors adjusted for state-level clustering in parentheses.
p < .10. *p < .05. **p < .01.
Despite the greater improvements in funding equity by income, these expanded SFRs had regressive effects on racial and ethnic funding. The expanded SFRs increased the funding and spending advantage of districts with low Black and Hispanic enrollment. For example, the expanded SFRs increased total revenue per pupil in the lowest percent Black quintile by $748 more than in the highest percent Black quintile. These SFRs increased the low-Hispanic revenue advantage by $1,111 per pupil. Expanded SFRs also increased racial and ethnic inequality of total spending, non-instructional spending, and student support spending.
Robustness Checks
We replicate our analyses predicting an alternative, slope-based measure of funding inequality. Following LRS, this is a regression estimate of the relationship between funding and income or race/ethnic composition. Rather than measuring inequality between the ends of the distribution, the slope-based measure assesses inequality across the distribution. Supplemental Appendix Tables A2 and A3 (available in the online version of this article) include TWFE estimates predicting funding and spending in quintiles 1 and 5 and the slope-based inequality measure by income, percent Black, and percent Hispanic enrollment. These estimates are consistent with the main analyses and suggest that SFRs increased spending progressivity by income, but not by race/ethnicity.
To assess the parallel trends assumption, we conduct event study estimates relative to the year before the SFR event using CSDID models. Using our expanded definition of SFR events and including data through 2022 (the same SFRs and years as Table 5), Figures 2–4 show SFR effects over time when predicting quintile gaps in total revenue, total spending, and student support spending. Panel A shows gaps by income, Panel B shows gaps by race, and Panel C shows gaps by ethnicity. In most cases, there is limited evidence of pre-election differences. However, Black quintile gaps in total revenue and support spending are significantly lower in SFR states before the event, suggesting greater racial progressivity before the SFR. Total spending is also more progressive by income before the SFR. These estimates suggest the parallel trends assumption is violated in some cases, with SFR states becoming less economically progressive in total spending and less racially progressive in revenue and support spending leading up to the SFR.

Estimated effect of expanded school finance reforms on quintile gaps in total revenue per pupil (2013 dollars). (Panel A) Income quintile gap (Q1–Q5). (Panel B) Percent Black quintile gap (Q1–Q5). (Panel C) Percent Hispanic quintile gap (Q1–Q5).

Estimated effect of expanded school finance reforms on quintile gaps in total spending per pupil (2013 dollars). (Panel A) Income quintile gap (Q1–Q5). (Panel B) Percent Black quintile gap (Q1–Q5). (Panel C) Percent Hispanic quintile gap (Q1–Q5).

Estimated effect of expanded school finance reforms on quintile gaps in student support spending per pupil (2013 dollars). (Panel A) Income quintile gap (Q1–Q5). (Panel B) Percent Black quintile gap (Q1–Q5). (Panel C) Percent Hispanic quintile gap (Q1–Q5).
Heterogeneous Effects
We next examine whether SFR effects on funding inequality differ systematically depending on initial funding inequality and race-by-income segregation. Table 6 shows separate estimates for states with low (Panel A) and high (Panel B) inequality of total revenue in 1994 by income, race, and ethnicity. Estimates suggest SFRs increased progressivity of funding and spending by income in states with both low and high pre-reform inequality, but estimates predicting income gaps rarely differ significantly by initial inequality. When predicting gaps by race, however, most estimates differ significantly between states with high and low initial race gaps in revenue. In states with low racial gaps, SFRs reduced the revenue and spending advantage of low-Black districts. In states with high racial gaps, however, SFRs significantly increased the revenue and spending advantage of low-Black districts over high-Black districts. Thus, SFRs in states with high racial funding inequality amplified that inequality. Estimates rarely differ when predicting gaps by Hispanic enrollment.
Estimated Effect of Expanded School Finance Reforms on Mean Revenue and Spending by Income and Race/Ethnicity Quintiles, 1990–2022: Addressing Variation in Reform Timing—By Initial Quintile Gaps in Total Revenue


Note. State-year observations 1990–2022. Table shows CSDID estimates predicting mean revenue/spending per pupil in 2013 dollars. Columns predict the same outcomes as columns 2–8 in Tables 2 and 3. Robust standard errors adjusted for state-level clustering in parentheses. Shaded cells indicate significant difference between CSDID coefficients for high and low initial quintile gaps, p < .05;
p < .10. *p < .05. **p < .01.
Table 7 shows separate estimates in states with low and high race-by-income segregation. In low-segregation states (Panel A), SFRs increased spending in low-income, high-Black, and high-Hispanic districts and improved funding equality by income. In highly segregated states (Panel B), SFRs had weaker benefits and often reduced revenue and spending in economically, racially, and ethnically marginalized districts. For example, in highly segregated states, SFRs reduced total revenue per pupil by −$792 in high Black districts and by −$826 in high Hispanic districts. In low-segregation states, SFRs increased total revenue per pupil by $1,808 in high Black districts and by $2,157 in high Hispanic districts. These estimates are significantly different, indicating that SFRs have larger benefits for marginalized districts in states with low race-by-income segregation (p < .05). SFRs in low-segregation states improved economic progressivity of funding and spending, but for most measures had no effect on racial or ethnic progressivity, as measured by quintile gaps. SFRs in high-segregation states did not improve economic progressivity and increased the revenue and spending advantage of low-Hispanic districts over high-Hispanic districts. Thus, SFRs in states with high race-by-income segregation amplified the ethnic inequality of funding.
Estimated Effect of Expanded School Finance Reforms on Mean Revenue and Spending by Income and Race/Ethnicity Quintiles, 1990–2022: Addressing Variation in Reform Timing—By Race–Income Segregation

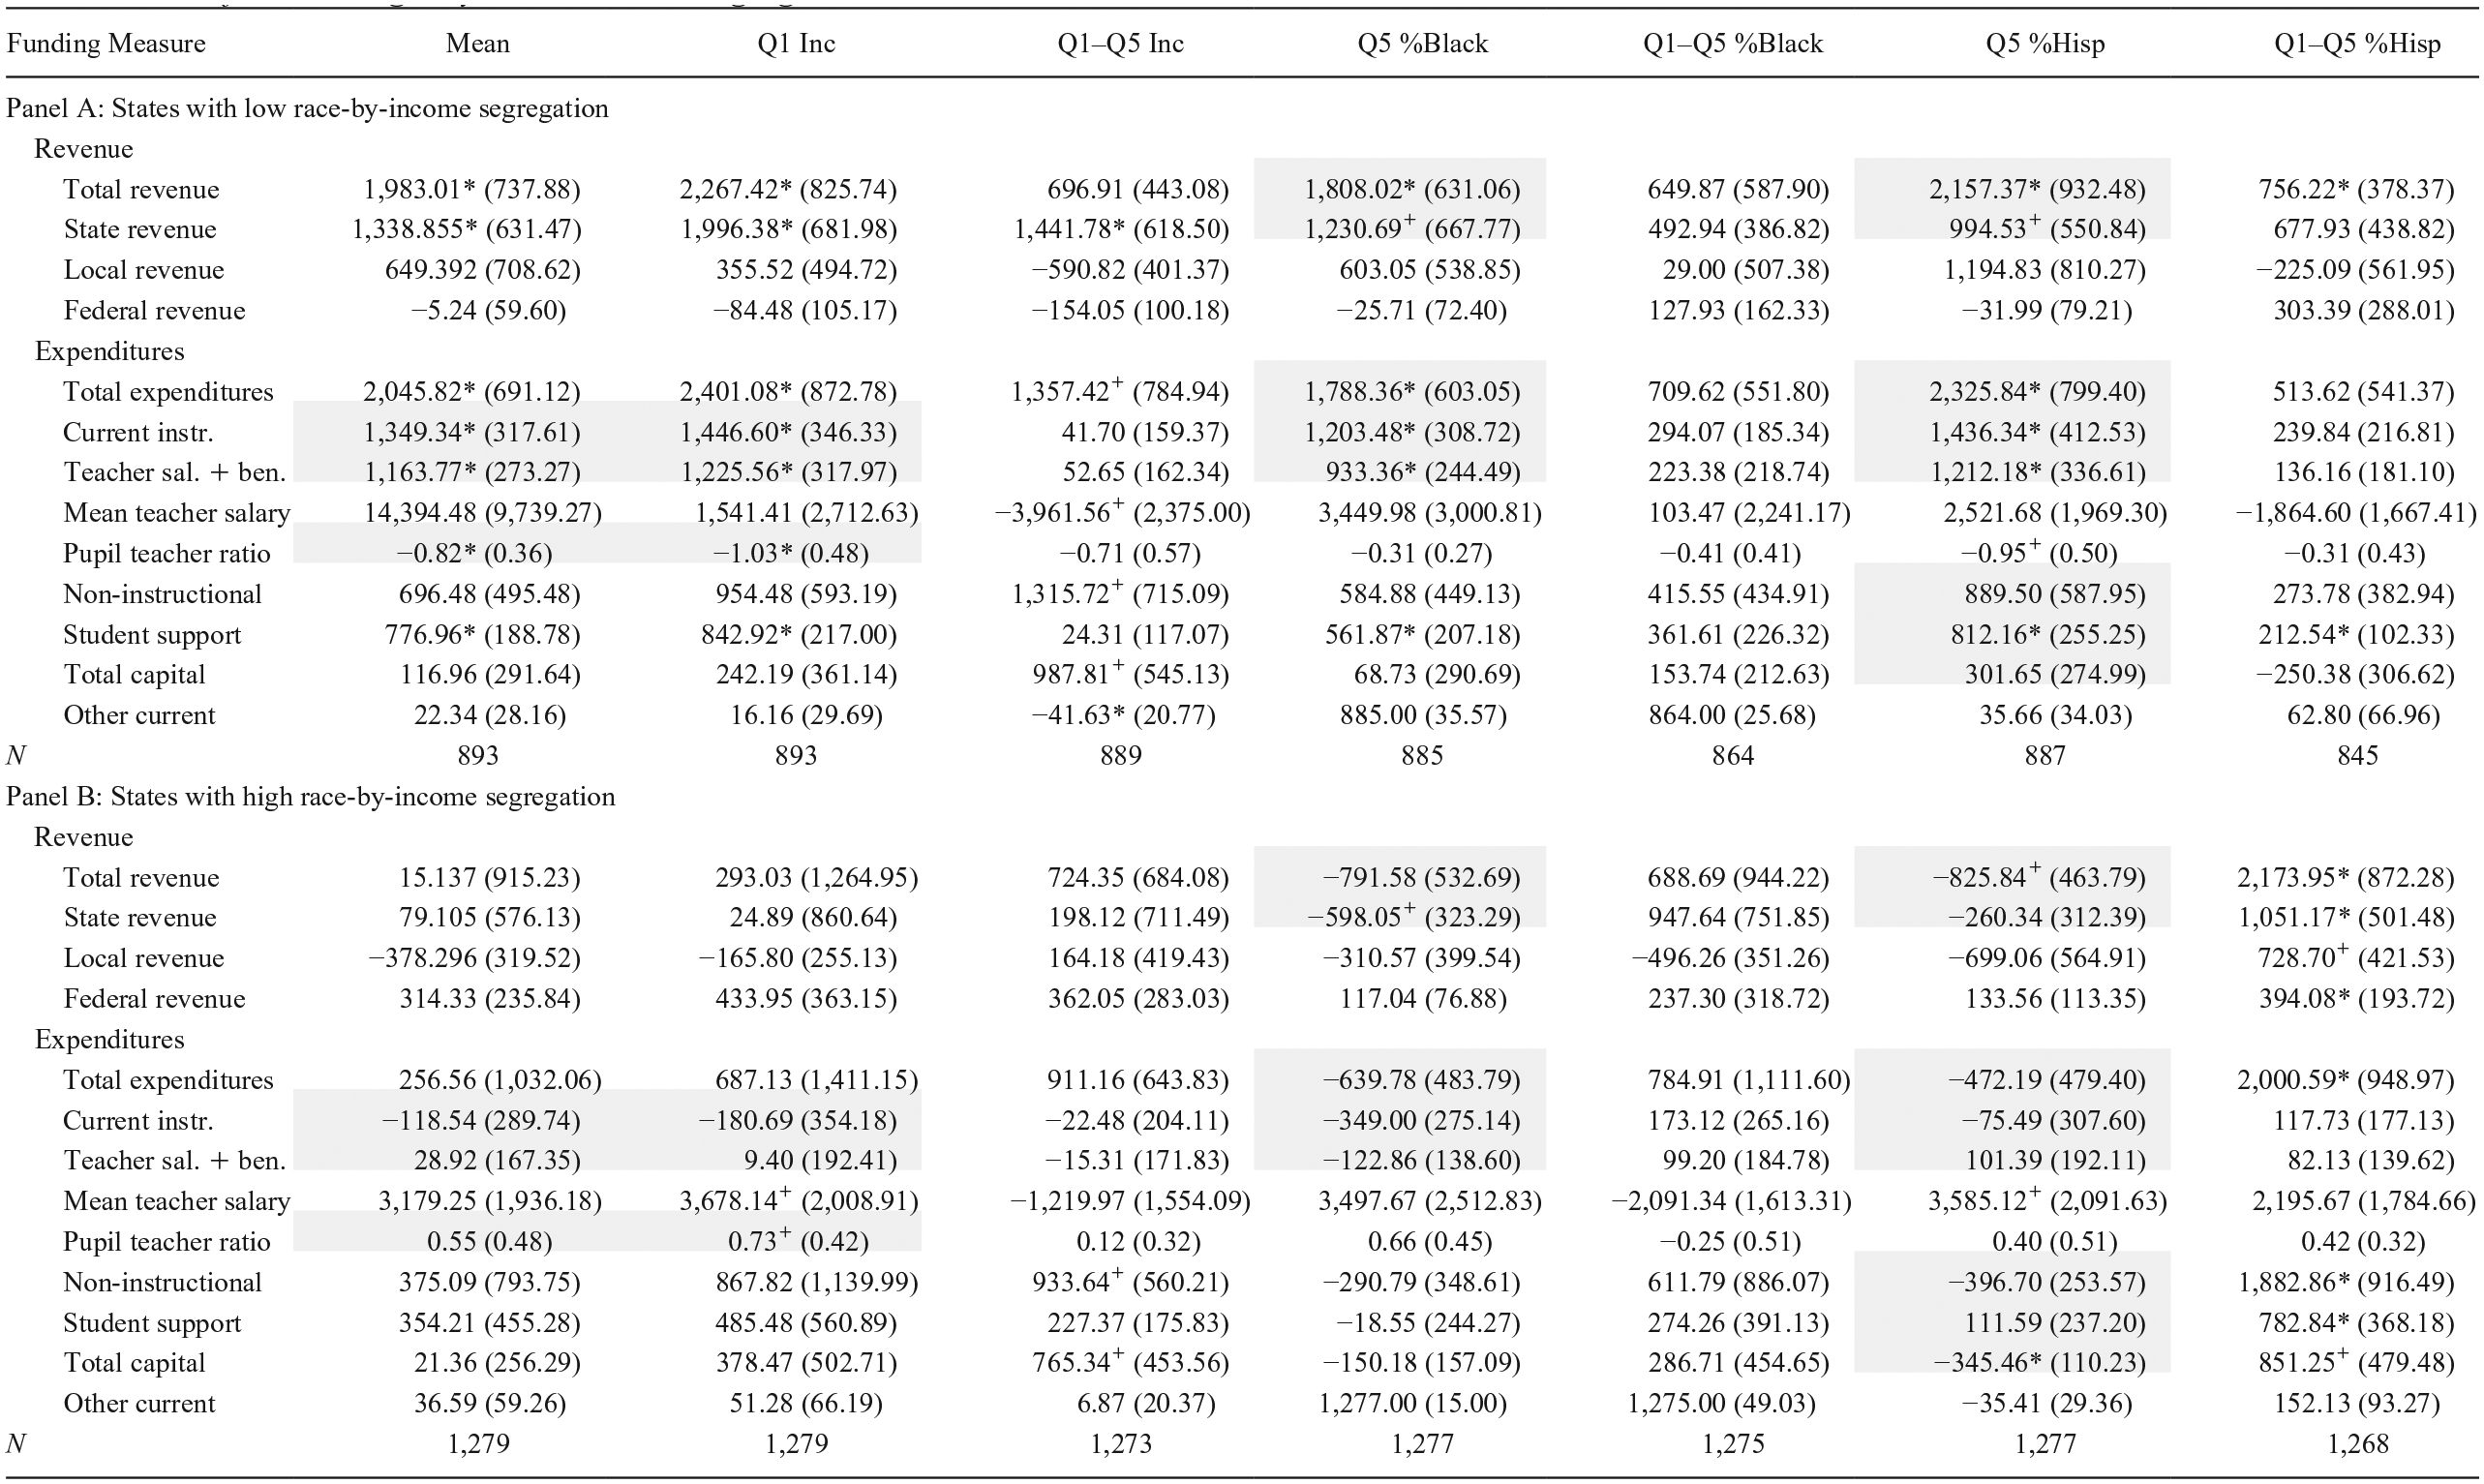
Note. State-year observations 1990–2022. Table shows CSDID estimates predicting mean revenue/spending per pupil in 2013 dollars. Columns predict the same outcomes as columns 2–8 in Tables 2 and 3. Robust standard errors adjusted for state-level clustering in parentheses. Shaded cells indicate significant difference between CSDID coefficients for high and low race-by-income segregation, p < .05;
p < .10. *p < .05. **p < .01.
Understanding Results
The general finding is that economically progressive SFRs led to limited, if any, reductions in racial and ethnic school funding inequality. In fact, our expanded set of economically progressive SFRs increased rather than decreased racial and ethnic inequality of school funding. We find that class-based SFRs do not reduce racial inequality of school funding more in states with initially high racial inequality of funding—in fact, the opposite is true, which is more consistent with political and adaptive variation than with demographic explanations for the modest effects. To further assess the possibility of adaptive responses to SFR policies, we examine whether students changed the way they sorted across states or districts as resources were redistributed; this could have undermined SFRs’ impact if, for instance, White students shifted to districts or states whose funding improved under SFRs. CSDID analyses provide no evidence that SFRs led to changes in enrollment patterns. Supplemental Table A5 (available in the online version of this article) shows CSDID estimates of SFR effects on state-year measures of mean enrollment (log), the proportion of students eligible for FRL, the proportion of students who are Black or Hispanic, the correlation between FRL and Black or Hispanic enrollment, and the standard deviations of proportion of students who are Black or Hispanic and of FRL students. No estimates are significant at the 95% level. Hence, SFRs do not appear to have been undermined by adaptive sorting across districts or states. Note that these results are based on aggregate state-level enrollments rather than household-level data, which could underestimate effects found in previous research (Brunner et al., 2012; Chakrabarti & Roy, 2015).
Overall, evidence suggests that political processes could shape the effectiveness of SFRs. Additional analyses (shown in Supplemental Table A4 in the online version of the journal) find that court-ordered SFRs may have had slightly more economically progressive effects than legislative reforms, but if anything, the former were more racially/ethnically regressive than the latter. In addition, many of these policies were undermined by inadequate funding or economic recessions during the period of study (Shores et al., 2022), with larger funding cuts in low-income and Southern states (Leachman et al., 2016, 2017).
Conclusion
This article examines how adequacy-based SFRs influenced racial/ethnic school funding inequality. The retreat from school desegregation policies and from earlier equity-based SFRs leaves race-neutral adequacy-based SFRs as a rare politically feasible tool to reduce racial funding disparities. But it is unclear whether they are effective. We build on work by Lafortune et al. (2018) to estimate effects of progressive SFRs on racial and ethnic inequality of school funding, extend analyses through 2022, and examine an extended set of progressive SFRs, including more recent reforms. By identifying the most economically progressive SFRs, we provide an upper-bound estimate for the effects of recent SFRs on racial/ethnic funding equality.
We find that economically progressive SFRs reduced inequality of spending by district income but had either minimal effects or reduced racial/ethnic funding equality. Our estimates indicate that SFRs reduced spending gaps between the top and bottom income quintiles by over $500 per pupil. These effects were rooted in SFRs increasing the state revenue of low-income relative to high-income districts. These same SFRs, however, did not reduce spending or revenue gaps between districts with the lowest and highest shares of Black or Hispanic students. When including a broader set of SFRs through 2017, the reforms reduced spending gaps between the top and bottom income quintiles by over $1,300 per pupil, but increased the spending advantage of districts with low shares of Black and Hispanic students.
We find evidence that these SFR effects differed based on the degree of prior funding inequality. SFRs were similarly economically progressive in states with initially high and low income-based funding gaps (early in our period of study), but they were less racially progressive in states with initially high racial funding gaps. SFR effects also differed by the extent to which states are economically and racially segregated. SFRs in low-segregation states improved economic progressivity of funding and increased funding in districts with high Black or Hispanic enrollment but had no effect on racial or ethnic progressivity of funding. In highly segregated states, SFRs reduced revenue and spending in economically, racially, and ethnically marginalized districts. Thus, SFRs in low segregation states were economically progressive and improved funding for marginalized districts. SFRs in high-segregation states did not improve economic progressivity and amplified ethnic inequality in funding.
We find some evidence that court-ordered SFRs reduce economic inequality of school funding more than legislative SFRs, but if anything, court-ordered SFRs are less racially and ethnically progressive than legislative ones. Overall, our results suggest that class-based SFRs in the adequacy era have not reduced racial or ethnic funding inequality, especially in states with high race-by-income segregation or high racial funding gaps.
We also find that the common TWFE regression approach to DID estimation may suffer from attenuation bias and slightly underestimate SFR effects on funding inequality. Others have shown this is likely if treatment effects vary over time (de Chaisemartin & D’Haultfoeuille, 2020; Goodman-Bacon, 2021), as is the case here. SFR effects emerge over several years (Figures 2–4), and TWFE regression estimates err in using post-treatment cases as comparisons for newly-treated cases.
Key limitations of this study include the limited number of state-year observations to examine SFR events and heterogeneous SFR effects. We conduct a series of sensitivity analyses to address these limitations. We examine effects using multiple alternative definitions of SFR events, using data on district poverty rather than income, and including not-yet-treated observations in the control group. Results consistently indicate modest or weak benefits of income-based SFRs for racial and ethnic funding equality.
Our results raise questions about why SFRs are not more effective for racial/ethnic equality of funding. Supplemental analyses (in the Supplemental Appendix in the online version of the journal) suggest that changes in student sorting across states or districts cannot explain our findings. Rather, modest SFR effects on racial/ethnic funding disparities may be driven by demographic and political processes. Adequacy-based SFRs boosted spending broadly rather than redistributed it, and most Black and Hispanic students are not concentrated in the lowest-income districts. Therefore, state-level adequacy-based reforms directed at district-level funding may hold limited potential to improve racial and ethnic equality of resources. Political processes related to SFR implementation could make a modest difference. SFRs that reduced economic funding disparities the most were ordered by the state supreme court and were designed in states with less preexisting racial/ethnic funding inequality. Court-ordered reforms targeting racial and ethnic inequality may more effectively reduce racial and ethnic funding disparities. Most importantly, our descriptive measures indicate relatively equal or even progressive funding and spending by race and ethnic composition within states. Given national evidence of racial and ethnic inequality of funding (Morgan, 2022; Morgan & Amerikaner, 2018), this suggests that much of the racial inequality of funding is between rather than within states. Thus, federal intervention would be required to address racial and ethnic inequality in funding. Overall, slow progress from SFRs targeting district economic inequality suggests state-level and class-based reforms may be insufficient to address racial inequality; other policies are required to improve racial and ethnic equality of educational resources.
Supplemental Material
sj-pdf-1-epa-10.3102_01623737251362855 – Supplemental material for Slow Progress: School Finance Reforms and Racial Disparities in Funding
Supplemental material, sj-pdf-1-epa-10.3102_01623737251362855 for Slow Progress: School Finance Reforms and Racial Disparities in Funding by Emily Rauscher and Jeremy E. Fiel in Educational Evaluation and Policy Analysis
Footnotes
Declaration of Conflicting Interests
The author(s) declared no potential conflicts of interest with respect to the research, authorship, and/or publication of this article.
Funding
The author(s) disclosed receipt of the following financial support for the research, authorship, and/or publication of this article: This research benefited from support from the Gilead Foundation Creating Possible Fund (#17154), the William T. Grant Foundation (#203213), and the Population Studies and Training Center at Brown University, which receives funding from the NIH (P2C HD041020).

Authors
EMILY RAUSCHER, PhD, is a professor of sociology at Brown University. Her research focuses on education, school resources, and inequality.
JEREMY E. FIEL, PhD, is an associate professor of sociology at Rice University. His research focuses on processes that shape segregation and inequality, often in the context of education.
References
Supplementary Material
Please find the following supplemental material available below.
For Open Access articles published under a Creative Commons License, all supplemental material carries the same license as the article it is associated with.
For non-Open Access articles published, all supplemental material carries a non-exclusive license, and permission requests for re-use of supplemental material or any part of supplemental material shall be sent directly to the copyright owner as specified in the copyright notice associated with the article.
