
Abstract
This study investigates ethnic differences for 295,945 children and youth with an autism eligibility reported to the U.S. Department of Education (USDOE) by 49 states plus the District of Columbia. Data analyses used relative difference, risk index, and risk ratio (RR). Results indicate that 80% of states report underrepresentation across ethnicities, with Hispanic children underrepresented in 95% of states. Use of developmental delay label was significantly related to disproportionate representation for school-age population (F = 3.291, p = .046). Region of country yielded significant differences in RR for children classified as Asian (F = 3.532, p = .014) and Caucasian (F = 5.219, p = .002), for Black (F = 4.355, p = .005) and Caucasian (F = 2.840, p = .038) preschoolers, and for Asian (F = 5.676, p = .001) and Caucasian (F =4.906, p = .002) youth. Policy, training, and programming implications of the data are discussed.
Autistic Disorder was originally described by Leo Kanner in 1943, yet the USDOE did not recognize this as a separate special education eligibility category until 1990 (Individuals With Disabilities Education Act [IDEA], 1990). Pervasive developmental disorders, also known as autism spectrum disorders (ASD), are characterized by deficits in reciprocal social interactions, communication, and restricted and repetitive behaviors and interests (American Psychiatric Association [APA], 2000). State Departments of Education usually group all ASD subtypes of (a) autistic disorder, (b) Asperger syndrome, and (c) pervasive developmental disorder–not otherwise specified under one eligibility category—autism. Because of reported increases in the prevalence of ASD (Centers for Disease Control and Prevention [CDC], 2007a, 2007b, 2009; Kogan et al., 2009), this article investigates racial/ethnic patterns of students identified under the state eligibility category of autism throughout the United States to determine if there are racial/ethnic disparities in identification.
With the fourth revision of the Diagnostic and Statistical Manual of Mental Disorders (DSM-IV; American Psychiatric Association, 1994) as well as autism being recognized as a special educational eligibility category (Amendments to IDEA, 1997), the prevalence of children identified with a medical diagnosis of ASD has risen considerably (CDC, 2007a, 2007b, 2009; Yeargin-Allsopp et al., 2003). Previously, autism was thought to occur in 4 to 5 per 10,000 children; however, recent prevalence estimates indicate a significant increase in these diagnoses, from 90 per 10,000 or 1 in 110 children (CDC, 2009) to 100 per 10,000 or 1 in 100 children (Kogan et al., 2009).
Although individuals with ASD are found in all cultures, ethnicities, and socioeconomic levels (APA, 2000), the ethnic breakdown of this disability category in the U.S. public school system is beginning to receive attention in the research (Dyches, Wilder, Sudweeks, Obiakor, & Algozzine, 2004). Recent legislative mandates for investigating all student achievement by subgroups (No Child Left Behind [NCLB], 2001) have increased attention in this area, which has led to subsequent increases in funding as well. Previous studies have been inconclusive in documenting the prevalence of ASD across ethnic groups. Yeargin-Allsopp and colleagues (2003) analyzed ethnic background as a variable in 3 to 10 year olds with Autistic Disorder, finding similar prevalence rates between Whites and Blacks, both at 3.4 per 1,000, and a nonsignificant difference in children from other ethnic groups, at 2.9 per 1,000.
More recent data on the ethnic breakdown of children with ASD across 11 states representing each region of the United States (CDC, 2009) found significantly different prevalence rates among non-Hispanic White, non-Hispanic Black, and Hispanic children in 5 of 11 sites (45%) investigated. Hispanic children had significantly lower prevalence rates than did non-Hispanic White students in approximately 55% of the sites (6 of 11) as well as significantly lower rates than non-Hispanic Black children in approximately 36% (4 of 11) of the sites. Using an earlier CDC dataset, Mandell et al. (2009) found significant ethnic differences for diagnosis of ASD when compared to children from Caucasian backgrounds (i.e., odds ratio [OR]). These results indicate underrepresentation for all minority ethnic groups studied: Black (OR = 0.79), Hispanic (OR = 0.76), and other ethnicity (OR = 0.65). These researchers found that this disparity remained for children who are Black regardless of IQ and for children from other ethnicities that had IQs lower than 70.
Using data from the Office of Special Education Programs, Dyches et al. (2004), found that children from African American and Asian/Pacific Island backgrounds received special education services under an autism eligibility at approximately two times the rate of students from American Indian, Native Alaskan, or Hispanic backgrounds. Morrier, Hess, and Heflin (2008) investigated teacher report of students with ASD for ethnic disproportionality in one Southern state. These researchers found that ethnicity played a significant role in which students were reported as served under an autism eligibility category. Caucasian students were 1.54 times more likely to be served under an autism eligibility than all other ethnic groups were, and Hispanic students were 99.995 times less likely to be served under an autism eligibility than all other groups were. Although this sample was small (n = 226) and represented one state that historically has had problems with racial discrimination, the results were similar to those found by Williams, Atkins, and Soles (2009), who found that school systems did not place students from ethnically diverse backgrounds under an autism eligibility.
Data from Sweden indicate that children from Somali backgrounds had a three- to four-fold increase in receipt of a diagnosis of autistic disorder or pervasive developmental disorder–not otherwise specified than did children from non-Somali backgrounds (Barnevik-Olsson, Gillberg, & Fernell, 2008). In this small sample (n = 17), all children from Somali backgrounds were found to have a learning disability (i.e., intellectual disability) and parents from consanguineous marriages. The genetic make-up of these children may have been different than those from non-Somali backgrounds.
Although no specific genetic marker has been identified for ASD, it is widely believed that genetics is a large part of having this disorder and can be identified as the cause of the ASD in 1 to 2% of children (Rutter, 2005). Genetic studies of ASD indicate that siblings of children with ASD have higher rates of receiving a diagnosis on the spectrum, with rates from 6 to 20% of siblings (Rutter, 2005). Further genetic research indicates that genetic mutations and abnormalities are higher in families with related parents (i.e., first cousins; Morrow et al., 2008). These data, along with the Barnevik-Olsson et al. (2008) data, indicate that factors other than country or region of residence may be involved in receiving an ASD diagnosis and that expecting all ethnicities to have equal prevalence rates for of ASD might not be correct.
One reason for the discrepancy in finding children qualified for an autism eligibility may come from differing criteria used by the medical and educational communities. The medical community typically used criteria described in the DSM-IV (APA, 2000), whereas educational personnel, namely school psychologists, use criteria outlined by IDEA (Amendments to IDEA, 1997; Individuals With Disabilities Education Improvement Act, 2004). Parents and educators often equate receiving a medical diagnosis of ASD with being qualified for an autism eligibility in special education. This confusion often arises because a child can be found eligible under one set of criteria but not under the other. Although both criteria rely on behavioral observations to determine qualification, they both still leave room for personal impressions to affect the final diagnosis and eligibility. The lack of a consistent screening tool used for determining if a child qualifies for an ASD (Baio, Rice, Wiggins, Morrier, & Hobson, 2009; Rice et al., 2009) may play a role in this lack of consensus.
To increase accurate identification of students with ASD within the educational environment, Noland and Gabriels (2004) suggested a model for screening children in public schools for a possible ASD. This model proposed a multitiered training system for school personnel that included (a) an overview of the legal and clinical issues involved in screening ASD, (b) a defined training process for school-based personnel, and (c) an outline for a school-based process for screening ASD. The screening process included training school personnel on use of the best practice assessments of the Autism Diagnostic Observation Schedule (ADOS; Lord, Rutter, DiLavore, & Risi, 2001) and the Autism Diagnostic Interview (ADI-R; Rutter, LeCouteur, & Lord, 2003). Williams et al. (2009) found that school evaluators were least likely to use ADOS or ADI-R, instead relying on more subject observations using the Childhood Autism Rating Scale (Schopler, Reichler, DeVellis, & Daly, 1980) or the Gilliam Autism Rating Scale (Gilliam, 1995, 2006). They also found that only 29% of school systems used the child’s native language of Spanish for the assessment as required by federal law (IDEA, 1990; Amendments to IDEA, 1997; Individuals With Disabilities Education Improvement Act, 2004). These results were recently confirmed by CDC’s Autism and Developmental Disabilities Monitoring Network, who found that although the use of the ADOS and ADI-R was increasing in four states, the Childhood Autism Rating Scale was still the preferred assessment for autism identification (Baio et al., 2009; Rice et al., 2009).
Although the data indicate that children from ethnically diverse backgrounds are underrepresented in receipt of a school-based autism eligibility (Dyches et al., 2004; Mandell et al., 2009; Morrier et al., 2008), these previous investigations concentrated on targeted areas of the United States. This study investigated ethnic disparities in receipt of an autism eligibility across the United States as well as each individual state’s reported data to the Office of Special Education Programs. Other state-specific factors that could be related to this eligibility category were also investigated. Calculations of disproportionality were conducted to investigate the hypotheses of disproportionate representation according to ethnicity and age group of students.
Method
Sample
State-level data on special education enrollment for the autism eligibility by ethnicity were drawn from the Office of Special Education Programs and made available by Westat (www.ideadata.org) for the 2007-2008 school year. The sample consisted of 295,945 children and youth ages 3 to 21 years reported as eligible under the autism eligibility. Students represented 49 states and the District of Columbia; data were not available for Vermont. Student breakdown by ethnicity was (a) 2,003 American Indian/Native Alaskan; (b) 16,691 Asian/Pacific Islander, (c) 41,075 Black/African American; (d) 38,801 Hispanic/Latino; and (e) 195,610 White/Caucasian. The sample included 38,527 3 to 5 year olds (i.e., preschoolers) and 255,653 6 to 21 year olds (i.e., school-age). Data on gender distribution were not available. States were able to suppress data for those ethnic groups for which there were fewer than 5 students reported.
Measures of Disproportionality
To calculate disproportionate representation by ethnicity, three recommended indexes (Westat, 2004) were used: (a) relative difference, (b) risk index (RI), and (c) risk ratio (RR). The relative difference calculation provided a comparison of an ethnic group’s proportion under an autism eligibility compared to its proportion in the general population. Relative difference calculations were determined by subtracting the percentage of children with an autism eligibility within a specific ethnic group from that ethnic group’s percentage in the general population. The difference between these percentages equals a positive or negative relative difference. The RI calculates the risk that students from a specific ethnic group had of receiving an autism eligibility based on their proportion in the general population. This index is an expression of the rate at which a disability condition (i.e., autism) occurs in a group and is expressed as a percentage. The RI was calculated by dividing the number of students from the targeted group under an autism eligibility by the total number of students in that group in the general population. The RR provided a relative risk for the students in a specific ethnic group compared to students from all other ethnic groups served under an autism eligibility. The RR was calculated by dividing the RI from the targeted group by the RI for all other ethnicities, minus the target group, combined.
Results
Relative Difference From Population Composition
Table 1 lists the relative difference of receiving an autism eligibility through the USDOE as a whole as well as for each individual state. Results indicate that students from American Indian and Hispanic backgrounds had the greatest negative relative differences when compared to their proportions in the general populations. Students from Asian backgrounds had the greatest positive relative difference when compared to the general population. Paired samples t tests indicate that differences of the overall relative difference and the relative difference for preschool children were statistically significant for children from Hispanic backgrounds, t(49) = −2.320, p = .026, and children from Caucasian backgrounds, t(49) = −3.368, p = .001. These data indicate that preschool-aged children classified as Hispanic are consistently underrepresented in special education under an autism eligibility and that those classified as Caucasian are consistently overrepresented in this eligibility category. Comparisons of the overall relative difference and the relative difference for school-age children were statistically significant for children from Asian, t(41) = −3.990, p = .001; African American, t(48) = −2.548, p = .014; and Caucasian, t(50) = 2.459, p = .017, backgrounds. These data indicate that school-aged children and youth classified as Asian/Pacific Islander and Caucasian were overrepresented in this category while those classified as African American/Black were underrepresented. Comparisons of the relative difference for preschool versus school-age children were statistically different for Caucasian children only, t(49) = 3.506, p = .001, indicating that more Caucasian school-aged children are found eligible for this special education category than preschool-aged children.
Relative Difference Between Autism Composition and Enrollment Composition

Abbreviations: AI = American Indian/Native Alaskan; API = Asian/Pacific Islander; AA = Black (non-Hispanic); H = Hispanic/Latino; W = White (non-Hispanic).
Data not calculated because n = 0 or suppressed by state.
Data not available at time of Child Count.
State-by-state variation of the relative differences indicates a large range for children and youth reported under an autism eligibility. Overall, the state of New York had the largest relative difference for children and youth from American Indian backgrounds at +54.75. This indicates that although children and youth from this ethnic background represented 0.21% of the general population they were represented in special education under an autism eligibility at 0.58%, yielding overrepresentation in this category. For this same group, the state of North Carolina had a relative difference of −63.38, indicating an underrepresentation in this eligibility category. Children and youth from Asian backgrounds had an overall relative difference of +32.38 (range −73.52 in New Hampshire to +75.45 in Arizona), indicating overall overrepresentation of this ethnic group. Receipt of an autism eligibility for children and youth from African American backgrounds indicated they were represented within expected proportions with a relative difference of −6.98, although individual states ranged from underrepresentation in Hawaii (−48.24) to significant overrepresentation in North Dakota (+140.05). When compared to their proportions in the general population, children and youth from Hispanic backgrounds were underrepresented across all states with a relative difference of −32.21 (range −87.47 to −0.65). Overall, children and youth from Caucasian backgrounds were represented in expected proportions (+10.32), although state-by-state analysis revealed underrepresentation in the District of Columbia (−60.14) and significant overrepresentation in New Mexico (+68.97).
RI Calculations
RI calculations were computed to determine the likelihood a child had of receiving an autism eligibility based on the proportion of the group in the general population. Table 2 displays the RI for each state by age group. Paired samples t tests were conducted to determine if there were statistically significant differences by ethnicity for overall RI versus RIs for preschool-aged children, overall RIs versus RIs for school-age children and youth, and preschool-aged children versus school-age children and youth. t test results indicate statistically significant differences for Caucasian children overall versus preschool African American children, t(44) = 2.291, p = .027, and Caucasian children, t(49) = 4.110, p = .001. Comparisons of overall RI versus school-age RI indicate significant differences for children and youth from American Indian, t(42) = −2.748, p = .009; Asian, t(41) = −6.258, p = .001; African American, t(48) = −4.745, p = .001; Hispanic, t(47) = −2.357, p = .023; and Caucasian, t(50) = −4.016, p = .001, backgrounds. RI comparisons for preschool versus school-age children and youth indicate statistically significant differences for African American, t(42) = −4.126, p = .001, and Caucasian, t(49) = −4.093, p = .001, ethnicities.
Risk Index (%) for Autism by Ethnicity Across All 50 States
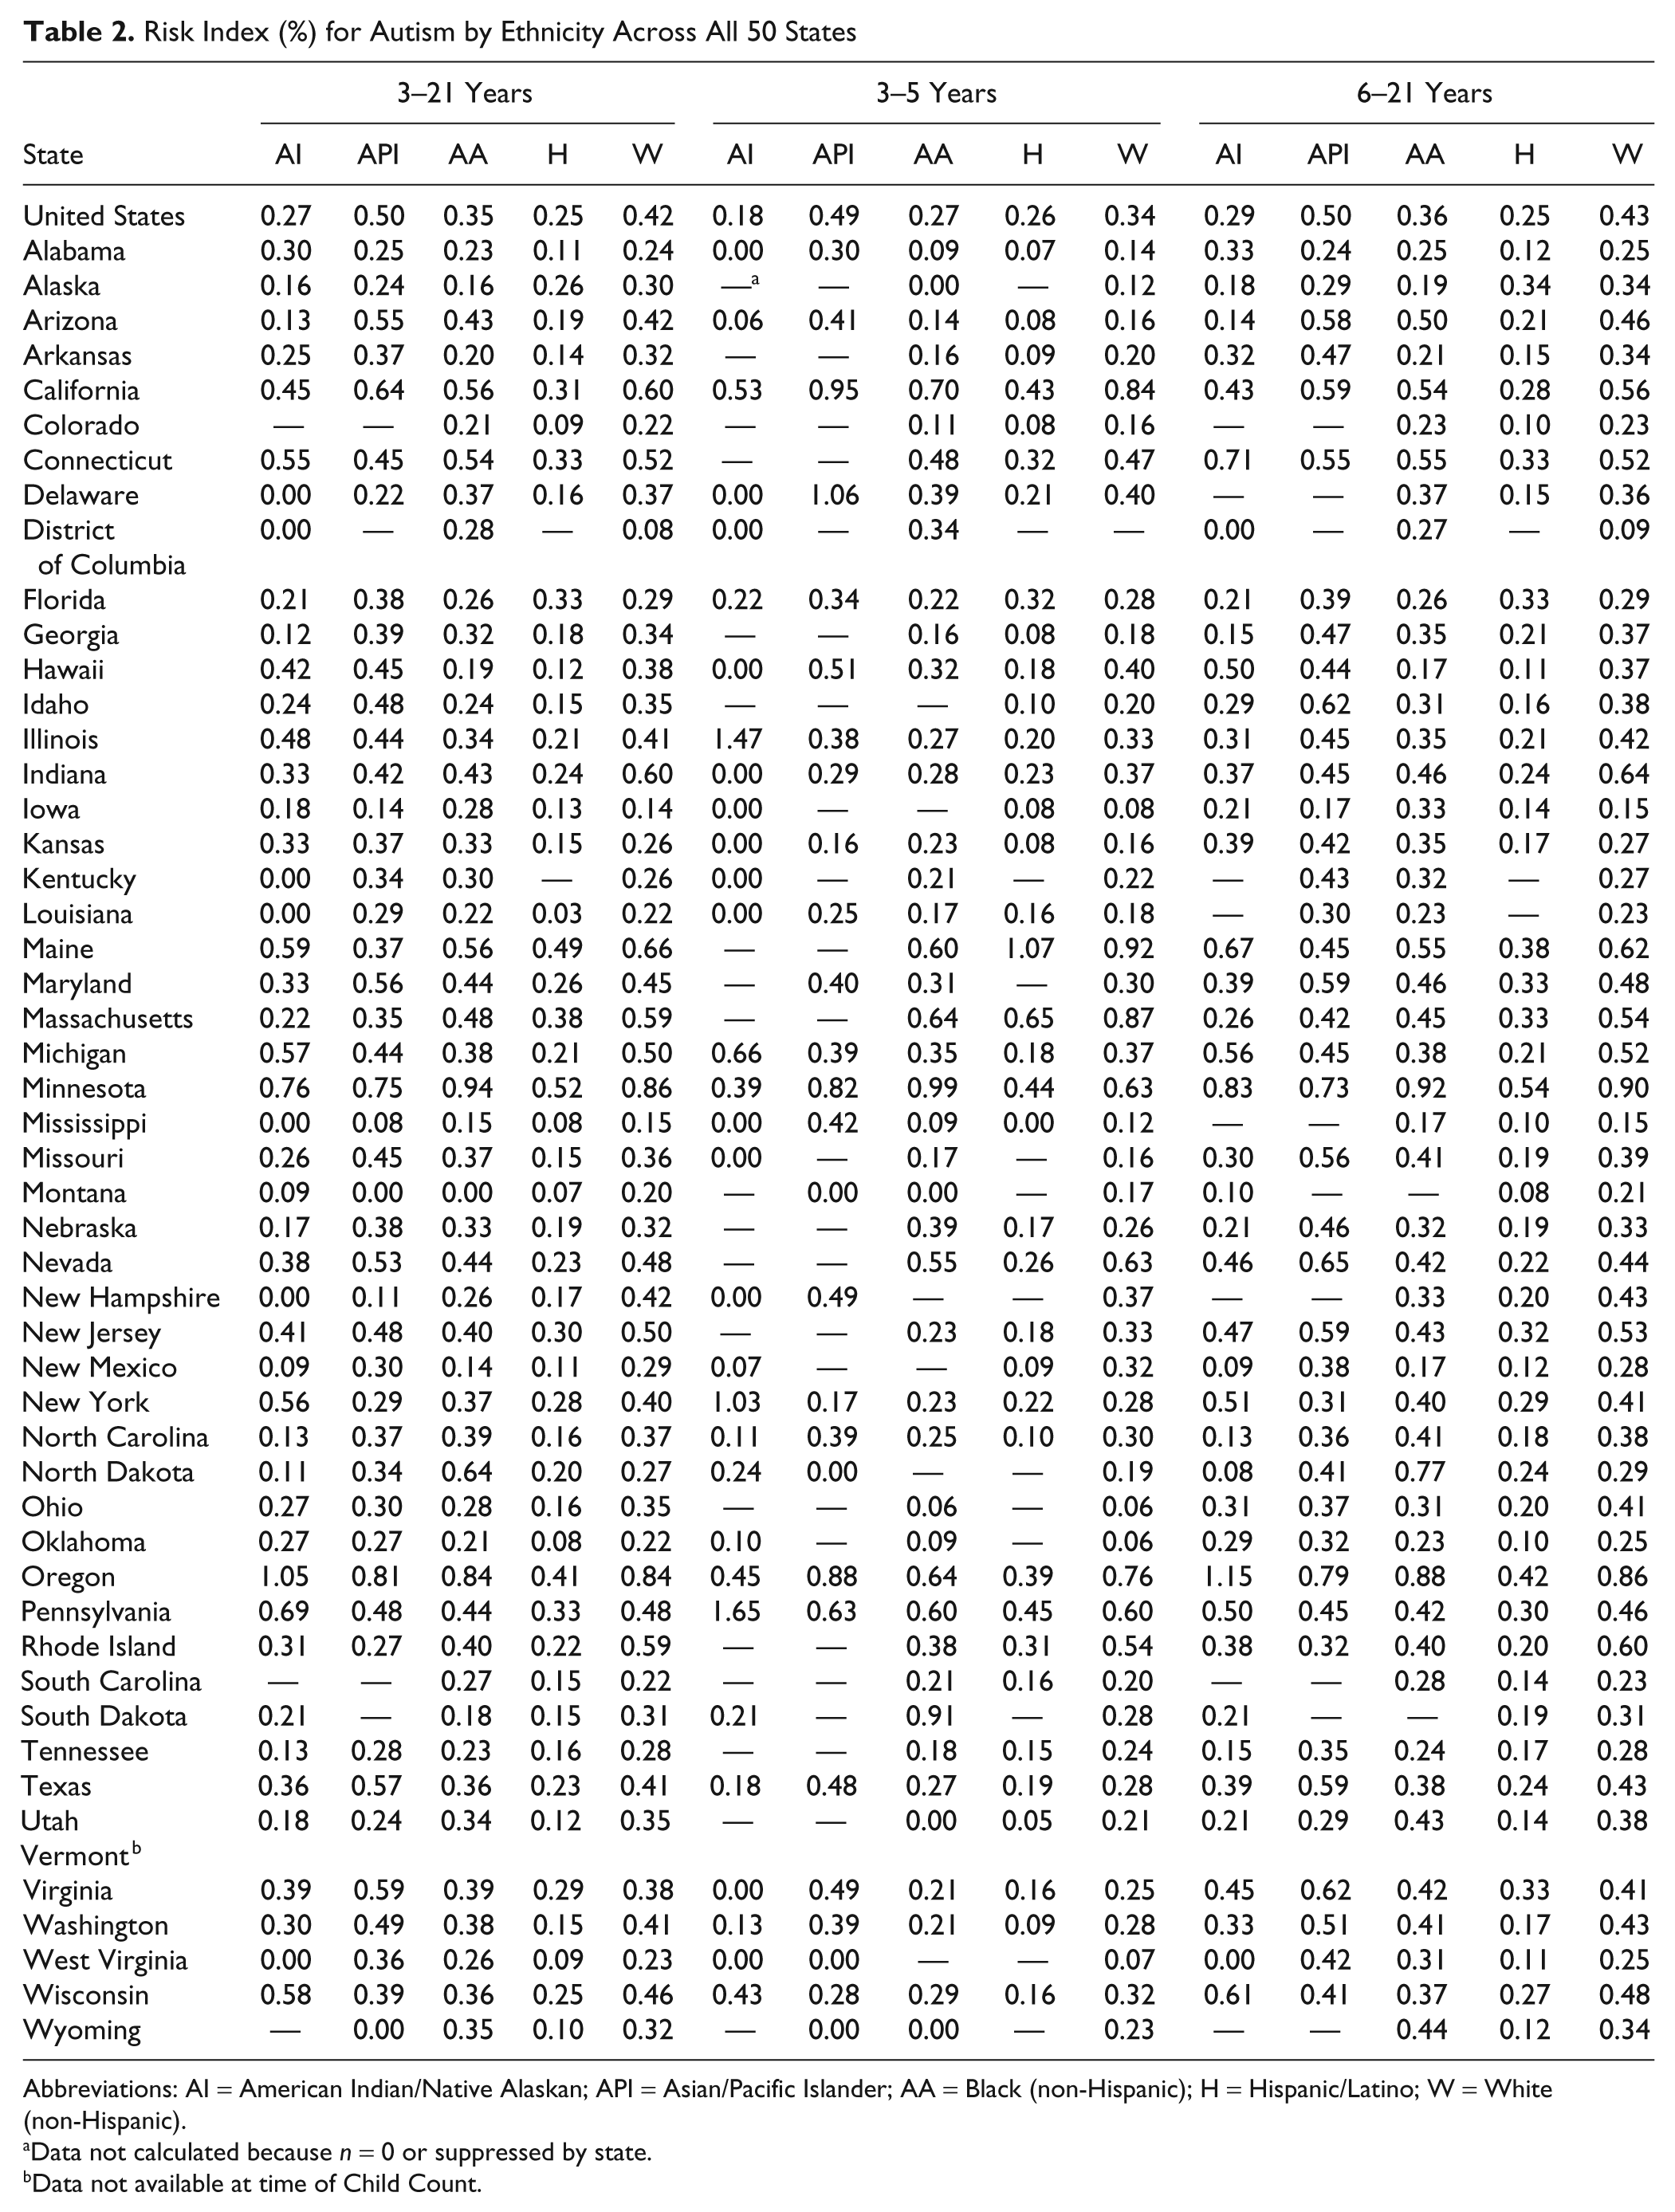
Abbreviations: AI = American Indian/Native Alaskan; API = Asian/Pacific Islander; AA = Black (non-Hispanic); H = Hispanic/Latino; W = White (non-Hispanic).
Data not calculated because n = 0 or suppressed by state.
Data not available at time of Child Count.
Based on the RI calculated in Table 2, results indicate that the 80% of states underreported children and youth ages 3 to 21 with an autism eligibility across all ethnicities. Only one state (3.23%) reported overrepresentation of 3 to 5 year olds from American Indian backgrounds, whereas three states (9.68%) reported this ethnicity in proportion to the general population.
Relative Risk Calculations
Children and youth ages 3 to 21 years
Relative risk calculations were conducted to compare the RI for a specific ethnic group to the RI for all other ethnic groups combined (Table 3). According to the USDOE, states are able to determine individualized criteria to determine disproportionate representation (Posney, 2007); therefore, we followed guidelines suggested by Bollmer, Bethel, Garrison-Mogren, and Brauen (2007) and used a cutoff of greater than or equal to RR = 1.50 to indicate overrepresentation as well as a cutoff equal to or less than 0.67 to indicate underrepresentation. Overall, underrepresentation occurred for children and youth from Hispanic backgrounds, whereas children and youth from American Indian, Asian, African American, and Caucasian backgrounds were represented in correct proportions. These data indicate that children and youth from Hispanic backgrounds were 0.40 times less likely to be served under this eligibility than were children from other ethnicities. When compared to all other ethnicities, children and youth from American Indian backgrounds were 0.72 times more likely to receive special education services under an autism eligibility, Asian backgrounds were 1.34 times more likely, African American students were 0.91 times more likely, and Caucasian students were 1.09 times more likely.
Risk Ratio for Autism by Ethnicity Across All 50 States
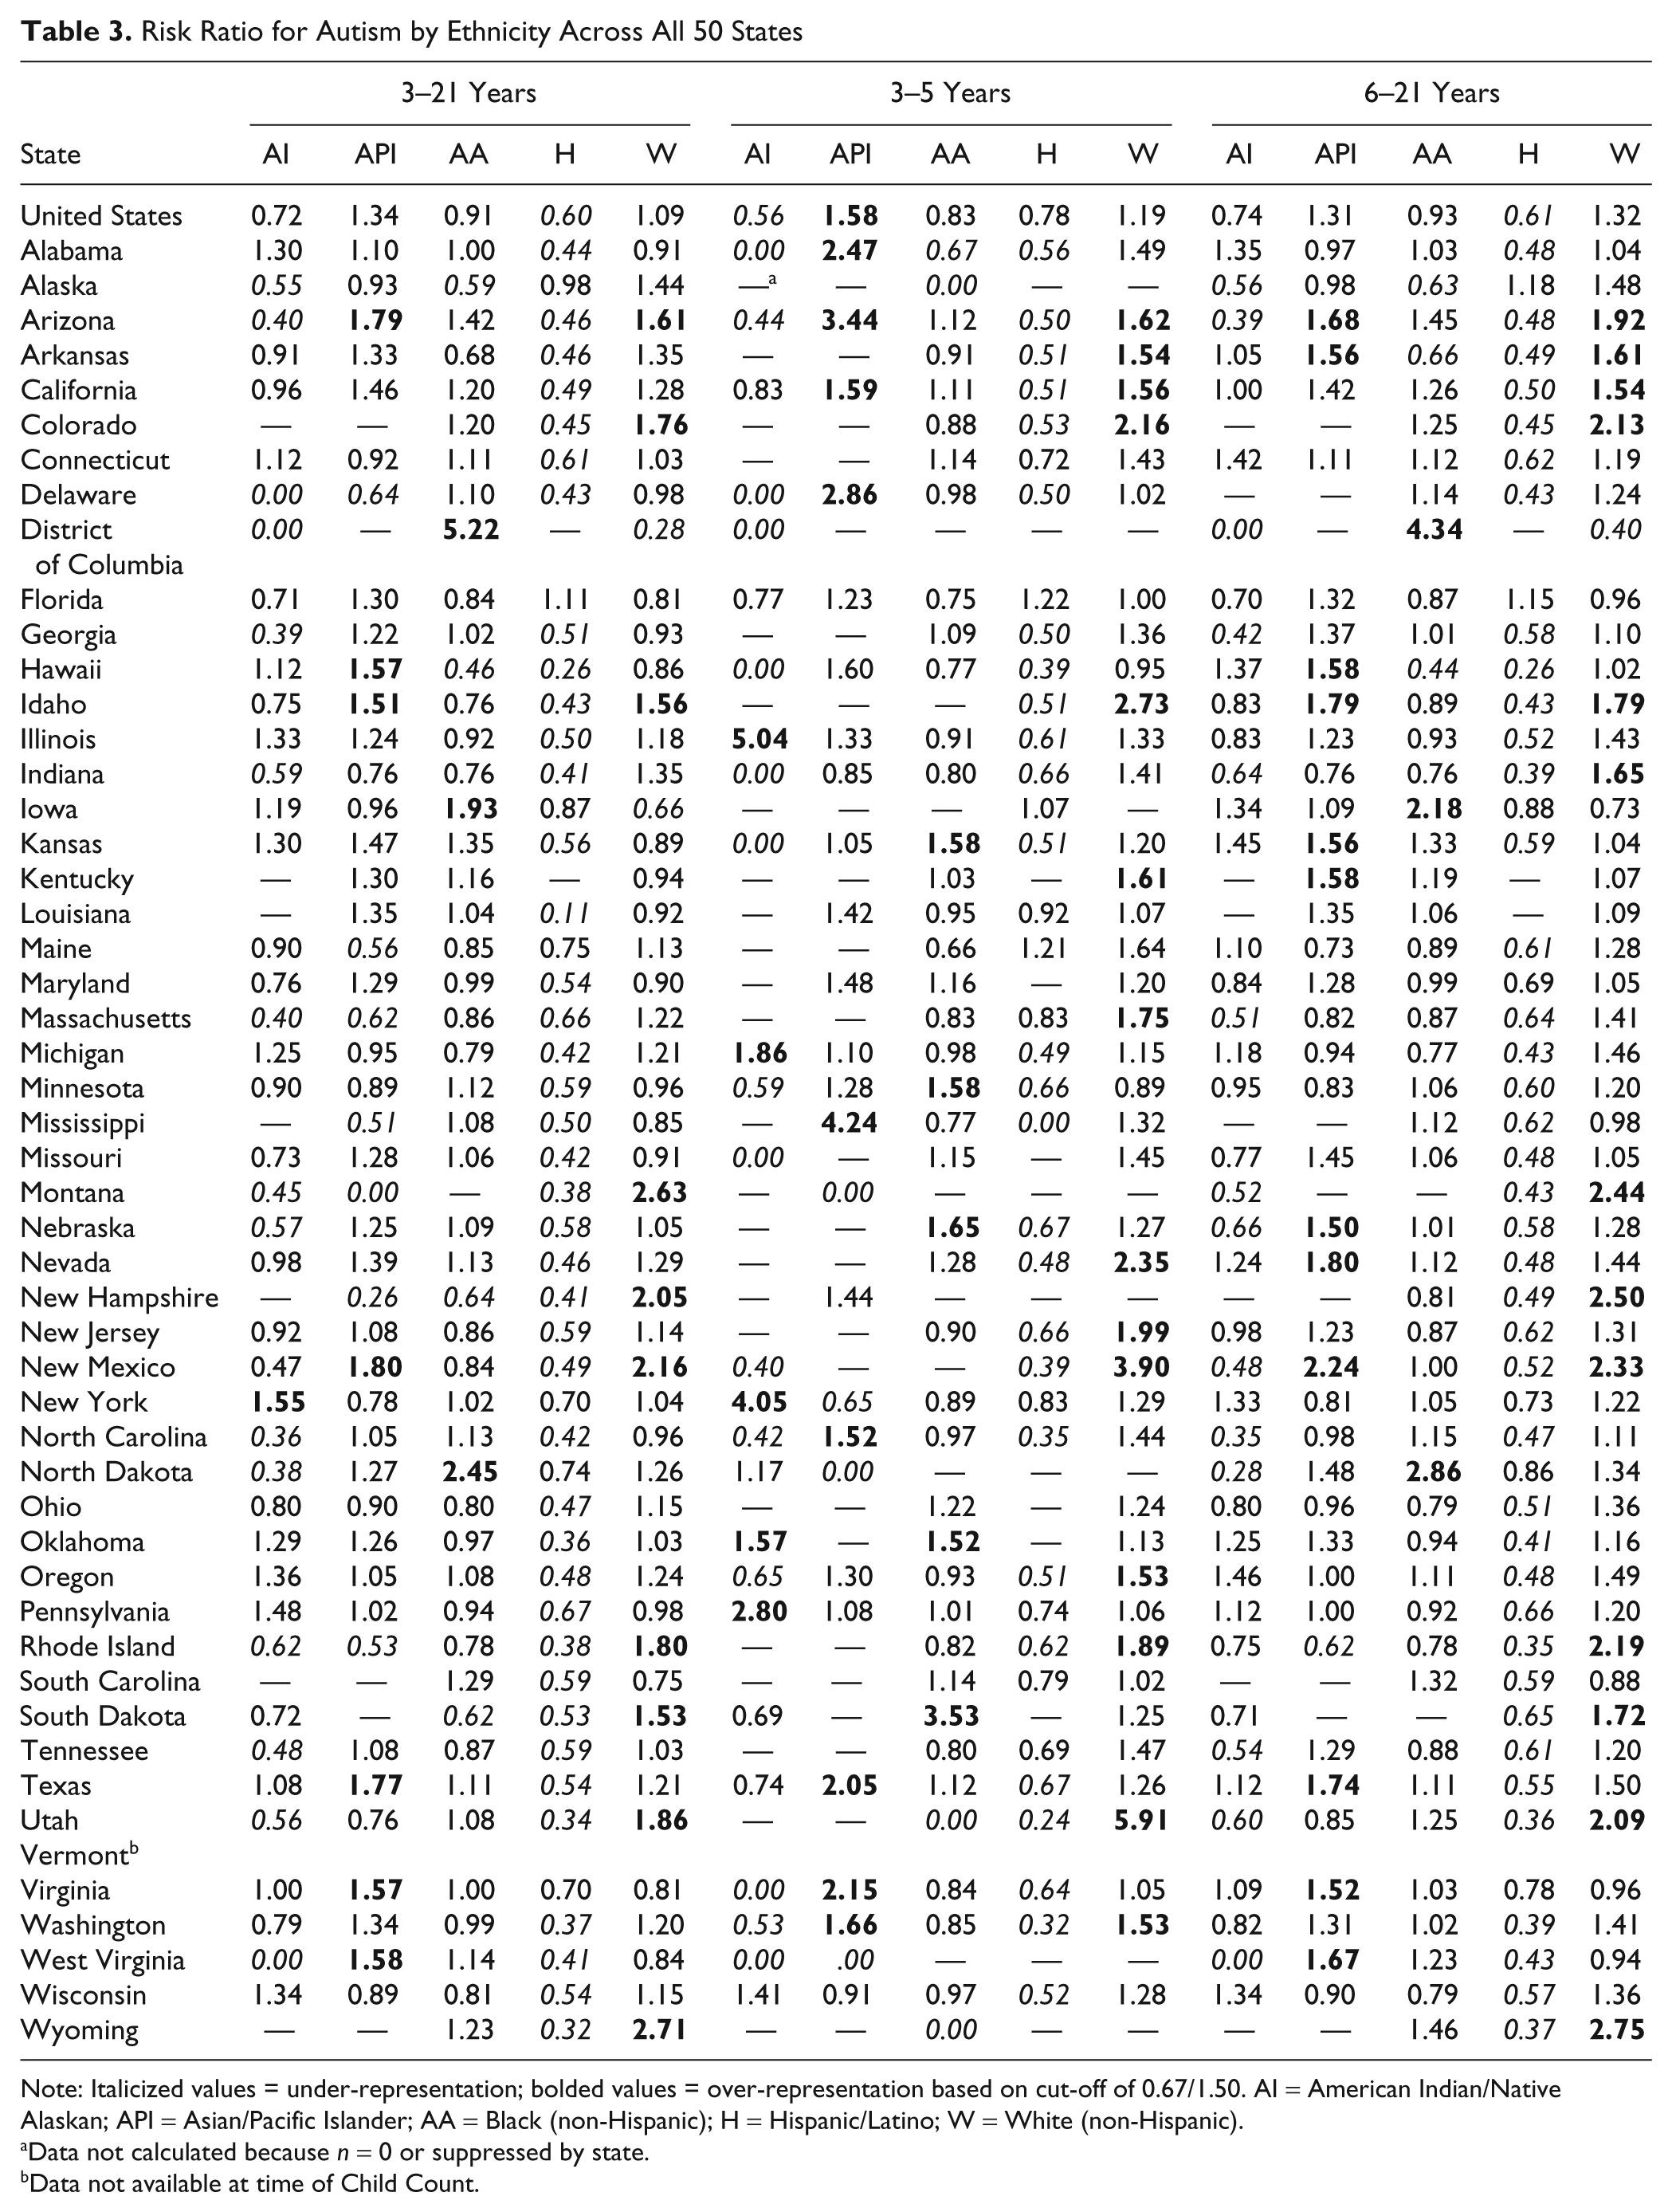
Note: Italicized values = under-representation; bolded values = over-representation based on cut-off of 0.67/1.50. AI = American Indian/Native Alaskan; API = Asian/Pacific Islander; AA = Black (non-Hispanic); H = Hispanic/Latino; W = White (non-Hispanic).
Data not calculated because n = 0 or suppressed by state.
Data not available at time of Child Count.
Using the 1.50/0.67 cutoffs for disproportionate representation, for the states that reported data on children and youth with an autism eligibility, children and youth ages 3 to 21 years from American Indian backgrounds were underrepresented in 37.21% of states reporting data and were overrepresented in only 2.33% of states. Children and youth from Asian backgrounds were equally overrepresented and underrepresented in 15.56% of states reporting. Students ages 3 to 21 years from African American backgrounds were underrepresented in 8.16% of states and were overrepresented in 6.12% of states. Children and youth from Hispanic backgrounds were underrepresented in 85.42% of states and were not overrepresented in any state. Children and youth from Caucasian backgrounds were underrepresented in only 4% of states investigated and were overrepresented in 20% of states investigated.
Preschool-aged children (3−5 years)
Relative risk calculations indicate that preschoolers from Asian backgrounds were overrepresented and were 1.58 times more likely to receive special education services under an autism eligibility when compared to all other preschoolers. Preschoolers from American Indian backgrounds were underrepresented and were 0.56 times more likely than other preschoolers were to be served under an autism eligibility. Preschoolers from African American, Hispanic, and Caucasian backgrounds were represented in correct proportions, at 0.83, 0.78, and 1.19 times more likely, respectively. Individual state data indicate that preschoolers from American Indian backgrounds were underrepresented in 17 of 26 states (65.38%) reporting data for this ethnicity and were overrepresented in 5 of 26 states (19.23%). Preschoolers from Asian backgrounds were underrepresented in 4 of 26 states (15.38%) and were overrepresented in 9 of these 26 states (23.08%). African American preschoolers were underrepresented in 5 of 42 states (11.90%) and were overrepresented in 5 (11.90%) of these states. Preschoolers from Hispanic backgrounds were underrepresented in 30 of the 37 states (81.08%) reporting data for this ethnicity. Children aged 3 to 5 years from Caucasian backgrounds were underrepresented in 0 of 42 states and were overrepresented in 14 states (33.33%).
School-aged children and youth (6−21 years)
Relative risk calculations indicate that only school-aged children and youth from Hispanic backgrounds were underrepresented and were 0.61 times more likely to receive special education services under an autism eligibility when compared to all other students. Individual state data indicate that school-aged children and youth from American Indian backgrounds were underrepresented in 16 of 42 states (38.09%) reporting data for this ethnicity and were not overrepresented in any state. Students from Asian backgrounds were underrepresented in 3 of 41 states (7.32%) and were overrepresented in 11 of these (26.83%). African American school-aged students were underrepresented and overrepresented in 3 of 48 states (both equal 6.25%). School-aged students from Hispanic backgrounds were underrepresented in 42 of the 47 states (89.36%) and were overrepresented in 0% of states reporting data for this ethnicity. Children and youth ages 6 to 21 years from Caucasian backgrounds were underrepresented in 2 of 50 (4%) states and were overrepresented in 12 states (24%).
Other State-Specific Factors
Federal law provides states with the option of using a developmental delay (DD) eligibility for children with disabilities ages 3 to 8 years (IDEA, 2004). Just more than 7% of states do not use the DD category for special education qualification, 33.3% of states use the DD label for children until the age of 6 years, and 58.8% use the DD label for children until their 9th birthday. Also, the federal legislation provides guidelines for states to follow for determination of special education eligibility (Individuals With Disabilities Education Improvement Act, 2004). Individual states are able to use these guidelines as a minimum requirement for determination of special education services, which allows states to use different criteria for eligibility status. Thus, a child who qualifies for an autism eligibility in one state may not do so in another state. To determine if a state’s use of the DD eligibility and the region of the country in which a child lives were significant factors in receipt of an autism eligibility, a series of one-way analyses of variance (ANOVA) were conducted on the RR calculations.
For these calculations, states were divided into the three categories based on use of the DD label: (a) no use of DD label (n = 4), (b) DD label used for children until age 6 years (n = 17), and (c) DD label used for children until 9th birthday (n = 29). States were divided into the specific region of the country in which they are located: (a) Northeast (n = 11), (b) Middle West (n = 12), (c) Southeast (n =12), (d) Southwest (n = 4), and (e) West (n =11). A 3 (label) × 5 (region) ANOVA was conducted for RR calculations on the entire sample of 3 to 21 year olds, for preschool-aged children only, and for school-age children only.
Use of DD label
A state’s use of the DD label was a significant factor only for school-aged children and youth from Caucasian backgrounds, F(2, 47) = 3.291, p = .046. All other ethnicities and age groups were nonsignificant. The means, standard deviations, and 95% confidence intervals can be found in Table 4. Pairwise comparisons did not reveal any significant differences between groups. Thus, the use of the (optional) DD category for children younger than 9 years of age does not influence whether a state has overrepresentation or underrepresentation in the autism eligibility category during the preschool years; it only influences the use of the autism category for children and youth ages 6 to 21 years classified as Caucasian.
Means, Standard Deviations, and 95% Confidence Intervals (CI) for Risk Ratio Calculations by Use of Developmental Delay (DD) Label

Abbreviations: AI = American Indian/Native Alaskan; API = Asian/Pacific Islander; AA = Black (non-Hispanic); H = Hispanic/Latino; W = White (non-Hispanic).
Region of country
Table 5 displays the means, standard deviations, and 95% confidence intervals for each region of the country. The ANOVA for the total sample was significant for children and youth from Asian, F(4, 45) = 3.532, p = .014, and from Caucasian, F(4, 45) = 5.219, p = .002, backgrounds. For preschool-aged children, the ANOVA results were significant for children from African American backgrounds, F(4, 38) = 4.355, p = .005, as well as for Caucasian preschoolers, F(4, 37) = 2.840, p = .038. ANOVA results for school-aged children and youth found significant differences for children and youth from Asian, F(4, 36) = 5.676, p = .001, and from Caucasian, F(4, 45) =4.906, p = .002, backgrounds.
Means, Standard Deviations, and 95% Confidence Intervals (CI) for Risk Ratio Calculations by Region of Country
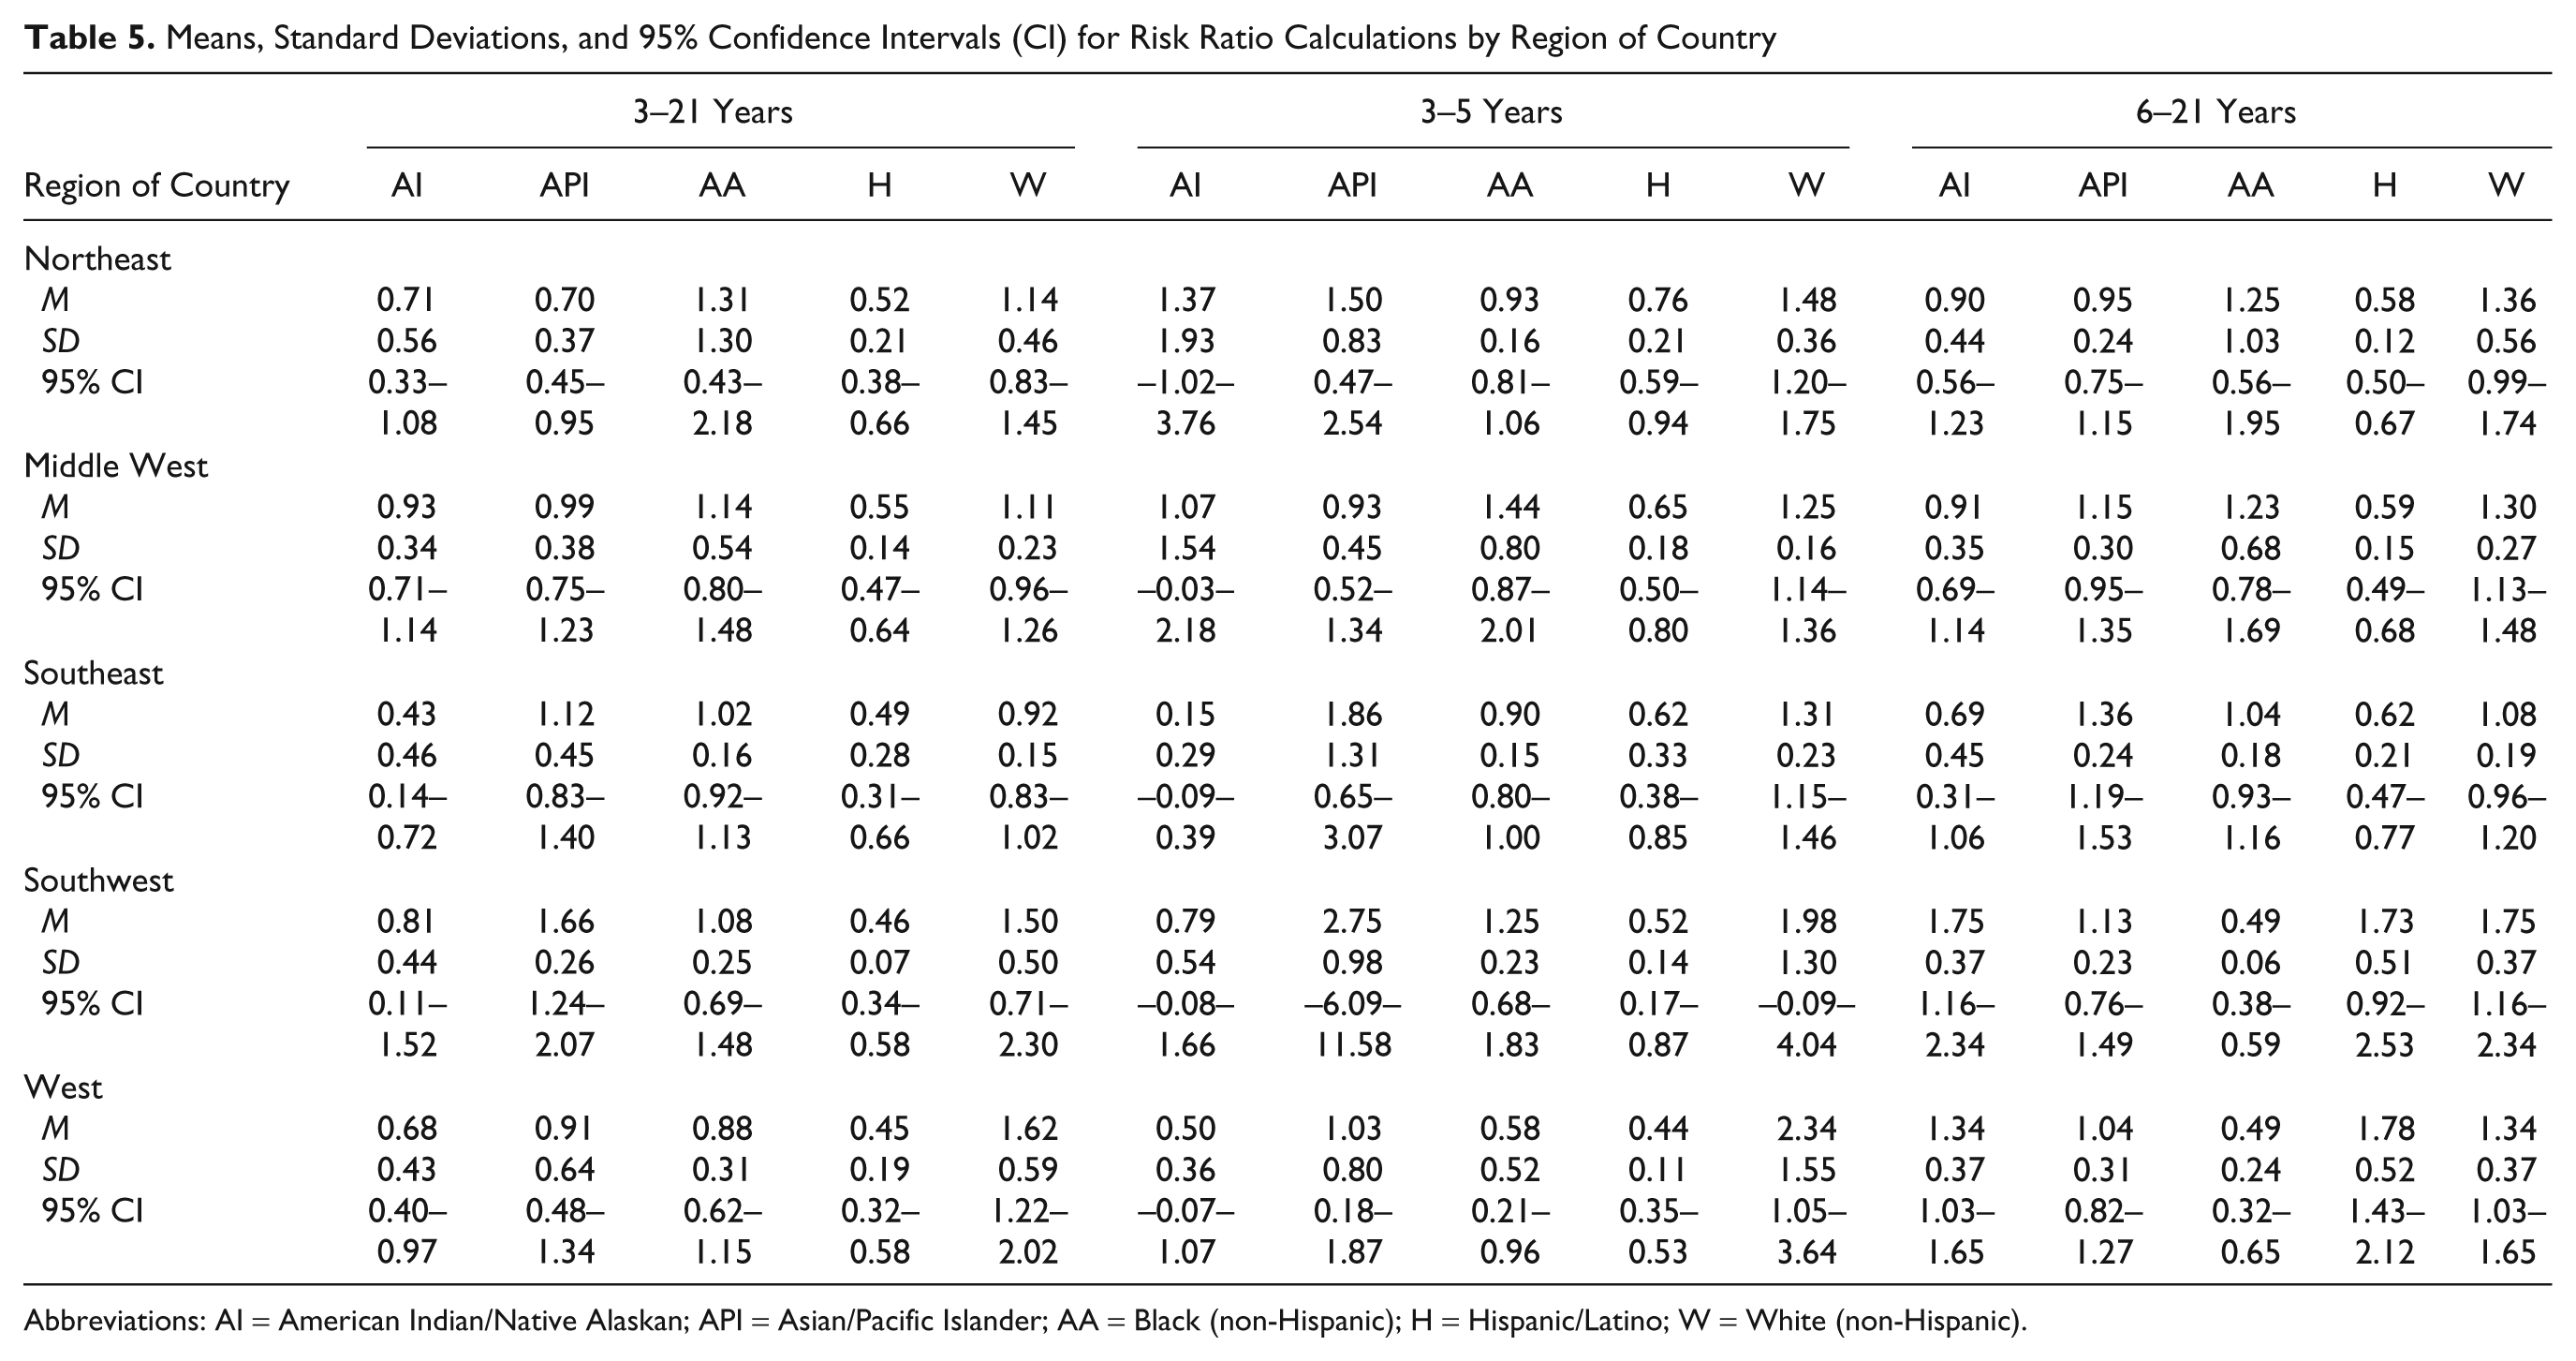
Abbreviations: AI = American Indian/Native Alaskan; API = Asian/Pacific Islander; AA = Black (non-Hispanic); H = Hispanic/Latino; W = White (non-Hispanic).
Pairwise comparisons revealed that in the entire sample of 3 to 21 year olds the RR was associated with significantly lower disproportionate representation for Asian students in the Northeast than that which occurred in the Southwest (p < .01). In sum, the average RR for children and youth was highest in the Southwest (M = 1.66) and the lowest in the Northeast (M = 0.70) for this ethnicity. Also, the RR was significantly lower for Caucasian students living in the Southeast than that which occurred in the West (p < .01). The average RR for Caucasian students was highest in the West (M = 1.62) and lowest in the Southeast (M = 0.92). Pairwise comparisons for preschool-aged children indicate significant differences for children from African American backgrounds in the Middle West and West regions of the country. The RR for children from this ethnicity was greatest in the Middle West (M = 1.44) and lowest in the West (M = 0.58). Bonferroni pairwise comparisons yielded significant differences for school-aged children and youth from Asian/Pacific Island backgrounds in the Northeast and Southwest regions of the country (p < .01). The data indicated that significantly fewer children from Asian/Pacific Island backgrounds were eligible for an autism eligibility in the Northeast (M = 0.95) and significantly more were found eligible in the Southwest (M = 1.75). School-aged children from Caucasian backgrounds were significantly less eligible under an autism label in the Southeast (M = 1.08) than in the West (M = 1.78).
Discussion
The purpose of this study was to investigate ethnic differences in children and youth receiving special education serves under an autism eligibility as reported by individual states to the USDOE during the 2007-2008 school year. Additional factors of region of country and a state’s use of a developmental delay label for children under age 9 were also investigated. Results from this study indicate that ethnic disparities are found in receipt of this eligibility label. The main finding indicates that 80% of states report underrepresentation of children and youth from all ethnicities under an autism eligibility. Ethnic enrollment in special education under an autism eligibility proportionally in line with the general population percentages occurs in only 15 to 20% of states reporting data. Children from Hispanic backgrounds are especially underrepresented in this eligibility category, with this disparity occurring in almost 95% of states; only 5% of states enroll children from Hispanic backgrounds proportionally to their percentage in the general population. These data may indicate systemic problems with identifying this group of children and youth within the autism spectrum, which is especially troubling considering this is the fastest growing population in the United States (U.S. Census Bureau, 2001). This is consistent with other data indicating that Hispanic children are underrepresented in special education as a whole (Parrish, 2002) as well as in autism spectrum disorders using both the medial model (Baio et al., 2009; CDC, 2007a, 2007b, 2009; Mandell et al., 2009; Rice et al., 2009; Williams et al; 2009; Yeargin-Allsopp et al., 2003) and the educational model (Dyches et al., 2004; Morrier et al., 2008).
Autism was once considered a low-incidence disability eligibility category (C. Rice, personal communication, October 28, 2009), even though medical professionals and school psychologists are able to determine a child’s eligibility for educational purposes. Although medical professionals and school psychologists use differing criteria to determine autism (i.e., DSM-IV-TR vs. Individuals With Disabilities Education Improvement Act, 2004), both use behavioral observations and some element of personal perception and individual impression to come to the final call of “autism.” The results of this study support previous findings that ethnic disproportionality does occur within this eligibility category (Dyches et al., 2004; Mandell et al., 2009; Morrier et al., 2008). With the reported increases in prevalence of ASDs (CDC, 2007b, 2009; Kogan et al., 2009), it is important for educators to examine the effects of ethnicity on their determination of an autism eligibility. Although receipt of a medical diagnosis of a pervasive developmental disorder (APA, 2000) differs from an educational eligibility of autism (Individuals With Disabilities Education Improvement Act, 2004), educators must pay careful attention to the ways in which the interface of ethnicity and assessment plays into determining a child eligible for special education. These differences could explain variations in autism identification in ethnically diverse students and require further investigation.
Examination of the data reported to the USDOE indicates that state variability within the data reported is great. Individual state differences in the proportion of ethnically diverse children vary from underrepresentation to overrepresentation. This could be due to the manner in which individual states determine eligibility under autism. The federal special education legislation provides a minimum guideline for states to follow, although states are able to interpret these guidelines differently. Although beyond the scope of this research, the individual eligibility criteria within each state may play a role in the results found here. For example, the Individuals With Disabilities Education Improvement Act (2004) gives states the option of using a DD label for children until their 9th birthday. At that time, departments of special education must use one of the 12 remaining categories to continue special education support. Because not all states have elected to use this eligibility category, that requires them to classify children under the remaining 12 categories, resulting in diagnostic substitution. This may be especially true for children and youth who are later diagnosed with Asperger syndrome or pervasive developmental disorder–not otherwise specified but receive a special educational eligibility of learning disability or emotional or behavioral disturbance.
Although not examined in this investigation, the personnel involved in and the assessments used by school systems may play a large role in the results presented here. Previous research indicates that a variety of school personnel with different backgrounds rely on the Childhood Autism Rating Scale to determine an autism eligibility (Baio et al., 2009; Rice et al., 2009), which may result in school assessment teams missing some of the more subtle signs associated with ASD that can be picked up by use of the ADOS or a parent interview (i.e., ADI-R), neither of which are tied to the DSM-IV-TR criteria for pervasive developmental disorders. Considered the gold standard for receiving a medical diagnosis of ASD, the ADOS and ADI-R require a considerable amount of training to administer, score, and interpret them correctly, whereas the Childhood Autism Rating Scale is relatively easy and quick to administer and score. The degree to which autism specialists and autism-specific services are available to families and educators may also play a role in the likelihood of qualifying children under an autism eligibility because many regions of the country have few individuals trained to make this distinction and/or places to access best practice placements (National Research Council, 2001). Further investigations into the type of professionals and assessments used to identify students from ethnically diverse backgrounds in public schools and the relationship to disproportionate representation is warranted.
Variations in autism eligibility rates between ethnic groups could have been influenced by the professional conducting the eligibility evaluation. States that are more rural could have less exposure to professionals who are knowledgeable in best practices for diagnosing autism (e.g., ADOS, and ADI-R) as well as ethnic differences in behavioral symptomology associated with autism (e.g., cultural variations in children’s use of eye contact with adults). The effects of the availability of qualified autism professionals in the school systems was a variable that could not be investigated in this dataset and should be investigated further to see how that influences disproportionate representation of ethnically diverse students under an autism eligibility.
Limitations
There are several limitations to this study. First, federal guidelines allow states to suppress data categories that contain four or fewer children to protect child privacy (M. Brauen, personal communication, October 18, 2007). Data suppression and aggregation of data did not allow investigations of within- or across-state factors such as large numbers of diverse learners, urban versus rural status of district, and large versus small individual district size; nor did they allow for investigation of specific child factors such as gender, socioeconomic status, linguistic diversity, within-group ethnic diversity, or immigration status. Although some states’ data were limited, the large sample size (n = 295,945) provided sufficient power to reduce Type I and Type II errors, making results interpretable and reliable.
A second limitation is the lack of data provided on the exact ethnic origin of children in the same as well as other medical conditions (e.g., genetic mutations) that could have played a role in these results. Assuming that prevalence rates for ASD are not equal among all ethnic groups (Barnevik-Olsson et al., 2008), the differences between rates would be expected. Although previous research indicates that ethnicity does play a role in underrepresentation and overrepresentation of ethnically diverse children with ASD (CDC, 2007b, 2009; Mandell et al., 2009), without knowing specific medical histories of the children (e.g., genetic abnormalities, seizures, etc.), these data should be taken with caution because there are some instances where the cause of the ASD can be determined (Morrow et al., 2008; Rutter, 2005). Regardless, this investigation centered on the rates of receiving an autism eligibility as reported by the state school system; the “cause” of the ASD was not under investigation.
A third limitation is the use of state special education data reported as an aggregate, which allowed for gross analyses of the data provided. The use of aggregated data diminished the ability to track children according to all variables under consideration. For example, the researchers could not report on the exact number of Black, 4-year-old males in the State of Virginia. These gross aggregate analyses may mask true within- and across-state differences and variability (e.g., district level factors) in disproportionate representation data for this eligibility category.
A fourth limitation is that the investigators could not confirm the autism eligibility nor determine if a specific medical diagnosis within the autism spectrum was made prior to eligibility determination. Without direct confirmation of eligibility requirements, some children may be placed under an autism eligibility that do not necessary meet eligibility criteria, although this limitation is also minimized by the large sample size.
A final limitation is that eligibility requirements differed across the states evaluated. Federal legislation provides requirements for determining special education eligibility for autism (Individuals With Disabilities Education Improvement Act, 2004). Individual states are then allowed to determine their own autism eligibility requirements as long as the standards do not go below federal guidelines. This allows each state to qualify children under an autism eligibility in a unique manner (Danaher, 2004; Müller & Markowitz, 2004). For example, children qualifying for an autism eligibility in Georgia may not qualify for such an eligibility in Tennessee.
Future Research Suggestions
The data reported in this investigation should be viewed as a first look at disproportionate representation in receipt of an autism eligibility in public school systems. It will be important to conduct future studies using variables that were not included in this study. Analyses using modeling approaches (e.g., hierarchical linear modeling, structural equation modeling) may benefit this area by examining factors not related to the statewide data available to these researchers. Areas needing further study include impact of socioeconomic status on eligibility, trends of disproportionate representation over time, especially pre-NCLB and post-NCLB (2001) mandates, and urban versus rural residence.
The role of disproportionate representation in autism is a relatively new area of research; therefore, time trends should be further investigated. It would be especially important to see how federal mandates such as Individuals With Disabilities Education Improvement Act (2004) and NCLB (2001) influence not only the rates over time but the educational placements received by children with an autism eligibility. These analyses would assist in determining whether placement is a factor that is considered when determining eligibility for special education. Calculations of pre-IDEA/NCLB rates and post-IDEA/NCLB rates would show how these federal mandates are being implemented in public school systems. Trends over time would also allow for child cohort–specific calculations to be monitored as children progress through the education system (Bollmer et al., 2007). For example, tracking 4 year olds in 2006, who are 5 years old in 2007 and 6 years old in 2008, would assist with seeing if positive or negative trends are occurring. It would also assist with answering how many new children are being identified under an autism eligibility over time. Investigation into how disproportionate representation has been influenced by district level mandates (Bollmer et al., 2007) would also be important to minimize the bias included in aggregated data. Looking at disproportionate representation figures in urban versus rural districts may allow for closer inspection of what is occurring within each state individually.
Finally, investigating how overrepresentation and underrepresentation of ethnically diverse children and youth under an autism eligibility as compared to the overall special education population should be investigated. This investigation would assist in determining if disproportionate representation is specific to the autism eligibility or if it is more of a systemic problem within the special education system as a whole. Investigations into trends by state, region of country, use of the DD eligibility category, and children’s linguistic backgrounds would assist with this determination.
Footnotes
The author(s) declared no potential conflicts of interest with respect to the authorship and/or publication of this article.
The author(s) received no financial support for the research and/or authorship of this article.