






Abstract
The study explored the relationship between L2 utterance fluency and perceived fluency in monologic and dialogic speaking. A total of 136 Chinese university English learners with diverse L2 proficiency levels and three experienced raters participated in the study. The study employed a mixed-methods approach integrating quantitative (regression analysis) and qualitative (stimulated recalls) analyses. In the monologic task, all utterance fluency dimensions (speed, breakdown, and repair fluency measures) significantly predicted perceived fluency ratings, except for filled pause rate and false start rate. Breakdown fluency measures, particularly silent pause measures, had the most substantial impact on perceived fluency ratings. In the dialogic task, breakdown fluency emerged as the sole significant predictor for perceived fluency scores, overshadowing the predictive impact of speed and repair fluency measures. The temporal measure of turn-taking did not significantly affect perceived fluency scores. Stimulated recalls were generally consistent with the quantitative results and revealed additional factors—content quality, pronunciation, and comprehensibility—that influenced fluency perceptions. The study highlighted the contextual effect on the relationship between utterance fluency and perceived fluency, suggesting that L2 speaking proficiency rating rubrics should be adjusted to account for differences between monologic and dialogic speaking.
1 Introduction
Achieving high-level speaking fluency is a primary goal for many L2 learners (Lintunen et al., 2020; Yan, 2015) and is a foundational aspect of assessing speaking proficiency (Ginther et al., 2010). According to China’s College English Teaching Guidelines (2020 Edition), improving spoken fluency is a key objective, with students expected to communicate fluently on topics of public interest and their academic fields. Similarly, the Common European Framework of Reference for Languages (CEFR) emphasizes fluency as a critical component of L2 proficiency, defining it as the ability to “express oneself at length with a natural, effortless, unhesitating flow” (Council of Europe, 2020, p. 142).
Listener-based judgments of fluency are vital in language assessment contexts (Suzuki et al., 2021). In fact, the rating scales of many language tests (e.g., International English Language Testing System [IELTS]) have included fluency as a crucial aspect for raters to consider when assessing speaking proficiency. Gaining a deeper understanding of how speech characteristics relate to these judgments is thus essential for creating research-informed rating rubrics and improving automated scoring accuracy for L2 speaking proficiency.
In L2 fluency research, listener-based judgments are referred to as perceived fluency, while the temporal features of speech are termed utterance fluency (Segalowitz, 2010). Many researchers have been dedicated to investigating the relationship between utterance fluency and perceived fluency. However, most research has focused on this relationship within monologic speaking, with little attention given to dialogic contexts. Considering the significant differences between monologic and dialogic speaking, particularly in turn-taking mechanisms, the relationship may differ across these contexts (McCarthy, 2010; Peltonen, 2017). Methodologically, previous studies have mainly used a quantitative approach to model the relationship between the utterance fluency measures and perceived fluency ratings (e.g., Bosker et al., 2013; Kahng, 2018), with only a few collecting qualitative data on rater/listener perceptions (Préfontaine & Kormos, 2016). As Peltonen and Lintunen (2016) suggested, a comprehensive analysis of L2 fluency should integrate quantitative data with qualitative insights. Therefore, this study adopts a mixed-methods approach to advance the knowledge of the relationship between utterance fluency and perceived fluency in both monologic and dialogic speaking.
2 Literature review
2.1 Definitions of L2 utterance fluency and perceived fluency
Fluency along with complexity and accuracy constitute the principal components of L2 performance and proficiency (Housen et al., 2012). Specifically, “fluency is mainly a phonological phenomenon, in contrast to accuracy and complexity, which can manifest themselves at all major levels of language structure and use” (Housen et al., 2012, p. 5). Skehan (2003) reviewed measures of speech fluency in L2 studies and conceptually classified them into three categories: speed, breakdown, and repair fluency. This classification has provided a foundational framework for understanding and measuring L2 speech fluency. Building on this, Tavakoli and Skehan (2005) modeled these observable speech features to uncover the underlying structure. Their analysis allowed them to clearly distinguish repair fluency from speed and breakdown fluency measures, leading to a three-dimensional model on L2 fluency measurement. Subsequently, Segalowitz (2010) proposed a comprehensive framework of L2 fluency and integrated the three dimensions—speed, breakdown, and repair fluency—into the construct of utterance fluency, which was defined as the temporal characteristics of speech performance that reflect the efficiency of cognitive processes involved in L2 speech production (i.e., cognitive fluency). The term and the measurement model have been widely applied in assessing and analyzing fluency in L2 studies.
Speed fluency, typically measured by articulation rate (AR), reflects the speed at which speech is delivered (Tavakoli & Skehan, 2005). Breakdown fluency is indicated by the frequency and duration of filled and silent pauses (Tavakoli & Skehan, 2005). Filled pauses are non-lexical sounds, such as uh or um in English, while silent pauses are generally defined as periods of silence longer than 200 ms (De Jong & Wempe, 2009; Gao et al., 2025) or 250 ms (De Jong & Bosker, 2013). Some studies have linked pauses at different points in speech to distinct speech-production processes (e.g., Kahng, 2014; Yan et al., 2021). Silent pauses within syntactic units are often thought to be mainly connected to the linguistic encoding process, whereas pauses at the end of utterances are primarily associated with conceptualization issues (e.g., Skehan et al., 2016; Yan et al., 2021). Repair fluency, indicated by repetitions, corrections, and false starts, reflects the speaker’s self-monitoring during speech production (Kormos, 2006).
Although discussions on the definition and measurement of L2 utterance fluency have traditionally focused on monologic speaking contexts, some studies have expanded the scope to include dialogic interactions. McCarthy (2010) argued that while speech fluency reflects the automaticity of retrieving words and language chunks, an interactional dimension must be considered when conceptualizing fluency in dialogue. McCarthy introduced the notion of confluence, which emphasizes the flow of conversation across turn boundaries. This perspective highlights that fluency in dialogue is not solely about individual speakers achieving smooth speech but rather about the collaborative co-creation of conversational flow. Neglecting the interactive dimension in fluency assessment may result in an incomplete understanding of the conversational event. Similarly, Peltonen (2017) proposed the concept of dialogue fluency alongside individual (within-turn) fluency, focusing on the cohesion of turn-taking. Peltonen suggested that measures of interactional competence, such as collaborative completions and other-repetitions, can serve as indicators of dialogue fluency. In addition, dialogue fluency can be assessed through turn pauses, which reveal how effectively speakers coordinate to minimize long silences between their contributions. From a cognitive perspective, utterance fluency in dialogue relies not only on individual speakers’ cognitive processing but also on collaborative cognitive coordination between speakers, which is built on shared understanding (Feng, 2022).
The perceptual dimension of L2 fluency was recognized and proposed by Lennon (1990). According to Lennon, L2 fluency is not only a performance characterized by temporal measures of speech delivery and interruptions, but also an impression formed while listening to the speech. The concept of perceived fluency was later elaborated by Segalowitz (2010), and it was defined as the listener’s subjective assessment of a speaker’s fluency. Specifically, perceived fluency refers to the listener’s perception of how smoothly a speaker communicates in the target language, often measured through ratings on a fluency scale. As assumed by Segalowitz, utterance fluency has direct impacts on perceived fluency. The investigation of the link between utterance fluency and perceived fluency is crucial for understanding what constitutes positive perceptions of L2 fluency in authentic communication.
2.2 Monologic versus dialogic task effects on L2 utterance fluency
Monologic and dialogic speaking are two common forms of oral communication (Tavakoli, 2016). Some studies comparing utterance fluency performance between monologic and dialogic tasks consistently suggest that learners tend to exhibit greater fluency in dialogic tasks than in monologic tasks (Michel, 2011; Tavakoli, 2016; Witton-Davies, 2014). Michel (2011) contended that dialogic speaking imposes less cognitive demand due to the conversational turn-taking. This allows speakers to plan their own responses during their interlocutors’ turns, resulting in enhanced utterance fluency in dialogic speaking. Tavakoli (2016) conducted a study in which two distinct approaches were adopted to measuring L2 utterance fluency in dialogues, differing on the inclusion of turn pauses in the total silence time. Despite the measurement method, the study showed that learners’ utterance fluency performance in the dialogic task consistently surpassed their monologic fluency. Tavakoli claimed that the collaborative nature of dialogic speaking is more favorable to learners’ utterance fluency. This finding was not only evident in cross-sectional studies but was also corroborated by the longitudinal study of Witton-Davies (2014), tracking the development of L2 speakers’ utterance fluency performance in both monologic and dialogic contexts over a four-year period. The results demonstrated that learners stably exhibited better utterance fluency in the dialogic task.
Some research on task-based language learning has also found that task mode (i.e., monologic or dialogic mode) plays a significant role in shaping the relationship between utterance fluency and various learner- and task-related variables. Gilabert et al. (2011) observed that the relationship between proficiency and utterance fluency varies depending on whether the task is monologic or dialogic. Similarly, the impact of task complexity on speech performance has been shown to differ across these two contexts. Wright (2021) also highlighted that factors such as task load and study-abroad experience affect L2 utterance fluency differently in monologues compared to dialogues. In light of these differences between monologic and dialogic modes in utterance fluency, it is reasonable to expect that the relationship between utterance fluency and perceived fluency may vary across the two modes.
2.3 Relationship between L2 utterance fluency and perceived fluency
2.3.1 Studies contextualized in monologic speaking
Most previous studies have focused on the contribution of utterance fluency features to listeners’ fluency perceptions in monologic speaking, applying the numeric fluency score given by raters to indicate perceived fluency (e.g., Bosker et al., 2013; Derwing et al., 2004; Préfontaine & Kormos, 2016). Some studies found that speed fluency significantly contributes to perceived fluency. For example, Bosker et al. (2013) found that the speed fluency measure, mean length of syllable, could predict 54% of the variance in the fluency score. Préfontaine and Kormos (2016) also found that speed fluency measured by AR predicted 55%–66% of the score variance.
Concerning the relationship between breakdown fluency and perceived fluency, earlier studies suggested that breakdown fluency measures had no significant effect on perceived fluency (e.g., Kormos & Dénes, 2004). However, inconsistent findings have emerged from recent studies taking pause locations into account. Kahng (2018) found that the silent pause rate within clauses was strongly correlated with L2 fluency ratings (r = −.75, p < .01). Similarly, Suzuki and Kormos (2020) also suggested that the frequency of mid-clause silent pauses was the most powerful predictor of the perceived fluency score compared to other measures of utterance fluency.
Divergence also exists concerning the relative importance of breakdown and speed fluency in shaping perceived fluency. According to Bosker et al. (2013), the breakdown fluency dimension, including measures of silent pauses and filled pauses, was more important than the speed fluency dimension, predicting 59% of the score variance. In contrast, Préfontaine and Kormos (2016) implied that the breakdown fluency measures, including mean silent pause duration and silent pause frequency, were less effective in predicting perceived fluency than speed fluency.
Regarding the role of repair fluency measures, previous studies seem to agree on its weak role in predicting the perceived fluency score. For instance, Bosker et al. (2013) reported that repair measures, including frequency of repetitions and corrections, only contributed little to fluency ratings. The studies before Bosker et al. had not even revealed any significant relationship between repair fluency measures and the perceived fluency score (Derwing et al., 2004; Kormos & Dénes, 2004). Despite these consistent findings, almost no studies conducted separate examinations of the contributions of different repair types, such as repetitions, corrections, and false starts. Instead, they typically employed a single frequency measure of all repairs (Kormos & Dénes, 2004; Suzuki & Kormos, 2020). However, different repair behaviors may reflect problems with different speech production processes (Williams & Korko, 2019). It is thus imperative to investigate the impacts of various repair fluency measures on perceived fluency.
In addition to quantifying perceived fluency through subjective numeric ratings, only a few studies have gone further by collecting written comments from listeners (Kormos & Dénes, 2004; Lehtilä et al., 2024; Préfontaine & Kormos, 2016; Rossiter, 2009). These comments were analyzed qualitatively to gain insights into the specific speech features that influenced perceptions of fluency. Kormos and Dénes (2004) suggested that both the native and non-native listeners attached importance to speed, silent pauses, and corrections when rating speakers’ L2 fluency. Beyond these aspects, the raters also considered other linguistic aspects, including linguistic accuracy and lexical diversity. Rossiter (2009) and Suzuki and Kormos (2020) also reported that speed and pauses were commented most frequently when rating L2 fluency, and both temporal and non-temporal speech features could shape L2 fluency perceptions. These findings were further corroborated recently by Lehtilä et al. (2024). Their study uniquely examined the influence of L1 fluency perceptions on L2 fluency assessments by providing listeners with speakers’ L1 speech samples prior to L2 samples. Listeners were then asked to assess the speakers’ L2 fluency and comment on the helpfulness of hearing L1 speech samples in their evaluations. Lehtilä et al. found that listeners attended more to speed and breakdown fluency features than to repairs in L1 speech when assessing L2 fluency. In addition, they found that listeners also considered non-temporal features, such as vocabulary choice in L1 speech, indicating that L1 and L2 perceived fluency may be influenced by a similar set of utterance fluency features.
A qualitative study by Préfontaine and Kormos (2016) revealed different insights from the studies reviewed earlier. They found that strategically placed silent pauses were not perceived as signs of disfluency. In addition, filled pauses and corrections could even enhance the naturalness of speech, leading to more positive fluency impressions. Importantly, the way raters are instructed to rate fluency may have influenced their reflective comments on how they perceive and evaluate fluency. For instance, in the study by Préfontaine and Kormos (2016), raters were not provided with a specific rating guide directing their attention to temporal features of speech, which may have led to a broader interpretation of fluency. In contrast, other studies (e.g., Lehtilä et al., 2024; Rossiter, 2009) explicitly instructed raters to focus on temporal aspects of speech, which likely shaped their qualitative comments to emphasize these features. Overall, these qualitative insights highlight the complexity of fluency perceptions and suggest a need for more qualitative data to deepen our understanding of the specific speech features that shape these perceptions.
2.3.2 Studies contextualized in dialogic speaking
The studies reviewed earlier were all contextualized in monologic speaking tasks. The link between L2 utterance fluency and perceived fluency in dialogic speaking has only been addressed in very few studies.
Sato (2014) adopted a qualitative method to investigate the link in both monologic and dialogic speaking. Four native student raters listened to 16 monologues and eight dialogues in L2 English. They were instructed to verbally report the aspects they considered important to their fluency ratings. All their verbalizations were recorded and subject to qualitative analysis. Sato discovered that the raters’ perceptions of individual fluency in the dialogic task were impacted not only by temporal features such as delivery speed and silent pauses but also by interaction-specific features like turn-taking and scaffolding. However, as Sato pointed out, the learner participants involved in the study were homogeneous in low speaking proficiency. Therefore, findings may not be generalizable to a broader population of L2 learners with a more diverse range of proficiency levels. Furthermore, the collection of verbal feedback from the listeners was conducted in group settings, potentially masking individual differences in the raters’ perceptions of fluency.
Peltonen (2022) focused on perceived fluency in L2 English dialogic speaking. The raters first scored each individual’s fluency performance in dialogues. Subsequently, the raters assigned a score specifically for the interaction between the speakers, resulting in a joint score given to the pair for their performance on interaction. Peltonen found that while the individual fluency score was strongly correlated with measures of utterance fluency, the interaction fluency score was only related to turn pause duration (TPD). A qualitative analysis of the rater comments indicated that when rating individual fluency, the raters attached importance to temporal aspects such as speed, hesitations, and corrections. When rating the learners’ cooperative performance, themes such as turn-taking and collaboration emerged. The research highlighted the possible role of turn-taking behavior in shaping fluency perceptions in dialogues. However, it is still challenging to determine whether perceptions of individual fluency in a dialogue were related to the speaker’s turn-taking behavior.
Van Os et al. (2020) exclusively examined the effects of temporal features of turn-taking on perceived fluency in dialogic speaking. They manipulated the time intervals between questions and answers in recorded L2 Dutch conversations and then invited ratings on these dialogues from native raters. The results suggested that especially for speakers who had a slower speech delivery, the extended silent pauses preceding their responses to their interlocutors led to disfluency perceptions. Although Van Os et al. claimed that the artificially manipulated speech closely resembled the natural speech, it is important to note that the real-life communication is not as straightforward as posing a question and providing an answer. Therefore, there remains a need to re-examine the findings within the context of natural dialogues between L2 learners.
3 The current study 1
To bridge the gaps in research on the relationship between L2 utterance fluency and perceived fluency, the current study examined L2 speech performance in both monologic and dialogic contexts. Specifically, the study was guided by two research questions (RQs):
RQ1. To what extent do L2 utterance fluency measures predict perceived fluency ratings in monologic speaking, and what factors influence raters’ fluency judgments as revealed through stimulated recall?
RQ2. To what extent do L2 utterance fluency measures predict perceived fluency ratings in dialogic speaking, and what factors influence raters’ fluency judgments as revealed through stimulated recall?
This study made several crucial methodological modifications, building on previous studies. First, a range of measures of L2 utterance fluency were applied and a finer differentiation within the dimension of repair fluency were made. Second, alongside the quantitative analysis, the study employed the stimulated recall method to qualitatively explore raters’ perceptions of fluency. This method is effective in prompting participants to articulate their thoughts during a task or event (Mackey & Gass, 2016). It involves presenting visual or auditory cues to trigger the recall of mental processes that occurred during the event, making it potentially more effective than relying solely on post hoc written comments, which depend on raters’ unprompted memory. Finally, to statistically examine whether turn-taking behavior affects the perception of individual fluency in peer interactions, a temporal measure reflecting the smoothness of turn-taking was included as a predictor in modeling the relationship between L2 utterance fluency and perceived fluency in dialogic speaking. This measure, the mean duration of turn pauses, has been used in previous studies on L2 fluency in dialogues (Peltonen, 2017, 2022; Tavakoli, 2016). Because the mean duration of turn pauses is a feature of co-constructed dialogue (McCarthy, 2010), speakers in a dialogue were assigned the same value for this measure.
4 Method
4.1 Participants
4.1.1 L2 learners
The study included 136 Chinese English learners from a public university in Southeastern China. Participants consisted of first-year non-English majors, second-year English majors, and fourth-year English majors, with their English proficiency levels estimated to span from lower intermediate to advanced. An elicited imitation task (EIT) was employed to assess their L2 proficiency (see Instruments section for more details). As Figure 1 illustrates, scores on the EIT ranged from 15 to 107 out of 120, reflecting a wide range of L2 levels. Before the experiment, all participants completed an online consent form and a questionnaire detailing their biographical information and language learning experiences. Speech samples with poor sound quality, such as extremely faint voices or complete silence, were excluded from the analysis. The monologic data were obtained from 108 participants (92 females; Mage = 19.9, SD = 1.3), and the dialogic data were collected from 106 participants (96 females; Mage = 20.0, SD = 1.4).
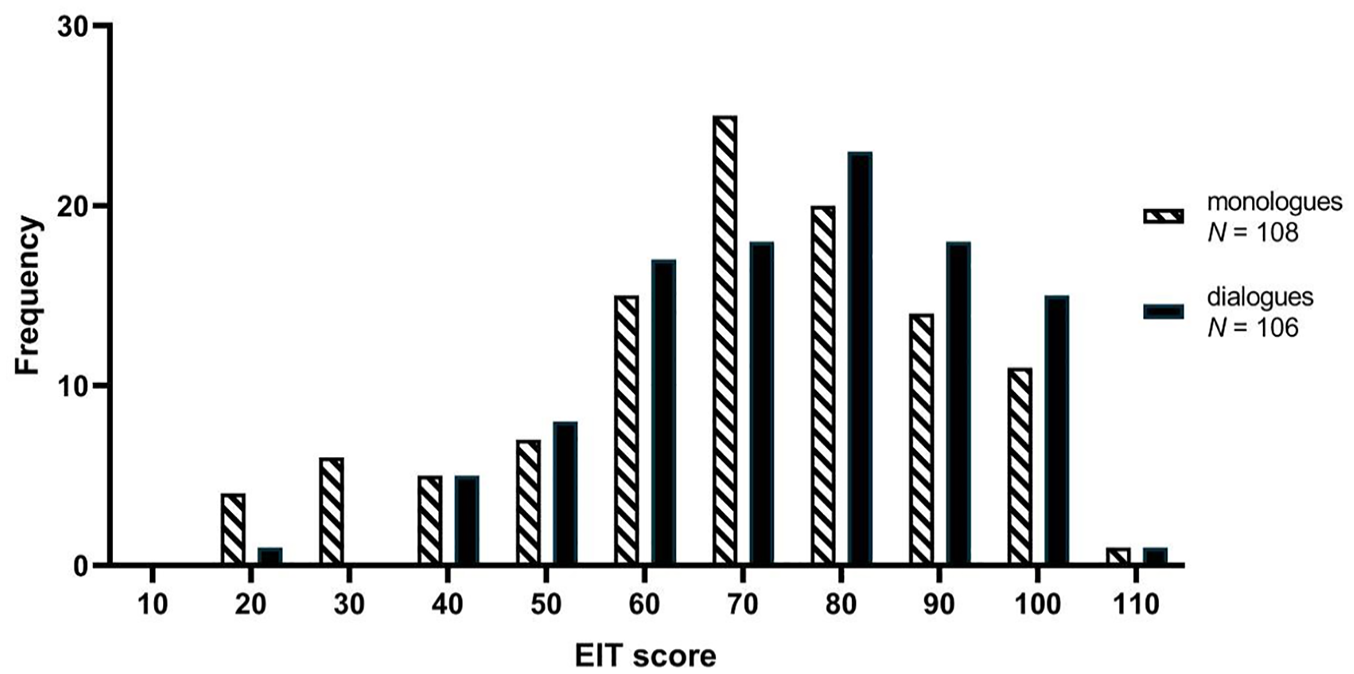
Distribution of participants’ EIT scores.
4.1.2 Raters
Three raters (two females, one male) participated in the study. All were PhD and MA students specializing in language testing and Second Language Acquisition (SLA), with a strong background in applied linguistics. In addition, the raters were proficient English speakers with a C1 level on the CEFR scale and had extensive experience in evaluating L2 English speech of Chinese students. This study’s decision to use L2 speakers as raters is consistent with the approach taken in previous research (e.g., Lehtilä et al., 2024; Peltonen, 2022; Rossiter, 2009). As English continues to be used more frequently by L2 speakers globally, their perspectives have become an essential consideration in SLA research (Rossiter, 2009). The raters’ detailed biographical information is presented in Table 1.
Biographical Information of the Rater Participants.

Note. CET-SET = College English Test-Spoken English Test (a national English test for college students in China); TOEFL = Test of English as a Foreign Language; IELTS = International English Language Testing System.
4.2 Instruments
4.2.1 Task for L2 English proficiency
We adopted the EIT developed by Ortega et al. (2002) to infer participants’ L2 proficiency. The task has been validated by Wu et al. (2022) as a short-cut measure of L2 English proficiency. In an EIT, participants are required to listen to sentences in the target language and accurately repeat them. The task involved 30 English sentences of different lengths, ranging from 7 to 19 syllables. Participants listened to these sentences in order, starting with the shortest. As designed by Ortega et al. (2002), a ring tone signaled participants to begin repeating each sentence 2.5 s after it concluded. Participants were allowed up to the native speakers’ average articulation time plus 2 additional seconds to repeat the sentence. A practice session with four Chinese sentences was conducted at the outset to ensure participants understood the procedure.
Each EIT performance was rated on a scale of 0 to 4 based on how accurately the participant repeated the target sentence, using the rating scale developed by Ortega et al. (2002). Thirty (22.1%) out of 136 speech samples were randomly selected and independently rated by the first author and a research assistant. The inter-rater reliability indicated by the intraclass correlation coefficient (ICC) using a single-measurement, absolute-agreement, two-way random-effects model was .98, 95% CI = [.97, .99]. The first author then rated the remaining speech samples, and the final EIT score for each participant was based on the first author’s ratings.
4.2.2 L2 monologic and dialogic speaking tasks
In collaboration with an experienced college English teacher, the first author designed the monologic and dialogic tasks, modeled after those in the CET-SET, to elicit participants’ L2 speech based on personal experiences. In the monologic task, participants shared their opinions and reasons on the importance of a specific constructive behavior, such as environmental protection. For the dialogic task, participants paired up and imagined organizing a lecture on the same topic (e.g., protecting the environment). They discussed details such as the lecture venue, potential speakers, and their suggestions on the topic. The tasks used in the study focused on keeping healthy (see Supplemental File 1 for prompts). Time allocation followed CET-SET guidelines: For the monologic task, participants had 45 s to prepare individually and 1 min to speak. For the dialogic task, participants were given 1 min to prepare in pairs and 3 min to speak. To mitigate the time pressure effect on speech performance, participants were informed that they could speak overtime if they had not finished their response within the given time.
It is noteworthy that the monologic task in this study was open-ended, consistent with some prior research (e.g., Kahng, 2018; Suzuki & Kormos, 2020), unlike studies using picture-based tasks (e.g., Kormos & Dénes, 2004; Préfontaine & Kormos, 2016). Picture-based tasks, although common in L2 studies, may impose higher cognitive demands. Participants must first comprehend and organize visual information, which increases processing burden and potentially hinders lexical access and formulation (Gagné et al., 2025; Gao & Sun, 2024; Tavakoli & Wright, 2020). In contrast, open-ended tasks (e.g., interviews or personal narratives) allow learners to rely on their own knowledge, facilitating more fluent cognitive processing and eliciting more natural speech. Although differences in cognitive demand between closed and open-ended tasks may exist, a recent meta-analysis by Suzuki et al. (2021) suggested that these differences do not significantly affect the relationship between L2 utterance fluency and perceived fluency. Therefore, our study remains comparable with studies using closed tasks, as the core measures of fluency are consistent across task types.
4.3 Data collection
4.3.1 Collecting data from learner participants
Participants were situated in a multimedia classroom, each equipped with headphones and a computer monitor. The EIT was administered first, with audio stimuli played through a central computer and transmitted to participants via headphones. Their responses were automatically recorded, and the task took approximately 8 min. EIT performances were immediately rated within 1 week. Following the EIT, participants completed the L2 monologic task in the same classroom, with their speech recorded through the headphones.
A week after the monologic task, participants were paired for the dialogic task based on their EIT scores, with most pairs (86.8%, N = 46) having score differences of 0 to 4, indicating similar proficiency levels. A smaller proportion of pairs (11%, N = 6) had score differences between 5 and 8. Only one pair had a larger score difference of 18, both with low EIT scores of 39 and 21. The task was conducted with each pair of participants in a quiet classroom, with the conversation recorded by the first author or an assistant and later reviewed for balanced participation. Following Tavakoli (2016), conversations were excluded if one speaker dominated for more than 70% of the time or if one remained silent for extended periods. In addition, each participant had to contribute at least two turns within the 3-min dialogue. Fourteen participants (seven conversations) were excluded from analysis following the criteria.
4.3.2 Collecting data from raters
To obtain a comprehensive view of perceived fluency, both ratings and stimulated recall data were used. The three raters conducted two rounds of ratings and stimulated recall sessions. The timeline is shown in Figure 2. The raters were initially given one week to score participants’ L2 monologic speech. Afterward, individual stimulated recall sessions were held to gather detailed perceptions of fluency. Two weeks later, the raters rated participants’ dialogic performance, followed by the second round of recall sessions. This interval helped reduce potential bias from the monologic assessments on the dialogic ratings.
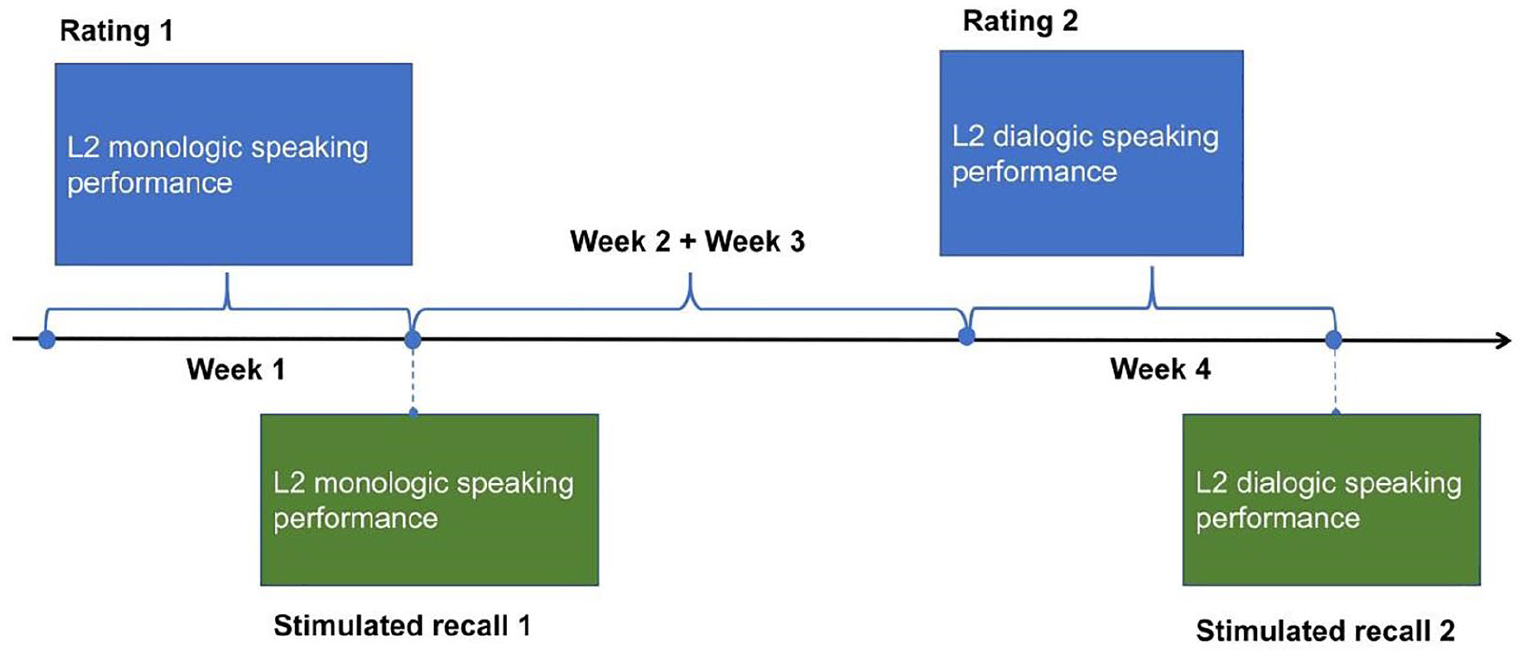
Timeline of data collection from the raters.
The speech samples were rated on a 9-point scale, following practices of studies on perceived fluency (e.g., Bosker et al., 2013). Participants’ speech recordings were uploaded to an online repository, allowing raters to independently access and evaluate the recordings. The raters were provided with two guides—one for monologic and one for dialogic speech—adapted from Van Os et al. (2020) (see Supplemental File 2). These guides clarified the distinction between fluency and speaking proficiency. The raters were instructed to assess various aspects of utterance fluency, such as speech speed, pauses, repetitions, and reformulations, without being given specific criteria for fluency. They were reminded that the samples came from learners with varying L2 proficiency and were encouraged to use the full scale, where 1 indicated extremely low fluency and 9 indicated extremely high fluency. The raters were also asked to listen to the entire speech sample before making their judgment. As our study focuses on how individual utterance fluency in a dialogue influences perceived fluency ratings, the rating guide for the dialogic task was designed to align with that of the monologic task. Specifically, we did not include explicit instructions for raters to focus on dialogic-specific features, such as turn pauses or interactional fluency, in line with the approach taken by Van Os et al. (2020). This design also allowed us to naturally observe whether perceived fluency in the dialogic task was influenced by turn-taking behavior. During the rating process, the transcriptions of speech samples were not accessible to the raters so that the perceived fluency score was only dependent on the raters’ listening of participants’ speech. The inter-rater reliability was indicated by ICC based on a mean-rating (k = 3), consistency, two-way random-effects model: for the ratings of monologic speech, ICC = .81, 95% CI = [.74, .87]; for the ratings of individual speech in the dialogue, ICC = .80, 95% CI = [.73, .86]. The results indicated moderate to good reliability (Koo & Li, 2016).
A subset of L2 monologic and dialogic samples (N = 12) was randomly selected for stimulated recall analysis, comprising two pairs from non-English majors, two from second-year English majors, and two from fourth-year English majors. Following procedures from May (2011) and Wei and Llosa (2015), the raters first listened to the complete speech sample, assigned a score, and provided general comments on fluency performance. They then listened again, pausing as needed, to comment on specific speech features affecting their ratings. The raters could use both Chinese and English during recall. They received written instructions and completed a practice session beforehand. The recall sessions took place in a quiet classroom, with each rater providing two sets of data: one for monologic and one for dialogic speaking. In total, we collected 2.4 hr of verbal reports of rating monologic speech (Rater A: 41′46″; Rater B: 58′39″; Rater C: 42′06″) and 2.6 hr for rating dialogic speech (Rater A: 52′15″; Rater B: 48′54″; Rater C: 54′49″).
4.4 Data analysis
4.4.1 Acoustic analysis
We adopted a set of well-established measures to capture utterance fluency across its three dimensions: speed, breakdown, and repair fluency (Gao & Sun, 2023; Huensch & Tracy-Ventura, 2017). Table 2 presents the descriptions of the measures. To ensure a more appropriate analysis of spoken data, the Analysis of Speech Unit (ASU) was employed as the linguistic unit for speech analysis. Specifically, an ASU refers to “an independent clause, or sub-clausal unit, together with any subordinate clause(s) associated with either” (Foster et al., 2000, p. 365). The ASU offers advantages over traditional clause-based methods by more effectively capturing the intricacies of spoken language (Tavakoli & Wright, 2020). Foster et al. (2000) elaborated on the ASU framework, emphasizing its capacity to account for a range of spoken features, including repairs (e.g., false starts, repetitions, and self-corrections) and minimal units (e.g., one-word utterances and echoic responses). These features are often inadequately addressed in clause-based analyses, which can introduce greater subjectivity when annotating spoken transcripts (for a comprehensive discussion, see Foster et al.). The frequency and duration of silent pauses at the middle and end of an ASU were calculated separately in this study.
Utterance Fluency Measures Adopted in the Current Study.

When extracting measures of repair fluency, in addition to repetitions, we made a clear differentiation between the two sub-categories of repair behavior, corrections and false starts, based on the definitions provided by Williams and Korko (2019). A false start was identified as the abandonment of a linguistically standard utterance, immediately followed by its revision, while a correction referred to the endeavor of replacing perceived nonstandard output (e.g., syntax, lexis, or pronunciation). For the dialogic speech, the mean duration of turn pauses (i.e., silences between turns) was calculated. Following Trouvain and Werner (2022, p. 59), a turn pause was defined as a “gap between speakers at turn changes in conversation.”
All speech samples underwent noise reduction and were resampled to 44,100 Hz using Adobe Audition CC 2018. Subsequently, speech samples were automatically transcribed on the Feishu platform (https://www.feishu.cn/en/) and then manually cross-checked to ensure verbatim accuracy. Acoustic analysis was conducted in Praat (Boersma & Weenink, 2020), utilizing De Jong and Wempe’s (2009) script to detect silent pauses of at least 200 ms. The boundaries of silences were manually verified and adjusted using the waveform and spectrogram. Filled pauses and positions of silent pauses were annotated in Praat’s TextGrid files. In dialogic speech, overlapping speaking time was equally allocated to each participant. Repetitions, corrections, and false starts were coded based on the transcriptions. A research assistant and the first author coded 40 transcriptions (20 each for L2 monologic and dialogic speech). The inter-coder reliability indicated by the percentage of agreement was more than 85%. The first author then completed the coding of the remaining transcriptions.
4.4.2 Statistical analysis
To examine the contribution of different utterance fluency features in monologic and dialogic speaking to the perceived fluency score, a hierarchical multiple regression approach was employed. Following the method of Bosker et al. (2013), the individual contributions of each utterance fluency dimension (i.e., speed, breakdown, repair fluency, and the temporal feature of turn-taking behavior in dialogic speaking) to the perceived fluency score were first investigated. The model with the largest adjusted R2 was selected as the basis model. Subsequently, in the hierarchical modeling process, additional predictor variables were introduced to evaluate whether other utterance fluency dimensions added incremental predictive power beyond the basis model. Ultimately, this approach facilitated the identification of the optimal model with the largest adjusted R2, providing insights into the relative importance of each utterance fluency measure in predicting the perceived fluency score. To assess the potential multicollinearity issue, we examined the interrelationships among the utterance fluency measures prior to conducting regression analysis and calculated the variance inflation factor (VIF) for each predictor. In addition, we verified other key assumptions for linear regression, including the normality of residuals, extreme outliers, and homoscedasticity by detecting the distribution pattern of residuals, Q-Q plot of residuals, and Crook distance plot. All models met these assumptions.
4.4.3 Stimulated recall analysis
The qualitative analysis of recall data followed standard methods demonstrated by Mackey and Gass (2016) and Yang et al. (2013). Recordings were automatically transcribed and manually checked, with transcriptions including word-level detail. A bottom-up coding approach was used, aligning with the raters’ language and enhancing content validity (Brod et al., 2009).
Transcriptions were segmented based on focal points, where raters paused to comment during stimulated recall. Thought units within these segments were further divided for detailed analysis. Subsequently, the raters reviewed the transcriptions for accuracy and appropriate segmentation, making adjustments as needed. Aligning with the RQs, the coding process focused on identifying speech features that influenced raters’ perceptions of fluency or disfluency. In the descriptive coding stage, each segmented thought unit reflecting the raters’ perception was coded using concise phrases or sentences such as “fast speed resulted in perception of being fluent.” In the pattern coding stage, these codes were integrated and categorized into two levels: level1 representing broad speech dimensions such as “speaking speed,” and level2 offering detailed descriptions of how specific speech features influenced the raters’ perception, similar to the codes in the descriptive coding stage.
Consequently, two distinct coding schemes were developed for analyzing recalls of monologic and dialogic speech ratings. Inter-coder reliability between the first author and a research assistant was indicated by Cohen’s kappa on a random 20% sample, yielding .87 (p < .001) for monologic and .83 (p < .001) for dialogic speech. The first author then coded the rest transcriptions. The frequency and percentage of each code were calculated to determine the importance of each speech feature in perceived fluency.
5 Results
5.1 Quantitative and qualitative results in the monologic task
The 108 monologic speech samples consisted of an average of 146.6 syllables (SD = 47.5) per sample, with an average speech duration of 71.6 s (SD = 13.6 s). Table 3 presents the descriptive statistics of L2 perceived fluency scores and utterance fluency measures in the monologic task. Table 4 shows the correlations between different utterance fluency measures. Based on the inspection of Q-Q plots, only mid-ASU silent pause rate (MASPR) and end-ASU silent pause rate (EASPR) conformed to the normal distribution. We then computed Pearson correlation coefficients to assess their interrelationship. For the remaining utterance fluency measures, which were non-normally distributed, we used Spearman correlations. Following Plonsky and Oswald’s (2014) benchmarks for correlational effect sizes in L2 research (r = .|25,| small; r = .|40,| medium; r = .|60,| large), we found no strong correlations (r ⩾ .60) among the utterance fluency measures. This suggests that multicollinearity is unlikely to be a significant issue when including these variables in a regression model (Jeon, 2015).
Descriptive Statistics of the L2 Perceived Fluency Score and Utterance Fluency Measures in Monologic Speaking (N = 108).

Correlations Within the L2 Measures in Monologic Speaking (N = 108).

p < .05. **p < .01.
Table 5 demonstrates the results of the models predicting the L2 perceived fluency score using utterance fluency measures. Models 1–3 were constructed each using predictors exclusively from only one of the utterance fluency dimensions. All these models were statistically significant. Specifically, Model 1 comprised of five acoustic measures of breakdown fluency: MASPR, EASPR, mid-ASU silent pause duration (MASPD), end-ASU silent pause duration (EASPD), and filled pause rate (FPR), resulting in an adjusted R2 of .63. Model 2 predicted the perceived fluency score using the repair fluency measures, including repetition rate (RR), correction rate (CR), and false start rate (FSR), and it resulted in an adjusted R2 of .24. Model 3 had the speed fluency measure, AR, as the predictor for fluency ratings (adjusted R2 = .03).
Models Predicting the L2 Perceived Fluency Score Using Utterance Fluency Measures in Monologic Speaking (N = 108).

Model 1, which used breakdown fluency measures as predictors, accounted for the largest variance in perceived fluency. To enhance the model’s predictive capability, repair fluency (Model 4) and speed fluency (Model 5) measures were added, resulting in higher adjusted R2 values of .68 and .66, respectively. Both models outperformed Model 1, with Model 4 showing a slightly higher adjusted R2 than Model 5. The most comprehensive model, Model 6, which included all utterance fluency dimensions, achieved the highest adjusted R2 of .71 and demonstrated a significantly better fit than Model 4. Consequently, Model 6 was selected as the optimal model for predicting perceived fluency in the monologic task. As shown in Table 6, EASPD was the most influential utterance fluency measure, followed by MASPR, MASPD, RR, AR, EASPR, and CR. All these measures negatively correlated with perceived fluency, except for AR. However, FPR and FSR did not significantly predict perceived fluency.
The Optimal Model Predicting the Perceived Fluency Score Using L2 Utterance Fluency Measures in Monologic Speaking (N = 108).

Note. VIF = variance inflation factor.
Table 7 displays the major themes derived from the qualitative analysis of stimulated recall data in the monologic task. These themes were represented by level1 codes, reflecting the general categories of speech features the raters focused on while assessing oral fluency. The raters were particularly influenced by silent pauses (N = 59, 39.6%), followed by repetitions (N = 35, 23.5%), speech speed (N = 29, 19.5%), and reformulations (N = 17, 11.4%), whereas filled pauses received little attention (N = 2, 1.3%). In addition, the raters’ perceptions were influenced by content quality (N = 4, 2.7%) and learners’ pronunciation (N = 3, 2.0%).
Stimulated Recall Data of Rating L2 Fluency in Monologic Speaking.

The level2 codes detailed the specific speech features influencing the raters’ perceptions. The raters tended to infer the cognitive nature of silent pauses and often regarded the silent pauses caused by lexical retrieval problems as signs of disfluency (N = 9, 6.0%). In addition, the raters frequently associated silent pauses and repetitions together when commenting on learners’ fluency (N = 13, 8.7%). They also linked reformulations and repetitions together (N = 2, 1.3%), but not as frequently as the pairing of silent pauses and repetitions. Furthermore, all the raters regarded the use of reformulations as an indicator of disfluency when rating fluency in the monologic task.
5.2 Quantitative and qualitative results in dialogic speaking
For the 106 dialogic speech samples, the total number of syllables averaged 368.6 (SD = 75.1) per sample, with each speaker contributing an average of 184.3 syllables (SD = 70.7). The average duration of the dialogic samples was 166.2 s (SD = 20.8 s), with each speaker’s speech lasting 83.1 s on average (SD = 25.5 s). Table 8 shows the descriptive statistics of the perceived fluency score and utterance fluency measures. The correlations within the L2 utterance fluency measures are presented in Table 9. In the dialogic task, only AR and EASPR data were normally distributed, as determined by the Q-Q plot. Pearson correlation coefficients were thus computed for these measures, whereas Spearman correlations were used for the remaining non-normally distributed utterance fluency measures. Consistent with the findings in the monologic task, no strong correlations (r > .60) were observed within the utterance fluency measures in the dialogic task. This supports the absence of significant multicollinearity concerns in regression modeling (Jeon, 2015).
Descriptive Statistics of the L2 Perceived Fluency Score and Utterance Fluency Measures in Dialogic Speaking (N = 106).

Correlations Within the L2 Utterance Fluency Measures in Dialogic Speaking (N = 106).

p < .05. **p < .01.
Table 10 presents the outcomes of models predicting the L2 perceived fluency score using utterance fluency measures. Following a similar approach to building models in the monologic task, models were first constructed with individual utterance fluency dimensions as predictors. Apart from including measures of breakdown fluency (Model 1), speed fluency (Model 2), and repair fluency (Model 4) as predictors, the temporal measure of turn-taking behavior, mean turn pause duration (TPD), which is specific to the dialogic task, was also included as the predictor in Model 3. All these models were statistically significant. Model 1, incorporating breakdown fluency measures as predictors, demonstrated the largest amount of explained variance in perceived fluency (adjusted R2 = .50), followed by Model 2 (adjusted R2 = .11), Model 3 (adjusted R2 = .07), and Model 4 (adjusted R2 = .06).
Models Predicting the L2 Perceived Fluency Score Using Utterance Fluency Measures in Dialogic Speaking (N = 106).

The study then examined whether adding other utterance fluency dimensions as predictors improved the predictive power of Model 1. Model 5, which included speed fluency, showed a slight improvement (adjusted R2 = .51). Model 6, incorporating turn-taking behavior, and Model 7, adding repair fluency, yielded adjusted R2 values of .51 and .52, respectively. However, statistical comparisons indicated that adding these predictors did not significantly increase the explained variance. The full model, Model 8, with an adjusted R2 of .52, showed no significant improvement over Model 1. Given model parsimony, Model 1, which only included breakdown fluency measures, was considered the optimal model for predicting perceived fluency in the dialogic task. Table 11 shows the order of importance for utterance fluency measures predicting perceived fluency: MASPD, MASPR, and EASPD, all negatively correlated with perceived fluency. However, FPR and EASPR were not significant predictors.
The Optimal Model Predicting the Perceived Fluency Score Using L2 Utterance Fluency Measures in Dialogic Speaking (N = 106).

Note. VIF = variance inflation factor.
Table 12 showcases the major themes resulting from the analysis of stimulated recall data. Based on the frequency of level1 codes, the raters gave most importance to silent pauses (N = 57, 44.5%), followed by speech speed (N = 26, 20.3%), repetitions (N = 21, 16.4%), and reformulations (N = 13, 10.2%). Similar to the finding in the monologic task, filled pauses were considered the least significant (N = 7, 5.5%) when rating learners’ fluency. Apart from utterance fluency features, the raters’ perceptions were also influenced by content quality (N = 2, 1.6%) and comprehensibility (N = 2, 1.6%) of learners’ speech.
Stimulated Recall Data of Rating L2 Fluency in Dialogic Speaking.

Analysis of the level2 codes revealed differences in the raters’ perceptions of utterance fluency features between monologic and dialogic speaking. In dialogic evaluations, only one instance (0.8%) attributed silent pauses to lexical retrieval issues. Unlike in monologic speaking, reformulations were not consistently seen as disfluency indicators; two comments noted that natural reformulations positively contributed to fluency. Similar to monologic speaking, the raters more often associated repetitions with silent pauses (N = 13, 10.2%) than with reformulations (N = 5, 3.9%).
6 Discussion
6.1 RQ1: unveiling the relationship between L2 utterance fluency and perceived fluency in monologic speaking
In the monologic task, all utterance fluency dimensions significantly contributed to perceived fluency. Breakdown fluency measures alone explained 63% of the variance in ratings, with repair fluency adding 5% and speed fluency adding 3%. In the optimal model, EASPD was the most influential predictor, followed by MASPR, MASPD, RR, AR, EASPR, and CR. Except for AR, all other breakdown and repair fluency measures negatively correlated with the perceived fluency score. FPR and FSR had no significant effect. Qualitative analysis aligned with these findings, with themes from raters’ recall data including silent pauses (N = 59, 39.6%), repetitions (N = 35, 23.5%), speech speed (N = 29, 19.5%), reformulations (N = 17, 11.4%), content quality (N = 4, 2.7%), pronunciation (N = 3, 2.0%), and filled pauses (N = 2, 1.3%).
The small amount of variance in perceived fluency ratings explained by AR in the current study contrasts with findings from previous research. For instance, Bosker et al. (2013) found that breakdown fluency measures accounted for the majority of variance in perceived fluency ratings (59%), with mean length of syllables (the inverse of AR) explaining an additional 19% of variance. In contrast, AR contributed only 3% of additional explained variance in our study. This discrepancy may be attributed to the rater background factor. In the current study, all three raters were L1 Mandarin speakers. As Mandarin Chinese exhibits a higher information density and a lower syllable rate (i.e., slower speech) compared to other languages, such as English, French, German, Italian, Japanese, and Spanish (Pellegrino et al., 2011), the Mandarin-speaking raters in our study may have been less sensitive to variations in speech speed when assessing L2 English fluency compared to raters with other L1 backgrounds. In addition, the limited contribution of AR may also stem from the relatively small variance in AR observed in this study (M = 3.3, SD = 0.6). The narrow range of AR values in the speech samples could have constrained its explanatory power in predicting perceived fluency ratings.
The statistical analysis of the optimal model for predicting perceived fluency scores revealed that AR ranked second in importance to ratings, with silent pauses and repetitions being more significant factors. The lower predictive power of speed than silent pauses and repetitions may be attributive to the fact that speech interruptions are more salient to listeners than speech speed (Bosker et al., 2013). A more in-depth analysis of the stimulated recall data provided more valuable insights into how the raters perceived the speed aspect of learners’ speech. Specifically, the raters did not assess speech speed on a simplistic and dichotomous basis. Instead, they considered a spectrum of features related to speech speed, including fast, moderate, and stable rates, while only linking slow speech rates with disfluency (see Table 7). It suggests that speech speed can affect perceived fluency through a variety of means. In addition to delivering speech quickly, maintaining a steady and consistent speech rate is also crucial for inducing positive fluency perceptions. Future studies are encouraged to explore measures of speech rate steadiness and stability, such as pace (i.e., the number of stressed words per min), as proposed by Kormos and Dénes (2004). These measures could complement traditional measures of speech speed and provide a more nuanced understanding of fluency in L2 speech production.
According to the quantitative results, in the monologic task, silent pause measures within the breakdown fluency dimension exerted the most significant influence on perceived fluency. Both MASPR and MASPD possessed greater predictive power than most other utterance fluency measures, corroborating the findings of Kahng (2018) and Suzuki and Kormos (2020). EASPD was the most influential factor predicting the perceived fluency score. These findings suggest that although silent pauses may differ cognitively depending on their position within or at the end of a syntactic unit (e.g., the ASU in this study) (Yan et al., 2025), such differences have limited impact on perceived fluency. The stimulated recall data showed that the raters linked certain silent pauses to L2 speech production issues, with 6% (N = 9) of comments indicating that pauses due to lexical retrieval problems contributed to disfluency. The raters only explicitly noted lexical retrieval issues, aligning with findings by Préfontaine and Kormos (2016). This suggests that silent pauses serve as a window into cognitive processing issues and also highlights listeners’ heightened sensitivity to lexical retrieval difficulties in monologic speaking.
Unlike silent pauses, FPR as another breakdown fluency measure did not significantly affect perceived fluency. In addition, only 1.3% of stimulated recall comments implied filled pauses as indicators of disfluency. This suggests that filled pauses may not be a focal point for raters when assessing fluency. Previous studies did not specifically investigate the role of filled pauses or only focused on the overall effect of breakdown fluency, including both filled and silent pauses (Bosker et al., 2013; Derwing et al., 2004; Préfontaine & Kormos, 2016), which may not accurately reflect their individual impacts on perceived fluency.
Regarding repair fluency, RR emerged as the most influential factor after silent pauses. Both statistical results and stimulated recall data highlighted the strong association between repetitions and negative fluency perceptions. This finding aligns with Rossiter (2009), who identified repetition as a key factor in negative fluency impressions, second only to silent pauses. In addition, in the current study, the rater comments on repetitions frequently co-occurred with comments on silent pauses (N = 13, 8.7%), more often than with reformulations (N = 2, 1.3%). This suggests that in monologic speaking, repetitions may have a similar negative impact on perceived fluency as silent pauses. Although previous studies have not typically emphasized the role of repetitions and have often used a single frequency measure to capture all repair phenomena (e.g., Bosker et al., 2013; Kormos & Dénes, 2004; Suzuki & Kormos, 2020), our findings highlight the potentially distinct role of repetitions compared to other types of repairs in monologic speaking.
Statistically, CR had the least impact on perceived fluency, and FSR did not exhibit any significant impact. During stimulated recall, the raters also less frequently commented on reformulations, compared to silent pauses, repetitions, and speech speed. The results suggest that false starts which represent the attempts to repair problems in conceptualizing may not be crucial to perceived fluency. In addition, the limited statistical effect of corrections may stem from their complex influence on listener perceptions. According to Préfontaine and Kormos (2016), efforts to self-correct linguistic errors can sometimes lead to the perception that the speaker is skilled in the target language, even to the level of sounding like a native speaker. We posit that successful self-corrections in L2 speech might lead to the listener perceiving the speech as more fluent and error-free, and ineffective self-corrections might lead to some degree of disfluency. From a cognitive perspective, the lack of automatization at lower proficiency levels may limit the cognitive resources available for monitoring (Kormos, 2006). As a result, self-monitoring and effective corrections are more likely to be associated with higher proficiency levels, where learners have greater control over their linguistic resources, leading to positive fluency perceptions.
The qualitative analysis of the stimulated recall data revealed that the raters attended to other linguistic aspects in addition to utterance fluency, including content quality and pronunciation. This finding aligns with the study conducted by Suzuki and Kormos (2020), in which they observed that fluency ratings and evaluations of comprehensibility were influenced by a similar set of linguistic characteristics, albeit with different relative weights on these predictors. In their study, content quality was a significant predictor of comprehensibility, whereas pronunciation held influence over both comprehensibility and perceived fluency. These findings suggest that perceived fluency is not solely determined by the conventional temporal measures associated with utterance fluency; some non-temporal linguistic features that are important to speech comprehensibility may also play a role in shaping perceived fluency.
6.2 RQ2: unveiling the relationship between L2 utterance fluency and perceived fluency in dialogic speaking
In the dialogic task, breakdown fluency measures within speaker turns were the most significant utterance fluency features shaping perceived fluency, whereas the other utterance fluency features were comparatively ineffective predictors. The breakdown fluency measures explained 50% of the variance in the perceived fluency score. In the optimal model, MASPD contributed most to the perceived fluency score, followed by MASPR and EASPD. Notably, FPR and EASPR could not significantly contribute to the score.
The findings indicate that breakdown fluency measures, particularly the rate and duration of mid-ASU silent pauses, are crucial in shaping perceived fluency in dialogic speaking. Qualitative results also showed that raters were most influenced by silent pauses (N = 57, 44.5%). In the dialogic task, although EASPD still predicted perceived fluency, its impact was weaker than that of mid-ASU silent pauses. In addition, EASPR did not have a significant effect on the fluency score. The reduced importance of end-ASU silent pauses in dialogic speaking may be due to the turn-taking dynamics of conversation (Cameron, 2001; Tavakoli & Wright, 2020). The turn-taking mechanism in conversation does not necessitate long turns composed of multiple utterances. Consequently, listeners’ judgments on speech fluency appear to rely even more extensively on mid-ASU silent pauses compared to the situation in monologic speaking. This may result in the limited predictive power of end-ASU silent pauses. However, as suggested by the finding, end-ASU silent pauses with a long duration may still influence perceived fluency in dialogic speaking.
A detailed analysis of rater comments revealed a shift in how silent pauses were perceived in dialogic speaking compared to monologic speaking. Only one instance (0.8%) linked silent pauses to lexical retrieval issues in dialogic speaking, suggesting raters might be more attuned to the communicative functions of pauses in conversation rather than viewing them solely as indicators of processing difficulties. This shift may explain why silent pause measures accounted for less variance in perceived fluency in the dialogic task (50%) compared to the monologic task (63%). However, as silent pauses still accounted for a large portion of the variance in perceived fluency, this study maintains that silent pauses primarily prompt perceptions of disfluency in L2 speaking.
In dialogic speaking, the role of filled pauses was the same as its role in monologic speaking. In both tasks, FPR did not have a statistically significant predictive effect on the perceived fluency score. In terms of the qualitative results, the findings in the monologic and dialogic tasks were consistent in that the comments on filled pauses were the least frequent. This aligns with Sato (2014) and Peltonen’s (2022) studies, suggesting that filled pauses do not influence perceived fluency in either monologic or dialogic speaking. These findings highlight the multifunctional role of filled pauses, suggesting that their function as indicators of disfluency may not be straightforward. From a problem-solving perspective, filled pauses may serve as stalling mechanisms, allowing speakers time to plan and maintain fluency (Dörnyei & Kormos, 1998; Peltonen, 2017). In addition, in interactive contexts, they can function as important communicative cues, signaling turn-holding or facilitating coordination between interlocutors (e.g., Clark, 1996).
Adding speed fluency and repair fluency measures to the model, which initially only included breakdown fluency predictors, did not significantly increase explained variance or improve model fit. This suggests that, unlike in monologic speaking, these dimensions have lower predictive power in dialogic speaking when breakdown fluency is also considered. Although speed fluency and repair fluency could predict perceived fluency when isolated, their contributions were smaller than breakdown fluency, and their impact further diminished when breakdown fluency measures were included in the model. According to Bosker et al.’s (2013) study, listeners are more perceptually sensitive to speech interruptions than speech speed in monologic speaking. The nature of dialogic speaking may even further enhance the perceptual salience of speech breakdowns while reducing sensitivity to speed fluency. Frequent speaker shifts in dialogues lead to shorter utterances, potentially making listeners more sensitive to interruptions but less able to form impressions of speech speed. Consequently, the predictive power of speed fluency on perceived fluency diminishes in dialogic speaking.
The addition of measures of repair fluency did not improve the model fit. Peltonen (2022) also found no significant relationship between repetitions and the perceived fluency score in dialogic speaking (r = .14, p = .669). However, it should be noted in the current study that the raters associated repetitions more with silent pauses (N = 13, 10.2%) than with reformulations (N = 5, 3.9%) during stimulated recall. This suggests that although frequent repetitions may lead to negative impressions on fluency as silent pauses, the raters’ criticism on the use of repetitions weakens in dialogic speaking. As Peltonen (2017) suggested, repetitions may be taken as a speech management strategy to keep the turn, especially in dialogic speaking. CR, which had a minor negative effect on fluency perceptions in the monologic task, did not significantly affect fluency judgments in dialogues. Two comments from the raters indicated that natural reformulations contributed to positive fluency perceptions, indicating a shift in their focus toward communicative function in dialogues. It should also be noted that in both monologic and dialogic tasks, FSR did not play a role in shaping perceived fluency. In dialogic speaking, it may also be considered as a means to enhance effective communication, given its positive relationship with the perceived fluency score, albeit not reaching statistical significance (β = .07, p = .471).
The study found no significant predictive effect of TPD on perceived fluency in the dialogic task, and the qualitative analysis revealed no rater comments on turn pauses. This contrasts with Peltonen’s (2022) findings, where turn pauses strongly correlated with interactional fluency ratings (r = −.94, p < .001). The discrepancy may stem from differences in focus: the current study focused on individual fluency within a dialogue, whereas Peltonen’s research centered on overall interactional fluency. The rating guides provided to raters in this study were consistent for both monologic and dialogic tasks, with no explicit instructions to focus on turn-taking behavior. This design choice may have contributed to the absence of comments on turn pauses in the qualitative data. The present study also contradicts Sato’s (2014) qualitative study of perceived fluency. Specifically, the raters in Sato’s study reported that they were influenced by the naturalness and appropriateness of turn-taking behavior when scoring the individual fluency performance in a dialogue. Given these contrasting results, further research is needed to verify and extend the current findings.
In addition, the stimulated recall data indicated that the raters’ perceptions of fluency were influenced by content quality and comprehensibility, although these factors were mentioned infrequently (each 1.6%). This suggests that perceived fluency is not solely based on utterance fluency but can also be affected by non-temporal features. Notably, utterance fluency explained less variance in perceived fluency scores in the dialogic task (50%) compared to the monologic task (71%). A possible reason for this discrepancy is that raters may be more accustomed to evaluating individual or monologic speech, where utterance fluency features are more salient and easier to assess. This may also indicate that judgments of individual fluency in dialogues rely less on utterance fluency features than in monologues, warranting further research into other influencing factors. For instance, more interactionally oriented rating scales of fluency should be developed and employed to further investigate how interpersonal dynamics influence perceived fluency in dialogue.
7 Conclusion
This study examined the relationship between utterance fluency and perceived fluency in both monologic and dialogic speaking using quantitative and qualitative methods. In both speaking contexts, L2 utterance fluency played a substantial role in shaping L2 perceived fluency, albeit with a higher degree of variance predicted in monologic speaking. In monologic speaking, all utterance fluency dimensions influenced perceived fluency, whereas in dialogic speaking, breakdown fluency was the dominant factor influencing perceived fluency, with other dimensions being comparatively non-significant. Notably, in dialogic speaking, the listeners might consider the communicative functions of various aspects of utterance fluency. The temporal aspect of turn-taking did not significantly affect perceived fluency in dialogic speaking.
The study offers several key implications for Chinese English learners’ L2 fluency assessment, particularly in low-stakes, face-to-face speaking contexts. Given that the findings are only tentative—as this study is one of the few to focus on dialogic speaking, and the tasks were implemented in the face-to-face mode, we caution against overgeneralizing the implications. First, in both monologic and dialogic contexts, filled pauses and false starts should not be heavily weighted in rubrics or automatic assessments, as they appear to have minimal impact on listener perceptions of fluency. Second, assessment criteria should be adjusted for different speaking contexts. In monologic speaking, emphasis should be placed on infrequent and short silent pauses, fewer repetitions and corrections, and appropriate speech speed to achieve high fluency ratings. In dialogic speaking, particular attention should be given to silent pauses within syntactic units, as they play a more critical role in shaping perceived fluency. Finally, the assessment of fluency in dialogic speaking requires further exploration beyond utterance fluency features. The study found that these features accounted for only 50% of the variance in perceived fluency, indicating that other factors must be considered to better evaluate fluency in dialogues. According to previous studies (e.g., Brown et al., 2023; Peltonen, 2017; Peltonen, 2022), L2 learners’ interactional behaviors (e.g., other-repetitions, collaborative completions, and the use of pragmatic markers) and the use of communication strategies may affect listener-based perceived fluency. Identifying these factors would enhance understanding of what constitutes L2 perceived fluency in dialogic speaking and refine L2 fluency assessment.
There are some limitations of the study. One limitation is that the number of speaking tasks might hinder the study’s generalizability. We only employed one monologic and one dialogic speaking task, potentially limiting the reliability of findings. In addition, the study only involved three raters to assess participants’ perceived fluency. Although the current study demonstrated acceptable inter-rater reliability, the perceived fluency scoring process could be enhanced by including more raters from diverse backgrounds. Finally, we employed the ASU framework, as described by Foster et al. (2000), to code the position of silent pauses. Despite its widespread use, this approach may not sufficiently differentiate between pauses occurring at clause boundaries and those within clauses, which are critical to understanding speech production. Future studies could examine how the choice between an ASU-based and a clause-based approach influences fluency measures and the findings in this study.
Supplemental Material
sj-docx-1-las-10.1177_00238309251352105 – Supplemental material for Unveiling the Relationship Between L2 Utterance Fluency and Perceived Fluency in Monologic and Dialogic Speaking
Supplemental material, sj-docx-1-las-10.1177_00238309251352105 for Unveiling the Relationship Between L2 Utterance Fluency and Perceived Fluency in Monologic and Dialogic Speaking by Jianmin Gao and Peijian Paul Sun in Language and Speech
Supplemental Material
sj-docx-2-las-10.1177_00238309251352105 – Supplemental material for Unveiling the Relationship Between L2 Utterance Fluency and Perceived Fluency in Monologic and Dialogic Speaking
Supplemental material, sj-docx-2-las-10.1177_00238309251352105 for Unveiling the Relationship Between L2 Utterance Fluency and Perceived Fluency in Monologic and Dialogic Speaking by Jianmin Gao and Peijian Paul Sun in Language and Speech
Footnotes
Acknowledgements
We thank members of the SEAL (Speech, Evaluation, & Acquisition Lab) at Zhejiang University for assistance in data collection.
Data availability
The data are available from the first author on reasonable request.
Funding
The author(s) disclosed receipt of the following financial support for the research, authorship, and/or publication of this article: The work was supported by the National Social Science Foundation of China (grant no. 19CYY008).
Ethical considerations
The study was reviewed and approved by the Ethics Committee of the School of International Studies at Zhejiang University (approval ID: SIS2022-05).

Supplemental material
Supplemental material for this article is available online.
Notes
References
Supplementary Material
Please find the following supplemental material available below.
For Open Access articles published under a Creative Commons License, all supplemental material carries the same license as the article it is associated with.
For non-Open Access articles published, all supplemental material carries a non-exclusive license, and permission requests for re-use of supplemental material or any part of supplemental material shall be sent directly to the copyright owner as specified in the copyright notice associated with the article.
