
Abstract
Associations between frailty and physical-functional fitness (PFF) indicators in frail women over 65 years of age remain largely unexplored. This study analyzed the relationship between frailty syndrome (FS) and PFF indicators and assessed how the latter might predict the former. Participants were 119 elderly women (81.96 ± 7.89 years) recruited from four social and healthcare centers. PFF was assessed through muscle strength tests of upper and lower limbs, endurance, agility-dynamic balance, flexibility, and body composition. The following FS indicators were assessed: weight loss, exhaustion, weakness, slowness, and low physical activity level. Significant correlations were found between FS and endurance, agility-dynamic balance, upper and lower limbs muscle strength tests. Comparitive analyses also revealed that, among FS groups, the frail subgroup performed significantly poorer on all PFF measures except body composition. Additionally, a receiving operating characteristics curve analysis revealed good diagnostic accuracy for predicting FS using the agility-dynamic balance test (Area Under Curve [AUC] = .82, 95% CI [0.74, 0.90]; sensitivity and specificity were 70.4% and 84.8% for the cutoff = 16.22 seconds). Accurately, the risk of frail condition (not pre-frail) increases about 2.12% per second spent in this test. Thus, the agility-dynamic balance test is a promising tool for screening institutionalized older people for risk of FS.
Keywords
Introduction
Frailty syndrome (FS) is a complex aging expression determined by ontogenetic and phylogenetic factors (Fried et al., 2001). Chronic stress has been shown to have immunosuppressive effects that accelerate aging and cause cumulative disorders in many physiological systems, resulting in a fragile state (Clegg & Trust, 2011). In FS, physiological reserve and defense functions decline (Fried et al., 2001), compromising the individual’s capacity to withstand chronic biological stress (Afilalo et al., 2014) and leading to institutionalization or hospitalization, often followed by premature death (Lally & Crome, 2007). According to geriatric specialists, FS is highly prevalent and associated with five identifying criteria: weakness, low resistance to effort, slowness, low physical activity levels, and unintentional weight loss (Abizanda et al., 2013; Rockwood, MacDonald, Sutton, Rockwood, & Baron, 2014).
Despite relationships between the decline in the physical functioning and FS, we cannot attribute to FS any central cause (Cho, Scarpace, & Alexander, 2004; Greene, Doheny, O’Halloran, & Anne Kenny, 2014; Kim et al., 2010). Progressive muscle damage related to the deleterious effects of senescence seems to be at its pathophysiological core (Mohler, Fain, Wertheimer, Najafi, & Nikolich-Žugich, 2014). FS is associated with, but not a direct result of, aging (Romero-Ortuno, 2013). Currently, there are increasingly robust associations between FS and multiple comorbidities, that although less lethal, tend to accumulate with age (Robinson et al., 2009). Physical disability seems to be a primary pathway to FS (Macklai, Spagnoli, Junod, & Santos-Eggimann, 2013). Notwithstanding the high correlation between low levels of physical-functional health in frail populations (Peterson et al., 2009), some studies have recently discussed the potential attenuation and prevention effect that exercise may have on FS, through stimulating positive improvement in physical-functional fitness (PFF) indicators (Jeoung & Lee, 2015).
The American College of Sport Medicine describes PFF as multidimensional, including cardiorespiratory fitness, flexibility, body composition, muscular strength, and endurance (Garber et al., 2011). Despite the importance of all PFF dimensions, the scientific consensus considers cardiorespiratory fitness and muscle strength or resistance as most important epidemiologically from childhood (de Chaves et al., 2016) to old age (Nelson et al., 2007). In this sense, maintaining satisfactory levels of PFF through adherence to regular exercise appears highly beneficial in attenuating and preventing cardiometabolic diseases (Murphy, McNeilly, & Murtagh, 2010), osteoarticular disorders (Peterson et al., 2009), sarcopenia, and the frail condition (Mjm, van Uffelen, Riphagen, & van Mechelen, 2008; Park, Kwak, Harveson, Weavil, & Seo, 2015). Strong associations between health-related quality of life and PFF in populations over 60 years old have been reported (Takata et al., 2010).
Some researchers reported that the decline on PFF indicators associated with age is aggravated by a sedentary lifestyle (Kimura, Mizuta, Yamada, Okayama, & Nakamura, 2012). Women, aged over 60 years, have been found to be less physically active overall but more involved in household activities (Lee, 2008) than older men. On the other hand, the results of a recent and stronger epidemiologic study carried out in 11 countries revealed that women over 60 years of age in all these countries were more likely than men to have disabling, nonlethal conditions including physical disability (i.e., difficulties to perform general activities of daily life), osteoarticular diseases, depressive symptoms, and hypertension (Crimmins, Kim, & Solé-Auró, 2011). Many of these diseases are robustly related to sedentary behavior across life (Chastin, Fitzpatrick, Andrews, & DiCroce, 2014).
The study of associations between FS and some PFF indicators has recently gained the interest of the scientific community in its search for simple and effective means of preventing FS. Most of these studies have focused on people over 65 years of age living in the community (Drubbel et al., 2014). However, recent research showed a higher prevalence of various comorbidities, FS, and mortality among people living in centers for social and health care support (CSHS; Abizanda et al., 2014; Nóbrega, Maciel, de Almeida Holanda, Oliveira Guerra, & Araújo, 2014). This type of institution seems to exert a “protective effect” for many people, preventing other adverse clinical events mostly through improved nutrition (Abizanda et al., 2014). However, since a decrease in physical-motor proficiency, loss of functional autonomy (related to mental health), and absence of family are also psychosocial characteristics of this population (Abizanda et al., 2013), persons in these centers may be at particular risk for FS, and these centers may play a role in improving PFF.
Given an expected growth in the European adult population over 65 years of age and the fact that FS increases health costs and decreases health-related physical activity, it is essential to better understand the relationship between FS and PFF outcomes. Therefore, a set of objective and accurate assessment criteria appropriate for use among institutionalized older people can be valuable to recognize and amelioratie FS. This study explored the relationship between FS status and PFF indicators in institutionalized-dwelling older women and explored the sensitivity, specificity, cutoff points, and predictive performance of specific PFF tests for identifying frailty status. We hypothesized that FS participants would be at higher risk of PFF decline, when compared with individuals identified as prefrail or not frail (robust), and we looked for independent associations between FS and PFF tests to better predict FS.
Method
Study Design and Participant Sample
This study was a prospective, cross-sectional, local, older population-based survey in which we collected information about FS incidence in older people living in centers for CSHS. The sample consisted of a subset of participants within the PRO-HMESCI study protocol (Teixeira et al., 2016), inserted in a PHALIF study: participative, health, and active lifestyle in frail institutionalized-dwelling individuals. Our initial sample consisted of 203 older participants aged over 60 years minus 84 participants who failed to meet exclusion criteria or dropped out as follows: Physical impairment associated with musculoskeletal disorders and joint or muscle pain in the performance of some specific movements or tests (n = 34), closed diagnosis of early-stage of dementia or mental disorder (n = 9); severe impairment of hearing or visual functions that made it impossible to perform all tests (n = 7); need of palliative health care or special nutritional support, with medical indications not to participate in the study (n = 4); participants who dropped out when applying the tests (n = 10); and male participants excluded for methodological reasons (n = 20). Participant inclusion criteria used were as follows: Women aged over 60 years and willing to assent to take part in the study spontaneously who were under control and updated with prescribed medications. The final number of participants was 119 older women. Needed statistical power was computed by considering the agility-dynamic balance test values in studies comparing frail and prefrail groups, using a Mann–Whitney U test, with a significance level of p = 0.01. The computations were performed on G*power 3.1.9.2, and the power was determined to be 0.99 (Faul, Erdfelder, Buchner, & Lang, 2009) with a sample of 119 and an effect size of 1.12.
Ethical Procedures
CSHS directors and elders who expressed interest in participating in the study signed an informed consent form, in which the privacy and anonymous identity of the data collected were guaranteed and any needed access to participants’ medical records were given. The study protocol was approved by the Faculty of Sport Sciences and Physical Education Ethical Committee—University of Coimbra (reference code: CE/FCDEF-UC/000202013), in respect of Portuguese Resolution (Art.° 4st; Law n. 12/2005, 1st series) on ethics in research (Braga, 2013) and complied with the guidelines for research with human beings of the Helsinki Declaration (Petrini, 2014).
Outcome Measures
Data collection of sociodemographic and medical history status, FS, physical fitness, and anthropometric indicators was organized by the principal investigator and was performed by independent specialists (properly trained) of the research team. To minimize differences in data collection procedures, the same evaluator carried out data collection for all participants.
Sociodemographic status
Information on chronological age (continuous variable), marital state (a four categories variable: single, married, widowed, and divorced), and level of education (a continuous variable) was collected for each participant. The level of education was classified according to the Portuguese educational system and analyzed as a continuous variable (Fernandes, 2007).
Anthropometric measures
The standardized procedures described by Lohan et al. (Chumlea & Baumgartner, 1989) were followed for the collection of anthropometric data, including body mass weight determined using a portable scale (Seca®, model 770, Germany) with a precision of 0.1 kg, stature determined using a portable stadiometer (Seca Body meter®, model 208, Germany) with a precision of 0.1 cm, and body mass index (BMI), calculated according the formula (BMI = weight/height2).
Comorbidities screening
The Charlson comorbidity index (CCI), used in this study, is a method of predicting mortality by classifying or weighting comorbid conditions. The CCI has been widely utilized by health researchers to measure burden of disease and has a weighted index based on 19 comorbid conditions. Its score can be combined or adjusted with age and gender to form a single index (continuous variable). Adding one point for each additional 10 years to the initial score has been shown to predict 1-year and 10-year mortality (Charlson, Szatrowski, Peterson, & Gold, 1994). Medical records provided by the medical and health professional team were used to verify information provided by study participants.
Medication use assessment
Daily medication use by the participants was assessed through Question 6 of the Mini Nutritional Assessment (Guigoz, 2006), that asks the participant about prescription drugs taken per day. Additionally, the number of medications used was checked systematically through the institutional medical record of each participant, identifying and reporting polypharmacy (i.e., more than three prescription drugs per day) according to the Portuguese Classification System of Human Medicine (Santos & Almeida, 2010).
Cognitive status assessment
The Mini–Mental State Exam (MMSE) used in this study assesses five areas of cognition: orientation, immediate recall, attention and calculation, delayed recall, and language (Folstein, Folstein, & McHugh, 1975). The maximum MMSE score is 30 points, and a score below 24 points is considered abnormal and used for dementia and mild cognitive impairment (MCI) screening (Melo & Barbosa, 2015). The MMSE was used to classify participants by cognitive profile as a category variable, according to the following cutoff values: severe cognitive impairment: 1 to 9 points; moderate cognitive impairment: 10 to 18; MCI: 19 to 24 points; and normal cognitive status: 25 to 30 points (Mungas, 1991). Additionally, the MMSE can be analyzed as a continuous variable. Its purpose in this study was to help determine whether a low-cognition profile might have affected physical fitness trainability as has been shown by prior research (Uemura et al., 2013).
FS screening
Assessment of FS was evaluated according to Fried’s five criteria of the frailty phenotype index (Fried et al., 2001): (i) Weight loss assessed by self-report of unintentional weight loss of four kg or more in the last six months; (ii) poor endurance and energy (self-reported exhaustion) evaluated by negative concordance of two questions, Number 7 and Number 20, of the questionnaire developed by the Center of Epidemiologic Studies for Depression, called the CES-D scale (Gonçalves, Fagulha, Ferreira, & Reis, 2014); (iii) weakness, analyzed using the handgrip strength test. This test uses a handheld dynamometer (Lafayette Dynamometer, model 78010, USA) and strength is measured in kilograms. The subject holds the dynamometer in the hand to be tested, with the elbow by the side of the body. When ready, the subject squeezes the dynamometer with maximum isometric effort, which is maintained for 5 seconds. The best result of the two trials was used for scoring purposes (Syddall, Cooper, Martin, Briggs, & Aihie Sayer, 2003). Participants who were unable to perform the handgrip strength test and those in the lowest 20% (adjusted for BMI and stratified by gender) were categorized as positive for the weakness criterion; (iv) slowness, as measured by the “15 feet walking test,” consisting of an individual walk without assistance (4.6 m) where the time taken to complete it is measured and expressed in seconds, adjusted for gender and height. The best time of the two trials was used for final scoring (Newman, Haggerty, Kritchevsky, Nevitt, & Simonsick, 2003); and (v) low physical activity level, assessed by the International Physical Activity Questionnaire short form such that participants classified as having “low levels of PA” and “very low sedentary” on this instrument scored negatively in the FS criteria (Guessous et al., 2014; Pitanga, Pitanga, Beck, Gabriel, & Moreira, 2012). The prevalence of FS combined score was calculated, as well as the presence of each of the five items (0–5 points). According to the Fried protocol, a negative evaluation in one or two criteria classifies the participants as prefrail, in three or more as frail and as nonfrail or robust, when the subject has no score on any of the five criteria of FS (Fried et al., 2001).
Assessment of physical fitness indicators
The senior fitness test battery developed by Rikli and Jones (2013) was used to measure PFF. (i) The lower body strength is determined with the “30 seconds chair and stand test” (30 s-CS), measuring the number of total full chair stands that can be completed in 30 seconds with the arms folded across the chest; (ii) the upper body strength was assessed with the “30 seconds arm curl test” (30 s-AC) that measures the total number of bicep curls that can be completed in 30 seconds, seated in a chair and holding a hand weight of five lbs (2.27 kg) for women; (iii) for lower body flexibility, we used the “chair sit and reach test” from a sitting position at front of chair, with leg extended and hands reaching toward the toes, the number of inches (cm, + or −) between extended fingers and tip of toe were measured; (iv) the upper body flexibility (shoulder girdle) was measured using the “back stretch’ test,” that assesses the distance (cm, + or −) of approach between the middle fingers when one hand reaching over the shoulder and one up the middle of the back; (v) agility-dynamic balance was assessed using the 8 foot up and go test, that assesses the time in seconds required for the participant to get up from a chair (seated position), walk as quickly as possible around either side of a cone placed 2.44 m away from the chair, turn and sit back down in the seated position; and (vi) aerobic resistance was measured through the “2 minutes step test” (2 m-ST), that consisted of the number of full steps the subject completed in two minutes performing a stationary gait, with one hand resting on the wall and raising each knee to a midway point between the kneecap and iliac crest; the score is the number of times the right knee reaches the required height (Rikli & Jones, 2013). For all the PFF tests, the best score of the two trials performed was used for data analysis. When upper and lower members were tested on both sides (i.e., left and right), the best scoring side was the one considered for scoring purposes.
Statistical Analysis
The assumption of normality was checked by Shapiro–Wilk tests and by visual inspection of normality plots. When normally distributed, quantitative variables were described by their means and standard deviations. When not normally distributed, medians and the first and third quartiles were used instead. Nominal variables were described with absolute and relative frequencies. A comparison of quantitative variables between FS categories (no frail, prefrail, and frail) was performed using one-way analysis of variance test or Kruskal–Wallis test, as applicable. Associations between nominal variables were assessed using the chi-squared test and Monte Carlo simulations were performed when appropriate. Partial correlations between the FS combined score and PFF indicators were computed, together with partial correlations controlling for the cognitive status, comorbidities, and both factors at the same time. The magnitude of the associations was classified following recommendations: trivial (r < .1); small (r from .1 to .3); moderate (r from .3 to .5); strong (r from .5 to .7); and robust (r from .7 to .9; Batterham & Hopkins, 2006). The variables expressing PFF results were analyzed regarding their predictive value to distinguish between frail and prefrail subgroups by performing a receiver operating characteristics curve analyses. A multivariate logistic regression was subsequently undertaken, considering all of the aforementioned PFF test performance variables as predictors of FS. IBM SPSS Statistics 21.0 and in R 3.3.1 software were used for all computations. The level of significance adopted was p = .05.
Results
Characterization of the Total Sample Study Population and Comparison by Frailty Phenotype Index for Sociodemographic, Clinical Status, Frailty, and Physical Fitness Indicators.

Note. N = negative; P = positive; A ± SD = average ± standard deviation; M1;3 = median 1st quartile; 3rd quartile; n, % = number (percentage) of participants, where applicable.
Regarding FS assessment, 19 participants were classified as nonfrail (16%), 46 subjects as prefrail (38.7%), and 54 as frail (45.4%). Both for the prefrail and frail groups, as well as for the total sample, “weakness” was the dimension on which most participants obtained negative scores and “poor energy” was the dimension on which the fewest participants obtained negative scores.
Analyzing scores from the senior PFF tests battery and comparing the frailty subgroups, the
frail group exhibited lower performance results on all PFF tests. A comparison between the
three groups showed statistically significant differences attained for all PFF tests battery
variables except for BMI, whose results indicated higher values in the direction of the
frail group. In addition to the descriptive scores described in Table 1, a graphical representation (radar plot,
Figure 1) also showed FS
differences in PFF scores. In Figure
1, to ensure comparability and an easier visualization, the medians were computed
for each of the three FS subgroups and then divided by the maximum of the three medians. It
is worth mentioning that, for each FS component represented in the plot, higher results mean
better performances. The frail group can be seen to have lower scores for all PFF variables
except for body composition. Radar plot of the variables of the physical fitness tests
(n = 119).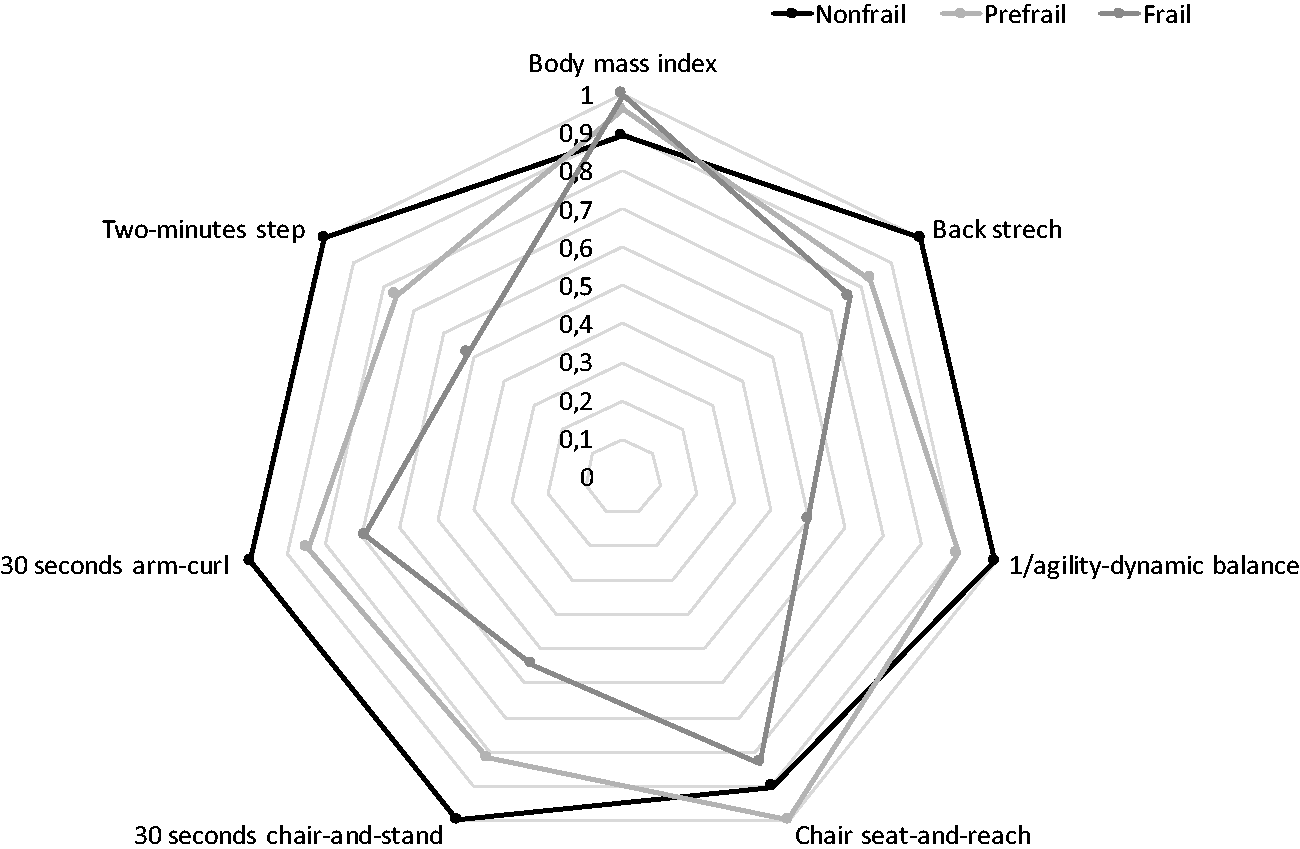
Spearman Total and Partial Correlations (Controlling for Cognitive, Comorbidity, and Both) Between Combined Score of FS and Indicators of Physical Fitness Tests (n = 119).
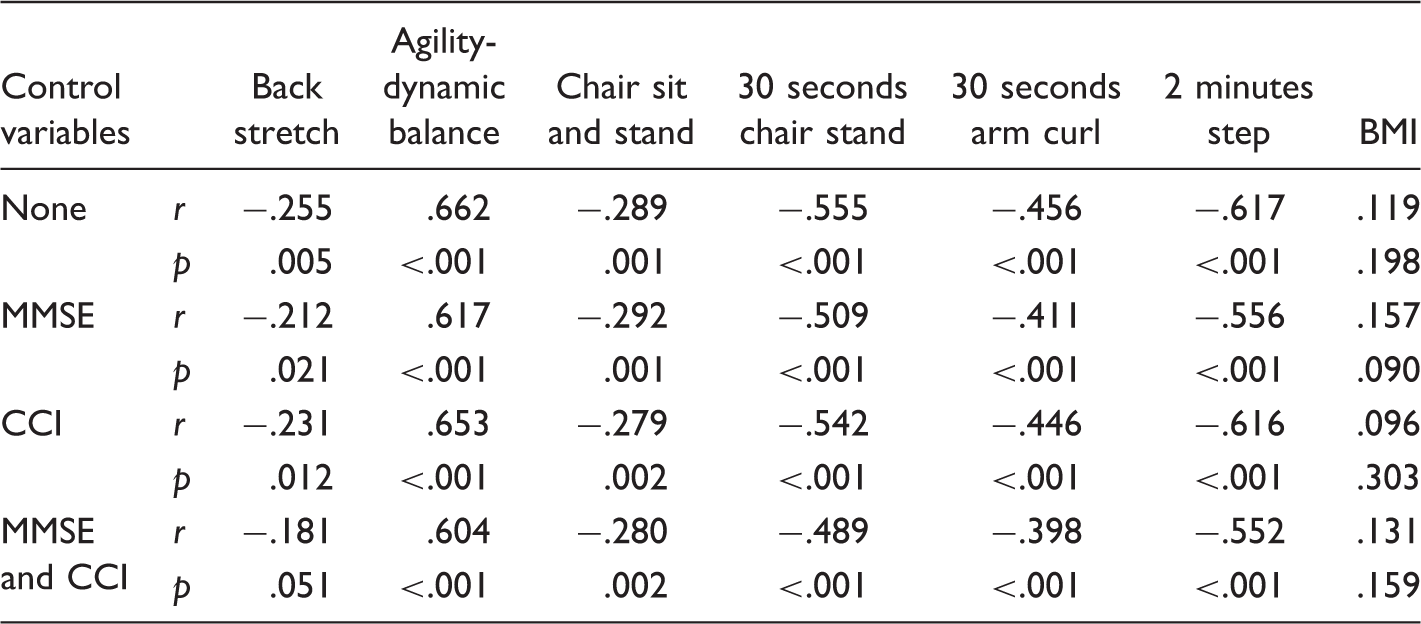
Note. BMI = body mass index; MMSE = Mini–Mental State Exam; CCI = Charlson comorbidity index.
Predictive Performance of Physical Fitness Tests for Frailty Syndrome (n = 119).
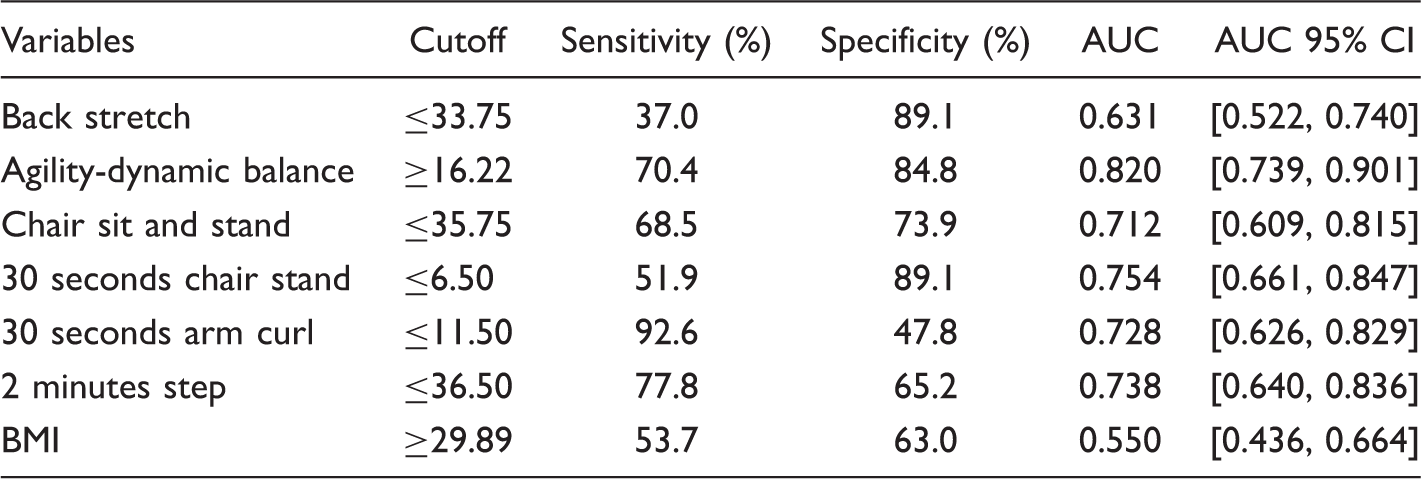
Note. BMI = body mass index; AUC = Area Under Curve; CI = Confidence Interval.
Test performance indicators were used as predictors for FS in a logistic regression analysis aimed at distinguishing between prefrail and frail subgroups. Nonfrail participants were thus excluded from this analysis. Of the seven variables assessing test performance, only ADB test (β = 0.198; SE = 0.052; p = .0000; OR = 1.218; OR 95% CI [1.110, 1.349]) and 30 s-AC (β = −0.213; SE = 0.086; p = .013; OR = 0.808; OR 95% CI [0.683, 0.956]) were found to be statistically significant predictors. These two predictor variables were linearly related to the logit of the dependent variable using the Box-Tidwell procedure.
A multivariate outlier was identified using standardized residual and kept in the analysis.
The model was seen to be statistically significant (χ2[2] = 45.181,
p < .001) and to explain 48.6% (Nagelkerke
R2) of the variance in the outcome variable. It achieved a
sensitivity and specificity of 70.4% and 84.8%, respectively, with AUC 0.848 with the
corresponding 95% confidence interval being [0.773, 0.922]. Figure 2 shows only those significant variables in
multivariate logistic regression analysis. Receiver operating characteristic curve analysis for test performance
(n = 119).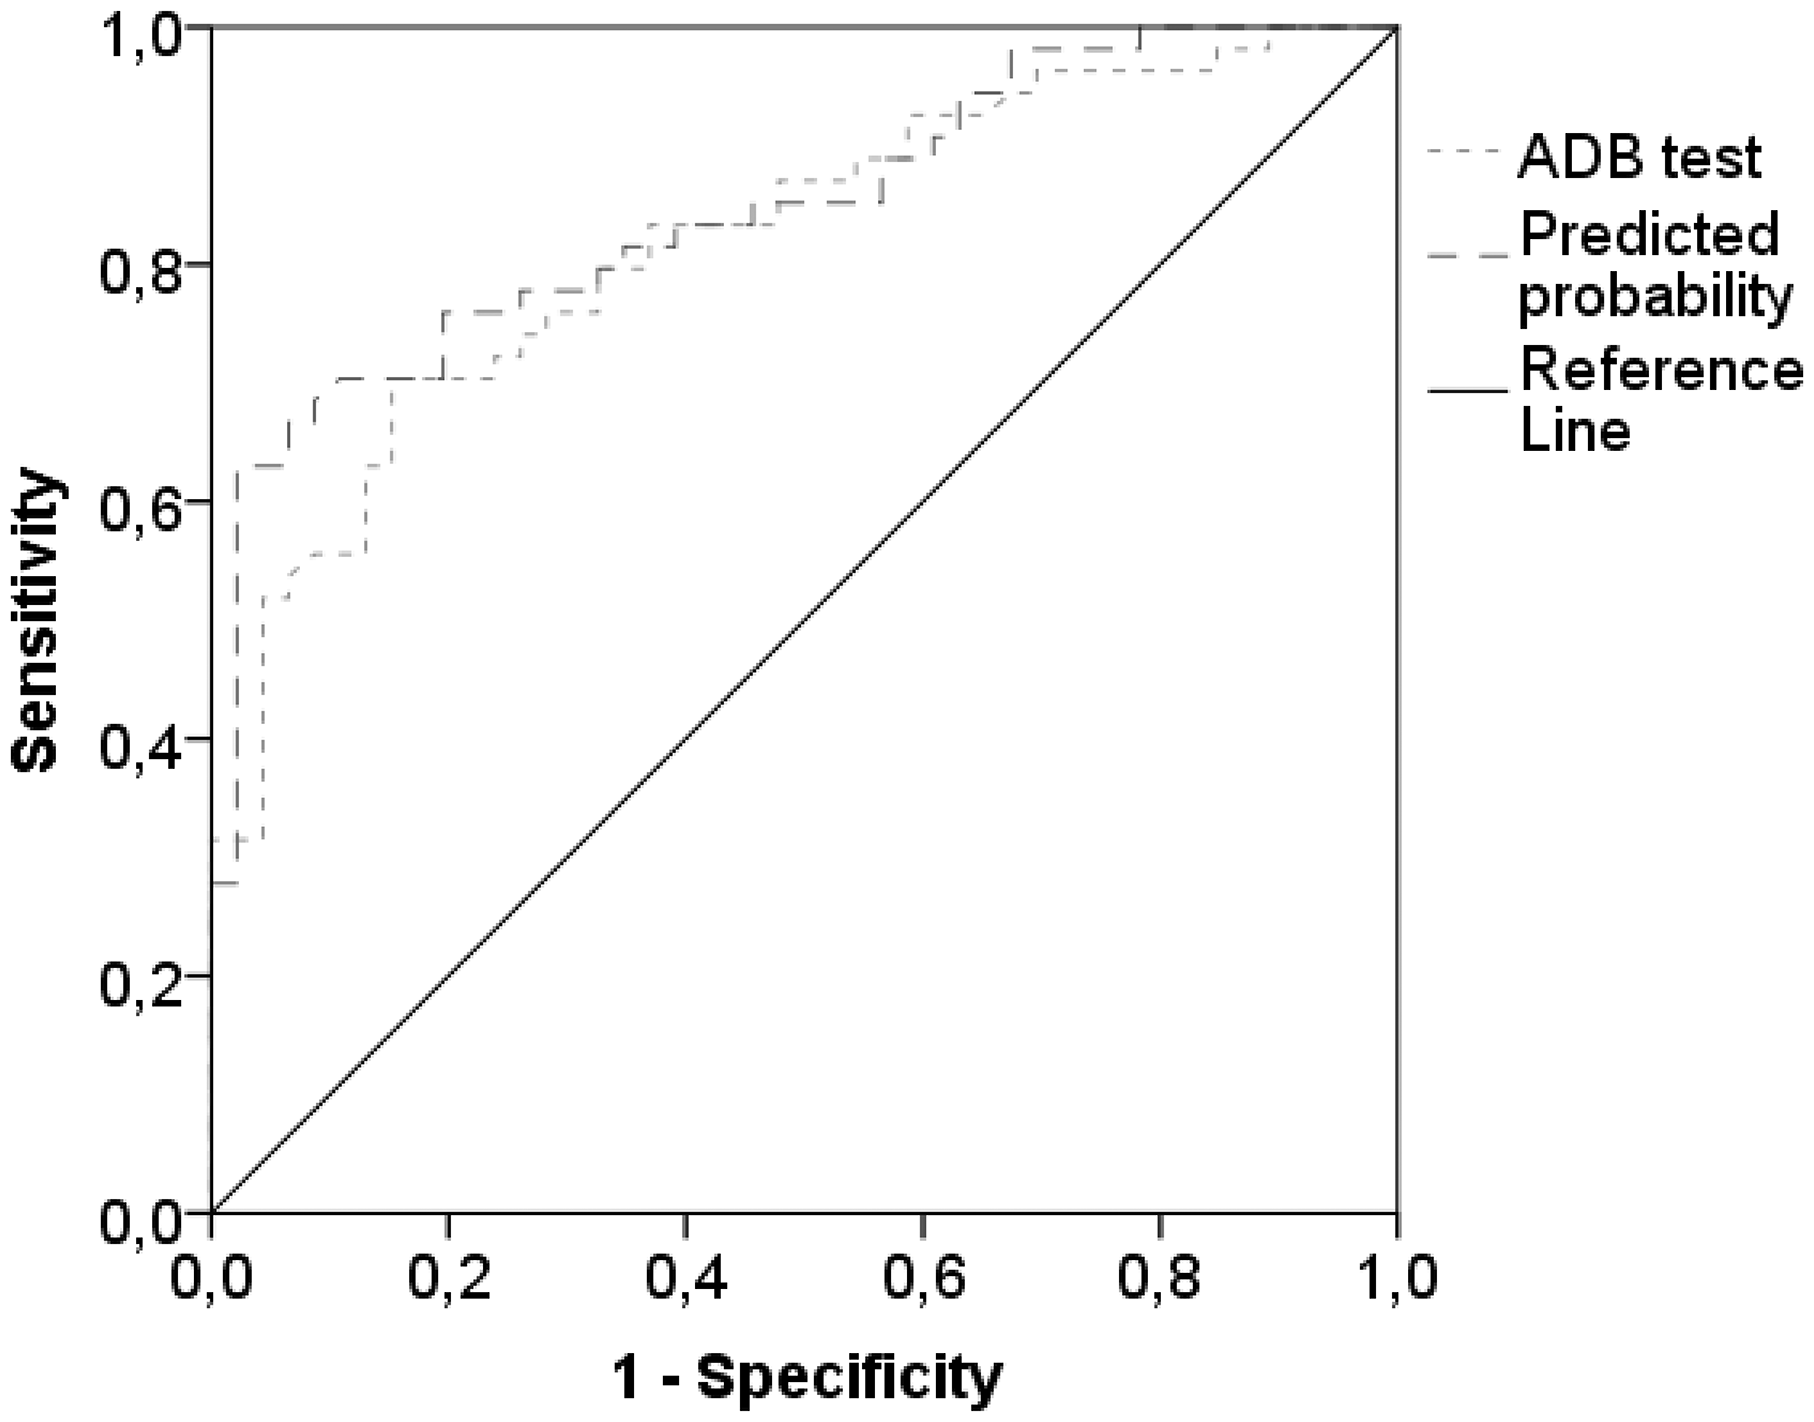
Discussion
The goals of this study were to explore associations between FS and PFF indicators and to analyze predictive performance of PFF tests among women living in centers for CSHS in the district of Coimbra, Portugal. To our knowledge, this study is the first scientific examination of the predictive performance of PFF indicators for evaluating FS in a Portuguese population over 65 years old. FS has similar prevalence (45.4% frail subgroup) when compared with samples in other European countries living in CSHS (Abizanda et al., 2013).
According to other international studies, there is a clear trend toward an increasing prevalence of FS in samples of institutionalized individuals. Portuguese women over 65 years of age have distinct sociodemographic characteristics, when compared with South American (Yassuda et al., 2012), North American (Kiely, Cupples, & Lipsitz, 2009), and Asian populations (Han, Lee, & Kim, 2014). In agreement with other studies of participants with similar sample characteristics (González-Vaca et al., 2014), our bio-sociodemographic data revealed a trend toward lower levels of education in the prefrail and frail subgroups. Unlike other studies in which frail subjects were underweight (Donini et al., 2013), we found no statistical differences between groups in body weight and BMI. This fact may be explained by the nutritional support these individuals received from the care center in which they were living, consistent with a cross-sectional study conducted in Spain (González-Vaca et al., 2014). According to several researchers, in recent years, malnutrition is a frequent problem among people living in institutionalized context (Cereda, Valzolgher, & Pedrolli, 2008; De Luis et al., 2011; Donini et al., 2013). Our data highlight the importance of adequate nutritional balance, one of the variables at the core of the FS status. Especially for this study, it is important to note that body weight probably did not affect the assessment of PFF.
In terms of clinical history, cognitive impairment and incidence of comorbidities are the most explored dimensions in studies combining FS correlates (Brigola et al., 2015; Chang & Lin, 2015). Despite ICC scores, present data do not indicate an increase in the number of diseases in the direction of the frail subgroup. The prevalence of a high comorbidity index in our study sample was present in all the FS subgroups. The results of cognitive function assessed by the MMSE showed statistical differences between FS subgroups. The pattern of increased MCI occurrence among the prefrail and the frail people in this study was comparable to previous studies (Abizanda et al., 2013; Han et al., 2014). However, studies with similar samples with participants living in community-dwelling context have higher values in MMSE scores when compared with studies with institutionalized samples (Robertson, Savva, Coen, & Kenny, 2014).
Regarding differences in PFF indicators between FS subgroups, frail people exhibited smaller scores in the lower and upper body strength, lower and upper body flexibility, agility, dynamic balance, and aerobic resistance capacities compared with the nonfrail and prefrail subgroups. An improvement on PFF performance, through regular physical exercise practise, reportedly enhanced physiological parameters related to physical health, exerting therapeutic treatment effect for prevention and mitigation of specific outcomes of physical impairment and can also contribute to increasing physical activity and quality of life (Patel, Newstead, & Ferrer, 2012), even in people aged over 65 years old (Vrantsidis et al., 2014).
The scientific literature recognizes the importance of maintaining an active lifestyle across life to mitigate adverse and harmful negative effects on physical health. However, muscle strength and cardiorespiratory fitness are consensually the most encouraged PFF components to be predominantly trained because of the direct relationship between the human vital capacity and physiological reserve (Charansonney, 2011). A closer look at the FS subgroups, specifically the frail subjects, revealed that weakness (muscular strength), slowness (walking speed), and low physical activity levels were the three FS components on which a larger number of participants scored negatively. The results of partial correlation between FS combined score and PFF indicators (see Table 2) showed satisfactory correlations between these dimensions, even when controlling for the effects of comorbidities, cognition profile, or both. Some studies indicate that these clinical conditions exert influence on PFF variables, though this was not demonstrated in the present study. Generally, our results are consistent with other studies that explored associations among similar variables and dimensions (Chang et al., 2014; Jeoung & Lee, 2015).
A second central focus of the present study was an analysis of the potential performance of PFF tests for predicting the FS condition. We identified the 30s-AC and ADB test as two potential predictors of FS. The longer the ADB test took to be completed and the lower the number of repetitions in 30s-AC, the greater the risk of being frail. Notably, the ADB test was the best predictor. According to recent studies, this test seems to be an appropriate, independent, and predictive tool to detect frail subjects (Chang et al., 2014). Note that for the same sensitivity as the best univariate predictor (ADB test), the logistic regression model allows for a slightly higher specificity (89.1%, whereas it was 84.8%). In analytical terms, for this population or another with similar characteristics, taking longer than 16.22 seconds to complete this test predicts the existence of a frail condition. Accurately, the risk of frail condition (not prefrail) increases about 2.12% per second spent in the ADB test. Similar results were previously found in a similar study using an analogous test (the time up and go test) for predicting frail condition in community-dwelling subjects (Greene et al., 2014; Savva et al., 2013). However, in their sample, unlike the present study, the authors excluded individuals with MCI. As mentioned, the comparison of the ADB test values between frail and prefrail subgroups is of particular importance, since statistically significant differences were found between the ADB test values of the two groups (U = 446, p < .01).
The satisfactory execution of this test requires awareness, concentration on the information received (attention), and fast decision-making (reaction time) when the participant receives the signal to “raise from the chair” and walk as quickly as possible (Barry, Galvin, Keogh, Horgan, & Fahey, 2014); rising from a chair unassisted by upper limbs requires lower limbs muscle strength, and walking fast and turning around a cone placed at 2.44 m requires quickness, agility, dynamic balance, and body support (Cebolla, Rodacki, & Bento, 2015). Thus, this test requires the integration of physical capacities, highly dependent on a satisfactory neurocognitive functioning. Perhaps, this is the reason why the cutoff values for predicting risk of FS status in the present study were higher than previous studies in which the predictive cutoff value was ≥8.12 seconds (Chang et al., 2014) as our sample contained individuals whose MMSE test values were in the range of MCI.
The central findings of the present study support the power of the agility-dynamic balance test for predicting FS in institutionalized populations aged over 65 years, where application of Fried’s criteria is not feasible. This study’s limitations include a sample that was only representative of institutionalized women since randomly selected institutions in a “universe” of many others was the most feasible, fast, and economical method of data collection and the number of male participants motivated to participate was very low. However, comparing these data to similar results from previous research, we conclude that the agility-dynamic balance test is gaining clinical utility because of its accuracy in detecting physical frailty. It has potential for use as a reference measure in future exercise intervention studies.
Footnotes
Acknowledgments
Tha authors would like to thank all SHSC localized in Coimbra, Portugal, that accepted to participate in this study. The authors also thank the students Matheus Uba, Nelba Souza, Filipa Pedrosa, Fábio Direito, Rafael Carvalho, and Taís Rieping for volunteering in data collection.