






Abstract
This pre-registered study tested whether power meter data availability affects perceived voluntariness and performance in cyclists accustomed to power meters. Forty highly trained cyclists completed two counterbalanced maximal incremental tests: one without feedback (control) and one with real-time power visualization. Confirmatory analyses showed that power visualization increased maximal aerobic power (MAP; p = 0.004, Cohen’s d = 0.487) without affecting maximal oxygen uptake (VO2MAX; p = 0.269), maximal heart rate (p = 0.383), rating of perceived exertion (RPE; p = 0.141), or perceived voluntariness (p = 0.159). Exploratory analyses revealed an order effect (p = 0.021,
Introduction
The cessation of an extreme physical effort, known as task failure, and the subjective experience associated with it, are widely debated topics in the field of endurance sports (Burnley & Jones, 2018; Iannetta et al., 2022; J.-J. Pérez-Díaz, Salas-Montoro, et al., 2026). In terms of subjective experience, this phenomenon can be understood as a continuum ranging from decisions perceived as completely voluntary, based on the perception of fatigue and self-control, to decisions perceived as completely involuntary, attributable to physiological or psychological limitations beyond the athlete’s control (c.f. Haggard, 2019). While various physiological (Joyner & Coyle, 2008) and psychological factors (Spindler et al., 2018) contribute to performance and effort perception, it remains unclear which factors are most influential in shaping the perception of voluntariness when deciding to stop. Understanding these determinants is crucial, as they could provide insight into how athletes interpret their limits and regulate their effort under different conditions (Mauger, 2014). From an applied perspective, this understanding is vital for optimizing performance and resilience. For instance, a perceived voluntary decision to stop suggests a potential ‘psychological reserve’ that could be accessed through mental skills or pacing adjustments. Distinguishing between these states would allow coaches and practitioners to better tailor training loads and psychological interventions to help athletes manage the limits of performance. A key factor that may modulate this perception is the type of feedback available during exercise. In endurance sports, external information about performance can shape pacing strategies and effort tolerance (Mauger et al., 2011; Swart et al., 2009), ultimately affecting how and when an athlete decides to stop, and, consequently, their perception of voluntariness of that decision.
In the context of cycling, the use of advanced technologies such as power meters and heart rate (HR) monitors has transformed the way athletes regulate their effort (Sundström et al., 2013). Previous studies have shown that access to contextual information, such as elapsed time or distance, can influence performance and effort tolerance in endurance sports (Albertus et al., 2005; Mauger, 2009). For example, athletes who receive feedback or verbal encouragement tend to maintain higher motivation and prolong their effort compared to those without such information (Barwood et al., 2015; Midgley et al., 2018). However, studies on feedback conducted in cycling present contradictory results and very small sample sizes (Davies et al., 2016), which undermine statistical power, and, to our knowledge, the influence of the availability of objective performance information on the perception of the voluntariness of the decision to stop has not been studied.
A recent study conducted by our group, based on a survey of over 2800 licensed cyclists, has shown that cyclists attribute task failure to a complex interaction of physiological, psychological, and contextual factors (J.-J. Pérez-Díaz, Benítez, et al., 2026). The results highlighted that physical sensations such as muscle pain and breathing difficulty are the most prominent indicators at the point of maximal effort, but also revealed that a significant proportion of cyclists do not perceive having reached their maximal effort before stopping. The most relevant finding for the purpose of the present study was that cyclists who use power meters regularly rated the decision to stop the effort as more involuntary than those who do not use power meters.
Theories accounting for physical endurance typically describe task failure as volitional exhaustion (e.g. Marcora, 2008), even though there is a lack of empirical research supporting that assumption. Moreover, there is a lack of research studying the degree to which an athlete perceives task failure as the result of a voluntary or involuntary process (J.-J. Pérez-Díaz, Salas-Montoro, et al., 2026). Here, based on knowledge from experimental psychology and cognitive neuroscience (Wispinski et al., 2020), we instead propose that the perception of the decision to stop the exercise exists on a continuum involving metacognition and decision-making at the physiological limit. In this context, objective feedback may act as an anchor that influences how athletes interpret the decision to stop. Rather than relying exclusively on subjective sensations of fatigue, cyclists may use external performance information to contextualize and validate their internal sensations. This process could reduce the sense that stopping is purely a self-determined choice, leading athletes to perceive the decision as being more constrained by their physiological state and current performance capacity. Therefore, this study raises fundamental questions about how the perception of control and the availability of objective feedback could modulate the decision to stop the effort.
The present pre-registered study aimed to investigate these dynamics in a controlled experimental design. The purpose was to test whether access to power data affected the perception of voluntariness in the decision to stop during a high intensity effort. Additionally, we aimed to confirm that access to power data contributes to prolonging the effort, regardless of the perception of the voluntariness of the decision to stop. Finally, we aimed to evaluate the cyclists’ subjective perception of the feedback’s impact on their performance, exploring whether they perceived it as beneficial or detrimental. Based on the role of power data as an objective anchor that reduces sensory uncertainty by providing validation of physical sensations (Dallaway et al., 2022), it was hypothesised that the availability of power data would make the decision to stop perceived as more involuntary than when power data is not available. Power data would also lead to better performance, reflected in higher power output and maximal oxygen uptake (VO2MAX).
Material and Methods
Participants
Forty highly trained cyclists (36 men and 4 women; 31 ± 12 years old; height: 175.7 ± 7.2 cm; body mass: 70.6 ± 10.1 kg; VO2MAX: 69.3 ± 9.5 mL·kg–1·min–1) volunteered to participate in this study. The small number of female participants reflects the higher proportion of men in the cycling population from which the sample was drawn. All participants were required to have at least one year’s experience using power data and to use a power meter regularly in their training. Following our pre-registered protocol, only cyclists familiar with the use of power meter (at least one year of experience), and who used it regularly in their training, were recruited to ensure a consistent interpretation of the experimental feedback across participants.
Sample size estimation was performed for the within-subject design using a sensitivity-analysis approach. The standard deviation of perceived voluntariness scores (measured on a 1–10 scale) observed among power meter users in our previous survey (SD = 2.74) (J.-J. Pérez-Díaz, Benítez, et al., 2026) was used as the best available proxy. While that survey involved retrospective recall of task failure rather than a laboratory incremental test, it provided the most robust and available estimate of variability for this specific subjective construct in the target population. A 1.5-point within-participant difference on the 1–10 voluntariness scale was defined a priori as the smallest effect of practical interest, as this represents 15% of the full scale range and would shift the expected mean from 5.14 to 3.64, moving the average response from near the midpoint toward a clearly more voluntary interpretation of the decision to stop. Relative to the previously observed variability, a 1.5-point difference corresponds to approximately 0.55 standard deviations, that is, a moderate effect. However, because the experiment used a within-subject design and no prior data were available for the no-power-data condition, sample size estimation was based on a paired-design sensitivity analysis that explored plausible values for the standard deviation of the no-power-data condition (2.74 to 5.0) and for the within-subject correlation between conditions (r = .3 to .7). In the absence of prior estimates for these parameters, we selected an intermediate planning scenario. An SD of 3.5 was chosen as a plausible value that was higher than the observed SD in the power-data-available condition (2.74), thereby allowing for increased variability in the less familiar condition while remaining within the explored range. Likewise, a within-subject correlation of .50 was selected to represent a moderate association between repeated ratings across conditions. Under this scenario, the estimated standard deviation of the paired difference scores was 3.19, yielding a standardized paired effect size of 0.47. A priori power analysis for a two-sided paired-samples comparison (α = .05, power = .80) indicated a required sample of 38 participants. Although our pre-registered hypothesis was directional, we retained a two-sided criterion to remain conservative. We therefore targeted 40 participants to allow for potential attrition or unusable data.
Written informed consent was obtained from participants. Participants were informed about the purpose of the study. The study was conducted in accordance with the ethical principles of the Declaration of Helsinki and was approved by the Research Ethics Committee of the University of Granada (3822/CEIH/2,023).
Experimental Procedures
A controlled and counterbalanced experiment was conducted with a within-subject design with the factor ‘availability of power data’, including two conditions: (1) Control (CT), without external references, in which the cyclist had no information available while pedaling; and (2) real-time power data visualization (POWER). In the POWER condition, the 3-s average power output was displayed on a cycle computer (Edge 1030, Garmin, Lenexa, KS, USA) mounted centrally on the handlebars of the cycle ergometer (AtomX, Wattbike, Nottingham, UK). The device was positioned at approximately 50 cm from the participant’s eyes to ensure optimal visibility. No interpretation of target values was provided, leaving participants to interpret the values on their own. Each participant performed two graded exercise tests (GXT) on a cycle ergometer, one for each experimental condition and in counterbalanced order. The same experimenters were present for both conditions to ensure consistency, and no verbal encouragement was provided in either session. To ensure experimental consistency, the sessions were spaced 7 days apart and were conducted at the same time of day for each participant to minimize circadian effects. Furthermore, participants were instructed to maintain their usual diet, avoid strenuous exercise, and abstain from caffeine and alcohol intake for 24 h prior to each testing session. All sessions were conducted in a controlled environment (Temperature: POWER = 17.5°C, CT = 17.7°C, p = 0.251; Humidity: POWER = 54.9%, CT = 54.5%, p = 0.396) for each participant. A familiarization session was not necessary because all participants were familiar with the test protocol from previous studies. Feedback on test performance was not provided until the entire study was completed to avoid biasing the participants. The methodology was pre-registered before the study began (https://osf.io/a9f47; properly anonymized data are also available).
The GXT protocol began with a fixed 5-min warm-up at 100 W. Immediately following this period, the incremental phase started, with the workload increasing by 20 W every 2 min until exhaustion. A uniform starting workload of 100 W was selected as it represents a low-intensity effort for this highly trained cohort, ensuring an adequate warm-up without inducing premature fatigue. A stepwise protocol was chosen instead of a ramp protocol to facilitate the stabilization of physiological variables at each intensity level and to allow for the calculation of maximal aerobic power (MAP) using established formulas. To minimize the participants’ ability to estimate their power output by counting stages in the CT condition, they were informed that the test was incremental but were not informed of the specific magnitude of the wattage increments. Physical performance was measured as MAP, that is, power achieved at the time of task failure. During the GXT, ventilation (VE) and oxygen uptake (VO2) were measured breath-by-breath (Fitmate Med, Cosmed, Italy). Power output was controlled by the cycle ergometer, and the data were transmitted to the cycle computer for recording. A chest strap was used to record HR (HRM Dual, Garmin, Lenexa, KS, USA) and the data were transmitted to the cycle computer. Right at the moment when participants reached task failure by stopping effort drastically, they were asked to rate their perception of the voluntariness of their decision to stop using a 1-10 scale (1: totally voluntary, I decide to stop the effort; 10: totally involuntary, it is my body that has reached its limit). Although this scale has not been formally validated, it was reviewed by experts and successfully utilized in a previous large-scale study (J.-J. Pérez-Díaz, Benítez, et al., 2026) to explore subjective experiences at the limit of effort. They also had to rate their perceived exertion (RPE) using Borg’s CR10 scale. Additionally, after the second session, participants were asked to evaluate their performance by comparing both trials. This evaluation included a qualitative rating on a scale of −5 to +5 (+5 means that viewing the power data helped them significantly improve performance, 0 means the data had no effect, and −5 means the data negatively impacted their performance). They were also asked to provide a quantitative estimate of the perceived difference in power output between sessions (in watts). 1
Data Analysis
The MAP was calculated as the power of the last completed step plus the proportional part of the uncompleted step (Equation (1)) (Salas-Montoro et al., 2022).

Equation (1). Formula for the calculation of the MAP, considering the last completed step and the proportional part of the uncompleted step.
Statistical Analysis
Confirmatory Analysis
The descriptive analysis included means and standard deviations (SD). Normality of continuous variables (absolute and relative to body mass MAP, VO2MAX, and HR) was checked using the Shapiro-Wilk test. A paired-samples t-test was performed for normally distributed variables, while RPE and voluntariness scales were analyzed using the Wilcoxon signed-rank test. Additionally, a Chi-square goodness-of-fit test was performed on the pre-registered −5 to +5 qualitative performance rating scale. Statistical analysis was conducted using the open-source project JASP (version 0.19.1), with statistical significance accepted when p < 0.05.
Exploratory Analysis
Additionally, an exploratory 2 × 2 ANOVA (Condition x Order) was performed to assess whether the order of session presentation (Group A: 1st session POWER and 2nd session CT; Group B: 1st session CT and 2nd session POWER) modulated the results reported in the confirmatory analyses. Although no a priori hypothesis was formulated regarding this effect, order was examined since repeated maximal-effort exercise tests may be influenced by practice or learning effects inherent in repeated maximal-effort protocols (Capriotti et al., 1999). When a significant condition × order interaction was observed, simple-effects pairwise comparisons were performed with Bonferroni-adjusted p-values. As an exploratory deviation from our pre-registered protocol, we also evaluated the cyclists’ post-hoc quantitative judgments of performance in watts. To explore the cyclists’ metacognitive awareness of the feedback’s effect, we assessed their ability to accurately judge changes in their own performance. Specifically, we calculated the objective difference in MAP between conditions (POWER minus CONTROL) for each participant. A paired-samples t-test was then used to compare these objective difference scores against the subjective quantitative estimates provided by the cyclists.
Results
Confirmatory Analysis
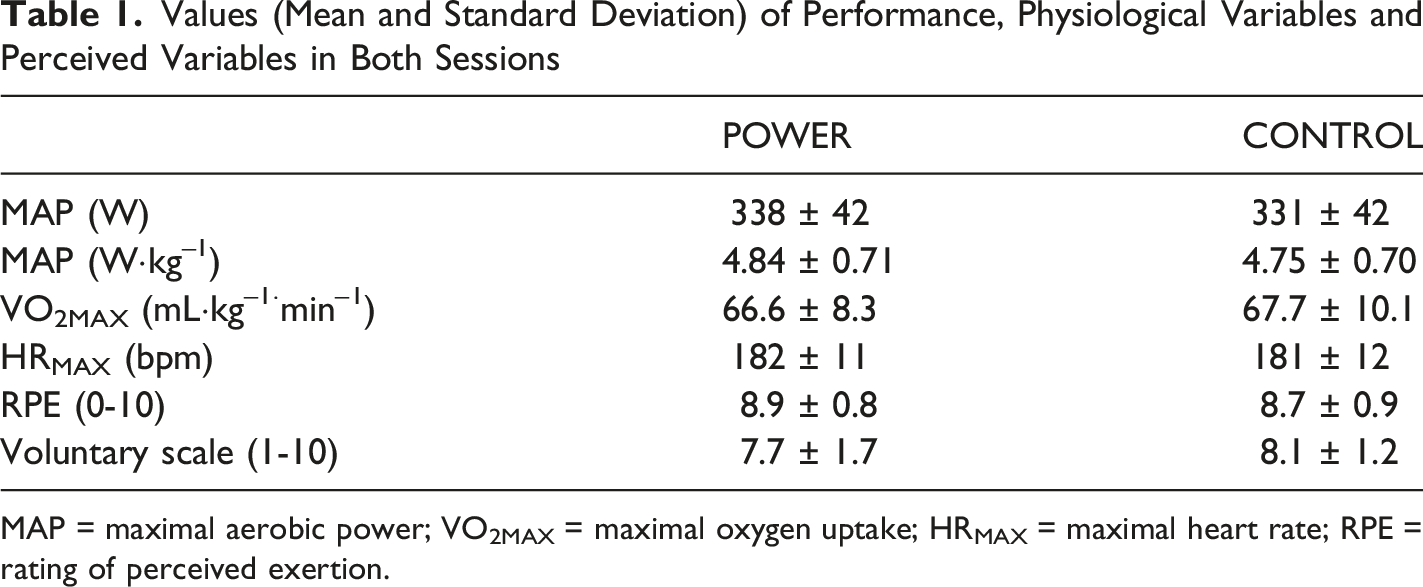
The use of the cycle computer to visualize power data improved MAP, both in absolute terms, t (39) = 3.081, p = 0.004, Cohen’s d = 0.487, and relative to body mass, t (39) = 3.156, p = 0.003, Cohen’s d = 0.499 (Figure 1). However, there were no statistical differences between conditions in VO2MAX, t (36) = −1.123, p = 0.269, Cohen’s d = −0.185); HRMAX, t (36) = 0.884, p = 0.383, Cohen’s d = 0.145; RPE, W = 190.0, p = 0.141, rank-biserial correlation = 0.377; and perceived voluntariness in task failure, W = 190.5, p = 0.159, rank-biserial correlation = −0.278 (Figures 2 and 3). Mean values are presented in Table 1. Regarding the distribution of responses, it is noteworthy that while most participants perceived their task failure as predominantly involuntary, only 7.5% of all tests (6 out of 80) resulted in a score of 10, indicating a ‘completely involuntary’ decision (Figure 3). Regarding the pre-registered qualitative assessment of the feedback’s impact, the distribution of responses was significantly heterogeneous (χ2 (6) = 24.75, p < 0.001) (Figure 4), with responses clustering around the central categories and low-magnitude ratings, particularly −1, 1, and 2, rather than being uniformly distributed across the scale. Performance measured as Maximal Aerobic Power (MAP): (A) in absolute terms (W), (B) relative to body mass (W·kg–1). The left side shows the difference in performance between sessions for every participant, with the positive bars representing higher performance when power was visible. On the right side, boxplots show the median (horizontal line within each box), the interquartile range (IQR; the box), and 1.5 times the IQR (whiskers), as well as all individual data Physiological variables: (A) Maximal oxygen uptake (VO2MAX), (B) Heart Rate (HR). The left side shows the difference between sessions for every participant, with the positive bars representing higher values when power was visible. On the right side, boxplots show the median (horizontal line within each box), the interquartile range (IQR; the box), and 1.5 times the IQR (whiskers), as well as all individual data Perceptual variables: (A) Overall voluntariness at task failure, (B) Rating of Perceived Exertion (RPE). The left side shows the difference between sessions for every participant, with the positive bars representing higher values (more involuntary) when power was visible. On the right side, boxplots show the median (horizontal line within each box), the interquartile range (IQR; the box), and 1.5 times the IQR (whiskers), as well as all individual data Values (Mean and Standard Deviation) of Performance, Physiological Variables and Perceived Variables in Both Sessions MAP = maximal aerobic power; VO2MAX = maximal oxygen uptake; HRMAX = maximal heart rate; RPE = rating of perceived exertion. Distribution of qualitative ratings of the perceived impact of power feedback on performance. Responses were given on a scale from −5 (power data negatively impacted performance) to +5 (power data greatly improved performance), with 0 indicating no perceived effect



Exploratory Analysis
Results of the Exploratory Analysis Considering the Interaction Between Condition and Order

MAP = maximal aerobic power; VO2MAX = maximal oxygen uptake; HRMAX = maximal heart rate; RPE = rating of perceived exertion; CT = control.

Results of voluntariness in task failure differentiating by groups: (A) POWER condition first, (B) Control condition first. The left side shows the difference between sessions for every participant, with the positive bars representing higher values (more involuntary) when power was visible. On the right side, boxplots show the median (horizontal line within each box), the interquartile range (IQR; the box), and 1.5 times the IQR (whiskers), as well as all individual data
Finally, cyclists’ quantitative estimation of the performance change between CT and POWER sessions did not significantly deviate from the actual MAP difference (Perception = 5 ± 20 W, Real Difference = 6 ± 13 W, p = 0.744, Cohen’s d = 0.052) (Figure 6). Notably, a descriptive sub-group breakdown revealed an interesting pattern regarding participants’ feedback perception. Cyclists who qualitatively reported a negative impact (−1 to −3; n = 15) showed a highly consistent negative perceived quantitative estimation (Mean = −13 W, with individual estimates reaching as low as −50 W). However, their actual performance difference presented high individual variability (Mean = 5.3 W, ranging from individual drops of −8 W up to improvements of 30 W). Conversely, those reporting a positive impact (+1 to +3; n = 22) consistently aligned both their perceived quantitative estimation (Mean = 18 W) and their actual performance outcomes in a positive direction (Mean = 8 W). Comparison, for each cyclist, of the actual difference in performance between sessions (red bars) and their perceived rating (blue bars). Positive values represent a higher performance or rating of performance in the session where power was seen
Discussion
The results of this study provide empirical evidence on the perception of voluntariness in task failure and the impact of access to power data on cyclists’ performance. First, the voluntariness scale used in this experiment yielded higher values than those obtained in the previous survey (J.-J. Pérez-Díaz, Benítez, et al., 2026). While the average perceived voluntariness in the general questionnaire was approximately 4.8, in this study, the mean values were considerably higher, 7.7 in the power feedback session and 8.1 in the control session. This suggests that the perception of voluntariness may be influenced by the context in which it is measured, raising questions about the influence of the incremental nature of the effort or the fact that participants were asked immediately after the test.
Although the average score in this cohort (7.7 and 8.1 out of 10, where 10 represents a total lack of perceived voluntariness) suggests that task failure is perceived as predominantly involuntary, the fact that only 6 out of 80 tests were rated as ‘completely involuntary’ is noteworthy. This finding reinforces the idea that, while athletes may feel they lack absolute control over the cessation of effort, in most cases, a certain degree of perception of control over the final decision still exists (c.f. Haggard, 2019; Kayser, 2003). Regarding the main hypothesis of our study, confirmatory analyses showed no statistically significant differences in perception of voluntariness of the decision to stop as a function of the availability of power data. However, the exploratory analyses revealed a significant Condition × Order interaction. Preventing cyclists who had performed the first incremental test viewing their power data from viewing them in the second session led to an average of 1-point increase in their perception of involuntariness in that second incremental test. That is, removing performance data from an effort that had previously been performed with access to that information seemed to reduce the perception or sense of control over the decision to stop. In contrast, for the group that performed the control condition first, no statistically significant differences in perceived voluntariness were observed between sessions. It would appear that the removal of power data may diminish an athlete’s sense of control, making the decision to stop feel more involuntary. As this is an exploratory finding, future research is needed to investigate the robustness of this finding and to determine if this reflects a greater reliance on external feedback or a metacognitive shift when familiar performance anchors are withdrawn.
In terms of objective performance, although absolute and relative power were significantly higher in the POWER condition, no differences were reported in HRMAX or VO2MAX between the two sessions. This finding supports previous studies (Moffatt et al., 1994) suggesting that trained athletes do not necessarily improve VO2MAX in a single test despite enhancing their athletic performance. This dissociation suggests that the power feedback did not elicit a higher physiological ceiling (Moffatt et al., 1994), but rather impacted the regulation of effort or the tolerance of fatigue, acting as a motivational feedback source (Dallaway et al., 2022), allowing participants to sustain the effort longer. This performance-enhancing effect could be attributed to an attentional distraction or increased task motivation (Hutchinson et al., 2015; Pérez-Díaz et al., 2026), where power data acts as a dissociative strategy that shifts the athlete’s focus away from interoceptive cues of fatigue and toward an external target. By adopting this external focus, cyclists may better tolerate the increasing physiological distress, sustaining the workload for longer before reaching task failure. Interestingly, the exploratory analyses showed that viewing their power data improves participants’ performance irrespective of the order in which they performed the two maximal graded tests. The fact that simply viewing power data led to performance improvement suggests that these data play a key role in task failure, especially for those accustomed to training with a power meter.
A crucial observation, evident in Figure 1, is the high inter-individual variability in response to feedback. For some participants, performance decreased when viewing power. In the future, it would be interesting to explore whether there are any factors that affect the influence of this type of feedback on performance. For some individuals, continuous feedback may induce anxiety or a counter-productive external focus of attention (Pérez-Díaz et al., 2025; Theodorakis & Goudas, 2007). In addition, further research should explore whether this effect is amplified in more self-paced efforts, as previous studies have not found significant improvements in sports performance in such conditions (Smits et al., 2016). Our GXT protocol minimizes complex pacing decisions, which may maximize the feedback’s motivational role, whereas in a self-paced trial, feedback is used more for pacing strategy (Abbiss & Laursen, 2008).
Another relevant aspect is the variability observed in participants’ perception of their own performance (Figure 6). Our analysis confirmed that the distribution of qualitative ratings on the −5 to +5 scale was significantly heterogeneous, showing that responses were not randomly or uniformly distributed but clustered significantly around neutral and adjacent categories. Interestingly, however, on average, the group’s quantitative judgment of the performance difference between sessions did not significantly deviate from the actual difference, indicating that participants were accurate in estimating the relative impact of the feedback. However, it is important to clarify that this accuracy refers specifically to the perceived change between conditions, rather than their ability to judge absolute power output in each trial. Furthermore, while the group mean was accurate, Figure 6 reveals notable individual variations, with several participants showing substantial discrepancies between their perceived and actual performance. Crucially, further descriptive exploration unveiled a high level of convergence between the subjective measures, most participants systematically matched the direction of their qualitative choices with their quantitative estimates in watts. Within this context, an interesting dissociation emerged regarding objective performance. The subset of cyclists who qualitatively felt that the feedback was detrimental (scores from −1 to −3) generally estimated a performance drop. However, their actual physiological outcomes showed substantial individual variability, while some athletes indeed performed worse, others achieved marked improvements, pulling the subgroup’s average into a positive net change. This dissociation suggests that the ergogenic effect of visual feedback might operate independently of subjective comfort, even when athletes perceive the digital anchor as disruptive or anxiety-inducing, the salience of the performance data successfully drives pacing maintenance, resulting in objective performance enhancements despite negative psychological appraisals. This phenomenon warrants investigation into the factors that determine an athlete’s ability to accurately assess their performance, such as interoceptive accuracy or metacognitive awareness (Seabury et al., 2023).
In summary, the present study demonstrates that access to power data enhances cyclists’ performance. In terms of the subjective experience linked to the voluntariness of the decision to stop, an interesting and unexpected pattern of results emerged from the exploratory analysis, suggesting that removal of a familiar feedback source may reduce an athlete’s perceived control over their effort. Finally, some limitations must be acknowledged regarding the generalizability of our findings. The study was conducted on a specific cohort of highly trained cyclists, predominantly male, who possessed at least one year of experience with power meters and used them regularly in their training. Consequently, these results may not be directly extrapolated to all types of cyclists. Future research should aim for more diverse cohorts to explore potential differences in the perception of voluntariness at task failure. The high inter-individual variability in response to feedback highlights that its effect is not uniform and warrants further investigation into the psychological moderators of feedback response in endurance sports.
Footnotes

Ethical Considerations
The study was conducted in accordance with the ethical principles of the Declaration of Helsinki and was approved by the Research Ethics Committee of the University of Granada (3822/CEIH/2,023).
Consent to Participate
Written informed consent was obtained from participants.
Funding
The authors disclosed receipt of the following financial support for the research, authorship, and/or publication of this article: This study was supported by predoctoral fellowship FPU20/00611 from the Spanish Ministry of Universities to Juan José-Pérez-Díaz and by PID2023-152135NB-I00 funded by MICIU/AEI/10.13039/501100011033 and by FEDER, UE to Daniel Sanabria.
Declaration of Conflicting Interests
The authors declared no potential conflicts of interest with respect to the research, authorship, and/or publication of this article.