
Abstract
The ‘directional’ definition of negative campaigning (i.e. when candidates leverage critiques against their political opponents) has been criticized for lacking reliability and validity. Does this critical assessment resist scrutiny? We propose, via nine different original studies, a full-scale reassessment of this critical assessment. Building on novel evidence from sources as disparate as expert ratings of elections across the world, automated and manual coding of social media posts, candidate self-ratings, cross-sectional surveys, experimental evidence, and more, we provide a much less pessimistic outlook. The evidence discussed in the nine studies showcases high levels of (self-)observer agreement (i.e. different people evaluate the same phenomenon similarly), situational consistency (evaluations are stable across time and space), convergent validity (different independent measures of the same phenomenon are strongly correlated), construct validity (measures can be used to provide empirical support for theoretically cogent hypotheses), and discriminant validity (proximate phenomena are perceived differently). The directional measure of campaign negativity is not perfect, but it is very much alive and kicking. The data and materials for all nine studies are open for replication and re-analysis.
Introduction
Against the backdrop of an increasingly confrontational political climate across the world, negative campaigning is a much-researched phenomenon in political communication, electoral studies, political psychology, and political studies more at large. However, there is still debate about what negative campaigning actually is and how exactly it should be measured (e.g. Haselmayer, 2019; Lipsitz and Geer, 2017; Sigelman and Kugler, 2003). The so-called ‘directional approach’ that defines negative campaigning as any criticism leveraged against political opponents (Geer, 2006: 23) has become the benchmark for most studies but has at the same time suffered critiques ‘for being too broad and unspecific’ (Haselmayer, 2019: 359). Two foundational studies (Lipsitz and Geer, 2017; Sigelman and Kugler, 2003), both conducted using data from the United States, compare academic assessments to what journalists, politicians, campaign managers, and the public think negative campaigning is. The two studies, broadly, show a generalized mismatch; not only does the academic definition of negative campaigning not match the view of practitioners and the public, but, perhaps even more worryingly, the assessment of what is considered an attack varies greatly within these groups. Broadly speaking, these studies suggest that the scientific definition of negative campaigning, at least according to the directional approach, differs from what is understood outside academia, that is, communication that is noticeably ‘bad, unfair, dishonest, and illegitimate’ (Nai and Walter, 2015: 12).
Is this true? In recent years, some scholars have advocated for a narrower approach, that is, to only consider campaign communication as negative if an ‘evaluative’ component is associated with it, for instance, when attacks violate the established norms of political debate (e.g. Lipsitz and Geer, 2017; see also Vargiu et al., 2026), but the discussion about how to define and measure negative campaigning is not just a conceptual debate. Knowing that much research on the impact of negative campaigns offers inconclusive results (Lau et al., 1999, 2007), for instance, when it comes to whether or not attack politics enhances or depresses turnout (for a review, see Krupnikov, 2011; Maier, 2025), a question could be raised as to whether such empirical misfires could be due, quite simply, to the usage of an inadequate definition of negativity. This criticism, which in essence claims that the measurement lacks the required level of quality (i.e. reliability and validity), poses a major threat to the robustness of the results of a very large body of research based on hundreds of studies that have used the directional approach.
From a substantive standpoint, the critique cannot be ignored. Empirically, however, the fact that the existing evidence pointing to conceptual flaws comes exclusively from the United States – a country that certainly cannot be considered as representative of general trends when it comes to attack politics, which remains ‘as American as apple pie’ (Scher, 1997: 27) – raises the question as to whether this conceptual critique is, in itself, externally valid. Is the evidence of low reliability and low validity when it comes to the measurement of attack politics using a directional measure confirmed when opening up dramatically the scale of the investigation and moving away from the American case? This is what our investigation intends to assess. Building on novel evidence from sources as disparate as expert ratings of elections across the world, automated and manual coding of social media posts, candidate self-ratings, cross-sectional surveys, and more, we have compiled a series of nine interrelated studies that tackle upfront the two main critiques that are addressed to the directional approach of campaign negativity: are measures that build on such an approach yielding (1) reliable and (2) valid results?
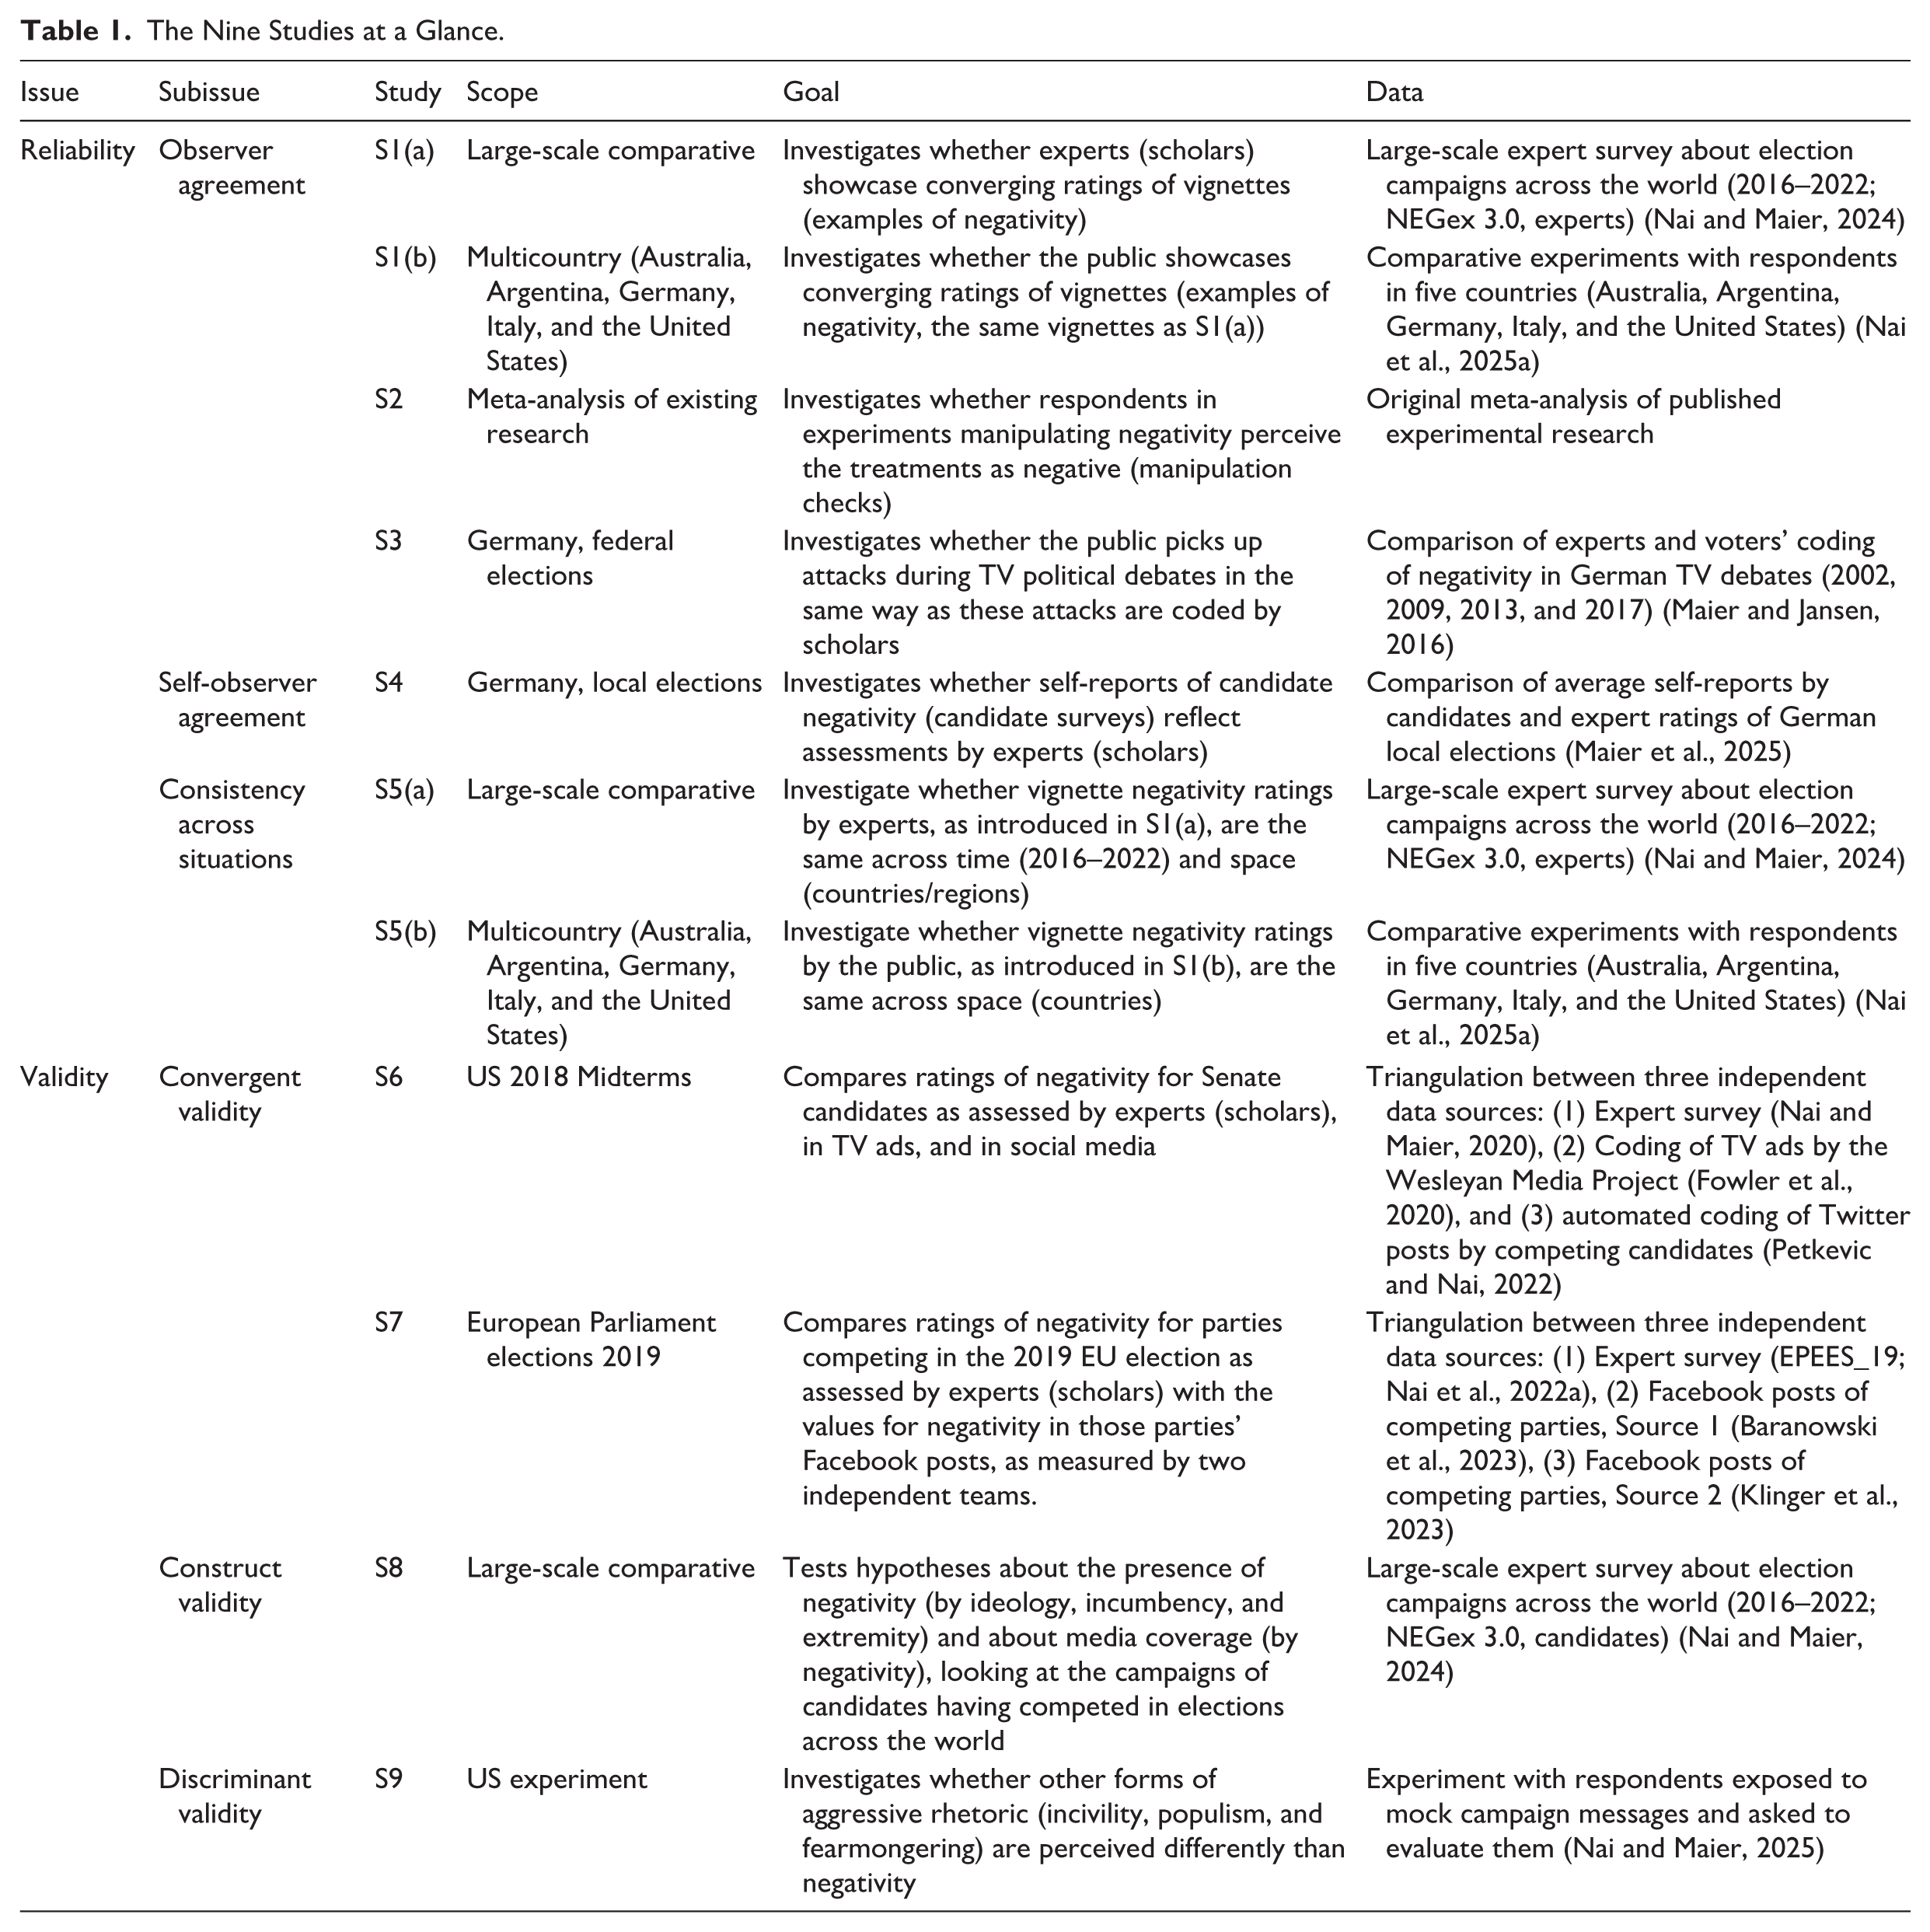
Table 1 provides a general overview of the nine studies. All the data and codes used across the various studies can be openly accessed for replication and further analyses at the following OSF Repository: https://osf.io/un4f8.
The Nine Studies at a Glance.
We start with a critical discussion about how to conceptualize negative campaigning (and whether it is reasonable to include, as many argue, an ‘evaluative’ component) before turning to the studies assessing, in turn, reliability and validity.
Defining Negative Campaigning
Despite the extensive research on the extent, trends, influencing factors, and impact of negative campaigning (e.g., Nai & Walter, 2015), there is still debate about what negative campaigning actually is and how exactly it should be measured. The concept that has become widely used is the so-called directional approach. It defines negative campaigning as ‘any criticism leveled by one candidate against another during a campaign’ (Geer, 2006: 23) – and therefore as the opposite of what is sometimes called ‘acclaims’ or ‘positive campaigning’, namely, the self-praise of an actor (e.g. Benoit, 2022: 38–39).
The directional approach is very open as far as the exact form of an attack is concerned; ‘any type of criticism counts as negativity’ (Geer, 2006: 23). Therefore, ‘under this definition, there is no gray area’ (Geer, 2006: 23). Building on this approach, further dimensions were identified with which attacks can be described more precisely, in particular the focus of an attack – that is, whether an attack is directed against the policy position or the character of an opponent – and its degree of incivility (Brooks and Geer, 2007; Vargiu et al., 2024). Other researchers suggest differentiating negative messages within this directional view according to their strength (e.g. Haselmayer and Jenny, 2017), while others have argued to shift the focus by considering (also) messages that are ‘unfair’, ‘irrelevant’, ‘misleading’, ‘nasty’, or ‘trivial’ criticism of the political opponent (Mayer, 1996: 443). Such attributes are reminiscent of what scholars define as ‘incivility’ (e.g. Muddiman, 2017) – although there is still no agreement on what kind of behaviour is civil or uncivil (e.g. Bormann et al., 2022). Importantly, the idea behind these alternative conceptualizations is often that ‘some negative campaigning is good and some negative campaigning is bad’ (Mayer, 1996: 455), that is, that attacks, depending on their specific form, can be either useful or harmful to political discourse, and only criticism that is harmful to society should be considered negative. While such an ‘evaluative’ approach might fit with what is generally understood outside of academia as negative campaigning (e.g. Swint, 1998), that is, mudslinging, attacks ‘below the belt’ (Reiter and Matthes, 2022), dirty politics (e.g. Jamieson, 1992), and so forth, two reasons exist, in our opinion, not to limit the conceptualization of negative campaigning to such an evaluative component. On the one hand, attacks are not always detrimental to society (e.g. Rossini, 2022) – very much in the same way as political anger, when turned towards righteous targets, for example, to fight against prejudice, can be a morally legitimate strategy for marginalized groups (e.g. Beckman, 2026; Cherry, 2021). On the other hand, it remains questionable whether focusing on an evaluative dimension yields an enhanced clarity in the conceptualization of negativity. We would rather argue that the opposite is true, given that evaluative assessments are a personal experience driven by societal and individual norms (Vargiu et al., 2026) – what is nasty and vulgar for me is not necessarily so for you. Thus, negativity acquires subjective connotations. All in all, including evaluative judgements into the conceptualization of negativity likely ‘jeopardizes validity and reliability’ (Walter, 2014: 44). To be sure, we are not arguing that evaluative considerations ought to be excluded from research on negative political communication – quite the opposite. Recent research has clearly shown that evaluations of negativity and incivility not only diverge at the individual level based on plausible patterns but also matter considerably for their effectiveness (e.g. Muddiman et al., 2022; Vargiu et al., 2026). For instance, Nai and Maier (2023) show that exposing respondents to attacks between politicians increased affective polarization in the public, but only insofar as these attacks are evaluated as negative. But the fact that such evaluations need to be considered for a more holistic understanding of the dynamics of negativity does not imply that they ought to be part of its conceptual definition.
All in all, from a purely conceptual standpoint, the directional measure seems to be the one with the highest potential in terms of clarity. But how reliable and valid is research that builds on measures stemming from this conceptualization? We answer these questions sequentially, introducing a wealth of new data and triangulations supporting the idea that the directional definition is certainly alive and kicking.
Reliability
Reliability ‘refers to the dependability or consistency of measurement across conditions’ (Bandalos, 2018: 157). The higher the reliability of the measurement, the more we can trust it, ‘in the sense that we would obtain very similar scores if we were to repeat the test’ (Bandalos, 2018: 155). We discuss below a series of tests for the reliability of directional measures of campaigning negativity. On the one hand, we investigate observer agreement, that is, whether different observers of given positive or negative messages arrive at a similar conclusion in terms of how negative they are once provided with a directional definition of negativity; we do so via four separate studies: looking both at the judgment of experts and the judgment of the lay public across different countries of a series of mock campaign vignettes (Study 1), via novel meta-analytical evidence showing that respondents in experiments tend to have a good understanding of what they are shown (Study 2), comparing the presence of attacks in German TV debates with the public’s perception of the presence of attacks (Study 3), and by analysing whether candidates’ self-reports on their attack behaviour match expert assessments (self-observer agreement; Study 4). On the other hand, we leverage again the vignettes discussed in Study 1 to investigate whether ratings of experts and the lay public are stable across different conditions, most notably across time and in different countries (Study 5).
Observer Agreement
Do different observers converge when evaluating negative messages? In traditional content analysis, this is usually assessed via intercoder reliability scores, where a reduced number of coders are asked to rate a high number of coding units (e.g. campaign messages), and high convergence indicates robustness of the empirical construct and – the reason why these scores are usually calculated – the success of the coding procedure. A much more stringent test is the one that compares the ratings of a small number of units (e.g. messages) by a large number of observers. To what extent do those ratings converge? Study 1 discusses the results of such a test.
Study 1. Rating Vignettes
To test for congruence in observer ratings, we leverage two separate data sources. The first is version 3.0 of an expert survey about the content of campaigns in elections worldwide, which we have been running since 2016 (the Negative Campaigning Comparative Expert survey; NEGex; Maier and Nai, 2022; Nai, 2020). The second is a collection of surveys that was fielded with samples of respondents in Argentina (September 2022, N = 2045), Australia (September/October 2022, N = 1907), Germany (November 2022, N = 1914), Italy (January/February 2023, N = 2494), and the United States (July/August 2022, N = 1956), pooled together into cross-country data (Nai et al., 2025a). 1 In both surveys, respondents (experts and voters) were asked to rate a series of six mock campaigning messages (‘vignettes’) in terms of how positive or negative they perceived them to be. Some of these vignettes were clearly positive (e.g. Vignette 1 is ‘I care about people’), some were clearly negative (e.g. Vignette 6 is ‘My opponent is dishonest and corrupt’). Prior to rating these vignettes, all respondents were provided with standard directional definitions of negative and positive campaigning.
Figure 1 plots the distribution of the ratings for the six vignettes for both experts (Panel (a), on top) and voters (Panel (b), at the bottom). As the figure shows, for both expert and voter perceptions, negativity steadily increases as the vignette becomes more negative, with observations relatively concentrated around the central tendency of the distributions.
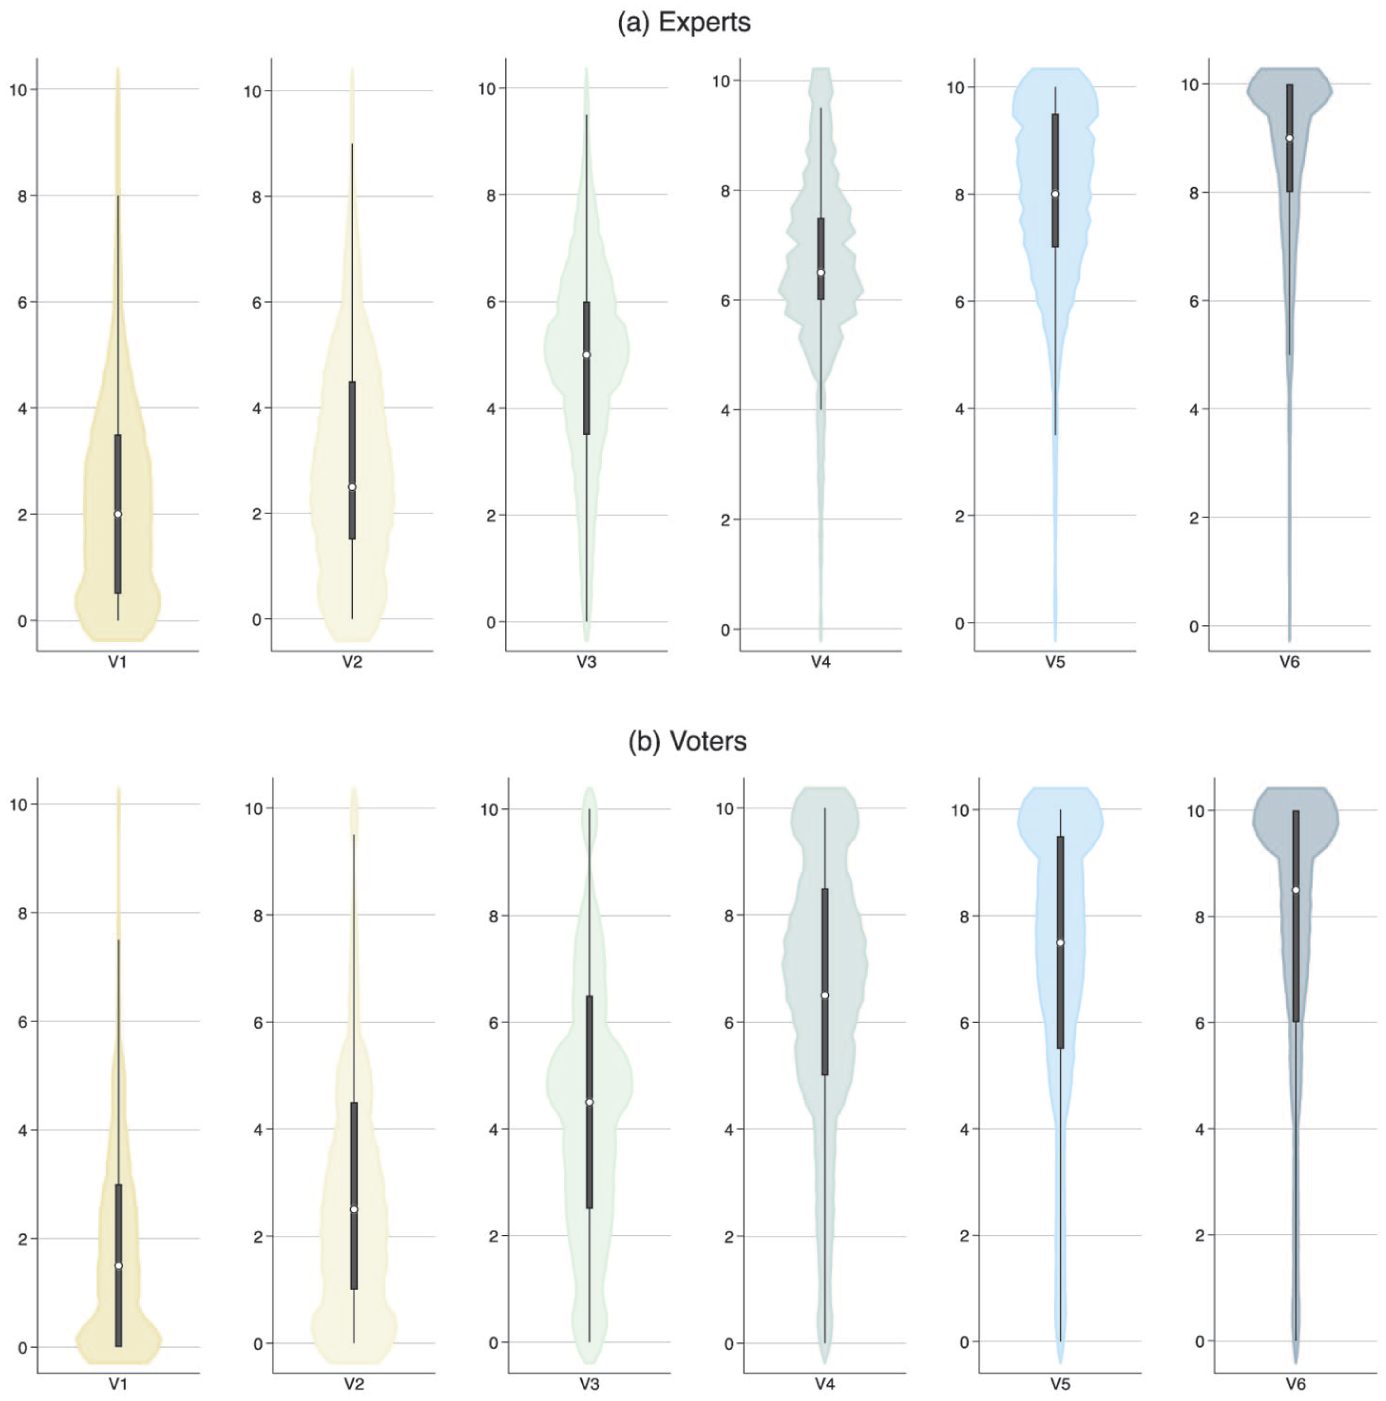
S1. Expert and Voter Ratings of Campaign Vignettes.
Importantly, as it can also be eyeballed from Panel (a) in Figure 1, for experts, the standard deviation is lower for the three negative vignettes (Vignettes 4 to 6), ranging between SD = 1.79 (Vignette 4) and SD = 1.94 (Vignette 6). For the positive and contrast vignettes, the standard deviation is always above 2.0 points (i.e. a minimum of 20% of the original range), ranging between SD = 2.04 (Vignette 1) and SD = 2.18 (Vignette 2). While these differences should not be overestimated, they nonetheless seem to indicate that experts have a somewhat easier time rating the negative vignettes as such than the positive vignettes. For voters, the standard deviations are all within a relatively comparable range, with the exception of Vignette 1, which has a considerably lower deviation (SD = 2.04); interestingly, it is the final vignette, the most negative, that has the highest deviation in voter ratings (SD = 2.93).
The profile of experts does not seem to impact the vignette ratings in a substantial or meaningful way (Figure 2) – except for their ideological positioning: the more the expert showcases a right-wing profile (measured via the traditional 10-point self-positioning left-right scale), the less likely they are to rate as ‘negative’ the most negative vignettes. Right-wing experts, in other terms, showcase a greater tolerance towards negativity – likely due to the differences in psychological dispositions between right- and left-wing individuals (for a discussion see, e.g. Jasko et al., 2022). A positive association between right-wing ideology and usage of negativity has also been frequently reported in the literature (e.g. Lau and Pomper, 2001; Nai, 2020; Nai et al., 2022a).
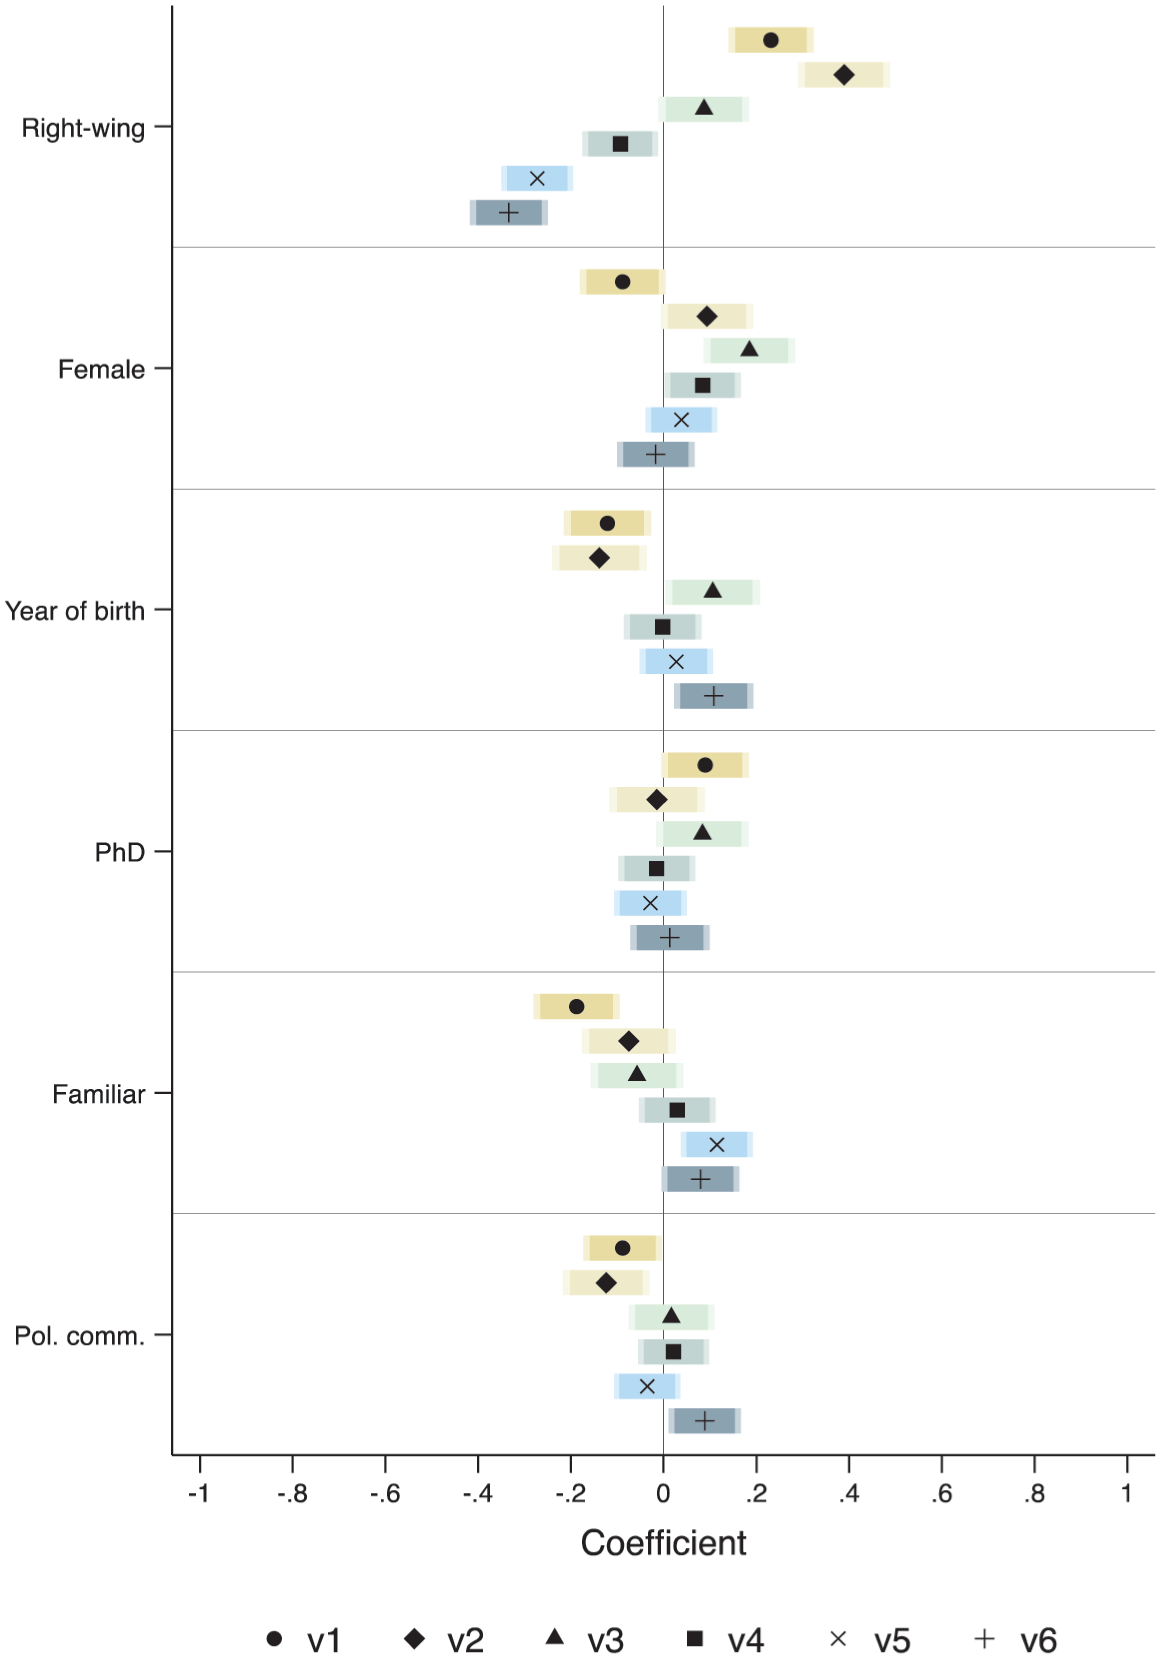
S1. Expert Ratings of Campaign Vignettes, Profile Effects.
The profile of voters seems more strongly related to their vignette ratings (Figure 3) than the profile of experts. For voters as well, a right-wing ideology is associated with perceiving the more negative vignettes as less negative. In voters, the more negative vignettes are more likely to be seen as such by women and older respondents (also see Fridkin and Kenney, 2011). All in all, the lay public seems to be less consistent in their evaluations of negativity than experts: higher deviations from the central tendency and higher profile effects.
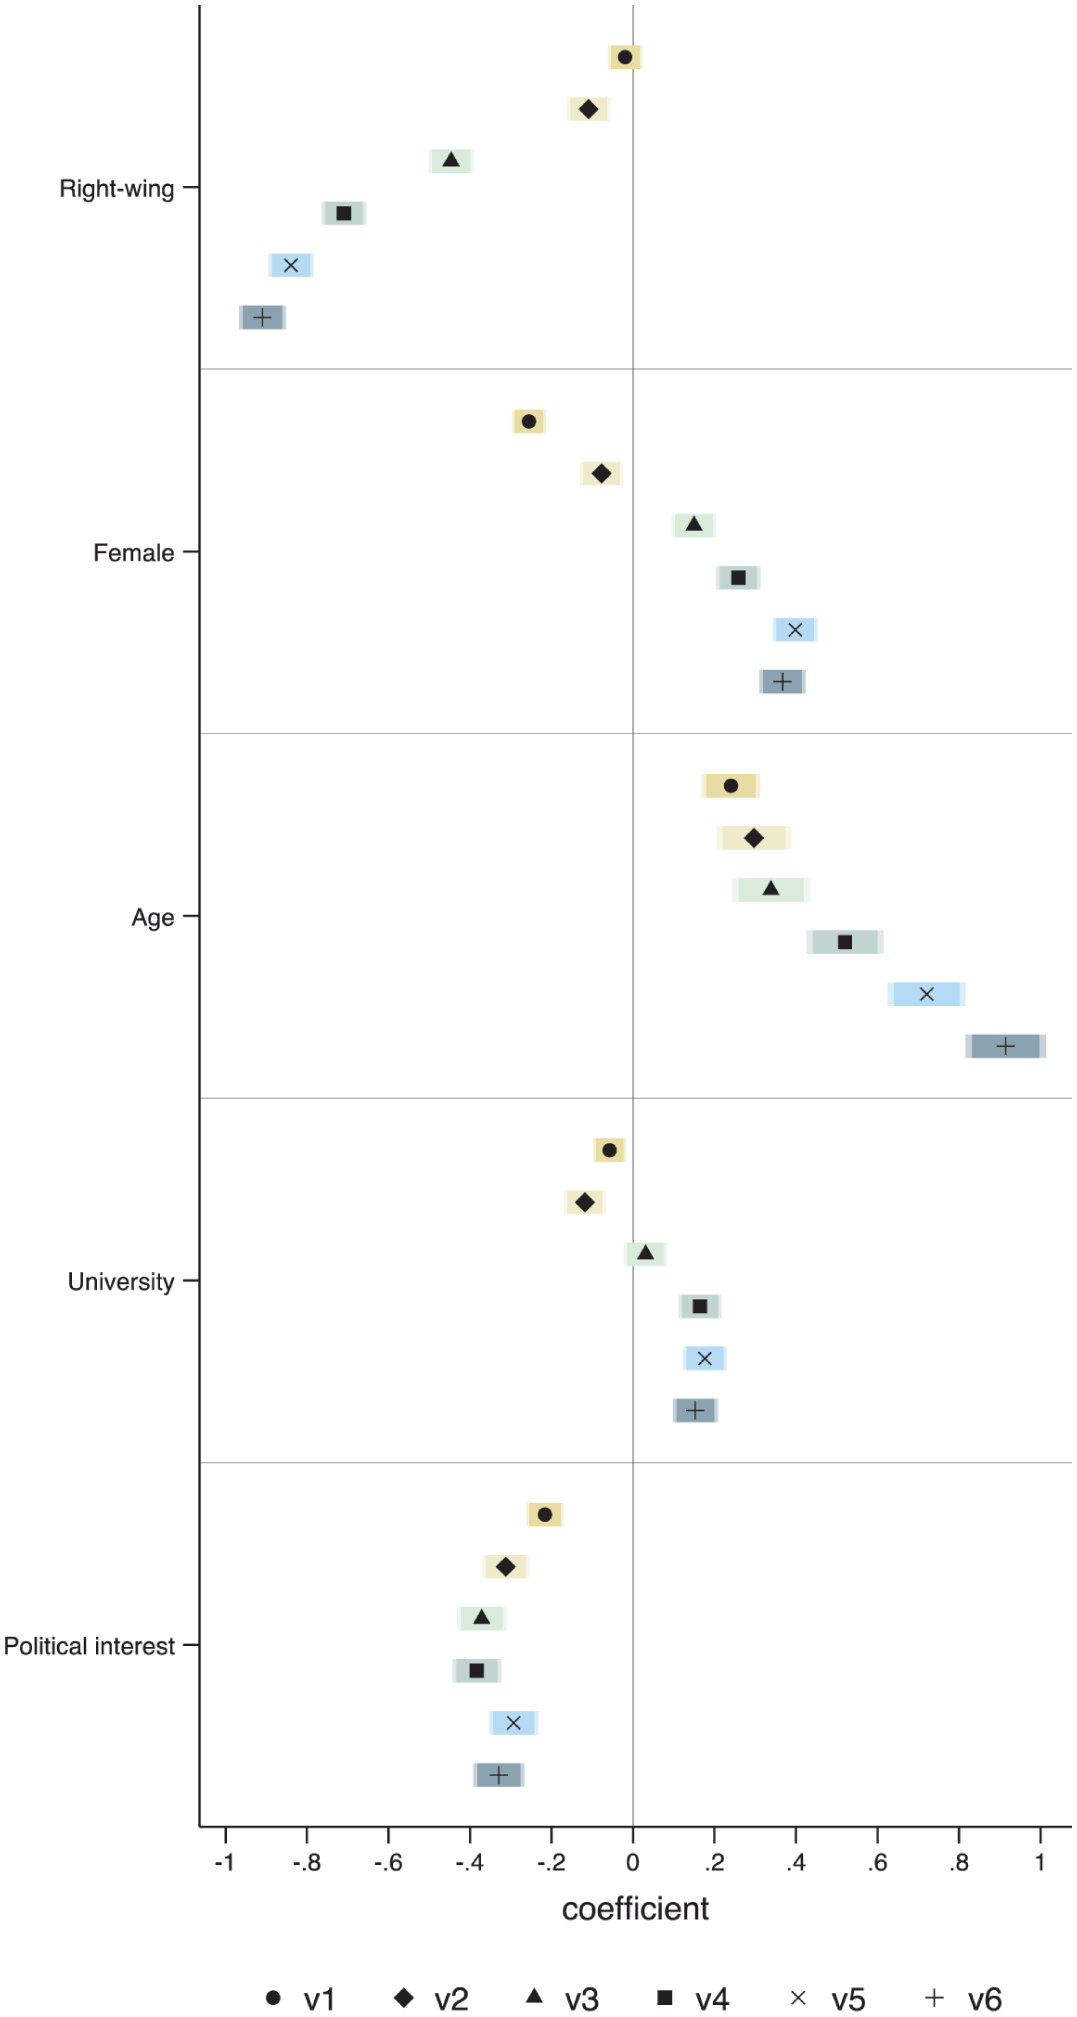
S1. Voter Ratings of Campaign Vignettes, Profile Effects.
Study 2. Manipulation Checks in Experimental Research, a Meta-Analysis
Evidence in Study 1 shows that experts and the lay public seem to converge in their assessment of campaign vignettes. This evidence is, however, limited by the boundaries of the exercise – that is, the fact that only a handful of mock vignettes are part of the assessments.
With this in mind, we build in S2 on the general idea of ‘multiverse testing’, that is, trying to obtain evidence that is as free from researchers’ degrees of freedom as possible by expanding the palette of test materials and protocols (e.g. Lonsdorf et al., 2022). To do so, we discuss here the results of a meta-analysis 2 we have conducted on published articles discussing experimental research on negative campaigning (1990–2018). Specifically, we are interested to see how participants across these studies perceive the campaigning materials they were exposed to – and, notably, whether they saw them as being ‘negative’ as the researcher intended. In other terms, the results below are simply the average effect found in manipulation checks found in experimental research manipulating campaign negativity.
Criteria for inclusion of studies are summarized in Supplemental Table A1 (Appendix). After excluding studies that did not report sufficient evidence about the manipulation checks (N = 14), the analysis includes N = 26 experimental studies on negative campaigning published between 1990 and 2018 (date of data collection), covering a total of 3828 participants. For all these studies, the mean on the manipulation check for both the treatment (e.g. a negative TV ad) and the control was retrieved and standardized on a 0–1 scale for comparability, where 1 indicates that the respondents perceived the stimulus they were exposed to as very negative. Supplemental Table A2 (Appendix) summarizes the studies included in the meta-analysis.
Figure 4 plots the average manipulation check values across all treatments and controls and shows that negative values are overwhelmingly and significantly considered as more negative than their control counterparts, t(23) = 11.1, p < .001. Participants in these experiments, in other terms, seem to perceive exactly what researchers intended them to perceive, at least when asked to rate the stimuli in terms of their negativity.
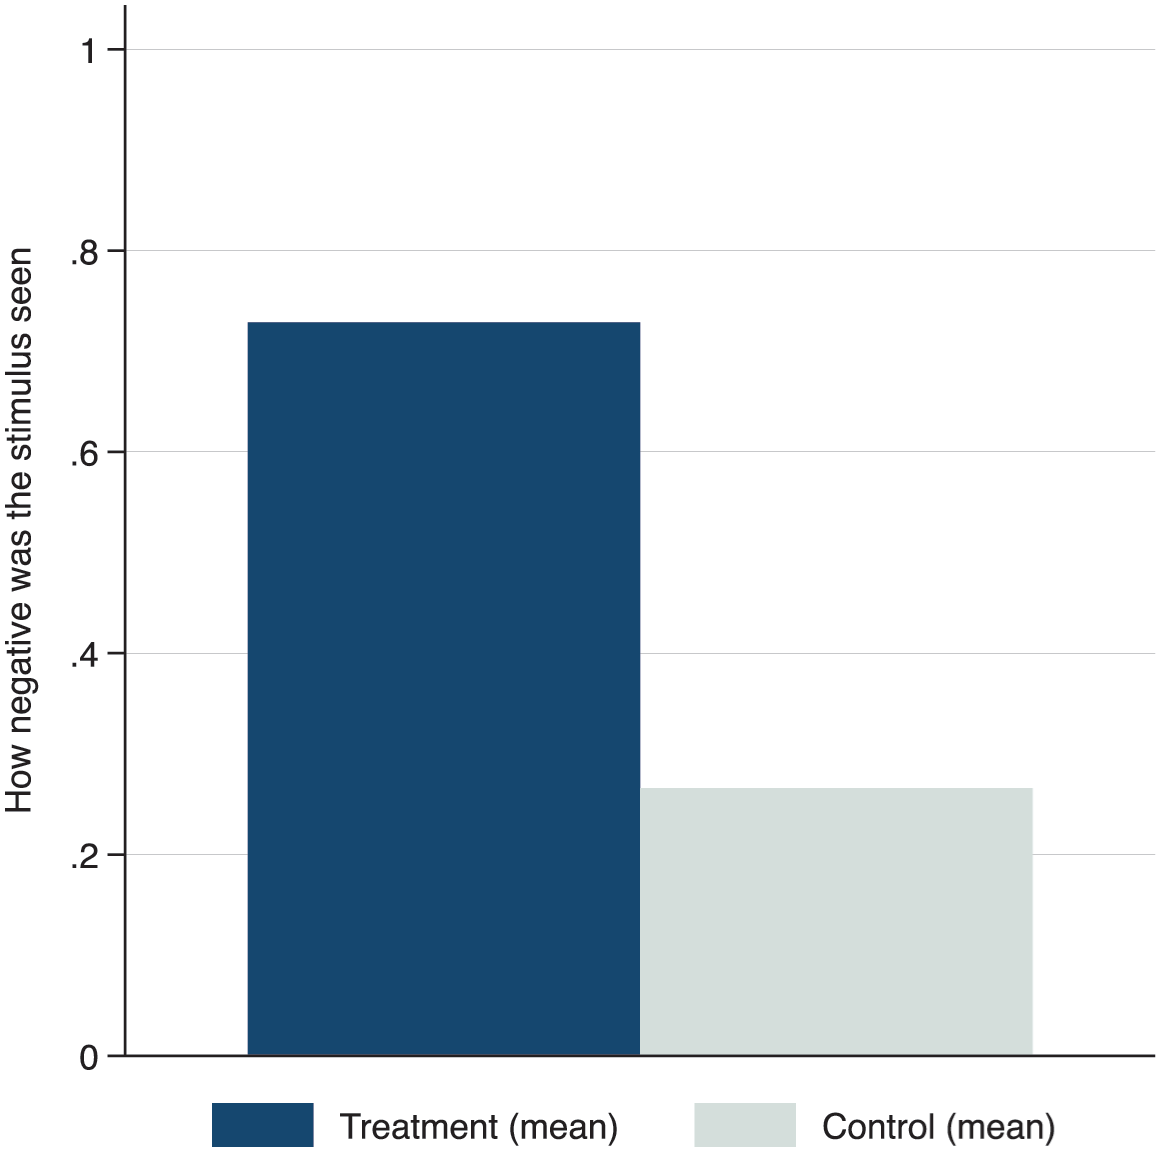
S2. Comparison of Average Perception of Negativity in Experimental Treatments and Controls, Meta-Analysis.
Study 3. Negativity in Televised Debates
Study 1 showed consistent ratings across observers for fictive vignettes, whereas Study 2 suggests that experimental manipulations of negativity are perceived as such by those exposed to it. But what about ‘real-world’ negativity, that is, happening organically during political events (vs simulated by researchers in experiments or vignette studies)?
Study 3 presents an example of observer congruence when it comes to such ‘real-world’ negativity. The study leverages (and extends) data from Maier and Jansen (2016) for TV debates between leading candidates vying for the national top executive position in Germany (Chancellor) and looks specifically at debates that have preceded the 2002, 2009, 2013, and 2017 elections (data from the 2017 election was added when extending the evidence discussed in Maier and Jansen, 2016). Specifically, we compare here two data sources: (1) the manual content analysis of these debates, used to identify how much each candidate went negative on their rival during the debate (Maier and Jansen, 2016, for methodological details) and (2) data from a sample of voters who watched the debates live. 3 As discussed in Maier and Jansen (2016), participants were asked to rate how negatively each candidate went after their opponent on a 1–5 scale ranging from 1 = ‘doesn’t apply at all’ to 5 = ‘fully applies’ (recoded into a −2 to +2 scale).
Figure 5 shows the association between the proportion of attacks in candidate statements and the viewers’ perceived level of attacks by candidates in the 2002, 2009, 2013, and 2017 German televised debates. The two measures correlate strongly with each other, r(9) = 0.91, p < 0.001. Such a high degree of similarity suggests, like in Study 1 with mock vignettes and in Study 2 with average responses to experimental stimuli, that different observers converge in their judgment of negativity – in this case, scholarly coding of debates converges strongly with the lay public’s perceptions of the presence of attacks.
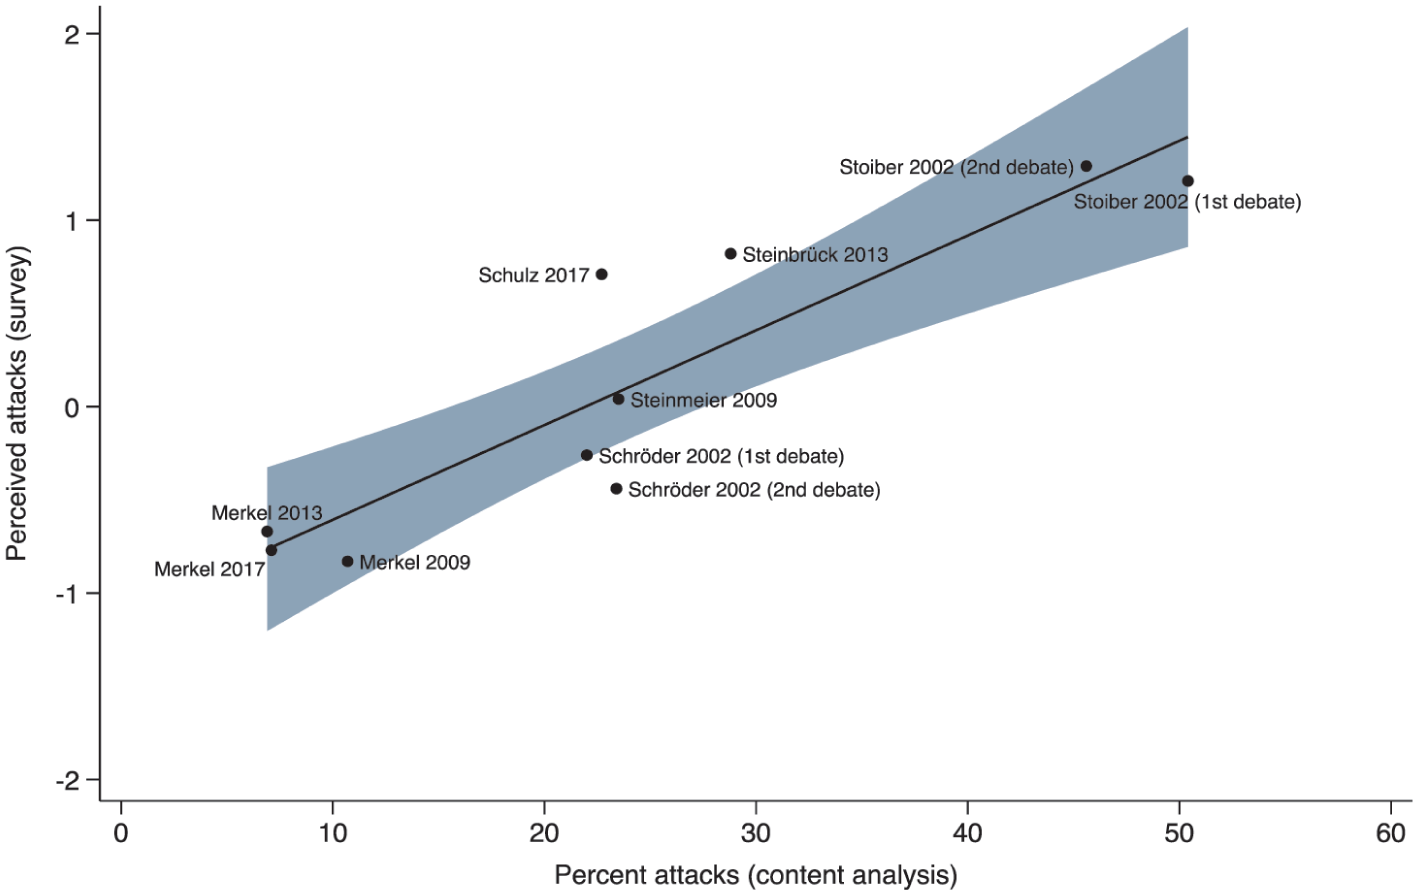
S3. Correlation Between the Proportion of Attacks in Candidate Statements and the Perceived Extent of Attacks by Candidates in German Televised Debates.
Self- and Observer Agreement
Evidence in Studies 1 to 3 seems to suggest that different observers align in their ratings of negativity, both ‘in the lab’ and in the real world. An even more stringent test of interobserver agreement would consist of comparing external observers with self-ratings from the actors that are observed, for instance, as is often done in the literature on personality traits (e.g. Lee and Ashton, 2017). Study 4 below presents evidence in this sense.
Study 4. Candidate Self-Assessments and Expert Ratings
We leverage data from candidate surveys having competed in German state elections (Maier et al., 2025) between 2021 and 2023, which includes self-ratings of how much they attacked their opponents during the election campaign (‘How often did you attack the political opponent, that is, criticize other parties or candidates?’ five-point scale from 1 = ‘never’ to 5 = ‘very often’; M = 2.69, SD = 1.01). We compare these self-ratings, aggregated at the party-state level (that is, the average for all candidates of a given party Ci having competed in state Si), with independent expert ratings of the use of negative campaigning by those same parties in each state election. Averaging candidate self-ratings is necessary, as expert ratings are only at the party level; this certainly reduces nuances but likely yields a more conservative estimate.
Figure 6 compares these two independent measures of negative campaigning at the party-state level; the x-axis is the average self-reported use of attacks, and the y-axis measures how experts rated the campaign negativity. Each observation on the graph reflects a specific party in a given state election (e.g. ‘AfD_ST’ reflects the campaign of the Alternative for Germany during the Saxony-Anhalt state election).
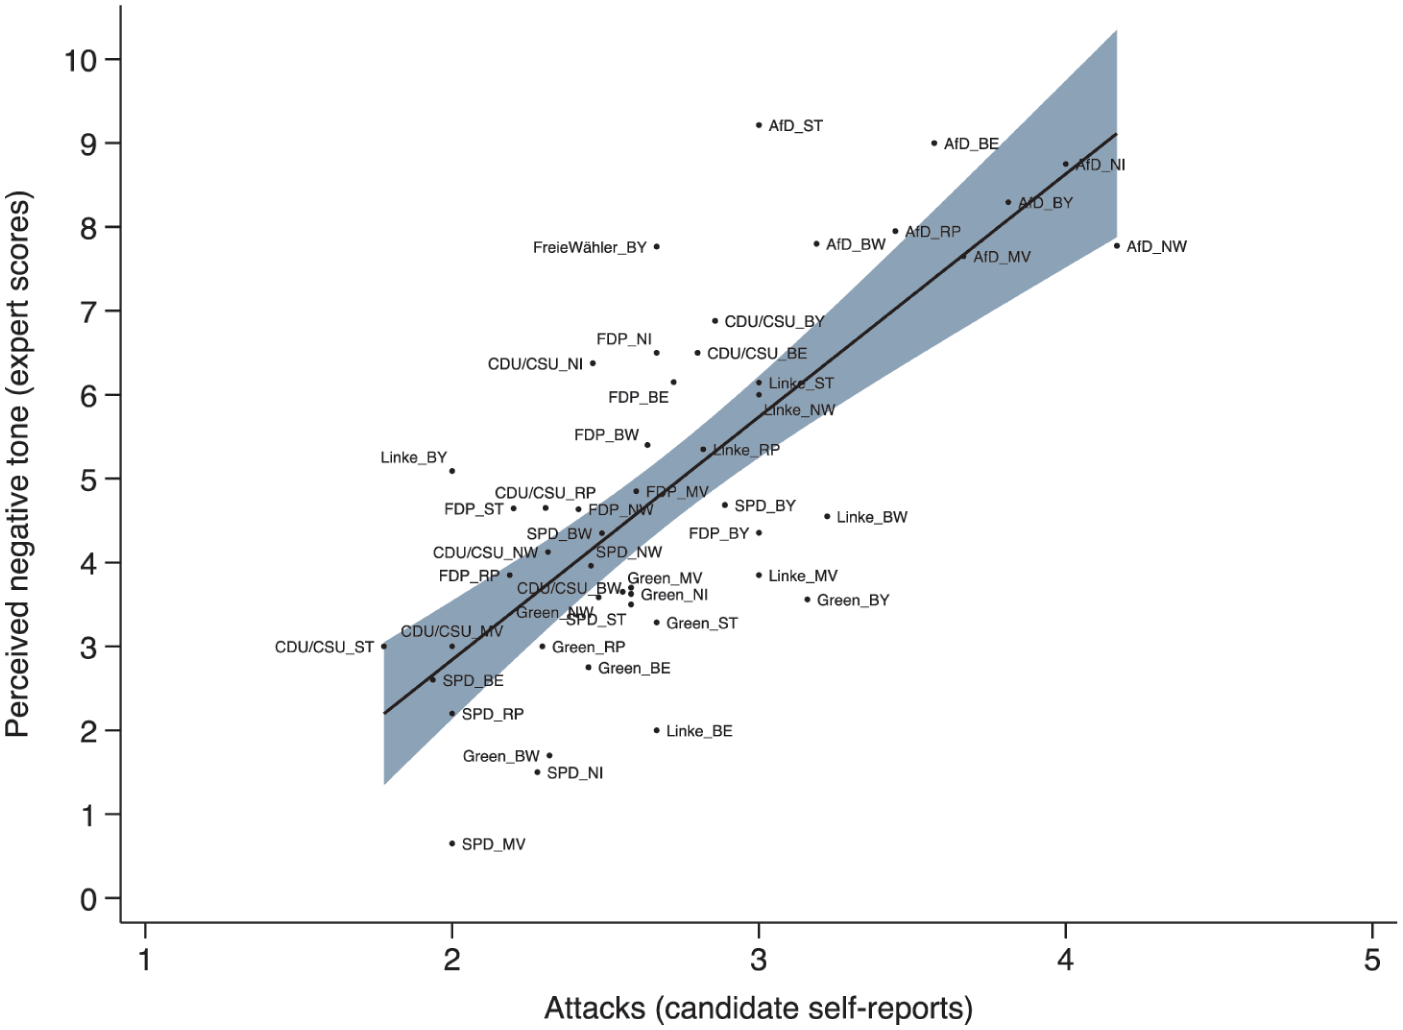
S4. Candidate Self-Rating and Expert Ratings of Negativity in German Local Elections.
As Figure 6 shows, there is an extremely strong positive association between the average candidate’s self-rated use of political attacks and the general assessment of campaign negativity by experts, suggestive of a high degree of self-observer agreement. Importantly, the association remains strong and significantly positive even in multivariate models controlling for the left-right ideology of the party (R2 = 0.70, F(2, 45) = 52.14, p < 0.001, β = 0.51), suggesting that it is not simply picking up ideological differences in the use of negativity. This strong correlation between candidates’ self-reports and expert assessments also holds for the national level and for countries other than Germany (Maier and Nai, 2023; Nai et al., 2022b).
Consistency Across Situations
Study 1 has shown that, while the profile of observers (the lay public, in particular) comes into play to partially drive their ratings, experts and the public alike seem to converge quite substantially when it comes to identifying (fictive) positive and negative messages based on a directional definition of campaign tone. Reliability requires, however, that such converging observations are stable (consistent) across different situations, which is what Study 5 tests.
Study 5. Rating Vignettes Over Time and Space
To test for such consistency across different situations, we again leverage the expert and voter ratings of vignettes discussed in Study 1. Starting from experts, Supplemental Figure A1 (Appendix) shows that their ratings are rather consistent over time; the figure does not seem to show any major upward or downward trends. The existence of such trends would indicate the presence of shifts in the general perceptions and perhaps even understanding of negativity, perhaps due to significant exogenous events. While the timeframe of the comparison is not particularly big (2016–2022), it nonetheless encompasses a certain radicalization of political rhetoric worldwide, exemplified by the consolidation on the public stage of politicians with more cantankerous and bellicose traits (e.g. Nai and Maier, 2024), likely to alter the general perceptions of what ought to be considered ‘normal’ political rhetoric (e.g. Vargiu et al., 2026). In our data, we do not see any such major trends: the correlations between vignette ratings and year of the rating are never significant, except for a negligible negative effect for Vignette 1, r(2544) = −0.04, p = 0.024, which contains a clear positive message.
Supplemental Figure A2 (Appendix) shows, however, the presence of some differences in ratings for experts across different regions in the world. For instance, experts in the ‘West’ (which includes Western and Northern Europe, the United States, Australia, and New Zealand) are significantly less likely to rate the first vignette (a positive vignette) as negative than experts in Southern Europe, t(1295) = −5.53, p < 0.001, d = 0.33. Experts in the ‘West’ are furthermore significantly more likely to rate the sixth vignette (a particularly negative one) as negative than experts in Asia, t(1202) = 8.42, p < 0.001, d = 0.30. While statistically significant, the extent of such differences should, however, not be overestimated, as seen also in the trends in Supplemental Figure A1 (Appendix) that are, all in all, relatively comparable across regions.
Figure 7 replicates the geographical comparison of ratings, but this time for respondents in the multicountry survey introduced above. In this case as well, some differences across countries appear – for instance, respondents in Australia appear more lenient towards negativity, as they are significantly less likely to rate the sixth vignette as negative than respondents in other countries, for instance, Italy, t(4399) = −21.57, p < 0.000, d = 0.66.
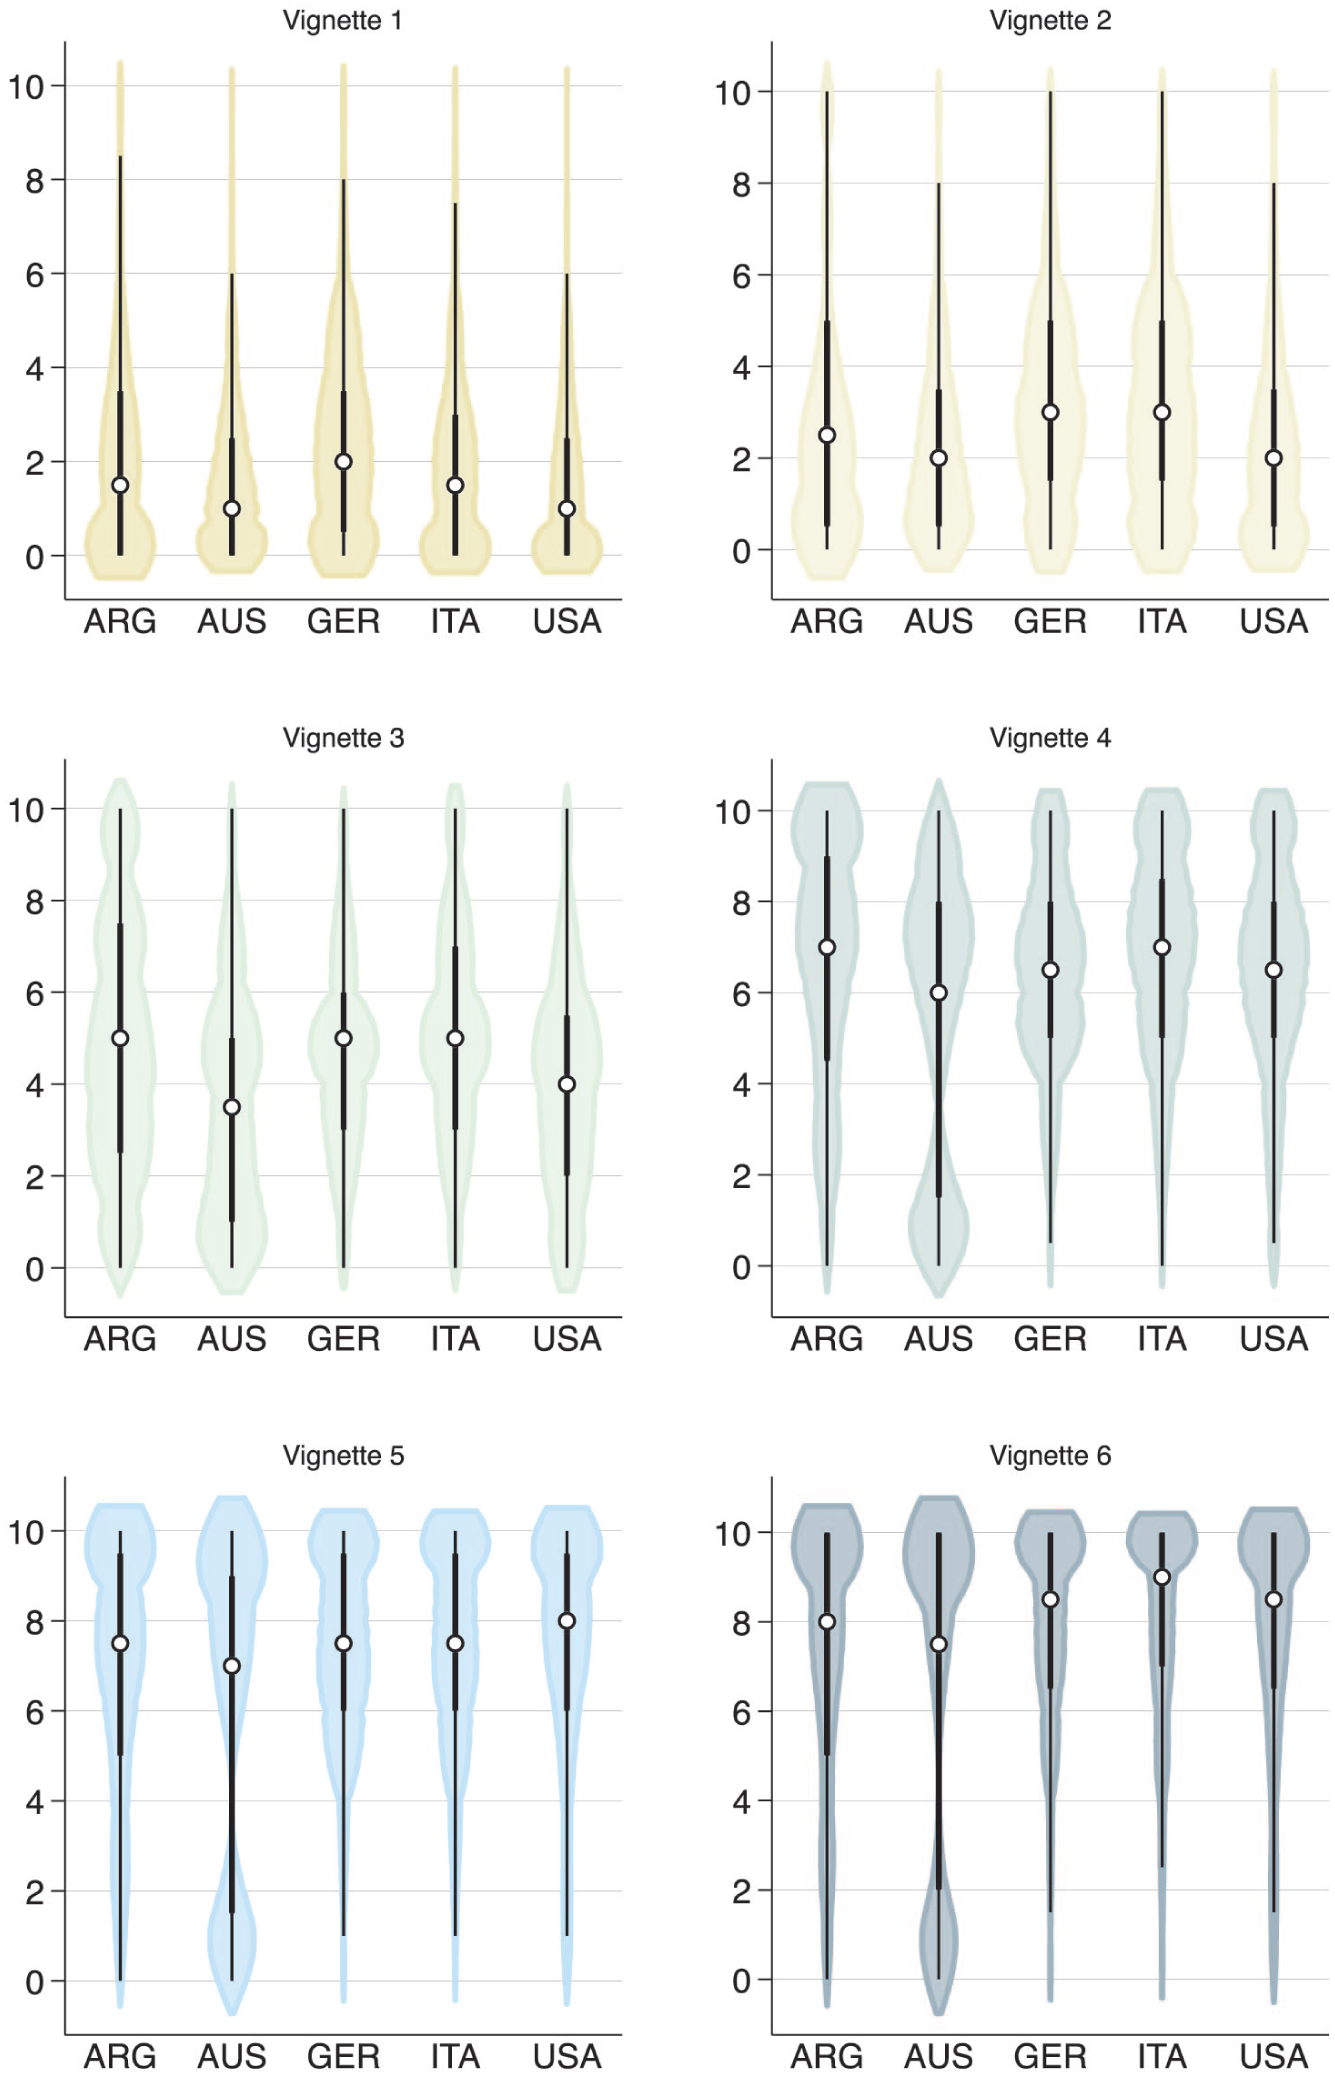
S5. Voter Ratings of Campaign Vignettes Over Country.
Reliable, After All?
The main criticism of the two ‘classic’ studies criticizing the directional approach is that there is a mismatch between the scientific concept of negative campaigning and what political elites, but also citizens, think negativity is. Based on a comparison of expert ratings and laypeople’s assessments of the tone of media coverage and selected televised ads of US gubernatorial campaigns, Sigelman and Kugler (2003: 152) concluded that ‘no matter how social scientists would classify the tone of a campaign, many – even most – citizens [. . .] would see it differently’. In a similar vein, Lipsitz and Geer (2017) compared the tone of four televised ads from the 2012 US presidential election campaign, coded by a sample of American citizens and a sample of several dozen experts. They found ‘a fair amount of slippage between scholar and citizen perception of negativity’ (Lipsitz and Geer, 2017: 583).
Evidence presented in Studies 1 to 5 paints a less critical picture. Looking at ideal types of positive and negative messages (vignettes) and how they are rated by observers as different as academic scholars and the lay public, the outlook seems to be relatively optimistic. Experts and the lay public easily pick up the most negative vignettes and tend to give relatively consensual ratings – in particular, experts (Study 1). With the exception of their ideological self-positioning, the profile of experts is only marginally related to their ratings – the profile of the lay public more so. Importantly, the ratings of experts and the lay public seem relatively consistent across different situations, for example, over time and across different geographical regions; while differences do exist, the ratings remain relatively consistent across space and time (Study 5). Furthermore, meta-analytical evidence suggests that participants in experiments pick up easily negative treatment from their non-negative controls (Study 2), the lay public rates the negativity of candidates during TV debates in a highly consistent way when compared to content analyses of those debates (Study 3), and expert observers rate the campaign of candidates very similarly to the (average) self-rating of their own campaign provided by those same candidates (Study 4). All in all, when asked to judge how negative campaign messages are, different observers tend to reliably converge in their scores.
Validity
Evidence presented in Studies 1 to 5 seems to suggest that the directional approach to measuring negative campaigning can yield reliable results. But is such an approach also yielding valid results? Validity, of course, is first and foremost a matter of the alignment between a concept and its measure. The simplest definition of validity assesses instruments according to whether they measure what they claim to measure (Garrett, 1937). In this sense, as long as a measure correctly picks up the tone of a given message in terms of its direction, such a measure is conceptually valid. But stopping here in the assessment of validity would be excessively simplistic. In this section, we discuss two series of empirical tests related to two central aspects of validity. First, we test for convergent validity – that is, whether different independent measures of the same concept converge statistically – for two radically different case studies: the use of negative campaigning during the 2018 Senate midterms in the United States (Study 6) and during the 2019 elections of the European Parliament (EP; Study 7), in both cases triangulating several independent data sources. Second, we test for construct validity – that is, ‘the extent of which scores on a particular instrument relate to other measures in a manner that is consistent with theoretically derived hypotheses concerning the concepts that are being measured’ (Barten et al., 2012: 592) – by testing hypotheses about the role of candidate profile for the use of negativity and subsequent media coverage on a large scale (Study 8). Finally, we test for discriminant validity, that is, whether voters are able to distinguish between attacks and other forms of aggressive rhetoric, such as populist messages (Study 9).
Convergent Validity
To what extent do different independent measures of a given phenomenon converge statistically? Studies 6 and 7 provide evidence in this sense when it comes to the use of negative campaigning in two very different real-world events.
Study 6. Comparing Ratings of Negativity for the 2018 US Midterms
The first investigation into convergent validity concerns the 2018 Senate Midterms in the United States and compares three independent measures of campaign negativity: (1) the percentage of negative ads that were aired on TV to support each candidate, coming from the Wesleyan Media Project (Fowler et al., 2020); (2) independent expert ratings of the general tone of the campaign of each candidate, similar to the expert ratings discussed for the previous studies (Nai and Maier, 2020); and (3) the automated coding by machine learning of the presence of policy and character attacks in the tweets posted by the candidates in the weeks leading to the election (Petkevic and Nai, 2022). We do not have the possibility to dive into the specifics of all these measures, and we encourage readers to consult the original publications for details about measurement and validation. To what extent do these three radically different sources – TV ads, social media posts, and holistic assessment of the campaign by experts – converge in picking up whether the competing candidates went negative against each other during the election? It turns out quite a bit.
Figure 8 summarizes via marginal effects, the association between the percentage of negative TV ads (y-axis, in all panels) and the tone of the campaign as assessed by experts (left-hand panel), the relative presence of policy attacks in candidates’ posts on Twitter (middle panel) and the relative presence of character attacks in candidates’ posts on Twitter (right-hand panel). To avoid as much as possible the presence of spurious effects, all models are controlled by candidate incumbency, party, and gender and for the general competitiveness of each seat’s election. Full results are in Supplemental Table A3 (Appendix).
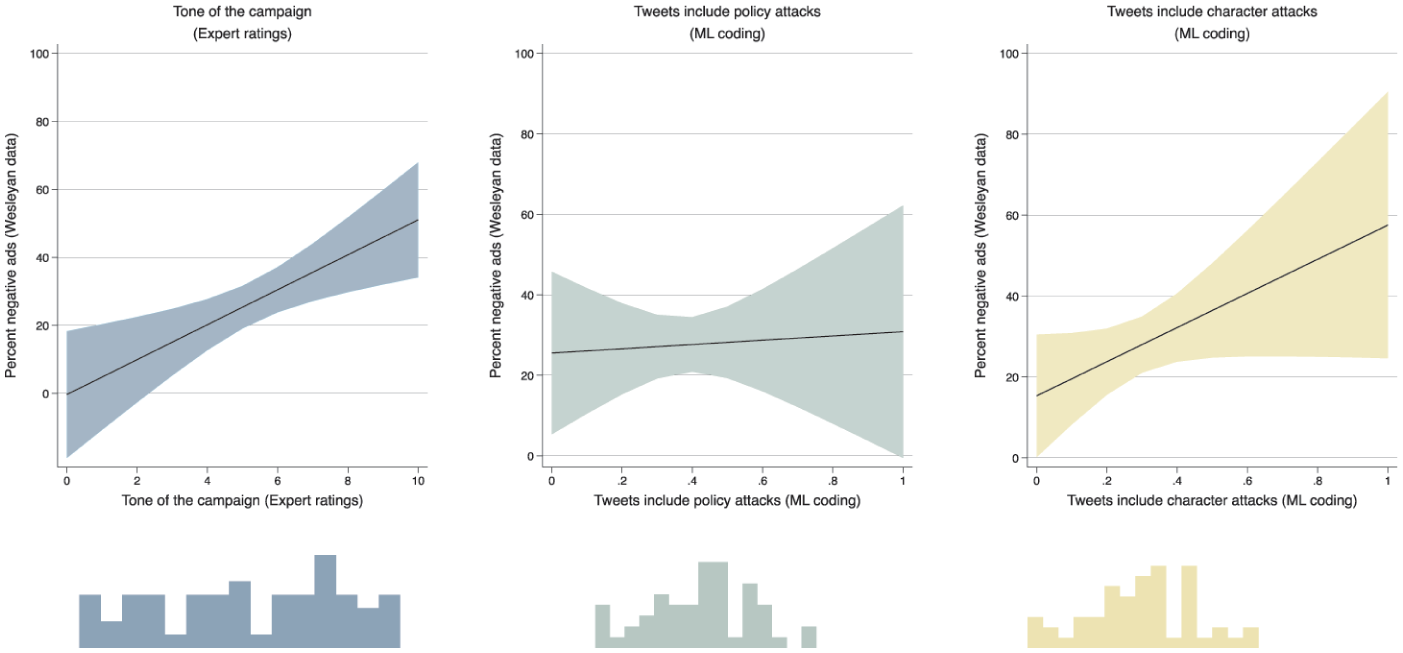
S6. Percentage of Negative TV Ads by Expert Ratings of Tone and Attacks Found in Candidates’ Tweets (2018 US Senate Midterms).
As Figure 8 shows, a strong positive association exists between the percentage of negative TV ads and the negative tone of the whole campaign as perceived by experts. The middle panel shows no relationship when it comes to negative TV ads and the presence of policy attacks on Twitter, but this relationship is again strong and positive when character attacks on Twitter are considered.
Study 7. Comparing Ratings of Negativity for the 2019 European Elections
All in all, evidence in Study 6 seems to suggest that different sources converge convincingly to pick up the use of attacks during the 2018 US Senate elections by the competing candidates. In terms of external validity, of course, this triangulation remains limited; it is only done on one country – and a rather peculiar one, to boot, when it comes to the use of negativity (which is ‘as American as apple pie’; Scher, 1997: 27) – and focuses on the use of negativity by competing candidates in a first-past-the-post election and looks at Twitter posts.
With this in mind, Study 7 presents a triangulation that is similar in spirit – comparing independent measures of negativity – but focuses on a setting that is diametrically opposite to the one in Study 6: we look here at the use of negative campaigning by parties having competed during the 2019 elections for the EP. In an EP election, parties compete in national contests to secure, via proportional representation, a share of the seats in the EP that is available for their country. Specifically, we triangulate three independent measures 4 of negativity during the 2019 EP campaign: (1) the tone of the whole campaign as rated by experts in the EPEES_19 data (Nai et al., 2022a), (2) the presence of attacks in parties’ Facebook posts measured via manual quantitative content analysis for 12 countries 5 (Baranowski et al., 2023), and (3) the presence of attacks in parties’ Facebook posts measured via a separately conducted manual quantitative content analysis for a slightly different selection of 12 countries 6 (Klinger et al., 2023). Note that these two latter independent Facebook measures are strongly correlated, r(48) = 0.47, p < 0.001, which already provides a strong indication in terms of convergent validity. As for Study 6, we cannot dive here into the specificities of how these measures were obtained and validated; we encourage readers to consult the detailed discussions provided by the authors of each data source.
Do we find a similar convergent validity for the 2019 European elections as we found earlier for the 2018 Senate Midterms in the United States in Study 6? Very much so. Figure 9 summarizes via marginal effects the association between the negativity of parties’ campaigns as rated by experts (y-axis, in both panels) and the percentage of Facebook posts that include attacks towards their opponents, as measured by the two independent teams of scholars, Baranowski et al. (left-hand panel) and Klinger et al. (right-hand panel), respectively. To avoid as much as possible the presence of spurious effects, all models are controlled by whether the party was part of the national government at the time of the election (incumbency proxy), left-right position of the party, percentage of votes the party obtained in the last national elections, year the party was founded, turnout in the 2019 EP election at the country level, effective number of competing parties in the election at the country level (adapting the well-known formula by Laakso and Taagepera, 1979), unemployment in the country, gross domestic product (GDP) per capita in the country, and percentage of immigration into the country (see Nai et al., 2022a for details about these controls). Full results are in Supplemental Table A4 (Appendix). As shown in Figure 9, a strong positive association exists, ceteris paribus, between the tone of the campaign as a whole as estimated by experts and the presence of attacks in the parties’ Facebook posts as assessed by the two independent research teams – suggesting strong convergent validity of the two sets of measures (expert-based vs manual content analysis of social media posts).
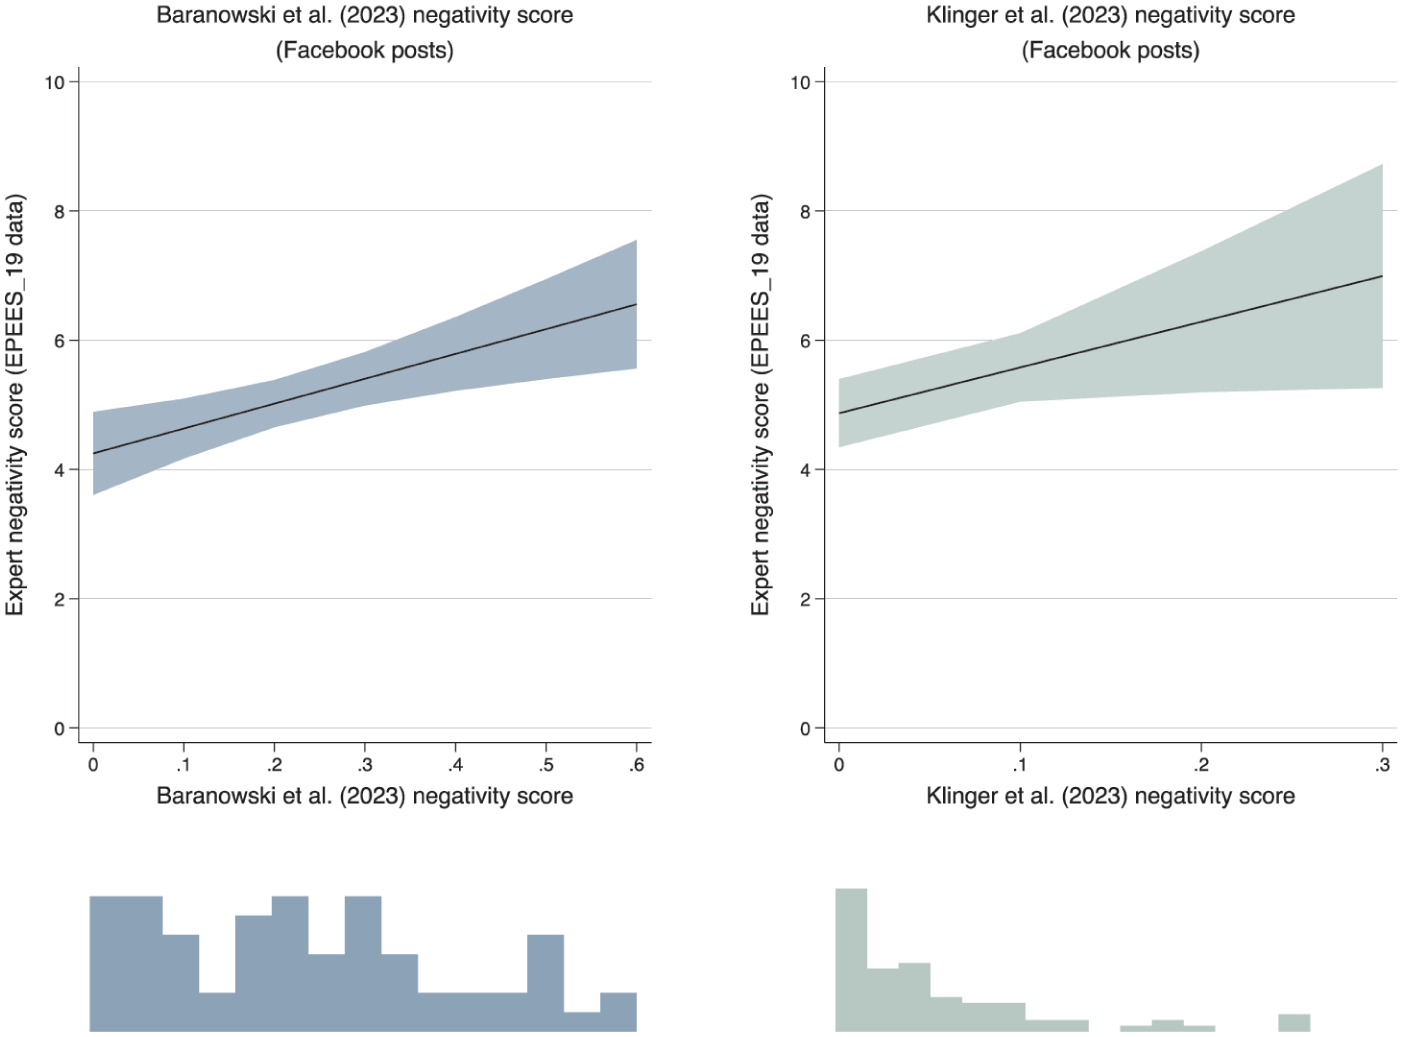
S7. Expert Rating of Parties’ Campaign Tone by Negativity Found in Facebook Posts (2019 European Parliament Elections).
Construct Validity
A further piece of evidence in the defence case for the directional approach of negativity is construct validity, that is, showing that measures following such an approach yield results that are consistent with theoretical expectations. Here, the world is an oyster – and any research design leveraging such a measure that yields results confirming a priori hypotheses would do. To ensure consistency of the evidence presented in this article, we leverage again evidence from the large-scale expert survey that we have discussed in previous studies (e.g. Studies 1 and 5).
Study 8. Negativity, Candidate Profile, and Media Attention
To what extent can the profiles of candidates drive their use of negative campaigning? And to what extent is the latter a predictor of increased media coverage? To showcase the construct validity of a directional measure of negativity, we test here some well-known hypotheses. First, as discussed earlier, right-wing candidates should be more likely to go negative (H1), likely reflecting a more confrontational psychological disposition in strong conservatives (e.g. Jasko et al., 2022), and as shown in the literature (e.g. Lau and Pomper, 2001). Second, more extreme candidates should go more negative (H2), following the idea that ideological extremism is associated with a desire to break the usual conventions about politics, which creates a situation where negativity and aggressiveness are endemic (Nai et al., 2022b). Third, incumbents should be less likely to go negative (H3), a finding often reported in the literature (e.g. Benoit, 2022); they need negativity much less than challengers and runner-ups (these latter having also nothing else to lose anymore; Harrington and Hess, 1996; Elmelund-Praestekaer, 2010), and holding an office should make them particularly risk-averse and wary of any possible backlash (Lau and Pomper, 2004; Nai, 2020). Finally, all things considered, candidates who make more use of negative campaigning should receive preferential media coverage (H4). This last hypothesis is rooted in theories of mediatization of politics and assumes that increased competitiveness in media markets forces outlets to shift the focus towards the ugly and sensational side of politics to keep their audience engaged – if it bleeds, it leads – of which attacks between candidates are a central part (Maier and Nai, 2020). Negative campaigning, in other terms, has a powerful ‘newsworthiness’ (Boukes et al., 2022). We test these hypotheses via data from a large-scale expert survey (NEGex, version 3.0), which includes information for the campaign of more than 800 ‘top’ candidates – from Trump to Merkel, Macron, Abe, Modi, Clinton, Bolsonaro, Le Pen, May, Ardern, and many more – having competed in elections worldwide between 2016 and 2022. In the data, experts were asked to rate how negative the campaign of the main candidates in the election was, which we first regressed on the candidates’ profiles, and then we used to predict how much media coverage they received.
Figure 10 presents the results of two models that test the hypotheses listed above. Coefficients are presented with 95% and 90% confidence intervals; all covariates are standardized (M = 0, SD = 1) to ensure the comparability across all effects. The left-hand panel regresses the candidates’ use of negative campaigning on their profiles. As the panel shows, negative campaigning is significantly higher for candidates on the right and more extreme candidates and less likely among incumbents – confirming H1, H2, and H3. The right-hand panel regresses candidates’ media coverage – that is, how much the media paid attention to them, also estimated by experts (see Maier and Nai, 2020, for a methodological discussion and validation of the measure) – on candidates’ profiles and use of negativity. The panel shows the overwhelming positive effect of incumbency on media attention (the well-known phenomenon of ‘incumbency bonus’; Hopmann et al., 2011), whose magnitude overwhelms all other effects. Yet, even controlling for such an extremely powerful covariate, candidates who use more negativity are significantly more likely to receive media attention, confirming H4.
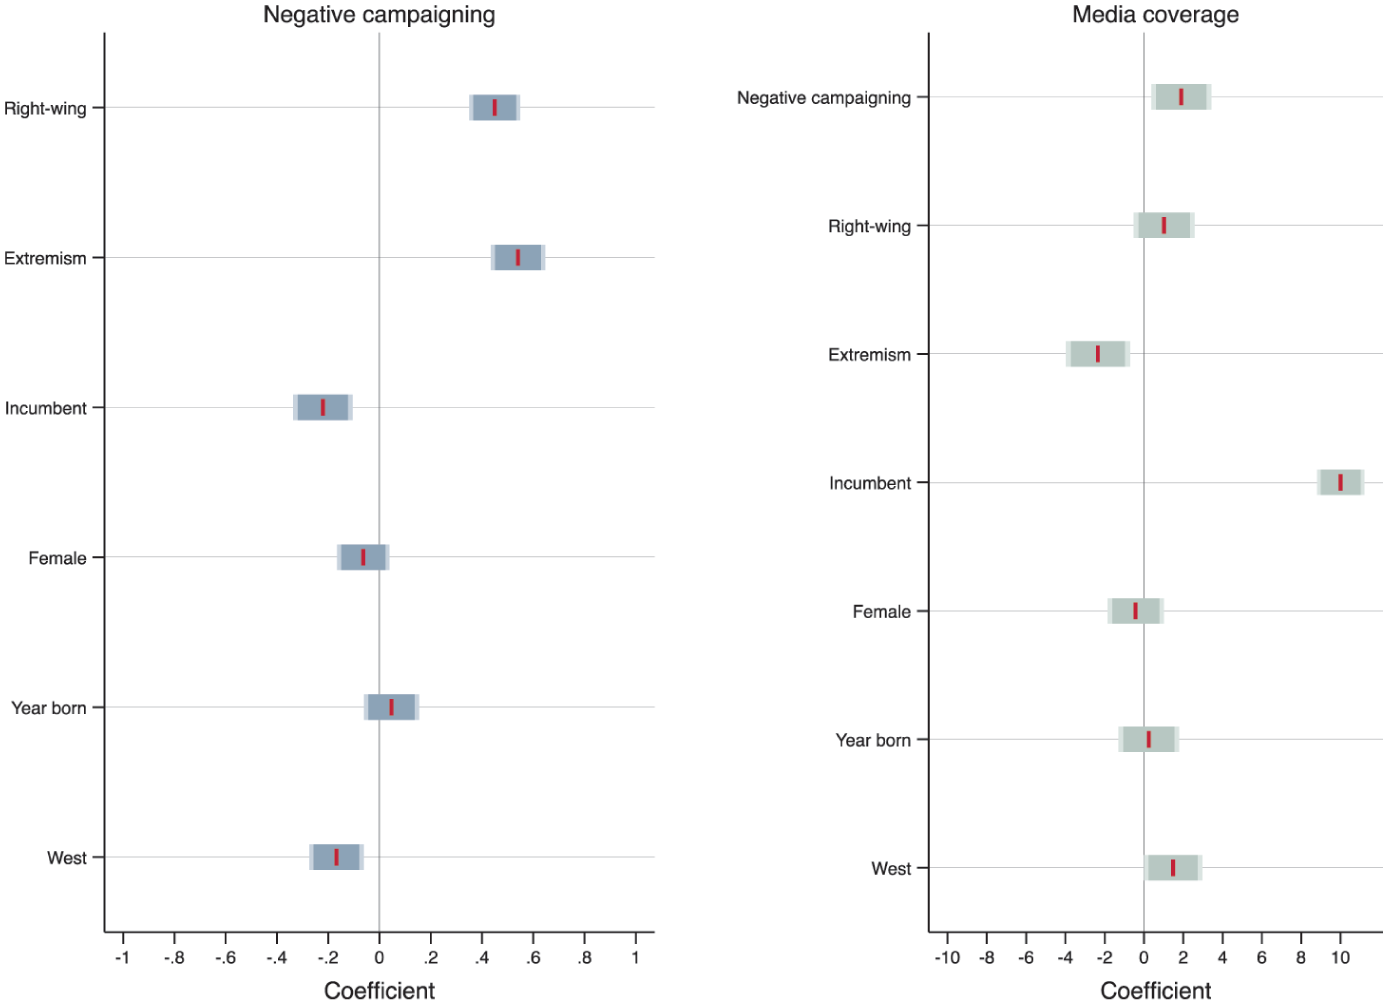
S8. Negative Campaigning and Media Coverage by Candidate Profile, Elections Worldwide.
Discriminant Validity
The last piece of the puzzle is the most challenging one. To what extent, when dealing with negativity, are we measuring negativity instead of measuring something different? And to what extent are close – but conceptually different – phenomena perceived as being different from negativity? Political attacks remain, conceptually, very close to other expressions of aggressive and confrontational rhetoric, such as populist appeals (e.g. the use of attacks against the system and corrupt politicians; Bos and Brants, 2014), uncivil and disrespectful forms of communication (such as ad hominem attacks, aggressive sarcasm, or any other form of communication that pushes the boundaries of what is socially acceptable; Rossini, 2022; Vargiu et al., 2026), and intolerant and dehumanizing language, including appeals for prejudice and violence towards political, social, and cultural out-groups (e.g. Cassese, 2021), and the use of negative emotional appeals (such as anger; Stapleton and Dawkins, 2022). It is undeniable today that these forms of aggressive rhetoric are closely associated and likely reinforce each other – for instance, attacks that include sarcastic remarks can have an enhanced effectiveness to depress support for the target (Verhulsdonk et al., 2022). The final piece of the puzzle is thus to check for evidence suggesting discriminant validity, that is, whether we can discriminate proximate constructs that ought not to overlap excessively – or, otherwise said, whether the measure is strongly marred by false positives.
Study 9. Perceptions of Negativity, Incivility, Populism, and Fearmongering
For this last study, we leverage data from a survey experiment run on a sample of American respondents in late 2019 (Nai and Maier, 2025). In the experiment, respondents were shown a mock interview with a fictitious candidate, Paul A. Bauer, presented as a newspaper clipping. The interview was randomly framed as being either positive (promoting his position) or negative (attacking his opponent, the equally fictive Carl B. Meyer). Furthermore, and this is key for this final test, different versions of the negative treatment existed, some being simply negative (e.g. ‘Mayer’s inexperience is bad news [. . .,] he is wrong’), others, including uncivil elements (e.g. ‘Mayer is an imbecile [. . . and] his policies are bullshit’), populist appeals (‘Mayer is just another example of Washington elite, a politician detached from reality’), and/or fear appeals (e.g. ‘His ideas will have dramatic consequences’). After seeing the message, respondents were asked a series of evaluative questions, including whether the message was negative, harsh, informative, and funny (1–7 ‘agree–disagree’ scale).
Figure 11 shows how the different forms of aggressive and confrontational rhetoric were perceived by the respondents. Note that, because the fictive candidate was presented in all treatments as being a Republican, analyses are only run on respondents self-describing as Independents to avoid well-known effects on motivated reasoning due to in-/out-party cueing (Slothuus and De Vreese, 2010). The top-left panel of Figure 11 shows that negative treatments (vs positive) were clearly perceived as more ‘negative’; this is, however, also the case for uncivil treatment (vs negative but civil), if to a lesser extent. The same can be seen for perceiving negative and uncivil treatments as ‘harsh’ (top-right panel). While the effects of incivility are weaker, which is reassuring, these trends nonetheless show the presence of possible conceptual overlapping in the eyes of voters in terms of what negativity and incivility entail. Populism and fearmongering are more clearly different from negativity when it comes to being perceived as negative or harsh. Negativity is also the only message type being perceived as significantly less informative (bottom-left panel). Finally, none of the message types is particularly funny (bottom-right panel), which is also reassuring, per se. All in all, what this evidence suggests is that negative campaigning, per se, tends globally to be seen differently than other similar forms of aggressive and confrontational rhetoric, while also suggesting a possible overlap with some forms of uncivil attacks.
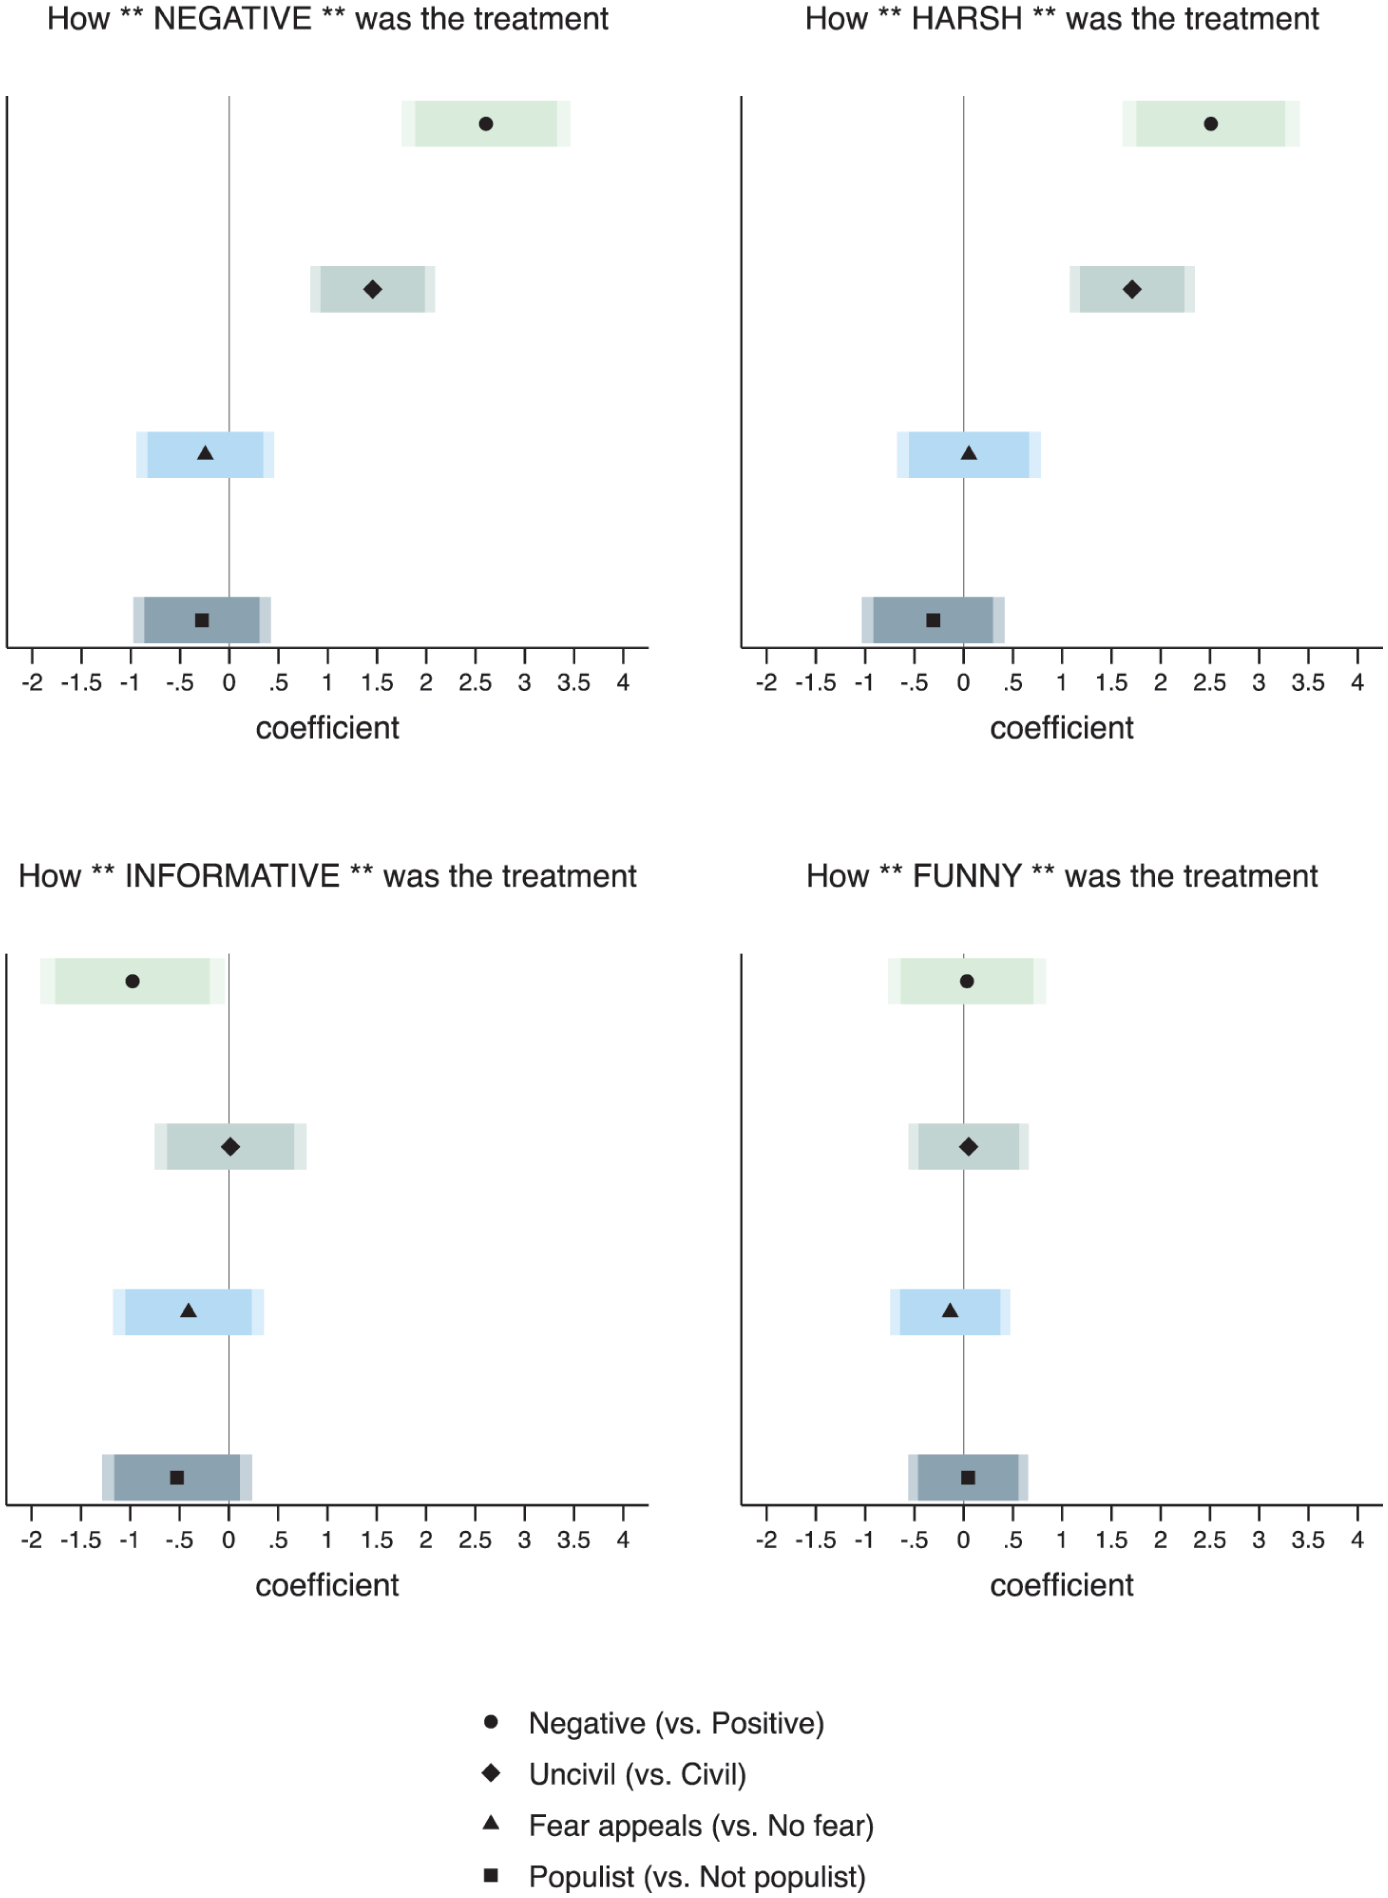
S9. Perceptions of Aggressive Forms of Communication.
Valid, After All?
Results in Studies 6 to 9 paint, in our opinion, a rather clear picture: the directional measure of negative campaigning benefits from high convergent validity (as shown for cases as different as the 2018 US Midterms and the 2019 European elections), with different independent measures converging quite convincingly. In addition, the measure can be used to convincingly test theoretically sound hypotheses that have received considerable support in the literature – in the example discussed above, about profile effects driving negativity and about the latter driving higher media attention (Study 8). And respondents differentiate negativity from other forms of aggressive rhetoric, if less so for incivility (Study 9). To be sure, as for the previous set of studies tackling reliability (Study 1 to Study 5), the evidence presented here is by necessity partial. The sheer diversity of independent data sources leveraged, however, should assuage any preliminary critique about the lack of external validity of the evidence presented, which often goes beyond the simple country-case study.
Concluding Remarks
In scientific fields – such as political communication and electoral behaviour – that are becoming increasingly more specialized and nuanced, the survival of ‘legacy’ concepts that build on simple and straightforward definitions and operationalizations is often looked at with suspicion. And, often, rightfully so. Also, due to the inconsistency of empirical results when it comes to its electoral effects 7 (e.g. Lau et al., 1999, 2007; Krupnikov, 2011), the traditional ‘directional’ conceptualization of negative campaigning (e.g. Geer, 2006) has received over the years a fair share of pushbacks and challenges (e.g. Lipsitz and Geer, 2017; Sigelman and Kugler, 2003). Notably, over the years, the directional measurement of negative campaigning has acquired a reputation for being somewhat questionable in terms of reliability and validity. Those critiques were, and remain, very welcome. No concept or measurement should remain unchallenged just for the sake of it. Yet, as we argue in this article, these critiques ought not to be overestimated.
In this article, we have presented a rather heterogeneous collection of studies – very diverse in terms of their scope, coverage, designs, and data – which, we believe, suggest that the directional measurement of negative campaigning remains alive and kicking.
In a nutshell, our results show, first, that the directional measure of negativity benefits from a high degree of observer agreement; different observers provide quite consistent ratings of how ‘negative’ different campaign examples are (Study 1), and these ratings are relatively consistent across different situations, for example, over time and across different geographical regions (Study 5). A meta-analysis of experimental work shows that participants are quite strongly in agreement that the treatment they saw was negative (Study 2). Experts and voters assess the level of negativity in political debates very similarly (Study 3).
Second, the direction measure benefits from a high self-observer agreement; that is, external observers (experts) converge in their ratings with self-assessments provided by those who engage in negativity (candidates; Study 4). All in all, when asked to judge how negative campaign messages are, different observers tend to reliably converge in their scores.
Third, the directional measure of negative campaigning benefits from convergent validity; different independent measures of the same phenomenon converge strongly, as shown, for instance, for the 2018 midterms elections in the United States (Study 6) or the 2019 elections of the EP (Study 7).
Fourth, suggestive evidence exists of construct validity; the measure can be used to convincingly test theoretically sound hypotheses that have received considerable support in the literature – for example, how the candidate profile drives the use of negativity and how negativity drives higher media attention (Study 8).
Finally, we have shown evidence suggestive of discriminant validity; in experimental settings, respondents differentiate negativity from most other forms of aggressive rhetoric (Study 9).
Taking a step back, the multitude of results discussed in this article can also be leveraged to make two important substantive points when it comes to research on negative campaigning and its effects.
On the one hand, at the macro level, our results hint at the fact that opening up the scope of the investigation to a larger scale, beyond country-level investigations, matters. While comparative research on campaign negativity is increasing (e.g. Klinger et al., 2023; Nai et al., 2025b; Valli and Nai, 2022), much remains to be done to develop a more ‘universal’ understanding of the dynamics of attack politics (e.g. Nai, 2020). In particular, further research should take into account that context matters – and can alter the effects of negativity itself; looking at the usage of negative campaigning by more than 700 ‘top’ candidates across the world, Nai et al. (2025a) show, for instance, that female candidates are more penalized when they go negative – a clear hypothesis in the literature that had, up to that point, mostly failed to be matched with consistent evidence – but only in countries that suffer from low gender equality. Only research that moves beyond single-country data and takes into account the role of the context in a robust way – while still using simple definitions and measures, if needed – would be able to pick up such nuances.
On the other hand, at the micro level, our research suggests that people, including the public at large, possess a high capacity for detecting negative campaigning when they are exposed to it, which is a very reassuring assessment, especially for researchers considering experimental research. To be sure, the fact that negative campaigning tends to be consistently seen as such does not imply that there aren’t differences in perceptions in the public and even less that there aren’t differences in evaluations – that is, whether people differ in how much they like or find acceptable (or even entertaining) the presence of attacks in elite communication. Recent research shows, indeed, the presence of great diversity in perceptions and evaluations of attack politics (e.g. Muddiman et al., 2021; Nai et al., 2025a; Vargiu et al., 2026), suggesting that the simple directional definition of negativity, on its own, can likely not provide a comprehensive understanding of complex dynamics such as the ones that political scientists, communication scholars, and other behavioural scientists are tackling these days. How to address these challenges towards a more comprehensive conceptualization of campaign negativity is beyond the scope of this article but is (and will be, for the foreseeable future) very much on our mind.
It is also important to note that the evidence that we have presented in this article remains very fragmentary and partial. Only a handful of studies cannot do justice to a whole interdisciplinary universe, characterized by competing epistemological paradigms and a multitude of empirical traditions. Yet, the sheer diversity of empirical material presented here – and the fact that all such evidence seems to converge conceptually – yields a rather clear picture, one that is considerably less negative than existing critiques have advanced.
And finally, the elephant in the room here is the fact that this article only investigates one measure on its own, without assessing whether other measures – Narrower? Broader? Multidimensional? More sophisticated conceptually? – it would perform even better in terms of reliability and validity. We have no strong reasons to believe this to be the case overall, even if some evidence in this article – for instance, as discussed in Study 6, the fact that the presence of negative TV ads in the United States correlates positively with the presence of character attacks on Twitter – suggests that conceptually narrower measures are more likely to pick up specific nuances that go beyond overarching effects of negativity. We will leave it to other researchers (or possibly our future selves, but likely not) to engage in a similar exercise as the one discussed in these pages, but also including cross-measure assessments.
All in all, the evidence presented across all the studies in this article seems to suggest that the directional measurement of negative campaigning is here to stay. It should not be discounted as a starting point for valid and reliable empirical investigations into the dynamics of attack politics, including when data triangulations are at stake – until a better measurement is proposed that can achieve similarly high levels of conceptual clarity, consistency in cross-observer measurement, convergent validity, and construct validity.
Supplemental Material
sj-docx-1-psx-10.1177_00323217261457621 – Supplemental material for Unreliable and Invalid? Not So Fast: A Multistudy Empirical Assessment of the ‘Directional’ Measure of Negative Campaigning
Supplemental material, sj-docx-1-psx-10.1177_00323217261457621 for Unreliable and Invalid? Not So Fast: A Multistudy Empirical Assessment of the ‘Directional’ Measure of Negative Campaigning by Alessandro Nai, Jürgen Maier and Michaela Maier in Political Studies
Footnotes
Acknowledgements
We are grateful to the journal editors and anonymous reviewers for their constructive critiques and support throughout the process. All remaining mistakes are our own responsibility alone. We would also like to warmly thank all the co-authors – too numerous to personally name – who have, over the years, worked with us on various projects related to campaign negativity and adjacent phenomena, for their generosity and friendship. Finally, a sincere thank you to Ulrike Klinger, Simon Kruschinski, Jörg Haßler, Anna-Katharina Moritz-Wurst, and their respective teams, for granting us the access to their raw data about the EU elections, which we used in S7.
Funding
The authors disclosed receipt of the following financial support for the research, authorship, and/or publication of this article: Alex Nai acknowledges the financial support from the Swiss National Science Foundation (SNSF, reference P300P1_161163), that made the large-scale expert surveys possible, as well as the financial support from the Amsterdam School of Communication Research (ASCoR) for the experimental data used in S9. Jürgen Maier acknowledges the financial support from the German Research Foundation (DFG, project number 441574527), that made the candidate surveys used in S4 possible, as well as the financial support from the research cluster “Communication, Media and Politics” (KoMePol) at the University of Koblenz-Landau for the content analysis used in S3.
Declaration of Conflicting Interests
The authors declared no potential conflicts of interest with respect to the research, authorship, and/or publication of this article.
Supplemental Material
Supplemental material for this article is available online.