
Abstract
Objective
This cross-sectional study, based on the National Health and Nutrition Examination Survey (NHANES), investigated the association between the serum albumin-to-globulin (A/G) ratio and diabetic retinopathy (DR).
Methods
We used data from the NHANES 2001-2020 and included adult participants with diabetes who completed standardized questionnaires, physical examinations, and laboratory assessments. Multivariate logistic regression models were used to evaluate the association between serum A/G ratio and DR. Restricted cubic spline (RCS) analysis was used to assess potential nonlinear relationships. Subgroup and interaction analyses were conducted to examine the robustness of the results. Receiver operating characteristic (ROC) curves were used to evaluate the predictive performance of the A/G ratio.
Results
Among 5,868 adult participants with diabetes, 1,268 had DR. After full adjustment, the results showed that a higher A/G ratio was significantly associated with lower odds of DR [OR (95% CI): 0.66 (0.47,0.93)]. The association was linear (P for nonlinear = 0.276) and consistent across most subgroups, with a significant interaction for cardiovascular disease (P for interaction = 0.019). The A/G ratio showed limited discriminatory ability for DR (AUC = 0.632).
Conclusions
A higher serum A/G ratio is associated with lower odds of DR. The findings suggest that the serum A/G ratio may reflect inflammatory and metabolic conditions associated with DR. Further prospective studies are needed to verify these findings and explore the underlying mechanisms.
Introduction
Among individuals with diabetes, diabetic retinopathy (DR) is a common microvascular complication and a primary cause of vision impairment and blindness in the working-age population. 1 As the prevalence of diabetes continues to rise, the number of DR patients is increasing every year. In 2021, the International Diabetes Federation reported that 537 million adults aged 20-79 worldwide had diabetes; by 2045, this figure may rise to 783 million.2,3 According to the Global Burden of Disease study, DR is the fifth leading cause of blindness and moderate visual impairment among adults aged 50 and older. DR not only results in substantial direct healthcare costs but also imposes indirect economic burdens, including reduced productivity and intensified social welfare expenditures.4–6 Given the heavy socioeconomic burden posed by DR, identifying biomarkers for DR may help us understand the related inflammation and metabolic changes. Therefore, exploring potential markers for DR may provide a useful reference for future research and clinical surveillance.
The serum albumin-to-globulin (A/G) ratio is the ratio of albumin concentration to globulin concentration in blood, with a normal range between 1.0 and 2.0. Albumin is primarily synthesized by the liver and reflects the nutritional status and liver function, while globulin includes immunoglobulins and complement proteins, which participate in inflammatory responses and immune function. The serum A/G ratio is a comprehensive indicator of nutrition, inflammatory levels, and immune function.7–12 Consequently, it is significant in predicting the risk and assessing the prognosis of various diseases, such as chronic inflammation, 7 tumors,13,14 cardiovascular disease (CVD), 15 and stroke.16,17 The pathogenesis of DR is closely associated with chronic inflammation, oxidative stress, and microvascular damage. As a marker of systemic inflammation and nutritional status, the A/G ratio may be associated with DR. Although there is limited direct evidence on the association between serum A/G ratio and DR, previous studies have suggested that serum A/G ratio is associated with several chronic inflammatory and metabolic diseases, including stroke and tumors.17–21 Therefore, the serum A/G ratio may provide insights into inflammatory and metabolic conditions potentially related to DR.
This study hypothesizes that a lower serum A/G ratio may be associated with DR. Using data from the National Health and Nutrition Examination Survey (NHANES [2.1]), this study examines the association between serum A/G ratio and DR in adults with diabetes.
Methods
In this cross-sectional study, we used data from the NHANES, a nationally representative survey initiated by the National Center for Health Statistics (NCHS) under the Centers for Disease Control and Prevention (CDC). NHANES uses a complex, multistage probability sampling design to obtain a nationally representative sample of the noninstitutionalized US population. Before the NHANES database was publicly released, all participant information had been de-identified to protect participant privacy. The study protocol was approved by the NCHS Institutional Review Board, and all subjects submitted written informed consent. The dataset is accessible via the NHANES official website (cdc.gov/nchs/nhanes/).22–24 This study followed the Helsinki Declaration of 1975 as revised in 2024 and reported under the Strengthening the Reporting of Observational Studies in Epidemiology (STROBE) guidelines. 25
We initially collected data from 97,657 participants in the NHANES (2001-2020). The study period was limited to 2001-2020 because DR questionnaire data were only available in NHANES through the 2020 cycle. Adult participants with diabetes were included. Diabetes was diagnosed based on any of the following criteria: (1) prior diagnosis by a medical professional; (2) fasting blood glucose (FBG) level >7.0 mmol/L; (3) glycated hemoglobin (HbA1c) level >6.5%; or (4) current use of diabetes medication. Exclusion criteria were set as: (1) participants without diabetes or younger than 20 years (n=90,920); (2) missing serum globulin or serum albumin data (n=809); and (3) missing DR-related data (n=60). Missing covariates were imputed using multiple imputation with the R package mice. The participant inclusion flowchart is outlined in Figure 1. Flowchart of the nhanes (2001-2020) study population.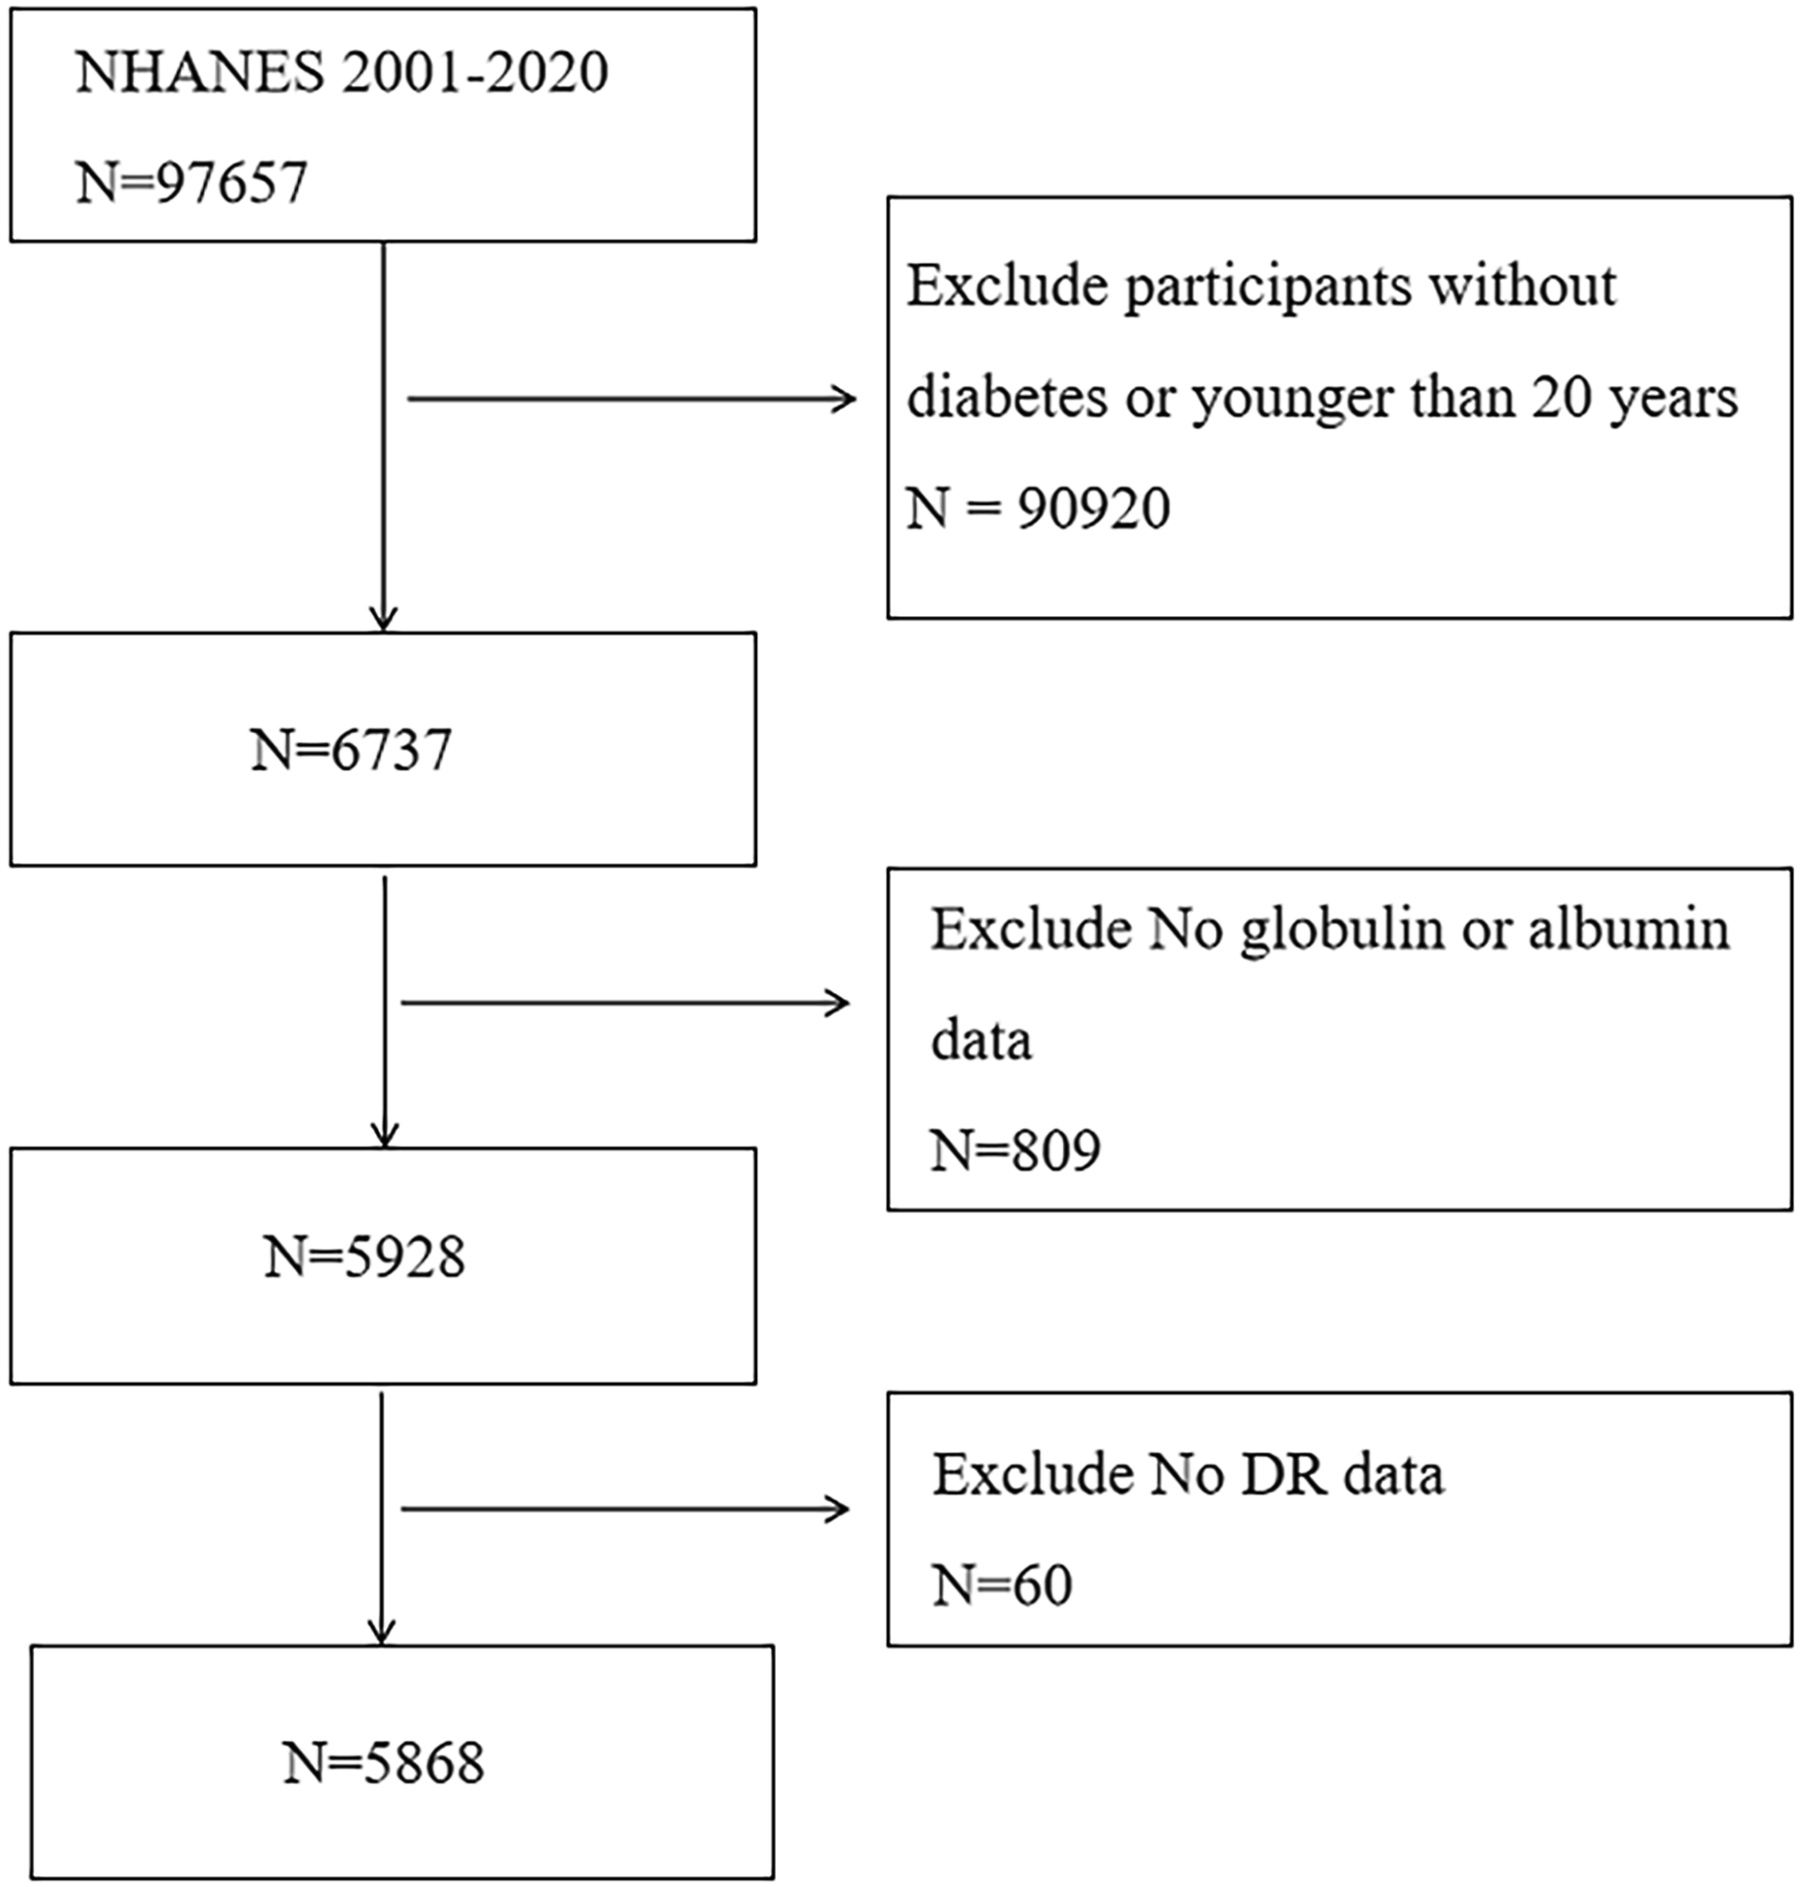
Evaluation and definition of serum A/G ratio
Albumin concentration was measured using a dual-color digital endpoint assay. Albumin bound to the bromocresol purple reagent to generate a complex. Changes in absorbance at 600 nm wavelength were monitored, which varied proportionally with albumin concentration in the sample. Globulin levels were determined by subtracting the albumin value from total serum protein (measured by the biuret method). The serum A/G ratio was calculated as: albumin content (g/L) divided by globulin content (g/L).
Assessment and definition of DR
DR was identified based on self-reported questionnaire data from NHANES. Participants were asked the following question: “Has a doctor ever told you that diabetes has affected your eyes or that you had retinopathy?” Participants who answered “yes” were classified as having DR.
Covariates
Covariates were collected through standardized NHANES questionnaires and physical/laboratory measurements, including demographic data (age, sex, and race/ethnicity), educational attainment, poverty income ratio (PIR), smoking status, alcohol intake, body mass index (BMI), laboratory indicators, and history of CVD, hypertension, and hyperlipidemia. Participants were categorized as Hispanic, non-Hispanic Black, non-Hispanic White, Mexican American, and other racial groups. BMI was calculated as weight (kg) divided by height squared (m2). Smoking status was grouped into never smokers (less than 100 cigarettes smoked in lifetime), former smokers (over 100 cigarettes smoked but quit), and current smokers (over 100 cigarettes smoked and still smoking). Hypertension was defined as a self-reported medical diagnosis, a mean systolic blood pressure of ≥130 mmHg or a mean diastolic blood pressure of ≥80 mmHg, or current use of antihypertensive medication. CVD was defined based on participants’ self-reported medical diagnoses of coronary heart disease, congestive heart failure, myocardial infarction, or stroke. Hyperlipidemia was defined based on laboratory test results (total cholesterol ≥ 200 mg/dL, low-density lipoprotein cholesterol ≥ 130 mg/dL, high-density lipoprotein cholesterol < 40 mg/dL in men or < 50 mg/dL in women, or triglycerides ≥ 150 mg/dL), self-reported medical diagnosis, or current use of lipid-lowering medications.
Statistical methods
All data analyses were conducted based on CDC guidelines, incorporating sampling weights and accounting for the multistage cluster survey design. All analyses were performed using R software (version 4.3.3), with P < 0.05 (two-tailed) indicating statistical significance. Continuous variables with non-normal distributions were reported as median (interquartile range) and compared using the Mann-Whitney U test. Continuous variables with normal distributions were reported as mean ± standard deviation and compared using the independent samples t-test. Categorical variables were reported as the number of cases before weighting (proportion after weighting) and compared via chi-square tests and Fisher’s exact tests. The variance inflation factor was used to examine potential multicollinearity among covariates, and it revealed no significant multicollinearity among the variables. A weighted logistic regression model was used to clarify the link between serum A/G ratio and DR. Model 1 did not adjust for any covariates; Model 2 considered sex, age, and ethnicity; Model 3 accounted for age, sex, ethnicity, education level, PIR, smoking habits, BMI, marital status, drinking habits, diabetes medication use, age at diabetes diagnosis, CVD, hypertension, and hyperlipidemia. The nonlinear link was further examined via restricted cubic spline (RCS) analysis. Subgroup analyses were conducted based on sex, ethnicity, marital status, age, smoking status, education level, alcohol consumption, CVD, and hyperlipidemia to assess potential interactions with the association. Diagnostic performance was evaluated through receiver operating characteristic (ROC) curves, with area under the curve (AUC) calculated to quantify the predictive ability of serum A/G ratio for DR. Finally, the entire process of the primary analysis was repeated using unweighted data to justify the robustness of the results.
Results
Baseline patient profiles
A total of 5,868 adult participants with diabetes were included in this study, among whom 1,268 had DR. Participants aged 45-64 years accounted for 44.64% of the cohort, while those aged ≥65 years accounted for 39.99%. Males comprised 51.54%, non-Hispanic whites represented 61.88%, and current smokers constituted 58.11%. There were no statistical variations between the DR and non-DR groups in terms of age, sex, racial distribution, smoking status, BMI, and waist circumference (all P>0.05). However, the median PIR in the DR group (1.98) was clearly lower than that in the non-DR group (2.57, P<0.001). A marked difference existed in educational attainment (P<0.001), with the DR group exhibiting lower educational levels. Fewer individuals in the DR group consumed alcohol (53.34% vs 59.29%, P=0.009). The proportion of diabetes medication use was greatly lower in the DR group (64.36%) than in the non-DR group (72.32%, P<0.001), while the prevalence of concomitant CVD was higher (33.15% vs 26.31%, P<0.001). The distribution of hyperlipidemia and hypertension was similar between the DR and non-DR groups (P>0.05). Stratified analysis by age at diabetes diagnosis found significant differences (P<0.001), with a higher percentage of younger-onset cases in the DR group.
Characteristics of study participants with and without DR.
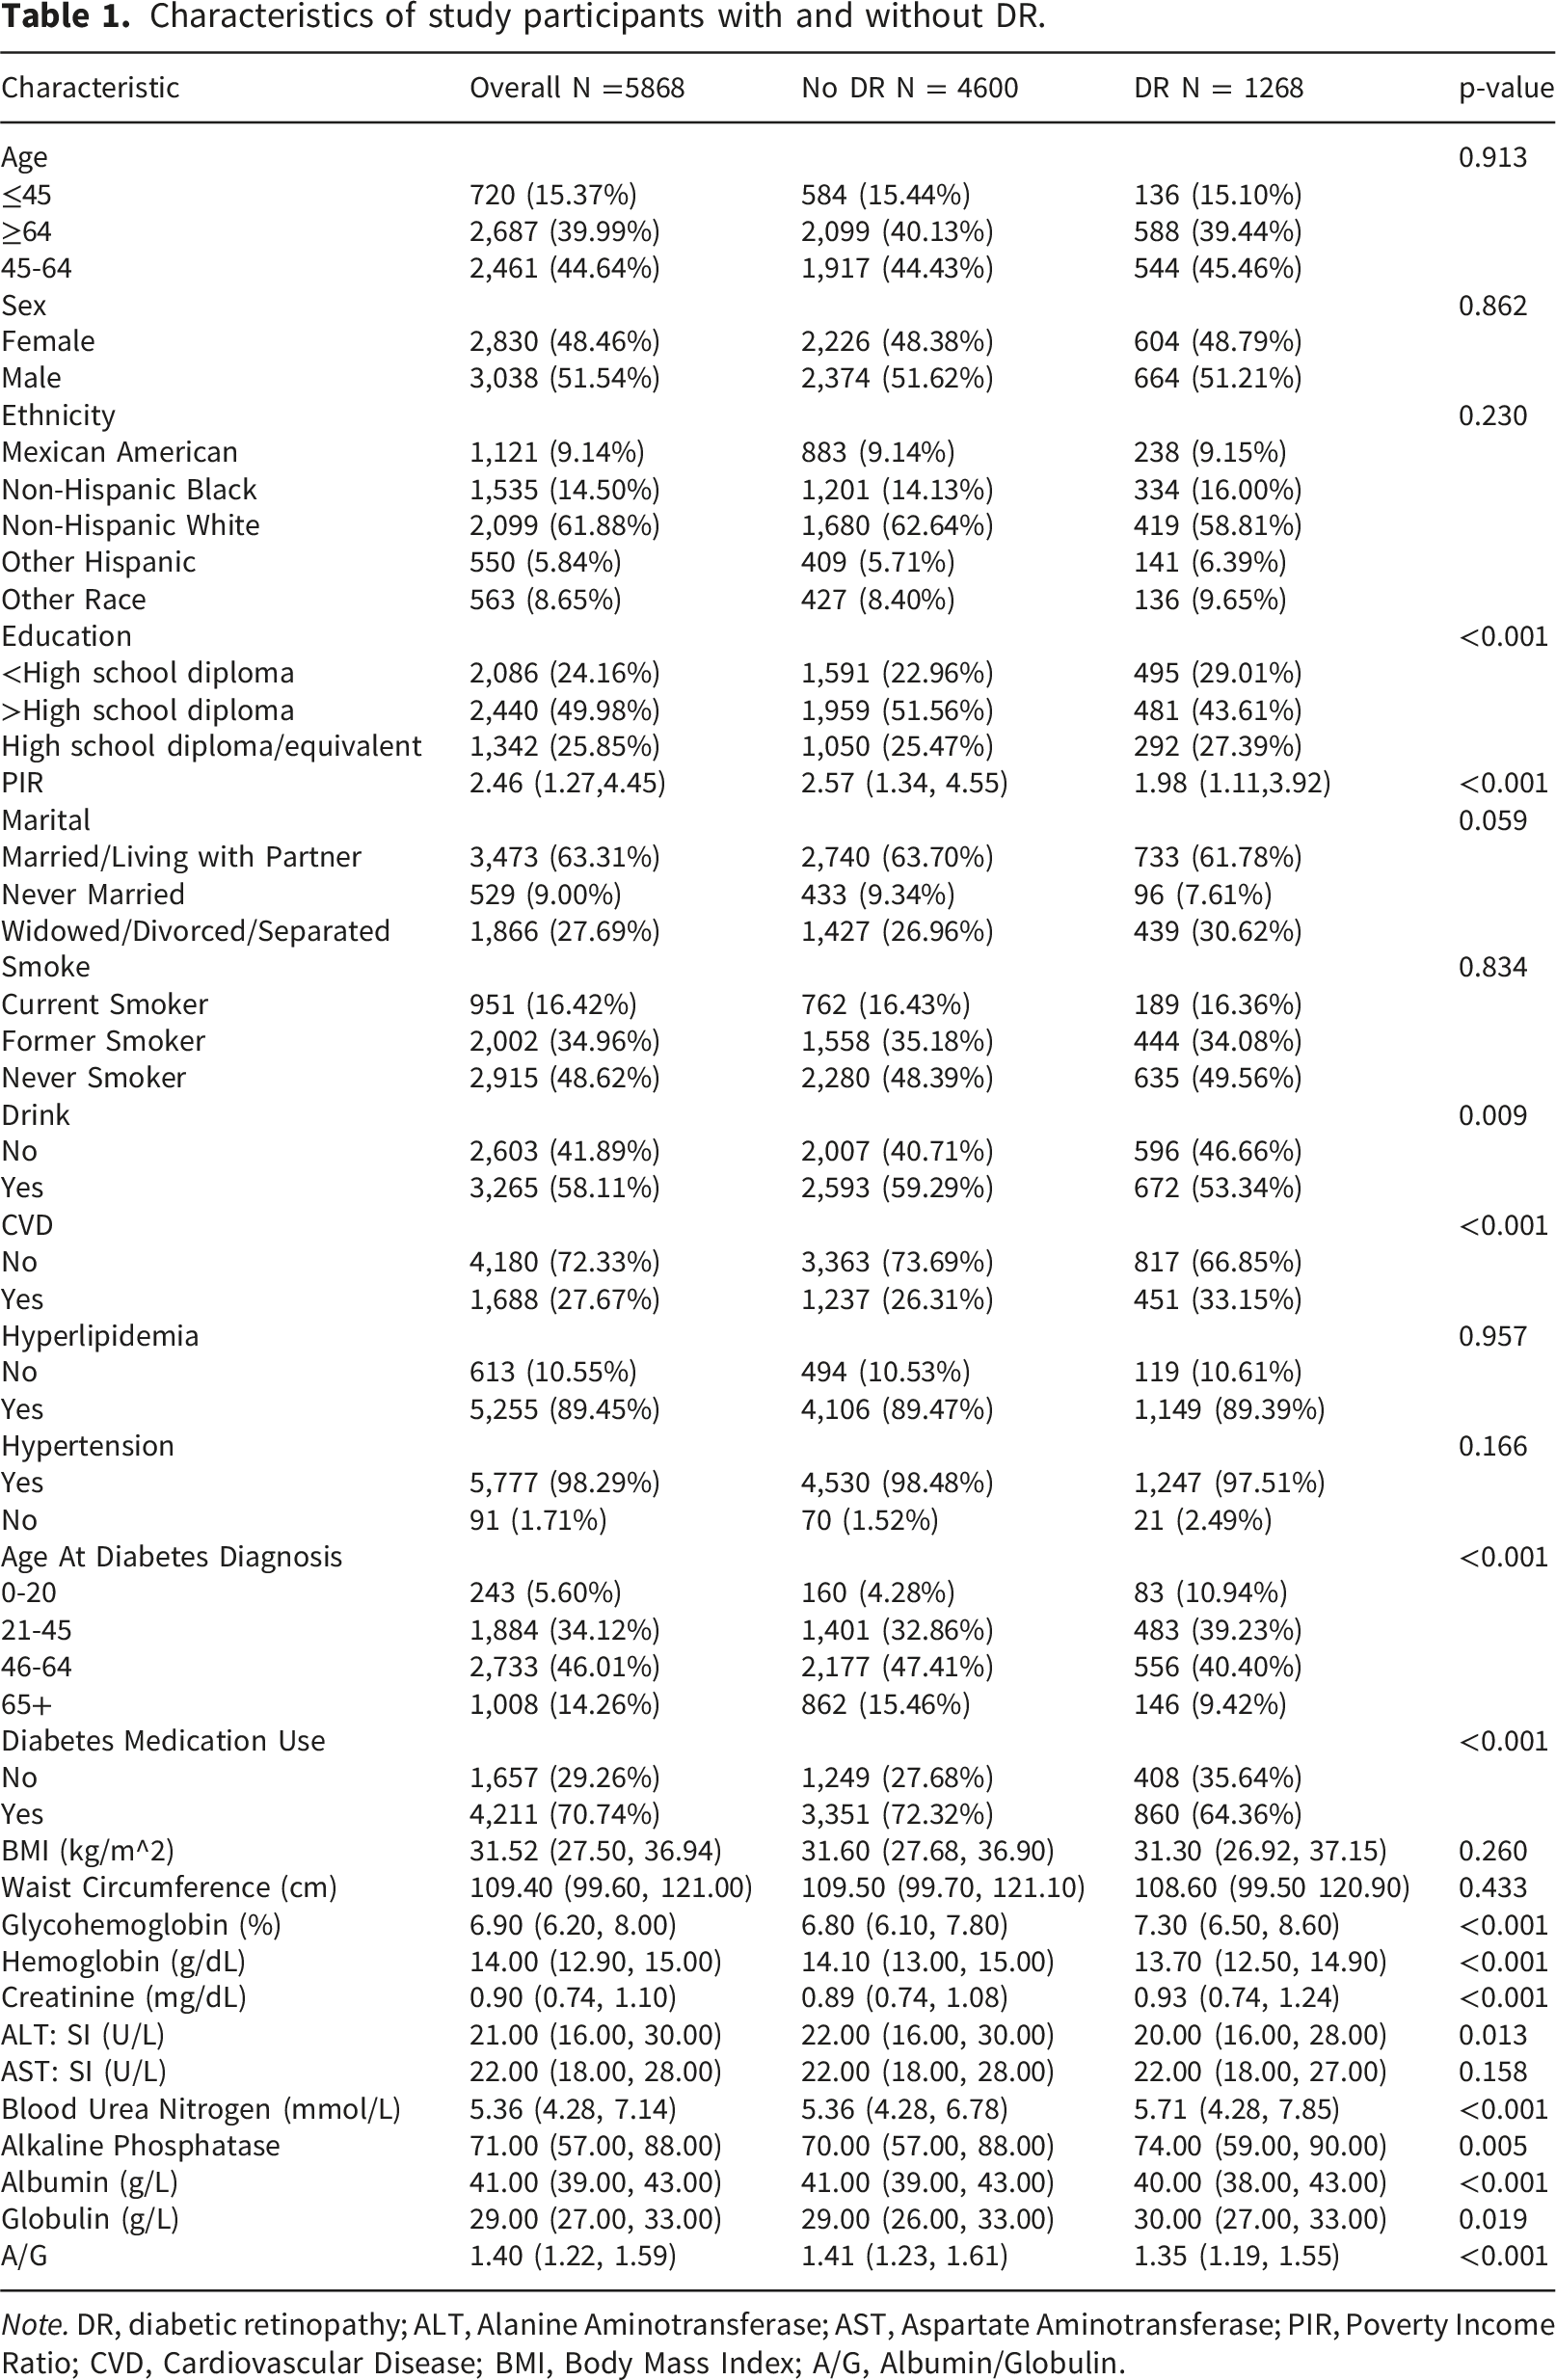
Note. DR, diabetic retinopathy; ALT, Alanine Aminotransferase; AST, Aspartate Aminotransferase; PIR, Poverty Income Ratio; CVD, Cardiovascular Disease; BMI, Body Mass Index; A/G, Albumin/Globulin.
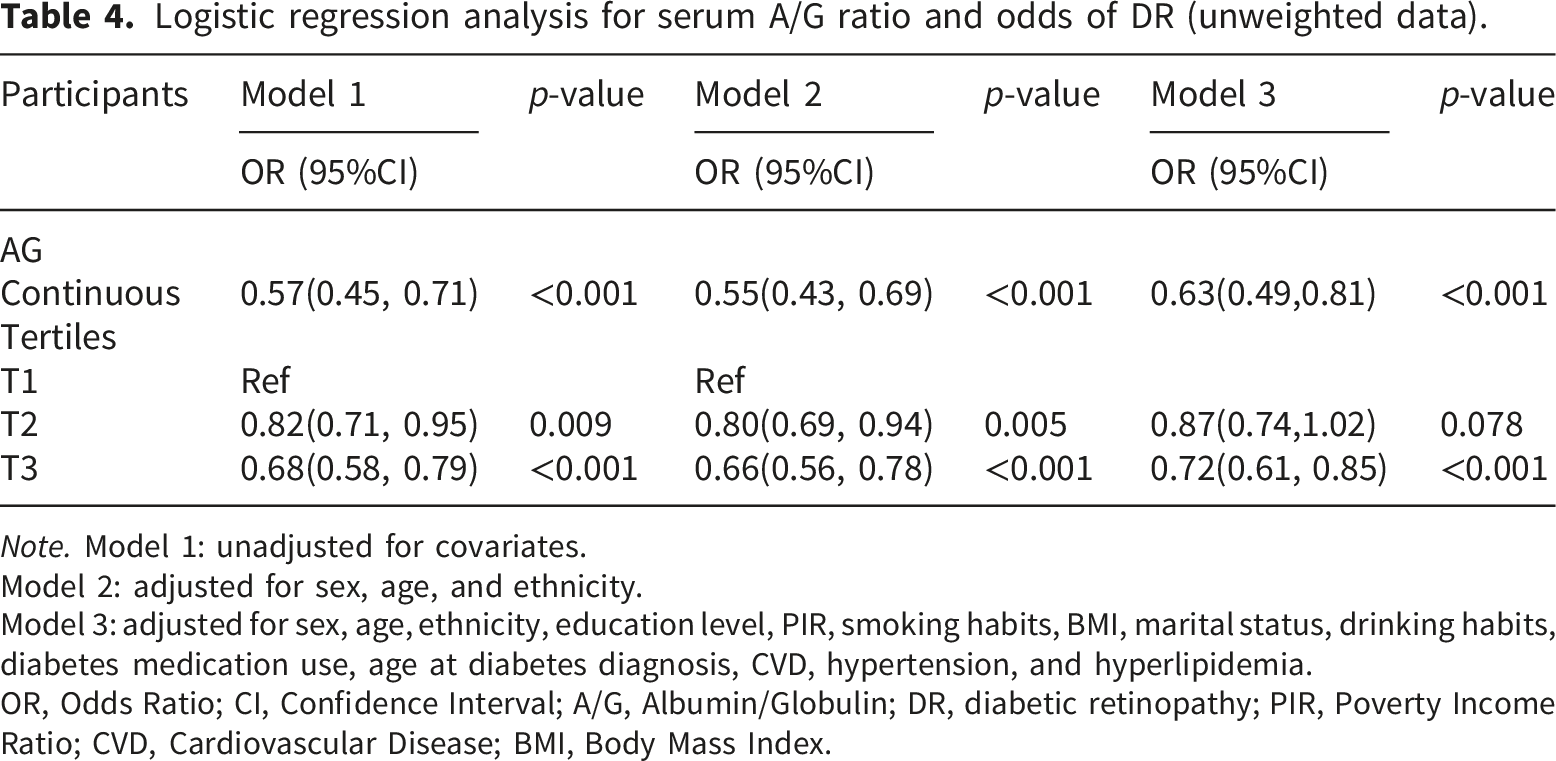
Multivariate logistic regression and RCS analysis
Logistic regression analysis for serum A/G ratio and odds of DR.
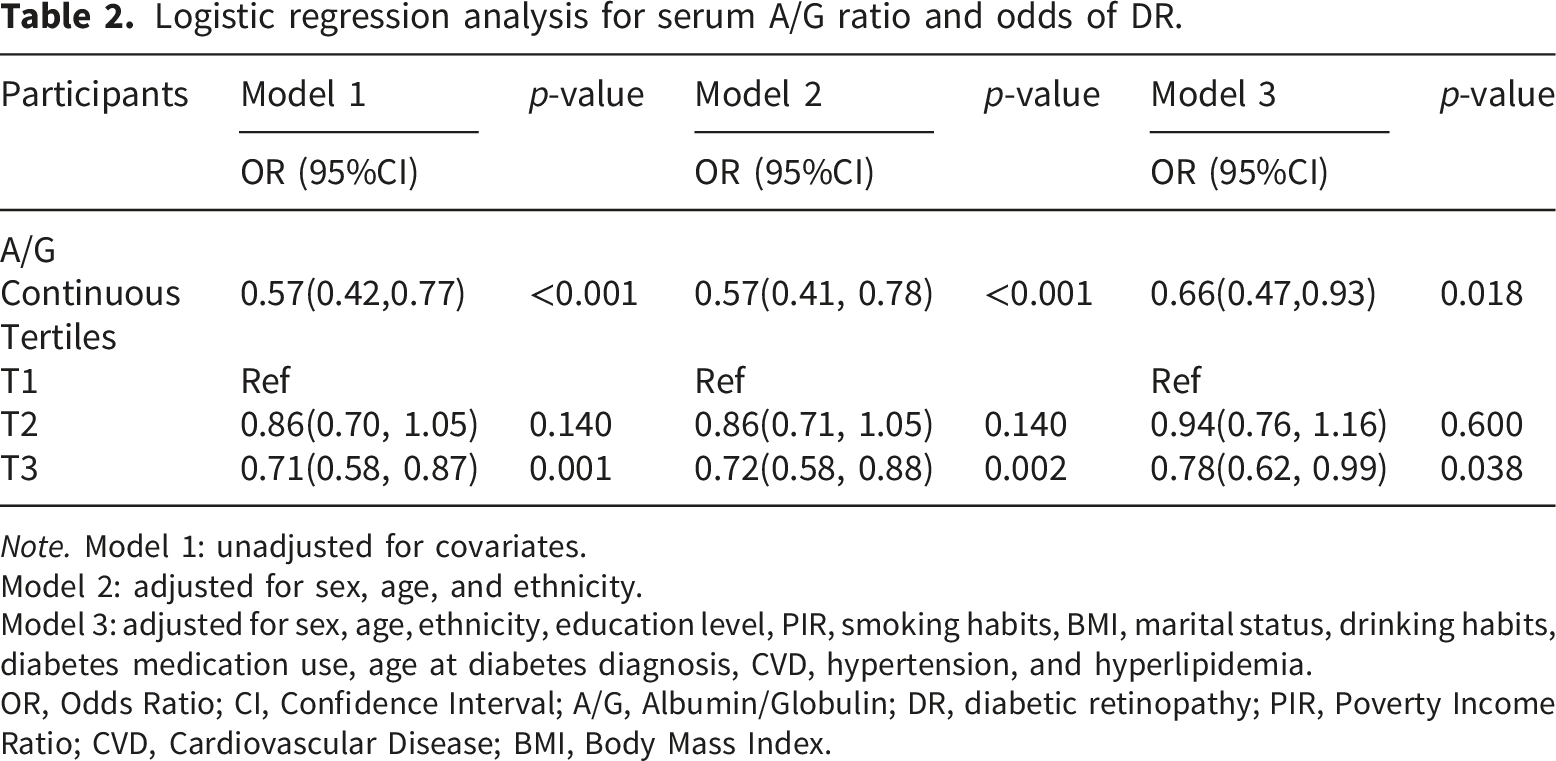
Note. Model 1: unadjusted for covariates.
Model 2: adjusted for sex, age, and ethnicity.
Model 3: adjusted for sex, age, ethnicity, education level, PIR, smoking habits, BMI, marital status, drinking habits, diabetes medication use, age at diabetes diagnosis, CVD, hypertension, and hyperlipidemia.
OR, Odds Ratio; CI, Confidence Interval; A/G, Albumin/Globulin; DR, diabetic retinopathy; PIR, Poverty Income Ratio; CVD, Cardiovascular Disease; BMI, Body Mass Index.
RCS analysis indicated no significant nonlinear association between serum A/G ratio and DR (P-nonlinear=0.276). The spline curve suggested an approximately linear inverse association between serum A/G ratio and DR prevalence (Figure 2(a)). Association between serum albumin-to-globulin (A/G) ratio and diabetic retinopathy (DR). (a) Restricted cubic spline (RCS) analysis showing the nonlinear association between serum A/G ratio and DR. The solid line represents the adjusted odds ratio (OR), and the shaded area indicates the 95% confidence interval (CI). (b) Receiver operating characteristic (ROC) curve evaluating the predictive performance of serum A/G ratio for DR.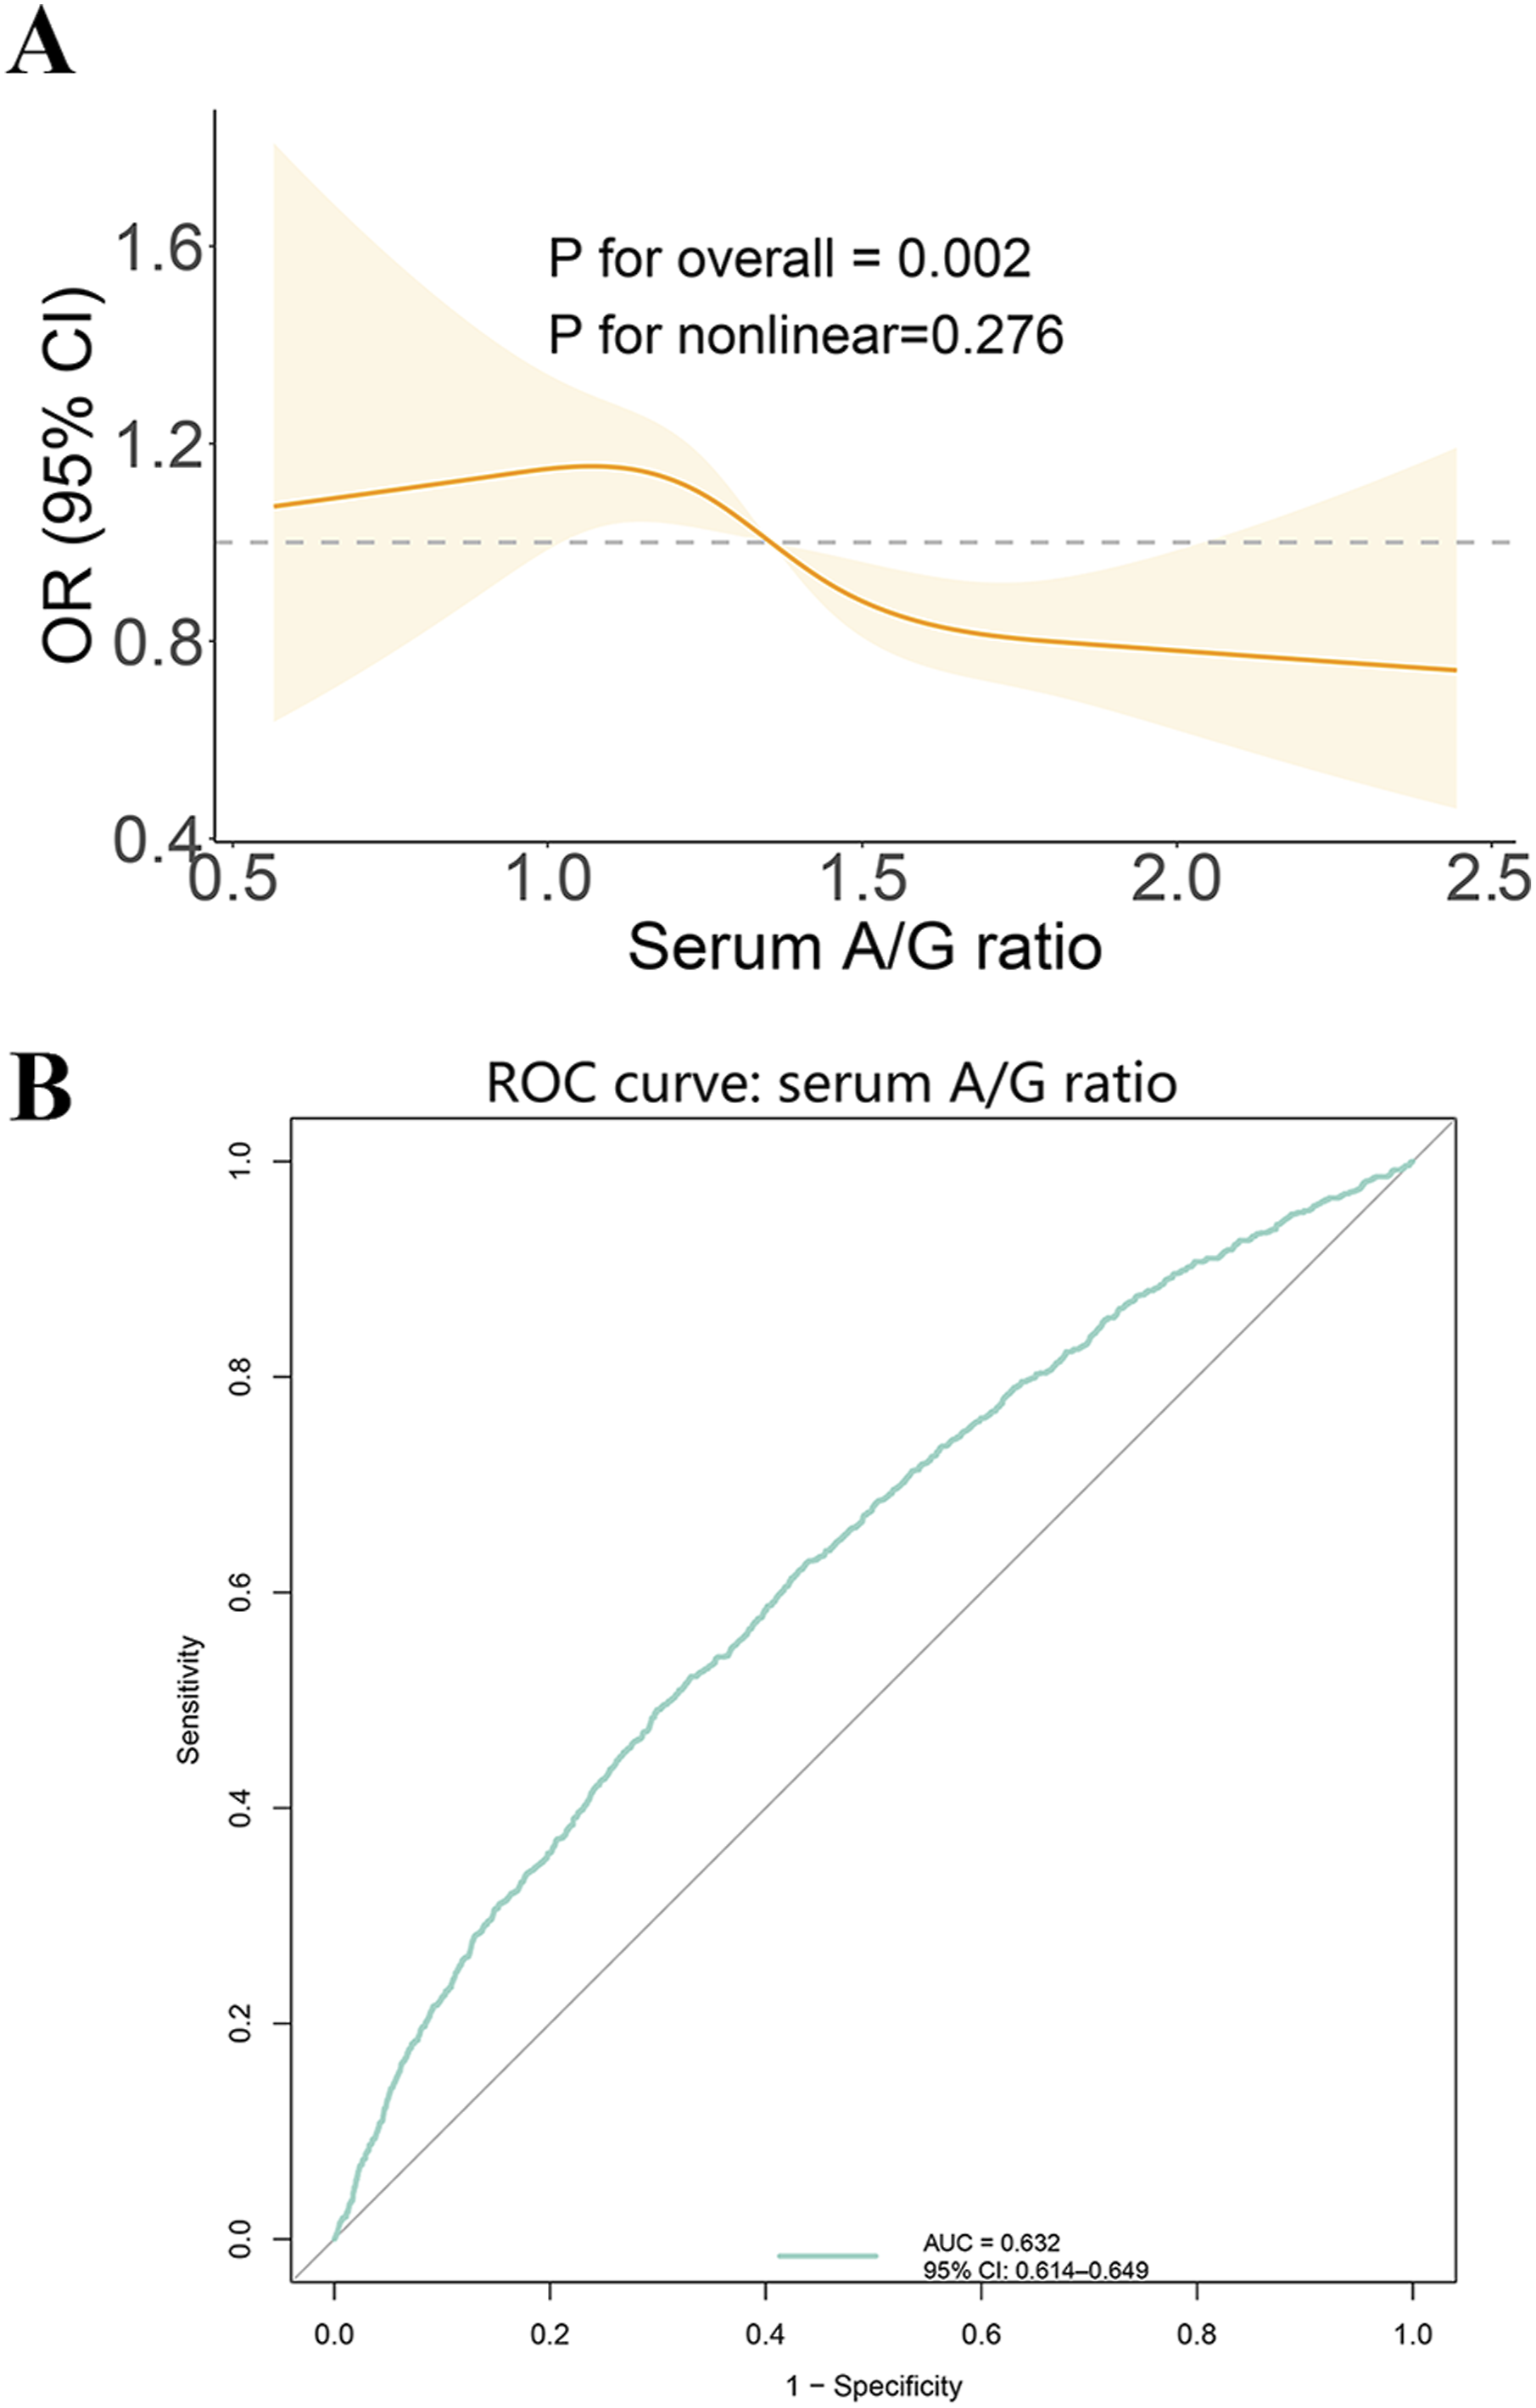
Subgroup analysis
Link between serum A/G ratio and DR according to different variables.
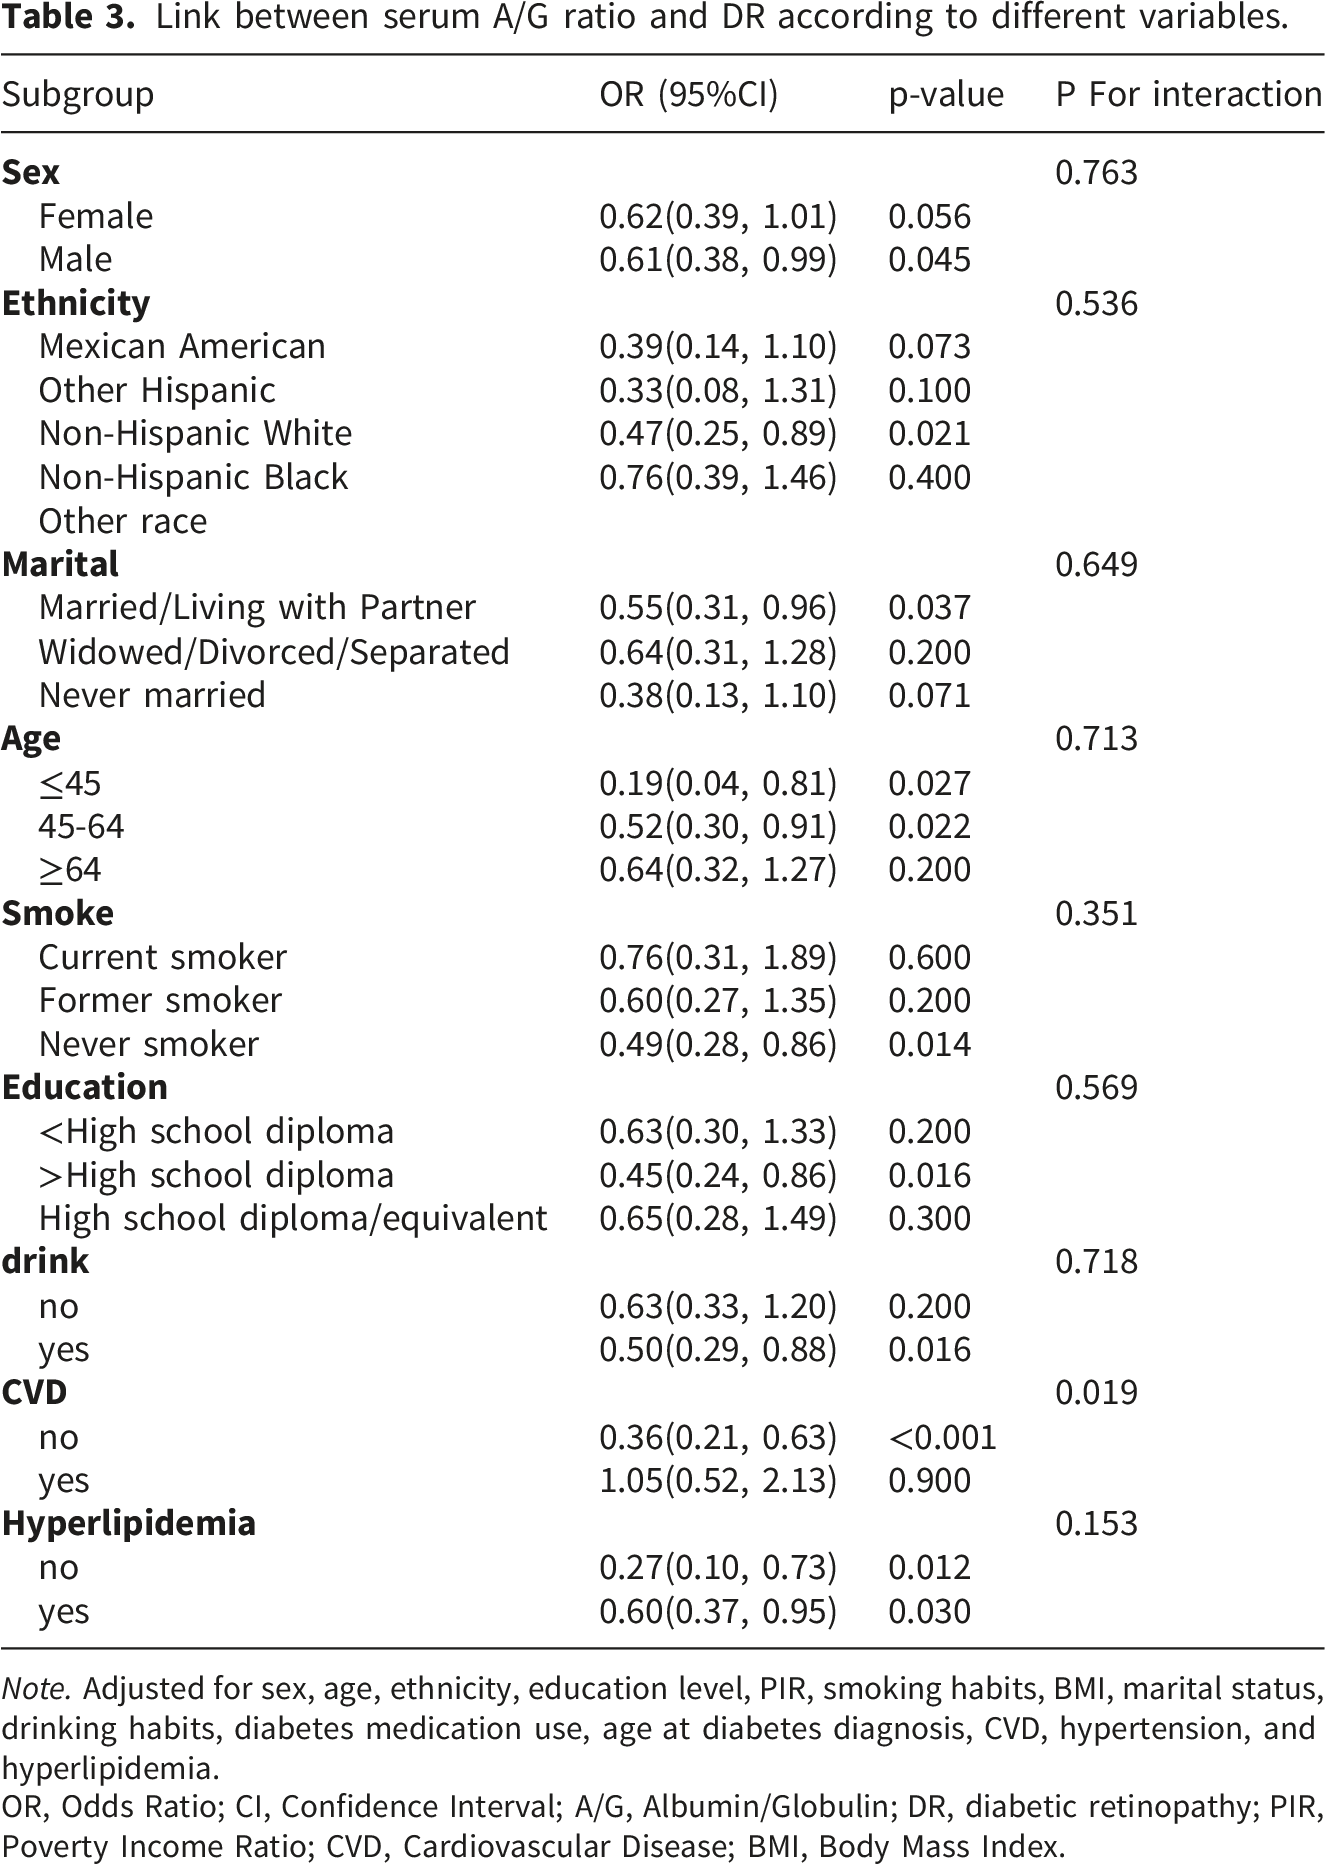
Note. Adjusted for sex, age, ethnicity, education level, PIR, smoking habits, BMI, marital status, drinking habits, diabetes medication use, age at diabetes diagnosis, CVD, hypertension, and hyperlipidemia.
OR, Odds Ratio; CI, Confidence Interval; A/G, Albumin/Globulin; DR, diabetic retinopathy; PIR, Poverty Income Ratio; CVD, Cardiovascular Disease; BMI, Body Mass Index.
ROC curve
ROC curve showed an AUC of 0.632 (95% CI: 0.614-0.649), suggesting limited discriminatory ability of serum A/G ratio for DR (Figure 2(b)).
Sensitivity analysis
Logistic regression analysis for serum A/G ratio and odds of DR (unweighted data).
Note. Model 1: unadjusted for covariates.
Model 2: adjusted for sex, age, and ethnicity.
Model 3: adjusted for sex, age, ethnicity, education level, PIR, smoking habits, BMI, marital status, drinking habits, diabetes medication use, age at diabetes diagnosis, CVD, hypertension, and hyperlipidemia.
OR, Odds Ratio; CI, Confidence Interval; A/G, Albumin/Globulin; DR, diabetic retinopathy; PIR, Poverty Income Ratio; CVD, Cardiovascular Disease; BMI, Body Mass Index.
Discussion
Based on NHANES data from 2001 to 2020, this study investigated the association between the serum A/G ratio and DR. Results from multivariate regression analysis indicated that, after adjusting for potential confounders, a higher serum A/G ratio was associated with lower odds of DR, and this association remained relatively consistent across various subgroups. RCS analysis did not show a significant nonlinear relationship between the serum A/G ratio and DR. ROC analysis showed that the serum A/G ratio had limited predictive ability for DR (AUC = 0.632).
This study suggested that a higher serum A/G ratio was associated with a lower likelihood of DR. This association remained independent even after adjusting for multiple variables. Previous studies on the relationship between serum albumin and diabetic complications have found that low serum albumin levels are closely related to diabetic nephropathy,26–28 diabetic peripheral neuropathy, 29 and DR.30,31 Our analyses find consistent conclusions and further support the possible associations of systemic inflammation and nutritional status with diabetic microvascular complications. This suggests that hypoalbuminemia may increase the risk of microvascular injury via chronic inflammation, malnutrition, or oxidative stress.32,33 Additionally, elevated globulin levels often indicate chronic inflammation and increased immune responses.34,35 In patients with diabetes, hyperglycemia triggers oxidative stress and inflammatory reactions, leading to abnormal activation of the immune system and excessive production of cytokines, thereby promoting long-term diabetic complications. 36 A low serum A/G ratio may result from decreased albumin levels and/or elevated globulin levels and may reflect systemic inflammation and metabolic abnormalities in DR. These abnormalities may further contribute to retinal microvascular dysfunction and impair vascular repair capacity.
Compared with previous studies that primarily focused on serum albumin levels,30,31 this study further evaluated the association between the serum A/G ratio and DR. Subgroup analyses showed that the association between the serum A/G ratio and DR remained relatively consistent across different subgroups based on sex, lipid profile, and alcohol consumption. It suggests that this association is relatively stable across different populations.
In certain subgroups, including non-Hispanic whites, married or cohabiting individuals, those aged 64 or younger, non-smokers, and those with higher levels of education, this association was more significant. This may suggest that social support, lifestyle, and nutritional status may influence systemic inflammation and metabolic status. Notably, in the CVD stratification, the serum A/G ratio showed a significant protective effect only in the CVD-free cohort, while no statistical significance was observed in those with concomitant CVD, with a significant interaction effect. This discrepancy may be related to the combined effects of CVD-associated systemic inflammation and vascular injury on retinal microcirculation. Patients with CVD often exhibit chronic low-grade inflammation and endothelial dysfunction, accompanied by insufficient perfusion due to atherosclerosis and vascular sclerosis.37,38 CVD and DR both involve vascular injury.39,40 CVD can accelerate DR progression and further exacerbate microvascular damage, thus reducing the protective effect of the serum A/G ratio (representing the inflammation-nutrition balance). Our findings further suggest that the serum A/G ratio may, to some extent, reflect systemic inflammation and vascular metabolic status associated with DR. However, the specific mechanisms underlying this relationship require further investigation. Furthermore, in regions with limited ophthalmic resources, DR screening and referral often face challenges, such as a shortage of specialist resources.41,42 As a routine and easily accessible laboratory marker, the serum A/G ratio holds potential clinical value in resource-limited settings and deserves further investigation. However, given that this study is a cross-sectional study, its actual clinical value still needs to be further validated through prospective studies.
Although this study has a large sample size and adjusts for multiple variables, there are still certain limitations. First, the cross-sectional design prevents us from exploring the causality between the serum A/G ratio and DR. Second, serum albumin and globulin levels are influenced by oxidative stress status or liver function reserve, which are not comprehensively recorded in NHANES. These unmeasured factors may lead to residual confounding. Third, the definition of DR is based on self-reported questionnaire data from the NHANES, rather than on standardized fundus image grading or professional ophthalmic examination results. Consequently, it may have misclassification bias. Although this definition is widely used in NHANES-related epidemiological studies, its accuracy may still be affected by recall bias among participants and their level of disease awareness. Finally, the study sample is limited to the U.S. population, and the generalizability should be verified in other countries/regions with distinct environmental and genetic settings. Future prospective studies that integrate standardized fundus imaging assessments, clinical grading systems, and additional potential confounding factors are needed to further verify the association between the serum A/G ratio and DR.
Conclusion
This cross-sectional study found that a lower serum A/G ratio was associated with higher odds of DR, and this association remained consistent across different subgroups. The serum A/G ratio may reflect inflammatory and metabolic states associated with DR. However, as this was an observational cross-sectional study, causal relationships cannot be inferred. Prospective studies are needed to further verify these findings and explain the underlying mechanisms.
Footnotes
Ethical considerations
According to the Declaration of Helsinki, all NHANES protocols obtained approval from the Ethics Review Board of NCHS. Written informed consent was offered by enrolled individuals.
Author contributions
All authors contributed to the study conception and design.
Funding
The authors disclosed receipt of the following financial support for the research, authorship, and/or publication of this article: This work was supported by the Joint Project on Regional High-Incidence Diseases Research of Guangxi Natural Science Foundation (Grant No. 2024GXNSFAA010322), Science and Technology Plan of Qingxiu District, Nanning City (Grant No. 2020016), Medical and Health Appropriate Technology Development and Promotion Application Project of Guangxi Zhuang Autonomous Region (Grant No. S2018093).
Declaration of conflicting interests
The authors declared no potential conflicts of interest with respect to the research, authorship, and/or publication of this article.