
Abstract
The transactional data typically collected/available on queueing systems are often subject to censoring as unsuccessful arrivals due to balking and/or unserved entities due to reneging are not recorded. In fact, in many situations, the true arrival, balking, and reneging events are unobservable, making it virtually impossible to collect data on these stochastic processes—information that is crucial for capacity planning and process improvement decisions. The objective of this paper is to estimate the true (latent) external arrival, balking, and reneging processes in queueing systems from such censored transactional data. The estimation problem is formulated as an optimization model and an iterative simulation-based inference approach is proposed to find appropriate input models for these stochastic processes. The proposed method is applicable in any complex queueing situation as long as it can be simulated. The problem is investigated under both known and unknown reneging distribution. Through extensive simulation experiments, general guidelines are provided for specifying the parameters of the proposed approach, namely, sample size and number of replications. The proposed approach is also validated through a real-world application in a call center, where it successfully estimates the underlying arrival, balking, and reneging distributions. Finally, to enable reproducibility and technology transfer, a working example, including all codes and sample data, are made available in an open online data repository associated with this paper.
1. Introduction
Queueing systems are commonly found in various sectors including but not limited to manufacturing, healthcare (hospitals and emergency clinics), service and amusement industries (restaurants and theme parks), telecommunication, transportation, and military. In many of these systems, an entity/customer who balks at joining a queue or reneges after waiting for some time without being processed/served corresponds to a negative outcome, such as lost revenue and low quality of service. Therefore, there is a need to estimate the underlying balking and reneging dynamics.
Estimating entities’ balking behavior is a challenging problem since transactional data collected from most queueing systems only account for entities that actually entered the queue. Such data censor part of the demand that was lost due to balking and can lead to potentially incorrect or sub-optimal decisions if used for decision-making related to the design and operation of the queueing system. For example, effective capacity planning and staffing decisions require an accurate estimate of the demand, otherwise they may lead to excessive resource costs or an understaffed facility. The main challenge is that, in many situations, the true (before-balk) arrival process and balking events are unobservable, making it impossible to collect data on these processes. For example, there is no way to tell whether or not a car passing by a busy drive-through restaurant is a potential customer who decides to balk due to the long line.
A related phenomenon is reneging, that is, when an entity, having joined the queue, decides to leave the queue once her waiting time exceeds some threshold representing the maximum time she has or is willing to wait for service. While such behavior may be observable and possible to collect data on, typical transactional data collected from queueing systems often do not include reneging events as it requires tracking each entity separately. This also applies to a special type of queueing systems generally referred to as ticket queues,1–3 which may or may not have a physical waiting area. Upon arrival to a ticket queue, a customer is given information about the current state of the system indicating the order of arrival to the system and the number for the customer that is currently being served. The arriving customer then chooses whether to join the queue or balk, a decision based on the perceived queue length and associated waiting time. Therefore, for such queues, the true external arrival process can be estimated directly from transactional data. However, data on balking and reneging still may not be available. For instance, in many ticket queues, a balking or reneging event is not detected until the person’s number is called for service. The problem is that it is not clear whether the entity balked right away without entering the queue or reneged after waiting for a while (i.e., no information on balking threshold (BT) or waiting threshold (WT)).
It is worth noting that individuals themselves may not be fully aware of their own balking or reneging thresholds/behavior with respect to different queueing systems. Even for the same type of system, an individual’s threshold may vary for every visit to the system depending on the need and situation. For example, people are willing to wait longer to have their driver’s license renewed if their current license expires on the same day. Moreover, people often rely on their perception at the moment rather than their exact position in line or a precise estimate of the amount of time they are willing to wait before reneging.
In short, collecting data on and estimating the true arrival, balking, and reneging processes is not a trivial task, to say the least. This paper proposes a method to estimate these important parameters. We consider queueing systems where entities balk depending on the queue length at the time of arrival and their personal BT, and renege when their WT is exceeded. Given only observed transactional data on after-balk arrivals, queue length (without tracking individual entities), and service times, the goal is to reconstruct the model by estimating the distribution of the true before-balk entity inter-arrival time (IAT) and balking and reneging thresholds that would lead to similar dynamics as those observed. The paper introduces a new random variable to characterize the effective arrival process under any realized queue length, which can be evaluated from the real-world transactional data and is also simulable. We formulate a conceptual optimization model, where the objective is to find appropriate arrival, balking, and reneging input distributions for the simulation model of the queueing system under study such that the difference between the observed and simulated values of this random variable is minimized. An iterative method combining discrete-event simulation and subset selection is then developed to solve the optimization problem and identify appropriate input distributions for entity IAT and balking and reneging thresholds that perform best (statistically) among a set of candidate distributions. The performance of the proposed approach is tested for the case of unknown and known reneging distribution. Through extensive simulation experiments, general guidelines for specifying the parameters of the proposed method are provided. An application using real-world transactional data from a call center is presented to validate and illustrate the efficacy of the proposed method. A complete working example, including all codes and a sample dataset, is provided in an open online Mendeley Data repository associated with this paper. 4
The remainder of the paper is organized as follows. Section 2 provides a critical review of the related literature. Section 3 presents the definitions, formulation of the estimation problem as an optimization model, and the proposed simulation-based solution method. Section 4 illustrates the applicability of and justification for the proposed solution approach in the case of known and unknown reneging distribution for a hypothetical yet complex queueing situation. Section 5 presents the results of extensive computational experiments and provides additional insights on how to configure the parameters of the proposed method. Section 6 provides a validation study using real-world transactional data from a call center. Finally, section 7 presents the conclusions and potential future extensions.
2. Related literature
This section provides a critical review of the two primary related streams of research on queueing inference and simulation input modeling and calibration with the goal to identify the existing gaps and delineate the contributions of this work to each research stream.
2.1. Queueing inference
Early studies on queueing with balking and/or reneging go back to as early as the 1950s.5,6 The majority of traditional queueing studies aim at (1) finding steady-state or transient solutions for different types of queues with impatient customers7–10 and (2) estimating the probability that the total number of customers in the system reaches a certain high level/threshold during a busy cycle of the system. 11
The most important issue with these models is that they generally assume that the true arrival, balking, and reneging processes (or at least their mean and variance) are known, which is not the case in many real-world situations. This has given rise to a stream of research on queue inference that deals with indirect inference of unobservable or missing queueing statistics based on some observed output or transactional data.
Perhaps one of the key seminal works in the queueing inference literature is the Queue Inference Engine. 12 This work and its extensions13–15 primarily focus on using transactional data to estimate the performance of a queueing system directly rather than reconstructing the model by estimating the constituent input models that resulted in the observed dynamics. The other subclass of the queueing inference literature, that is most relevant to this paper, primarily focuses on inferring or estimating the constituent probability distributions of a queueing model based on its output data such as queue length or waiting time data, collected either continuously or at discrete points in time. There are three main limitations associated with these approaches:
The majority of these studies assume that the inferred distributions come from a parametric family and use maximum-likelihood estimators to estimate the parameters of the assumed distribution.16–21
The studies on nonparametric inference, on the contrary, are only limited to simple queueing structures (e.g., M/G/1 or M/G/
Even for simple queueing systems, existing work on estimating the true arrival process and balking behavior require the availability of some non-censored data to develop an initial estimate of the inferred distributions. 22 However, such data are often not available (as discussed before), further limiting the applicability of these approaches.
The above limitations are primarily due to analytical tractability, hence there is a lack of approaches that are applicable in more complex queueing situations that involve simultaneous presence of balking and reneging in conjunction with other factors that would make the inference problem analytically intractable, such as blocking, nonstandard queue priority rules, and nonstationary stochastic processes. The simulation-based inference approach proposed in this paper contributes to this stream of research in three ways: (1) it does not require simplistic queueing structures and is applicable to any complex situation that can be simulated; (2) it is applicable for any underlying distribution, parametric or not; and (3) it extracts useful information from censored data by using a new random variable that is completely observable regardless of the queueing setting. Therefore, the proposed method is applicable even if no or insufficient non-censored data are available.
2.2. Simulation input modeling and calibration
Stochastic simulation is a common tool for modeling queueing systems in various contexts such as manufacturing, 27 healthcare, 28 military, 29 supply chain, 30 and marketing, 31 to name a few. Stochastic simulation involves a set of input models, mostly in the form of probability distributions, that are used to generate random outputs for subsequent performance analysis. Input models are developed based on data collected on input processes, expert knowledge, or physical justifications. Perhaps the most common approach involves fitting probability distributions to the collected data via goodness-of-fit tests, which are discussed in any introductory reference on simulation input modeling and analysis. 32 If there is too much data available, such statistical tests become too sensitive to even minute deviations, leading to a rejection for the fit of almost all distributions. In such cases, input variates can be sampled directly from the real-world data. 33 These common input modeling techniques, however, are not applicable when estimating the true arrival, balking, and reneging distributions as these processes are unobservable and any kind of data available would be censored.
Calibration, on the contrary, can be defined as the process of inferring an input model from output data by iteratively comparing simulation reports and real-world output data and making refinements to the input models and/or model specifications as necessary.34,35 Common methods for performing these comparisons include statistical tests such as two-sample mean-difference tests 36 and the Schruben-Turing test, 37 which are generally insufficient to solve the problem considered in this paper even for very simple situations. For instance, consider estimating the after-balk arrival process into a single server based on observations on the average utilization of the server as the observable output. If a simple mean-difference test is used, almost any arrival distribution with the correct mean value would likely pass the test and be deemed appropriate as it would result in a similar mean utilization. Due to this limitation of common calibration methods, inferring appropriate input models from output data is known as an important strategic problem in the simulation field. 38
Recently, a few simulation studies tackle the inference problem. Optimization-based simulation techniques to infer service times in emergency departments from incomplete data have been proposed in two papers,39,40 where only the starting time of service at each stage is recorded, hence the time difference between service start time at stage
This paper contributes to this stream of research in three ways: (1) to the best of the author’s knowledge, this is the first paper to propose a simulation-based inference method for simultaneous estimation of the true arrival, balking, and reneging processes in queueing systems; (2) the proposed approach does not require a certain probability distribution family, is not limited to a specific type of censoring or application (e.g., emergency departments or bike sharing systems), and is applicable to any queueing system with any arbitrary level of complexity as long as it can be modeled via simulation; and (3) it proposes a comprehensive quantile-based measure to evaluate the discrepancy between the observed and simulated data (as opposed to only comparing summary statistics such as the mean or standard deviation). This enables detecting and filtering out incorrect potential solutions that may lead to summary statistics similar to the ones observed.
3. Methodology: definitions, conceptual formulation, and solution approach
This section provides the definition of related random variables, formulation of the estimation problem as an optimization model, and the proposed simulation-based solution method.
3.1. Definition of random variables
The following random variables are defined and used extensively throughout the paper. Figure 1 presents an illustrative example with one or more realizations of these random variables for a station with two parallel servers:
IAT models the true (before-balk) IAT of entities (i.e., the actual external arrival process). In the presence of balking, the IAT distribution is generally unobservable and cannot be directly estimated from historical data (say, via goodness-of-fit tests). IAT is one of the random variables that we strive to estimate here.
BT represents the minimum queue length at which an entity balks without entering the queue. The BT distribution is generally unknown and unobservable, prohibiting direct estimation from data. BT is another random variable to be estimated here.
WT represents the maximum amount of time an entity is willing to wait in the queue before reneging without being served. WT may or may not be observable. If each individual entity’s entrance and reneging time is tallied separately, then WT distribution can be estimated directly from data, although in many cases, such data are not readily available and require additional data collection. However, if only the length of the queue is tracked, then WT is not specifiable from data. In this paper, we investigate both known and unknown WT cases.
Successful IAT (SIAT) represents the after-balk IAT of entities into the queueing system. Considering balks as failed arrivals, SIAT is the elapsed time between arrival of two consecutive entities that actually enter the queue (hence the choice of word successful). Note that one or more balks may occur between two successful arrivals (i.e., SIAT censors the true IAT) but this information is not available as balks are not observable.
Valid SIAT (VSIAT) is a special case of SIAT and represents the elapsed time between two consecutive successful arrivals into the system if and only if there is at least one server available after the first arrival so it is guaranteed that no balking occurred between the two arrivals. These are valid observations of the true IAT and can be used directly to estimate the actual external arrival process. The main issue with VSIAT is that for busy intervals that we are concerned with here, the arrival rate exceeds the processing rate and there will be too few or no VSIAT observations available as there is almost always a queue.
Effective IAT (EIAT) is another special case of SIAT that represents the elapsed time between two consecutive successful arrivals into the station if and only if there was no completion or reneging event after the first arrival, i.e., the number in queue (NIQ) does not change between the two successful arrivals (regardless of the occurrence of a balk). Therefore, these values represent the realized or effective arrival process for the corresponding NIQ value. Given a fixed IAT distribution, the EIAT distribution varies per NIQ since the entities balking decision depends on NIQ at the time of their arrival, hence we use the notation EIAT(NIQ) to indicate this dependency. It is important to note that EIAT(NIQ) is completely observable from queue length data, the time of successful arrivals, and service completion times, which are available or can be easily collected for most queueing systems. EIAT(NIQ) is a new random variable defined in this paper and will be used for simulation-based queueing inference as discussed in the following subsection.
PT models the service/processing time for the station with external arrival, which can be directly estimated from data.
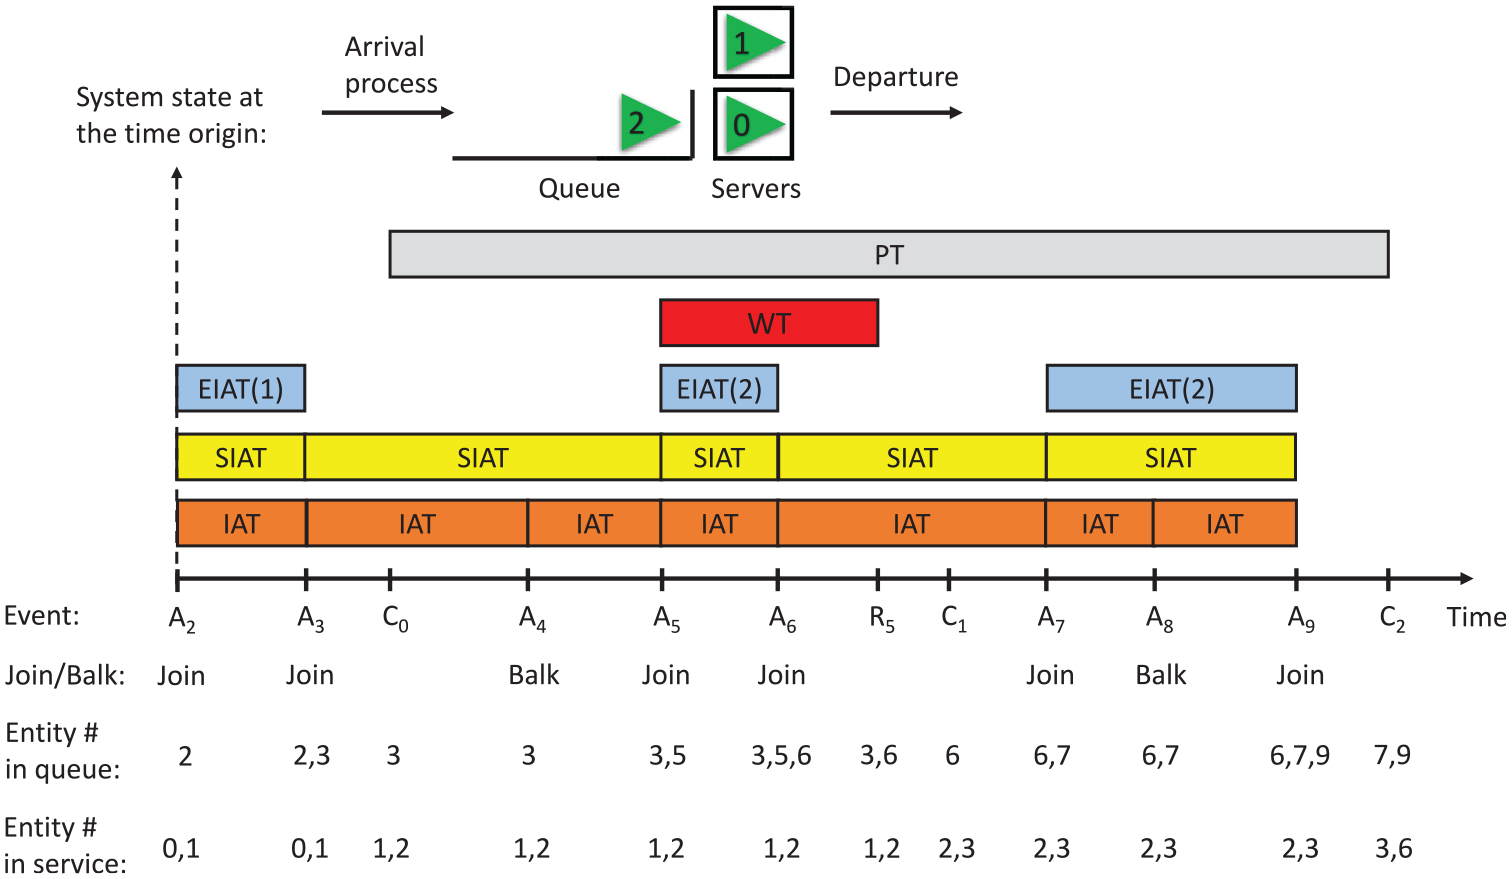
A sample scenario for a station with two parallel servers (c = 2, where c denotes the processing capacity). The time origin is shifted to the arrival of entity 2. The initial state is of the system is shown at the top of the figure. Ai, Ci, and Ri represent the arrival, completion of service, and reneging event for entity
3.2. Conceptual formulation of estimating arrival, balking, and reneging processes as an optimization problem
Consider a station with external arrivals in a queueing network of an arbitrary level of complexity. Entities’ BT and WT random variates have probability distributions
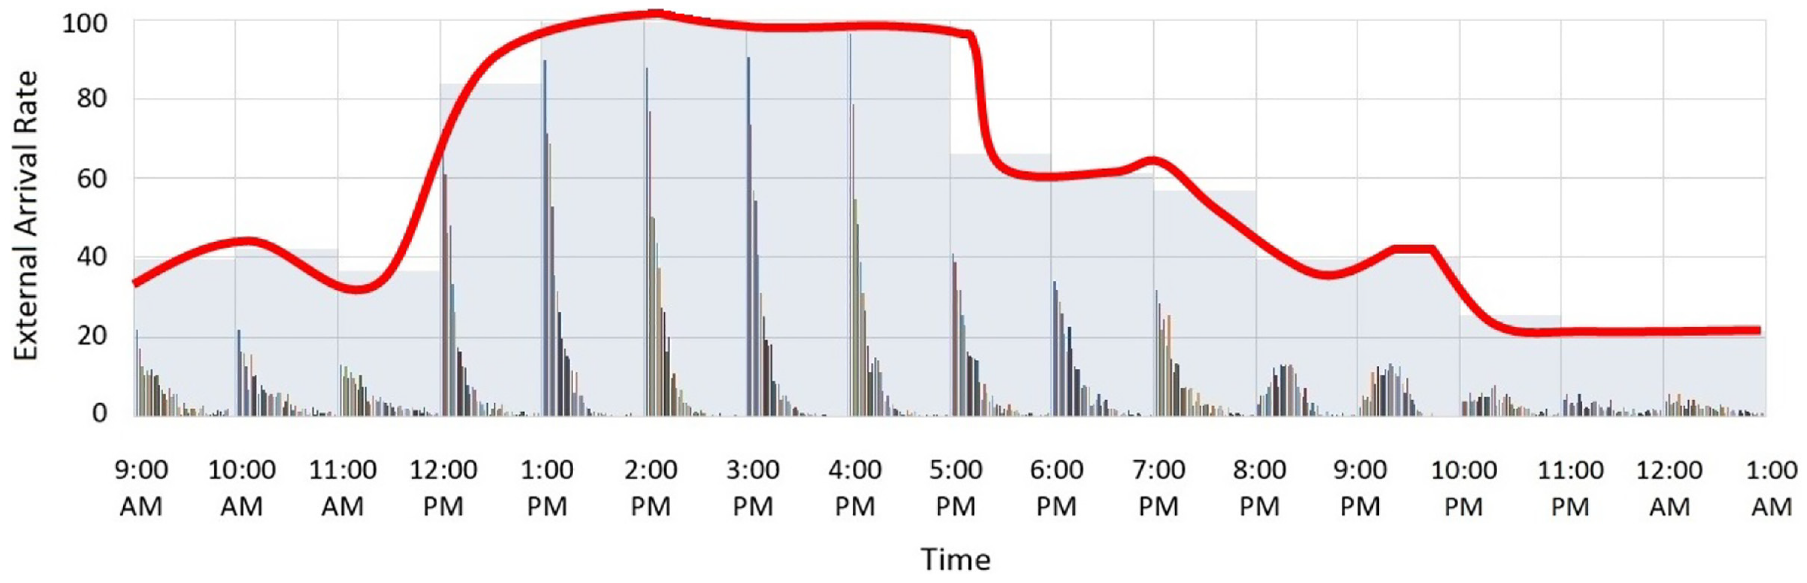
A piecewise-constant rate function with hourly intervals for approximating the underlying true nonstationary arrival rate represented by the continuous solid line. The HistoRIA tool 42 is used to generate the piecewise-constant rates as well as the histogram of inter-arrival times within each 1–hour block.
Let
Recall that IAT and BT sequences are not observable and that WT may or may not be specifiable depending on the data collection process used. EIAT(
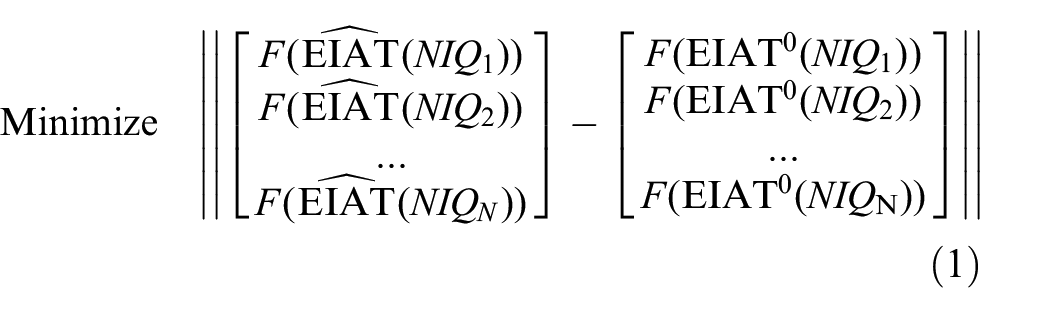
subject to:


where
Various measures can be used to evaluate the discrepancy between two empirical distributions, such as the difference between the means or variances. In this paper, for each
In constraint given by Equation (2),
3.3. The proposed simulation-based inference method
Figure 3 summarizes the general steps of the proposed iterative approach for solving the optimization model in section 3.2. In each iteration, a set of hypothesized distributions in solution spaces
In the first step, we extract EIAT(
Step 2 involves hypothesizing a set of distributions that can potentially be a good model for IAT, BT, and WT. Similar to general simulation input modeling, the goal is not to find the exact distribution family and/or parameters, but rather to find appropriate candidates that provide a reasonable fit. If available, VSIAT observations can be used to hypothesize the IAT distribution. If no or too few VSIAT can be extracted from the transactional data, then expert knowledge or physical justifications could be used (e.g., the exponential distribution is generally found to be a good model for IATs in many applications). Alternatively, data from less busy intervals or even SIAT observations corresponding to very small NIQ levels where balking is unlikely or less likely to occur (i.e., less censoring) can also be used for hypothesizing the distribution family. Hypothesizing distribution families and parameter estimation are well-established topics in the field of simulation input modeling and analysis, hence an extensive discussion on this step is avoided for the sake of conciseness.
Step 3 involves running
Step 4 involves comparing the simulated and observed EIAT(
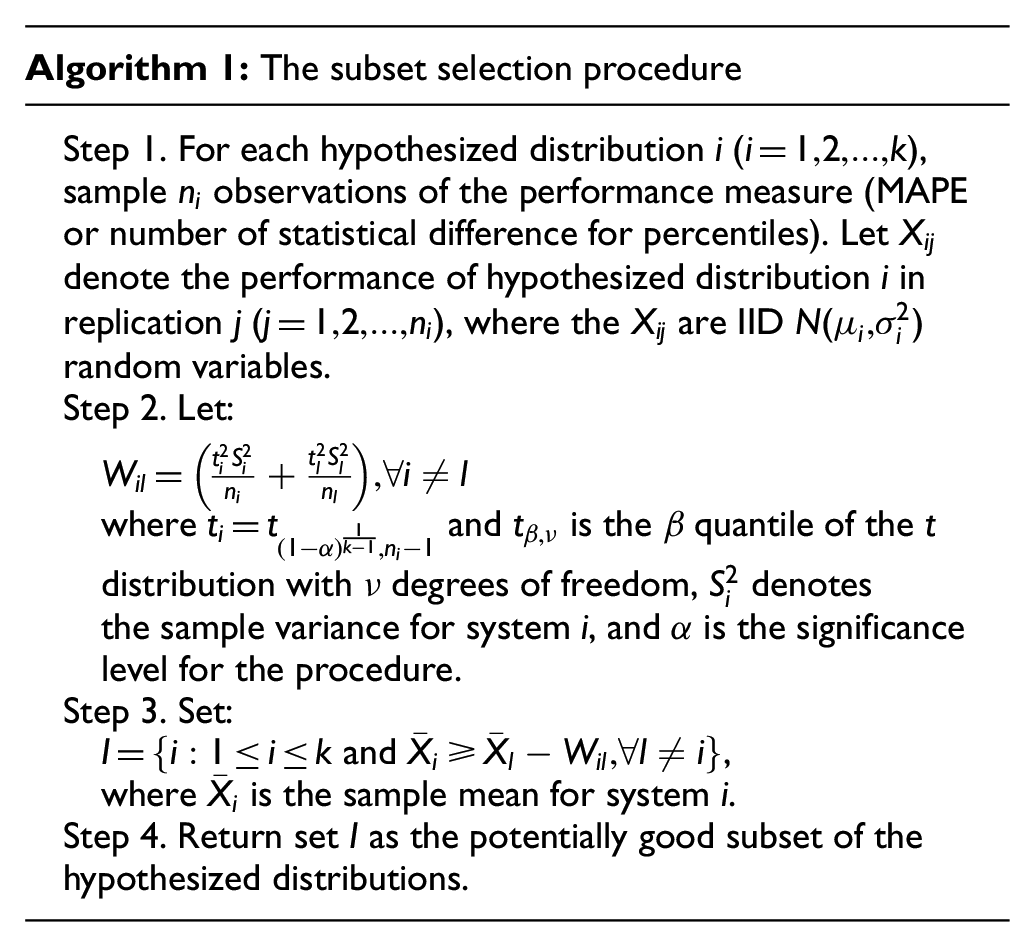
In step 5, a common subset selection procedure
46
is used to identify a subset of candidate scenarios that perform best (statistically) among the hypothesized scenarios with probability
Finally, in step 6, depending on the outcome and the desired level of accuracy, the list of hypothesized scenarios can be revised to be used in the next iteration of the proposed framework. This can enable convergence to an appropriate solution through an iterative process. The following section illustrates situations where such revisions/iterations may be needed.
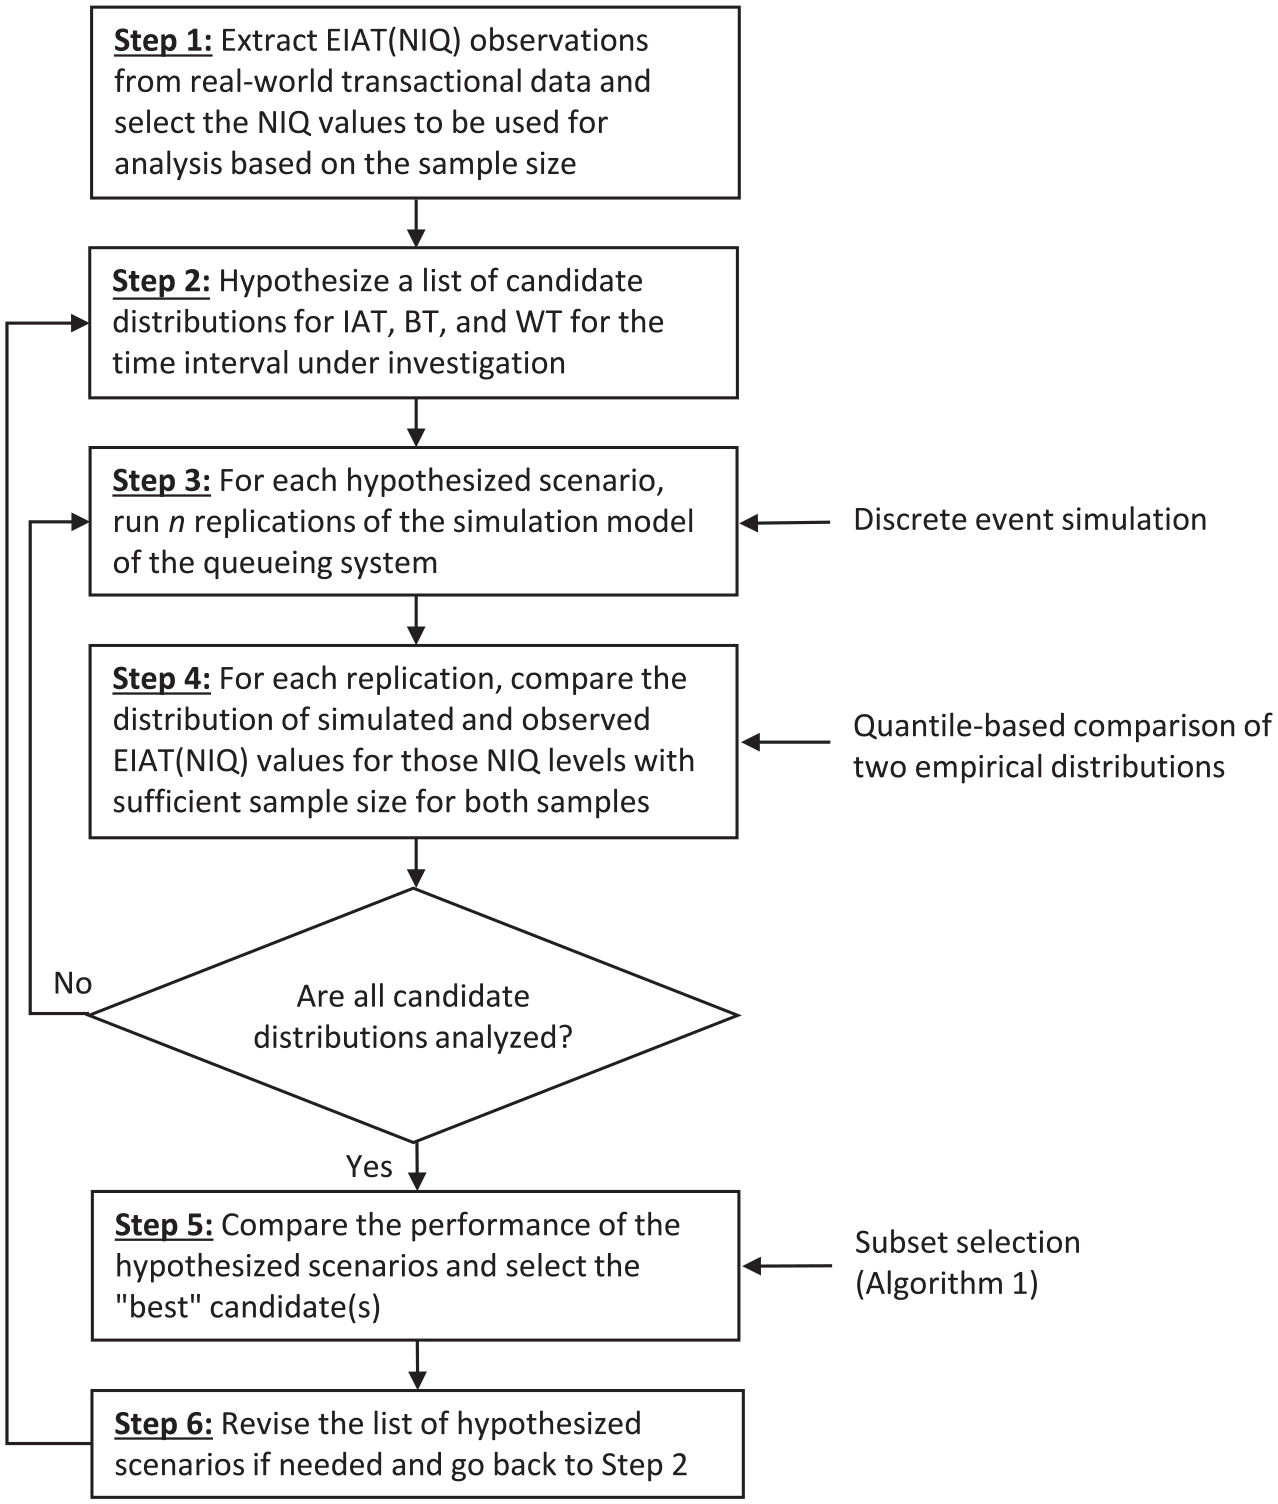
The proposed simulation-based queueing inference approach.
4. Illustration of the proposed method for a hypothetical queueing system
This section illustrates the applicability of the proposed solution method for solving the estimation problem for a hypothetical queueing network. In section 4.3, we use this queueing example to also illustrate the motivation behind the choice of the objective function in the optimization formulation presented in section 3.
4.1. The queueing network and discrete event simulation model
We consider the queueing network in Figure 4 for the computational experiments discussed here and in section 5. Entities balk if the size of queue at Server 1 is greater than their BT, and renege once their WT is exceeded. It is important to note that this queueing network resembles a fairly complex queueing situation that is beyond analytical tractability since the successful after-balk arrival into the first station depends on not only the balking and reneging behavior of entities, but also on the effect of finite queue at Server 2 that causes blocking at the first station (i.e., when the queue of Server 2 is full, Server 1 is blocked as it cannot pass on the processed entity to Server 2 hence cannot start processing a new entity). This blocking effect itself is a function of non-exponential service times, the rework process, and a combination of probabilistic and conditional routing in subsequent stations. Because of these complexities, the logic
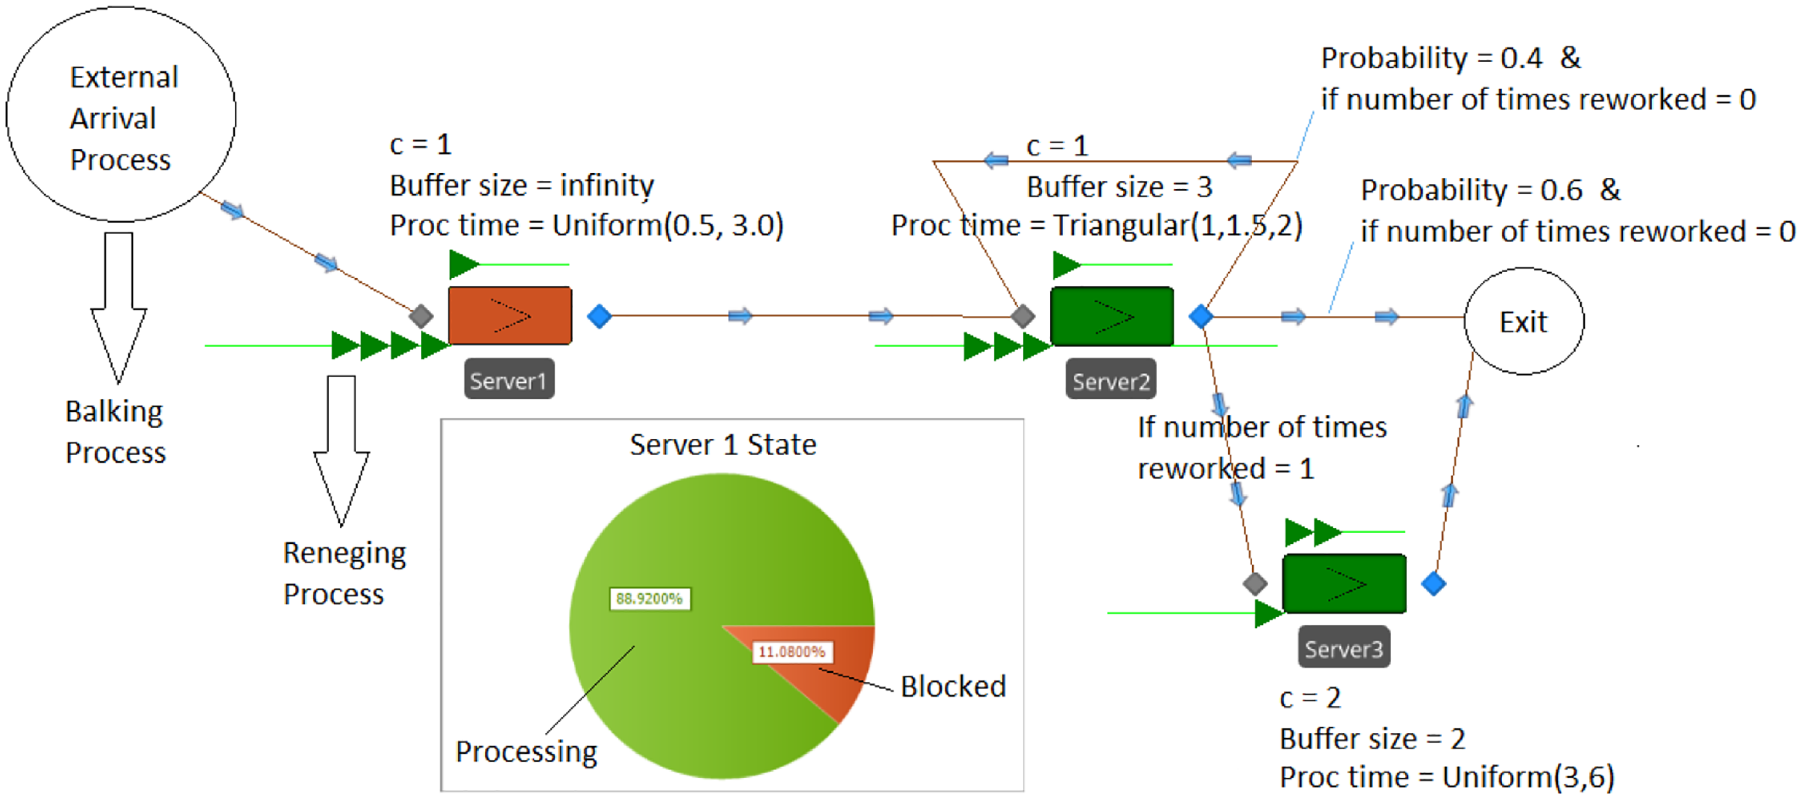
The queueing network. Queue priority rules are all FIFO and processing times are in minutes. FIFO: first-in-first-out.
Recall from section 3.2 that the nonstationary external arrival process is modeled by a piecewise-constant rate function and our goal is to make estimations for a particular busy interval. Each simulation run/replication corresponds to the operation of the system in multiple realizations of the time interval of interest. Initial conditions for each realization of the interval are random according to the historical data. To have control over the sample size for simulated data, the run terminates when
4.2. Solving the inference problem for the queueing network
Here, we show how the proposed approach can be used to solve the inference problem for the queueing network in Figure 4 for the case of known and unknown WT distribution.
4.2.1. Known reneging, unknown arrival, and balking processes
If the transactional data track each individual entity that joins the queue, then the reneging behavior (i.e., WT distribution) can be directly estimated from data, and the problem reduces to estimating the true arrival process and balking behavior. For the above queueing network, suppose WT ~ triangular(6 min, 9 min, 15 min) and can be estimated from data, and that the true unknown arrival and balking processes are IAT ~ exponential(1.3 min) and BT ~ triangular(3,6,9), respectively. BT is a discrete random variable as it depends on NIQ and a continuous triangular distribution is only used to simplify its representation. The continuous triangular(3,6,9) corresponds to the following discrete probability distribution:
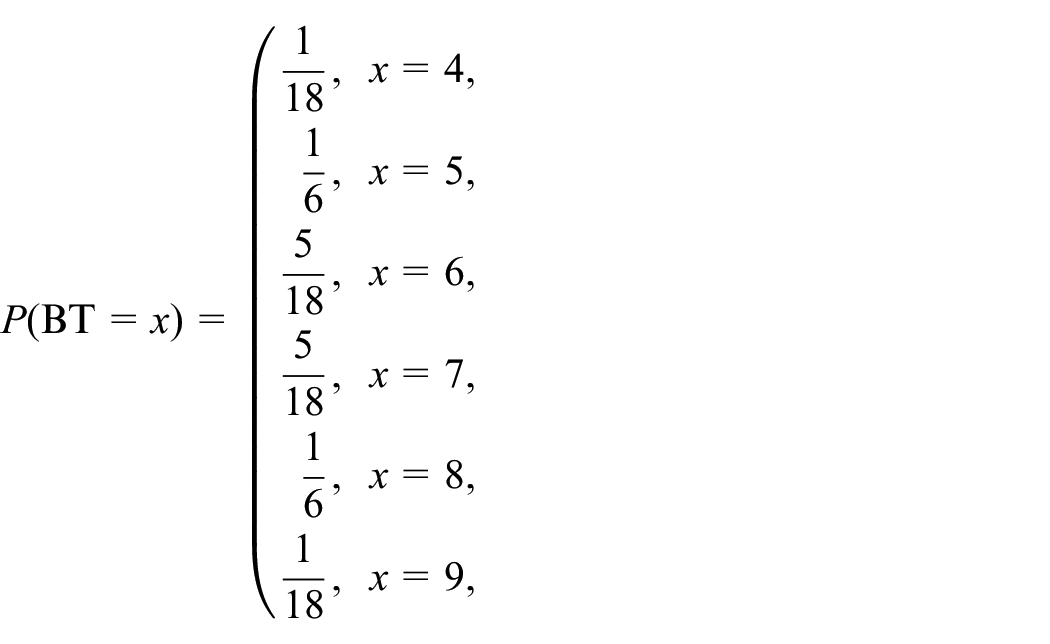
where
Hypothesized and recommended scenarios for two iterations of the proposed method for the case of known WT. The highlighted cells represent the best performing candidate solutions.
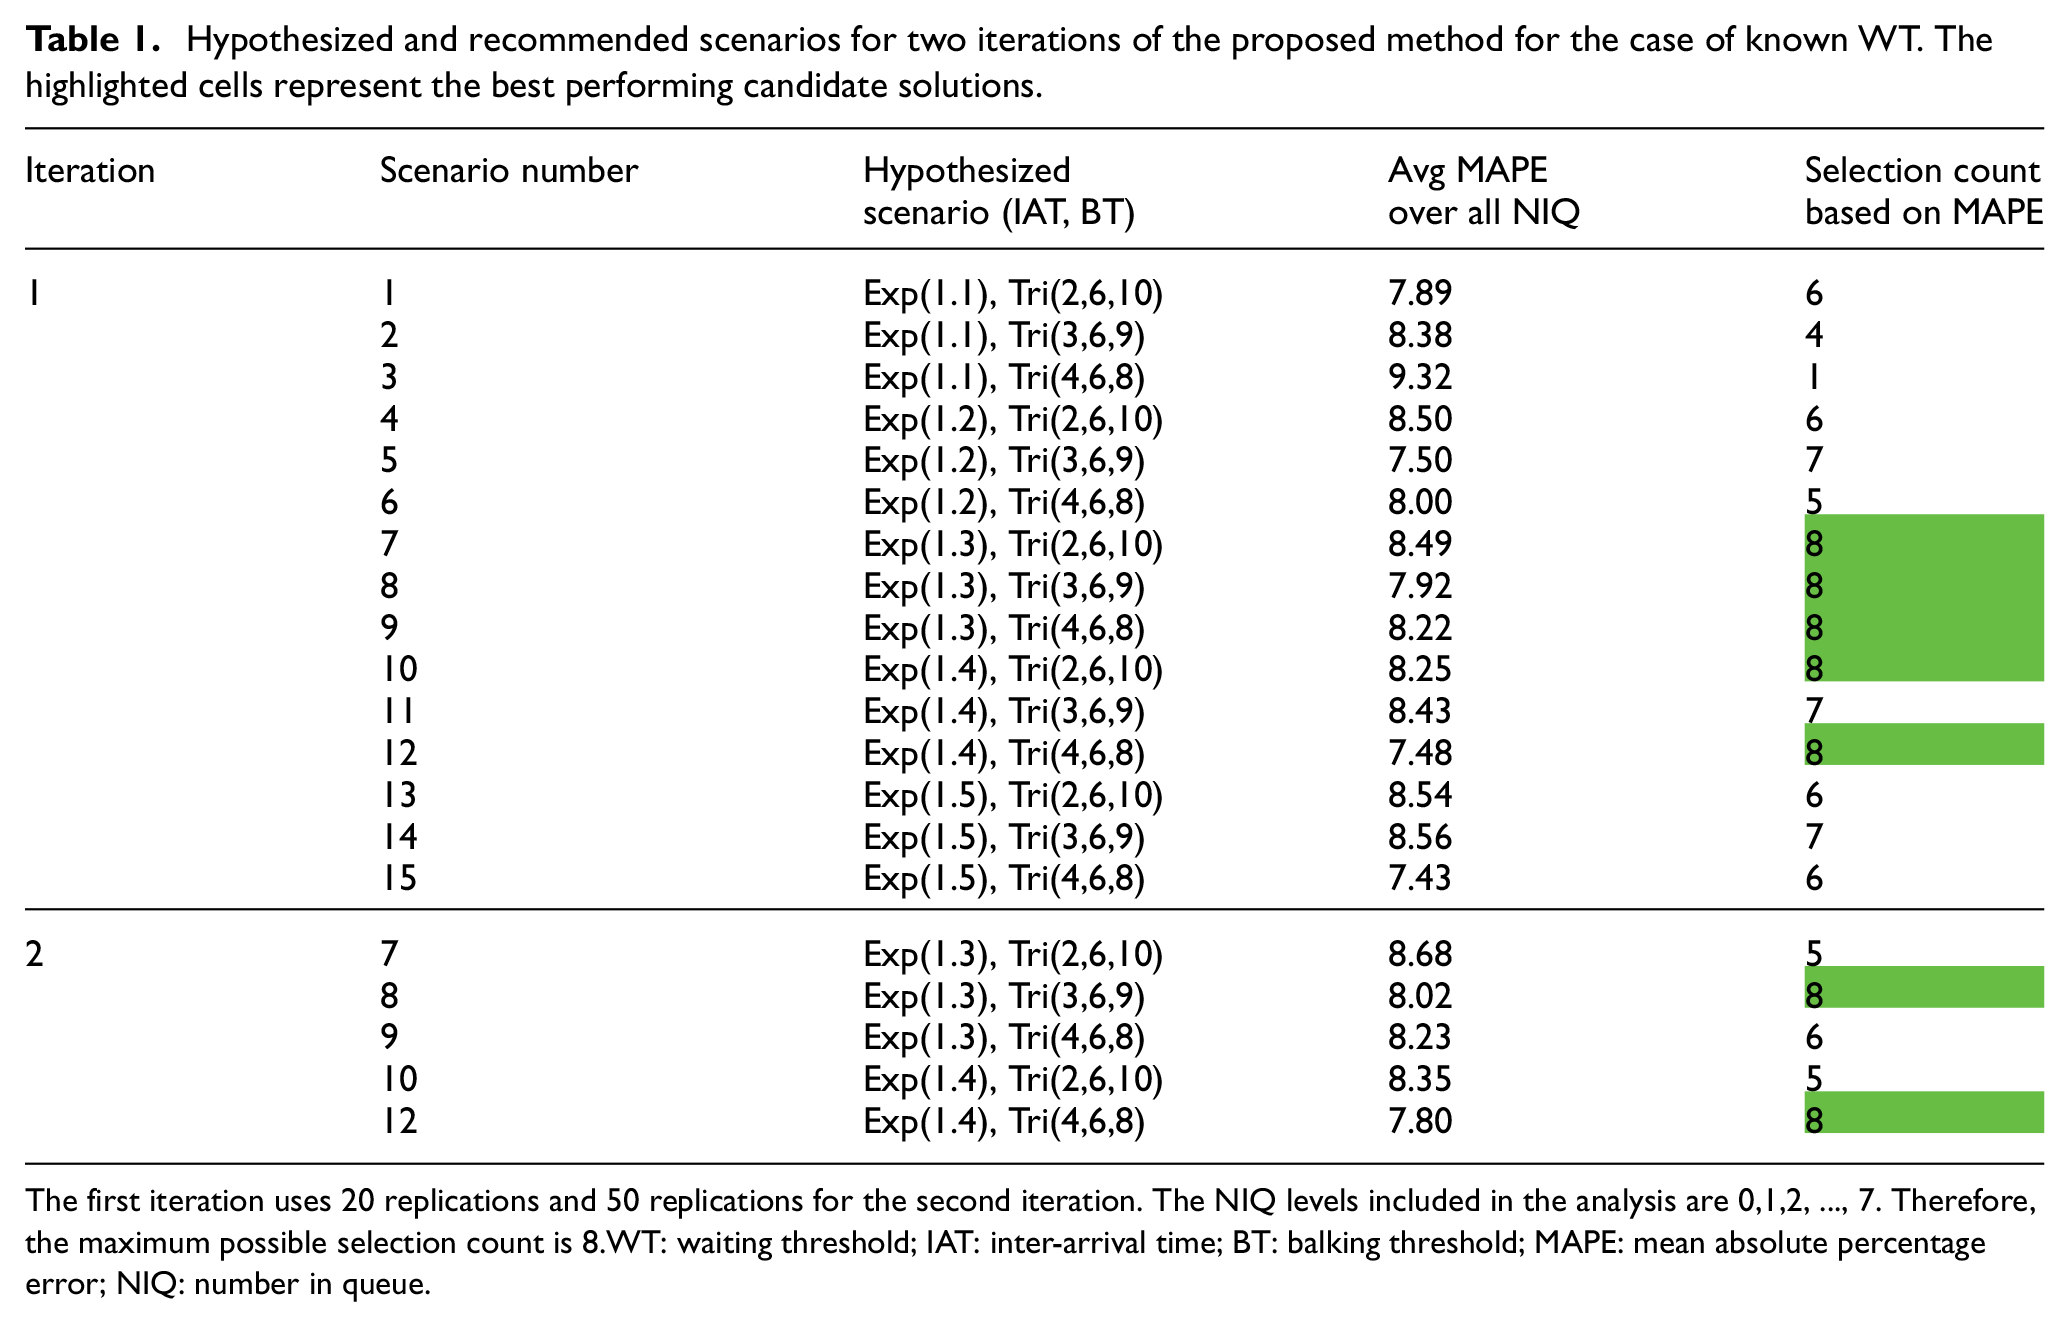
The first iteration uses 20 replications and 50 replications for the second iteration. The NIQ levels included in the analysis are 0,1,2, …, 7. Therefore, the maximum possible selection count is 8. WT: waiting threshold; IAT: inter-arrival time; BT: balking threshold; MAPE: mean absolute percentage error; NIQ: number in queue.
The percentiles of the observed and simulated samples will be compared in step 4 to obtain 20 observations of the performance (i.e., MAPE) of each scenario under every
In the second iteration, we increase the number of replications to 50 and only focus on the five scenarios recommended in iteration 1, hoping that this would further narrow down the list of recommended scenarios. We observe that the recommendation now contains only two scenarios and includes the correct estimate (scenario 8). One could perform another iteration with higher number of replications or sample size to select the best scenario among the two recommended scenarios in iteration 2. We assess the effect of these parameters in section 5.
4.2.2. Unknown reneging, arrival, and balking processes
If the transactional data only provide the queue lengths without tracking individual entities, then WT cannot be estimated from data and needs to be inferred along with IAT and BT distributions. In this case, step 2 of the method involves hypothesizing all three distributions. We use the same configuration for the true (unknown) distributions and follow a similar general design for the experiments. The hypothesized and recommended scenarios for the first iteration are summarized in Table 2. In the second iteration, we narrow down the list of candidates from 45 to the 12 recommended scenarios from iteration 1 and increase the number of simulation replications from 20 to 50. Table 3 provides the results for iteration 2. Once again, the correct estimate (scenario 23) is among the two candidates recommended after two iterations.
Hypothesized and recommended scenarios in iteration 1 for the case of unknown WT. The highlighted cells represent the best performing candidate solutions.
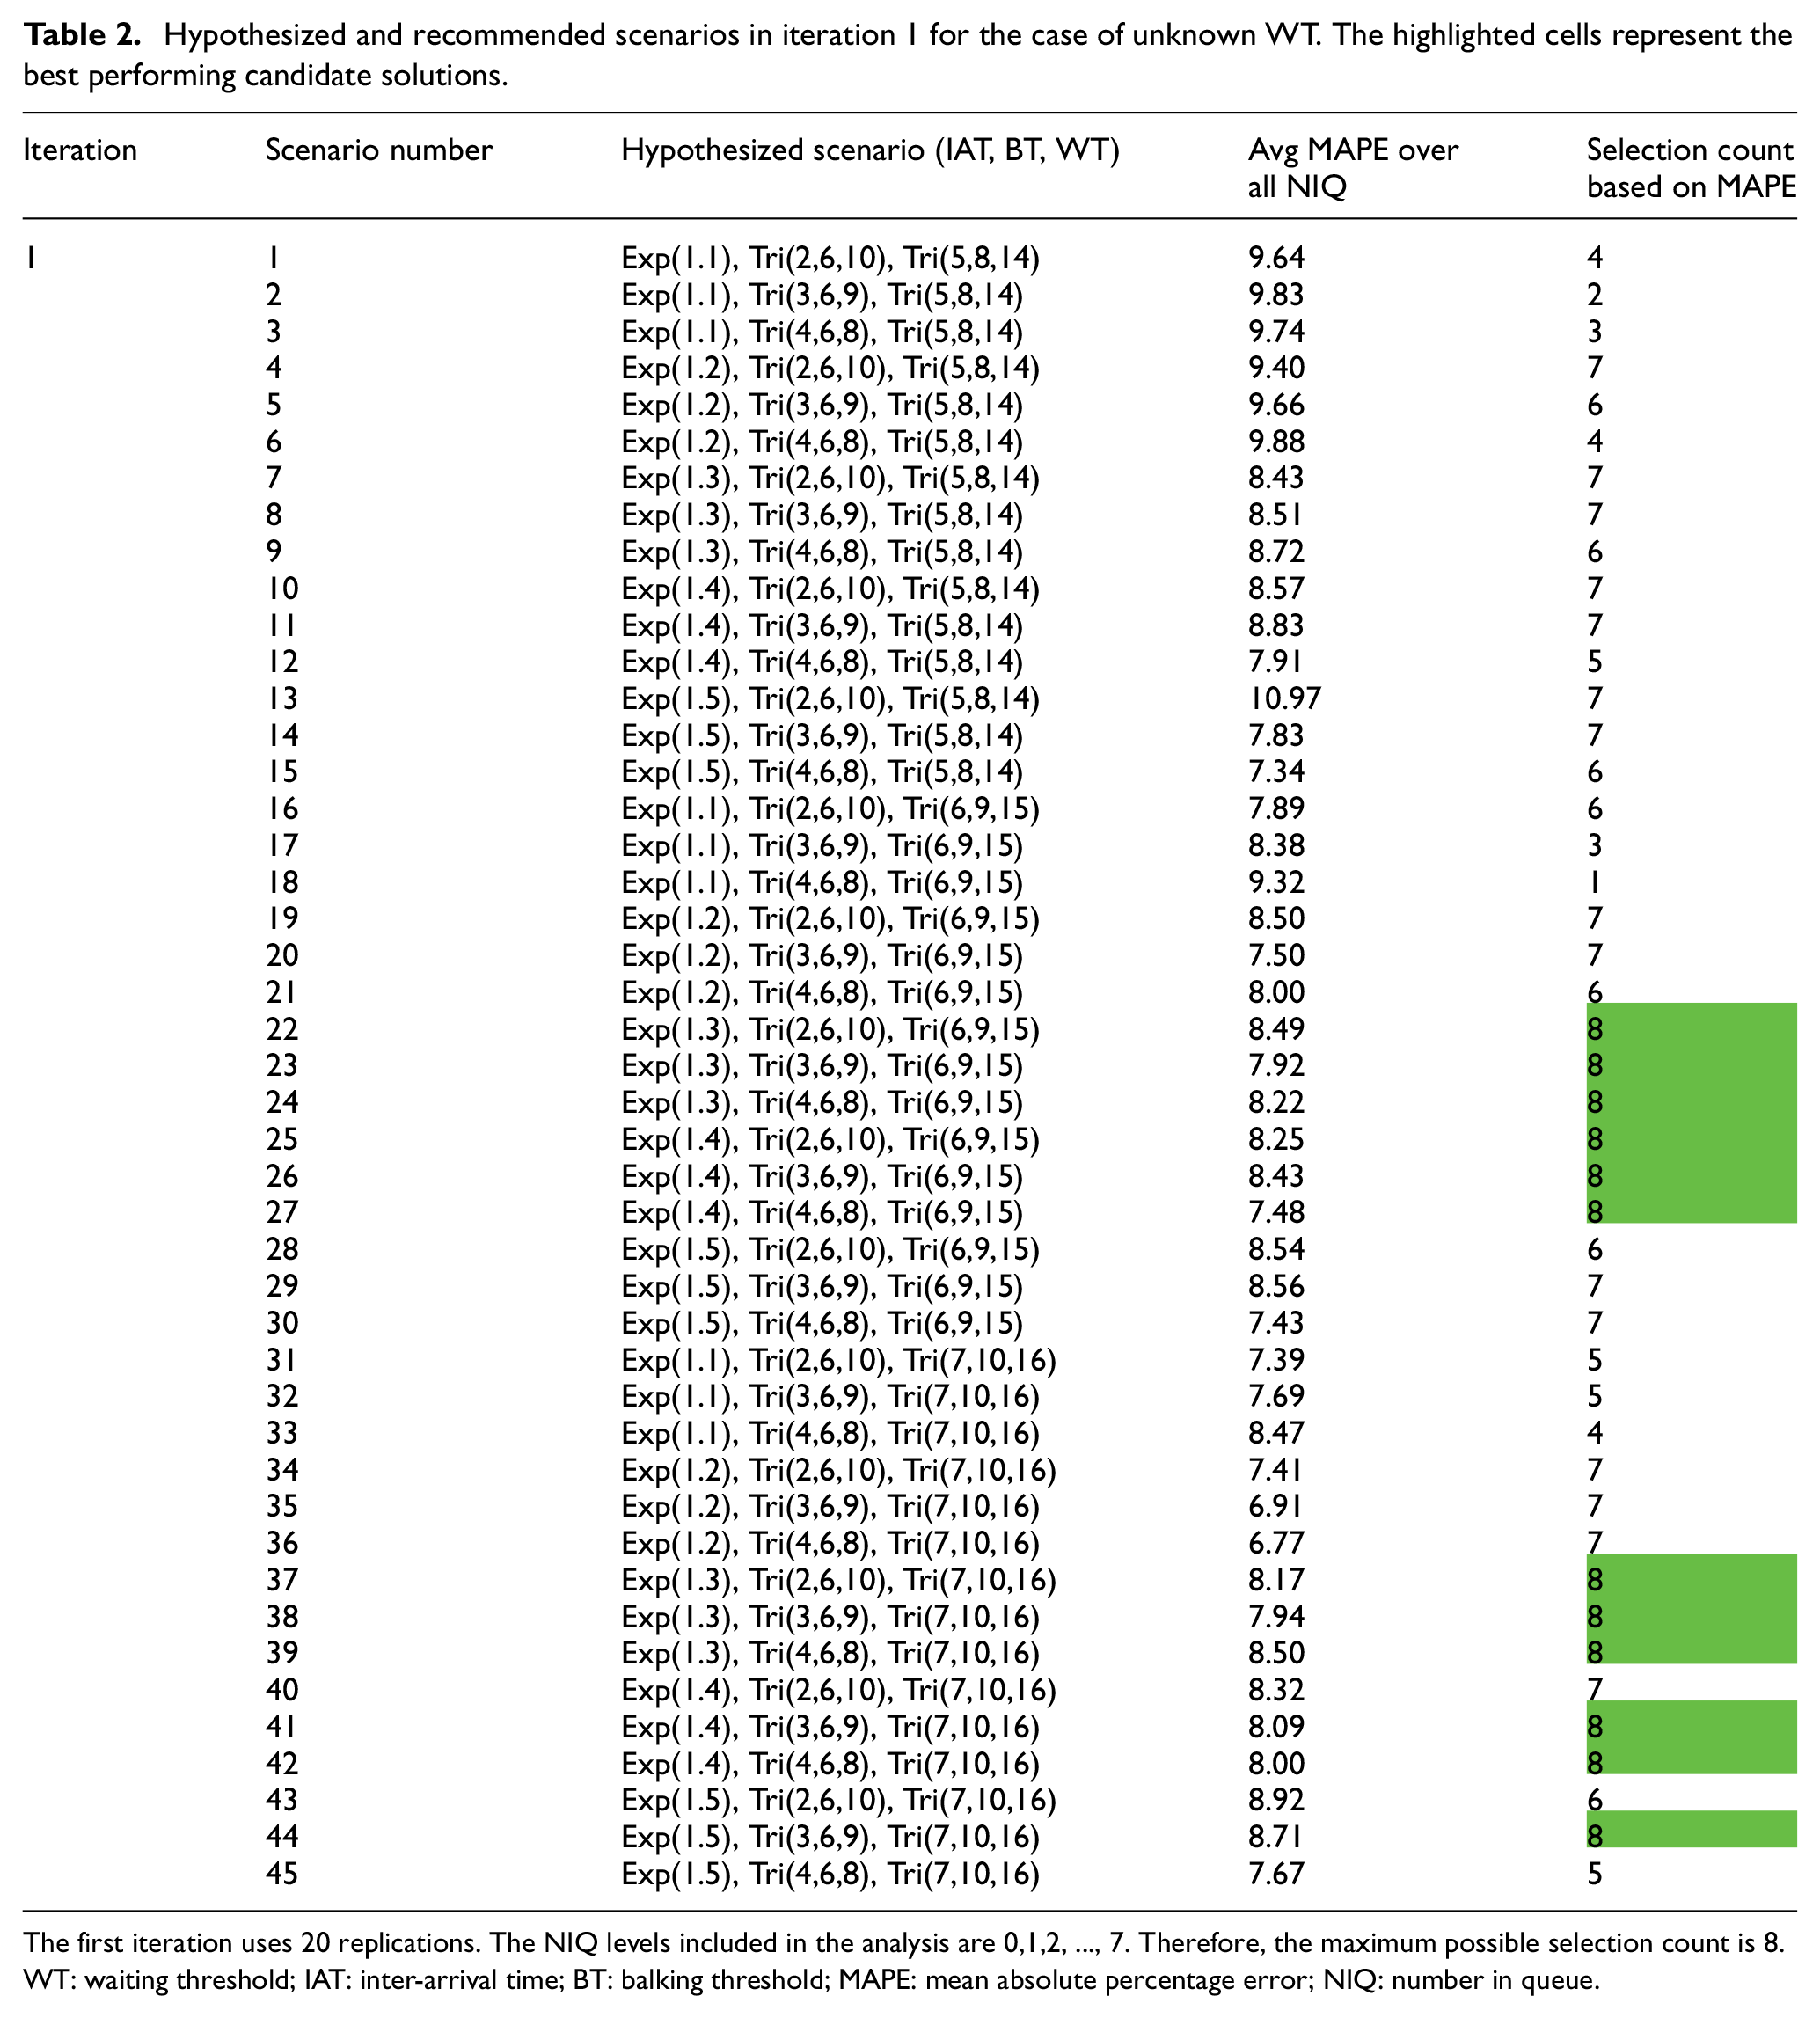
The first iteration uses 20 replications. The NIQ levels included in the analysis are 0,1,2, …, 7. Therefore, the maximum possible selection count is 8. WT: waiting threshold; IAT: inter-arrival time; BT: balking threshold; MAPE: mean absolute percentage error; NIQ: number in queue.
Hypothesized and recommended scenarios in iteration 2 for the case of unknown WT. The highlighted cells represent the best performing candidate solutions.
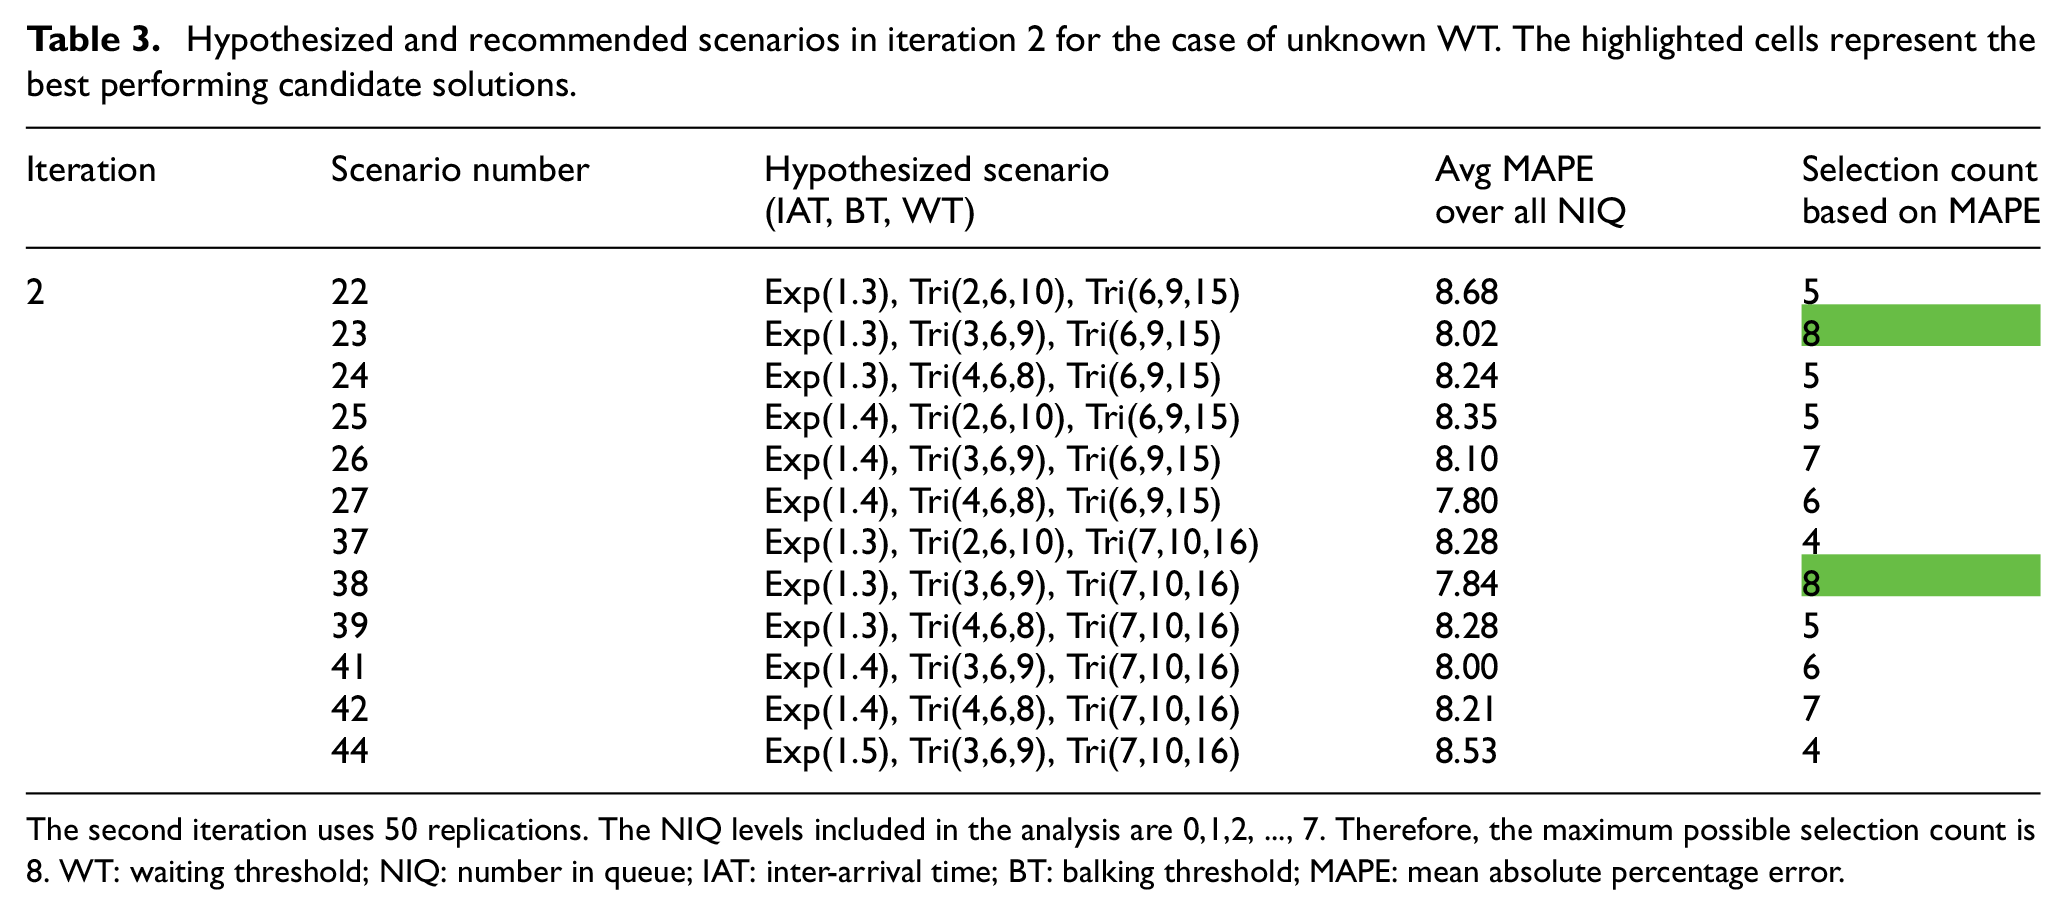
The second iteration uses 50 replications. The NIQ levels included in the analysis are 0,1,2, …, 7. Therefore, the maximum possible selection count is 8. WT: waiting threshold; NIQ: number in queue; IAT: inter-arrival time; BT: balking threshold; MAPE: mean absolute percentage error.
4.3. Motivation behind using
The effective arrival process depends on and is a function of NIQ since entities decide to balk based on NIQ at the time of arrival. More specifically, both the frequency (sample size) and distribution of EIAT observations vary for different NIQ values. Since we compare quantiles of the simulated and observed samples, we only consider those NIQ levels for which a sufficiently large sample size is available to enable estimating some of the extreme quantiles such as 0.10 and 0.90. In the above examples, we excluded NIQ = 8 from the analysis due to its small sample size (
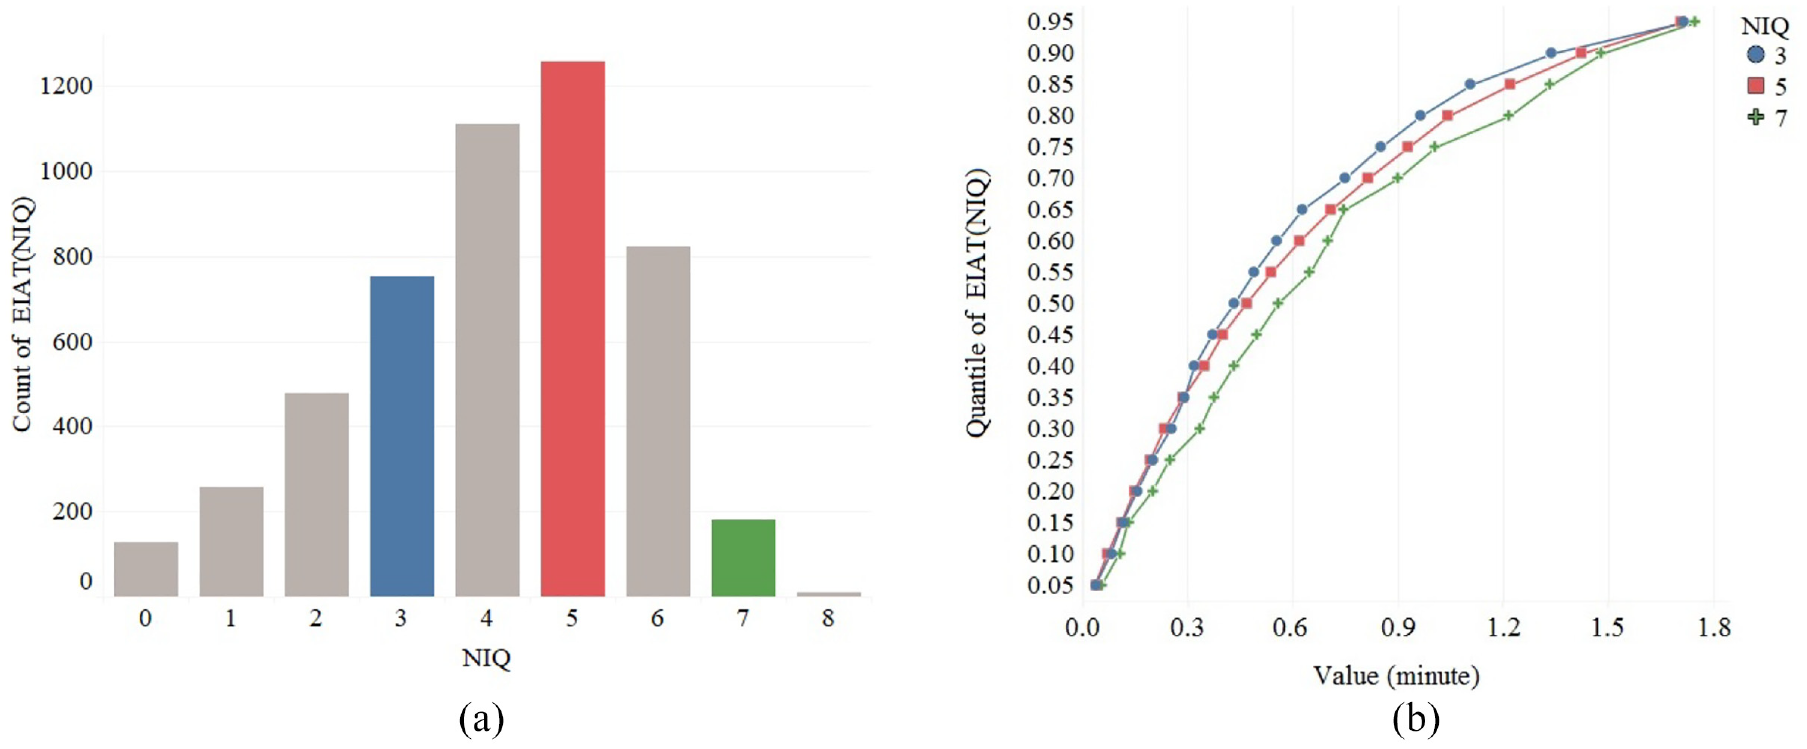
Frequency and distribution of EIAT observations for different NIQ values based on a total of 5000 EIAT observations collected from the queueing network in Figure 4. (a) Count (sample size) of EIAT observations for different NIQ values. (b) Cumulative probability function of EIAT observations for NIQ = 3, 5, and 7.
Figure 5(b) shows how the distribution of EIAT varies per NIQ level. An appropriate model for the true unknown IAT, BT, and WT distributions is one that results in similar dynamics for all NIQ levels not just some of them. Therefore, we need to perform comparisons under all NIQ values with a sufficiently large sample size. To further illustrate this point, consider Figure 6 that shows the cumulative distribution function for a triangular and uniform BT. Given an external arrival process, the two scenarios would result in statistically similar effective arrival processes for
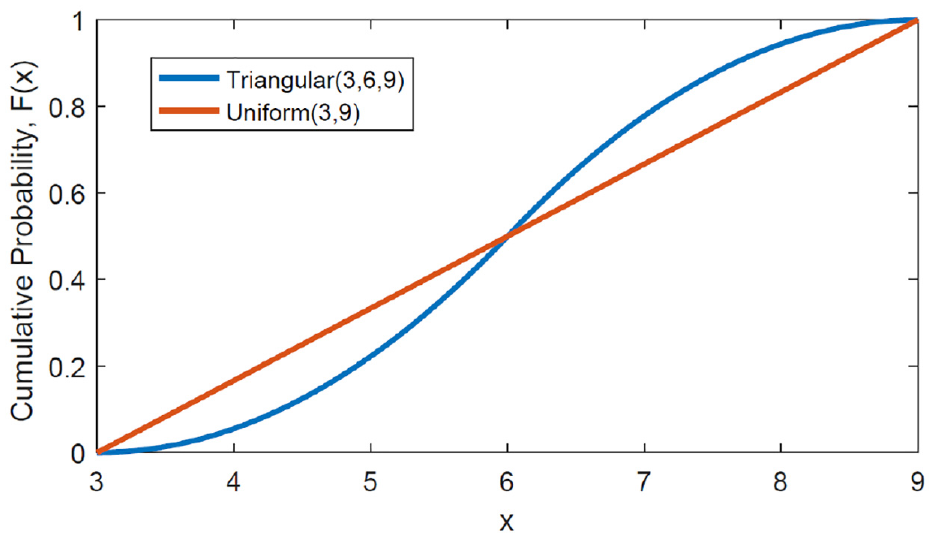
The cumulative distribution function for a triangular and uniform balking threshold.
5. Computational experiments and results
The above results suggest that, given a sufficient sample size and number of simulation replications, the proposed method has the statistical power to detect the correct scenario if it is among the hypothesized candidates. In this section, we perform additional experiments with the same queueing network to further investigate how the estimated performance for the correct scenario changes with number of replications (
Design and parameter choices for simulation experiments.
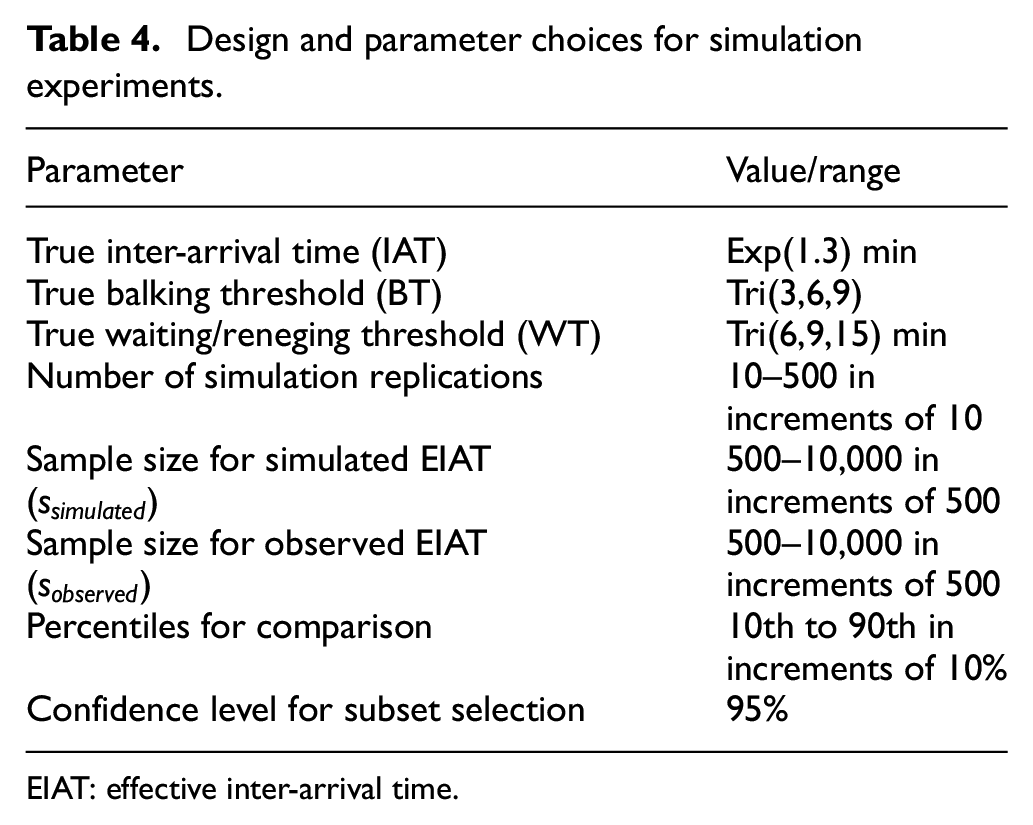
EIAT: effective inter-arrival time.
5.1. The effect of the number of simulation replications (
)
In both cases solved in section 4, we increased the number of replications in the second iteration of the proposed method to obtain higher statistical power. Figure 7 shows the effect of number of simulation replications on the performance of the correct scenario. We observe that while running additional replications has virtually no effect on the average MAPE over all NIQ values, it significantly decreases the standard error for the overall MAPE
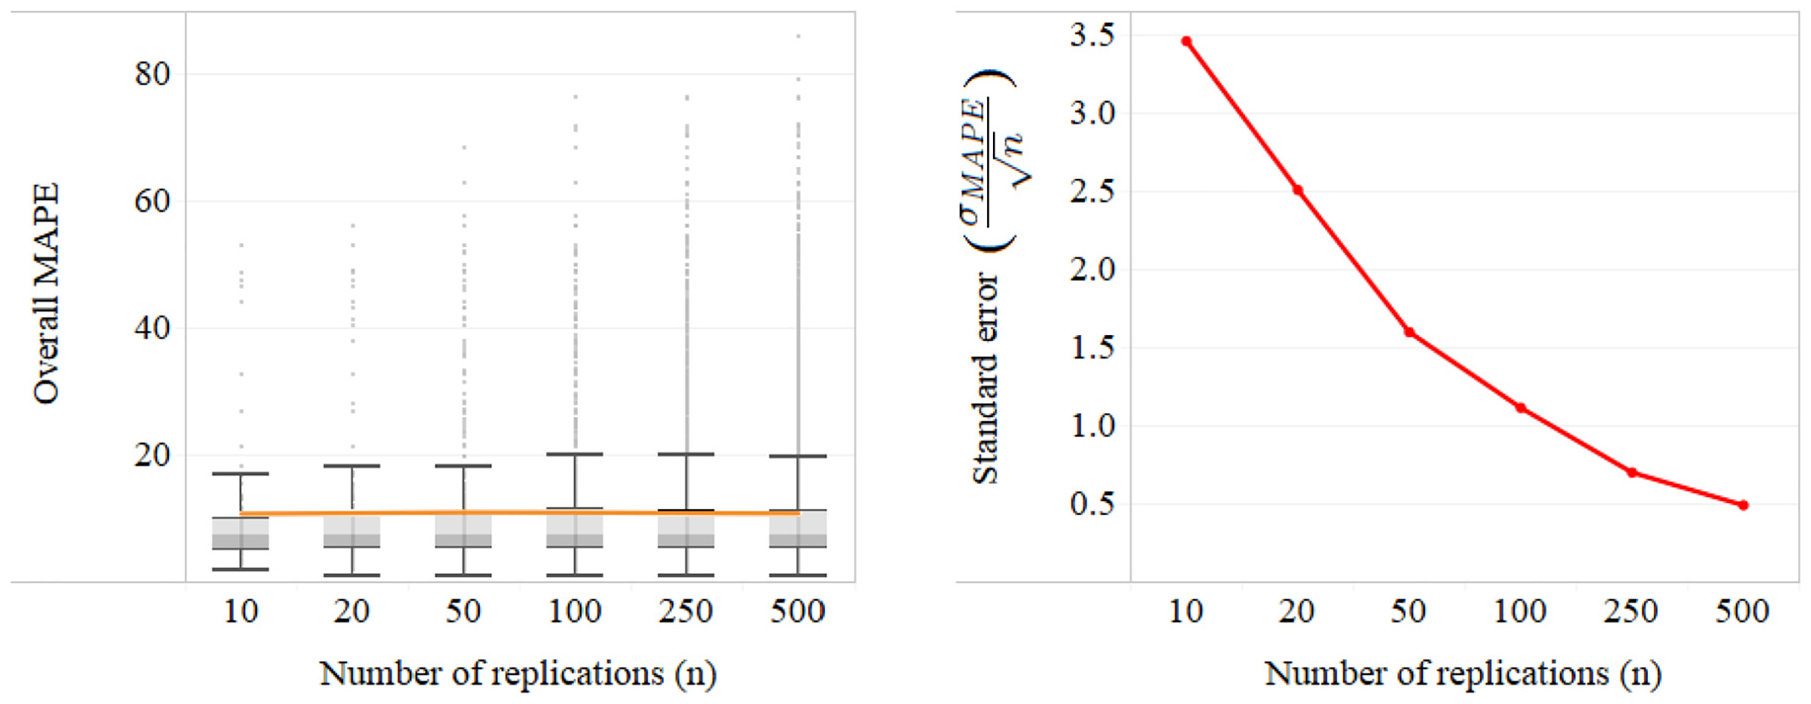
The effect of number of simulation replications on the estimate of the performance of the correct scenario. We use
5.2. The effect of sample size for the simulated EIAT values (
)
For the examples in section 4, in the second iteration, the proposed method, one could also increase the size of the simulated EIAT sample (
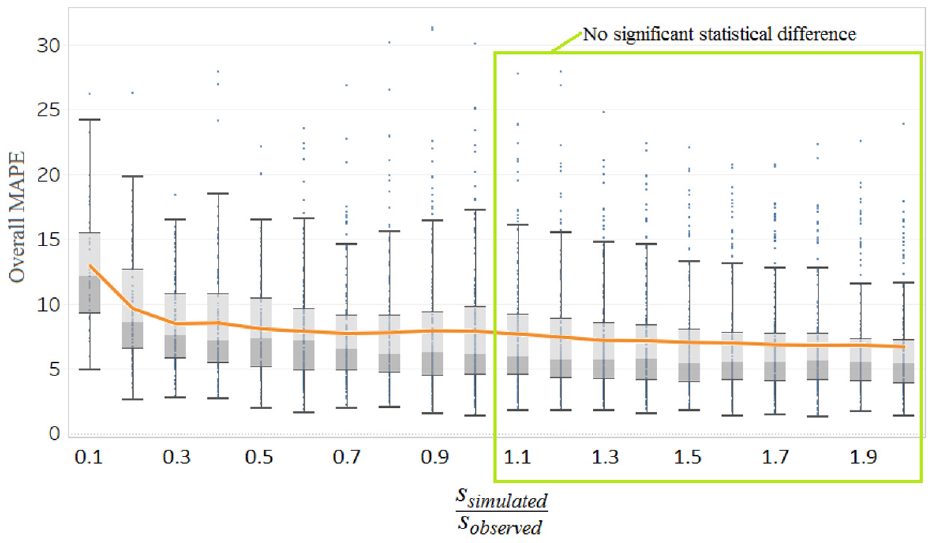
Average MAPE over all NIQ values for the correct scenario as a function of
5.3. The effect of sample size for the observed real-world EIAT values
Unlike number of replications and
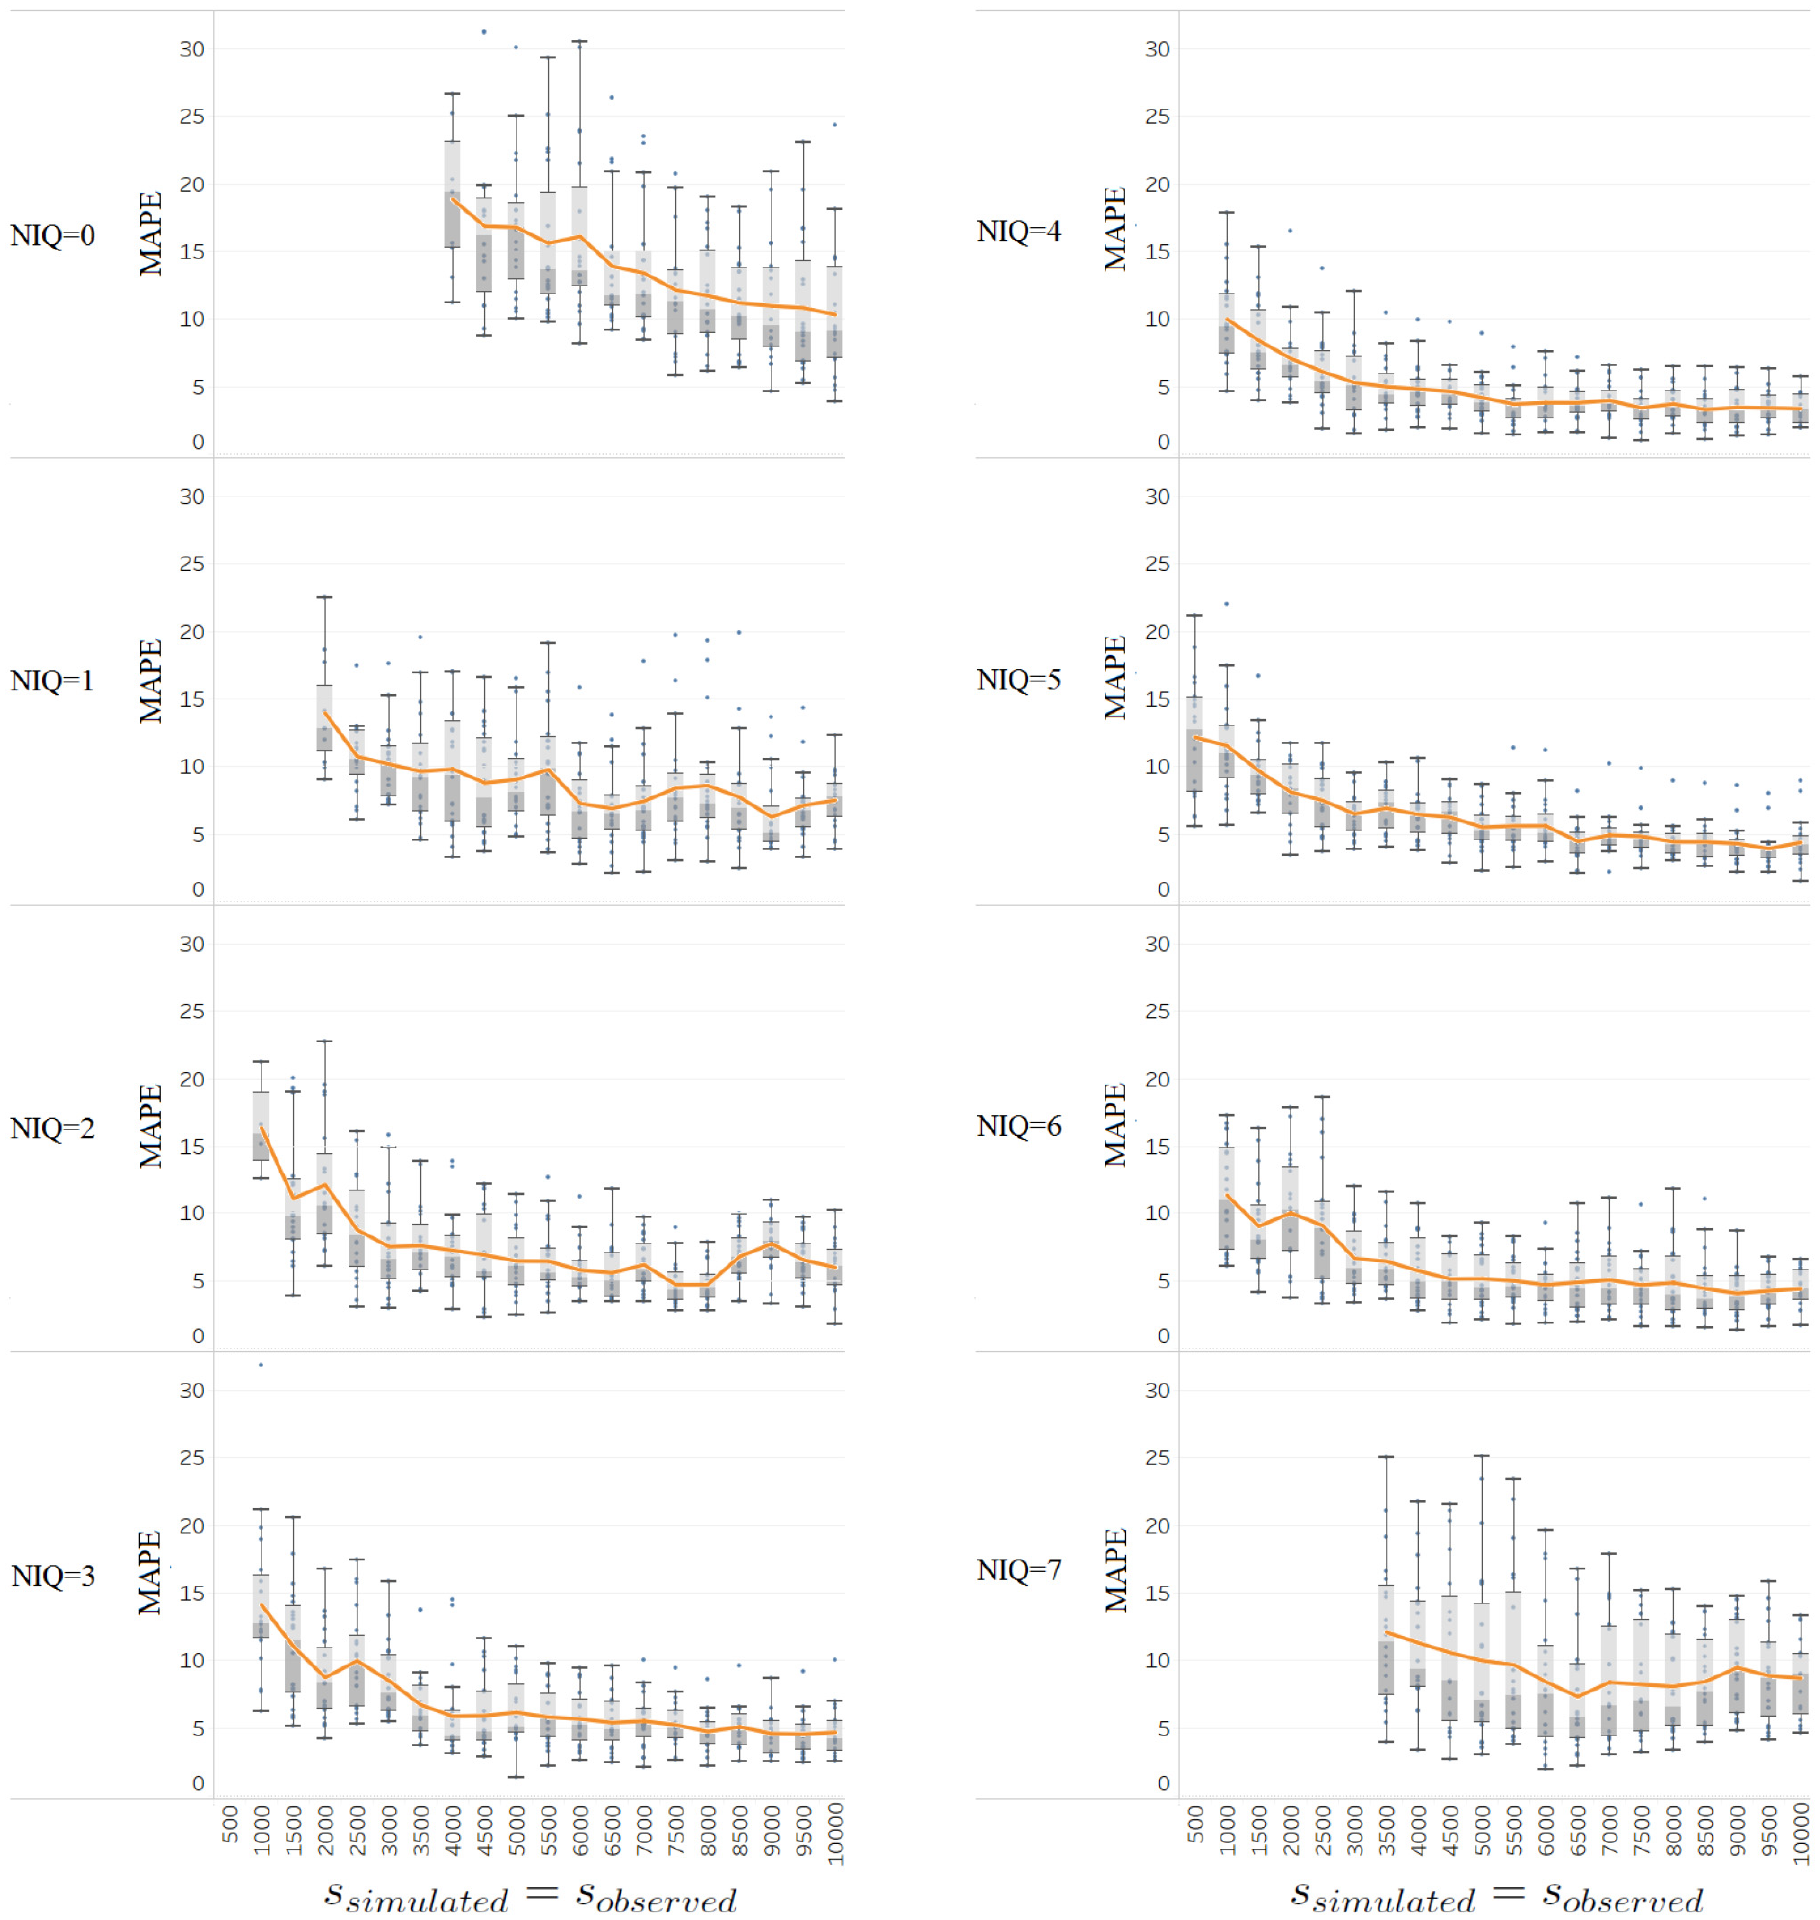
MAPE under each NIQ value for the correct scenario as a function of sample size when
For all NIQ, both variability and the average MAPE decrease with larger sample size (which is expected). For extreme NIQ values (in this case 0 and 7), since the probability of the system being in these states is relatively small, the sample size for both the observed and simulated EIAT(
6. Real-world application and validation: a call center
A call center is a special case since the true arrival, balking, and reneging processes are observable. Here, we use real-world transactional data from a call center of a bank to validate the efficacy of the proposed approach. The data are available at http://iew3.technion.ac.il/serveng/callcenterdata/ and include about 1,200,000 calls over a period of 1 year.
Figure 10 shows the basic operation of the call center. Calls first go through the automated voice response unit (VRU), where customers receive recorded information, e.g., store locations/hours and account balances. There are 65 VRU lines and busy signals (lost demand) at this stage are extremely rare. Roughly 65% of customers complete their service via the VRU and leave the system. The remaining 35% request to speak with a human operator and service begins immediately if an operator is available. Otherwise, customers join a queue and are served on a first-in-first-out basis based on their arrival time at the queue. Waiting customers periodically receive information about their position in the queue and the amount of time that the first person in line has been waiting. The announcement repeats every 60 s, with music, news, and commercials in between.
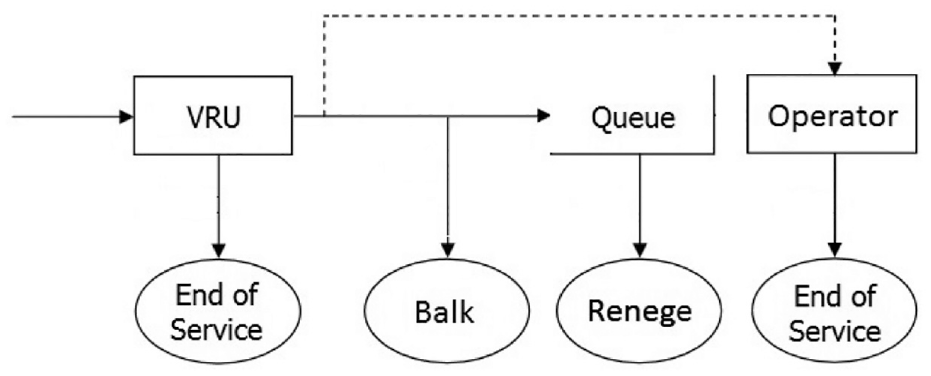
The process flow for the call center under study.
In our analysis, we treat the input process into the operator queue as the external arrival process, that is, the customers that request to speak to an operator after exiting the VRU. The data provide the time stamps associated with all possible events. For every call, we have the time of arrival at the queue or start of service (if there is no queue), the time exiting the queue, and the manner in which it exited the queue (started service or abandoned), and if served, the starting and ending time of service. There were several operational changes during that year, all occurring before November. Therefore, for consistency purposes, we only focus on non-holiday weekdays in November and December during the morning peak hours from 09:00 to 11:00 h.
We consider abandonments with a waiting time of 15 s or less as balks, representing two groups of customers: (1) those that are not willing to wait at all and balk right away after hearing “please wait” and realizing that they need to join a queue (which takes a few seconds), and (2) those that may be willing to wait but decide to balk once they are notified about their position in the queue because it exceeds their perceived BT. This assumption is consistent with many other studies that also used this dataset
47
and references therein. In the intervals under consideration, there were a total of 13,468 arrivals (calls needing operator assistance) from which 2625 balked. Therefore, the demand estimate based on censored data from successful arrivals would underestimate the true demand rate by
The true IAT, BT, and WT can be estimated from the data. The IAT is found to be exponentially distributed with mean 0.389 min, the WT is estimated to be exponential with a mean of 1.744 min, and the BT is estimated to follow triangular(0,12,24). The details of data analysis and goodness-of-fit tests are omitted for brevity. The reader is referred to any general discussion on simulation input analysis and distribution fitting, 32 and to detailed statistical analysis of this call center’s dataset available in the literature. 47
In this analysis, we consider the case of known reneging and use the proposed method to estimate the true IAT and BT distributions (assumed to be unknown). There were eight agents available during the intervals under study, hence we use a simulation model of a server with eight parallel processing stations, where customers balk based on the observed NIQ at the time of arrival and renege once their WT is exceeded. We set
Hypothesized and recommended scenarios for the real-world call center application. The highlighted cells represent the best performing candidate solutions.
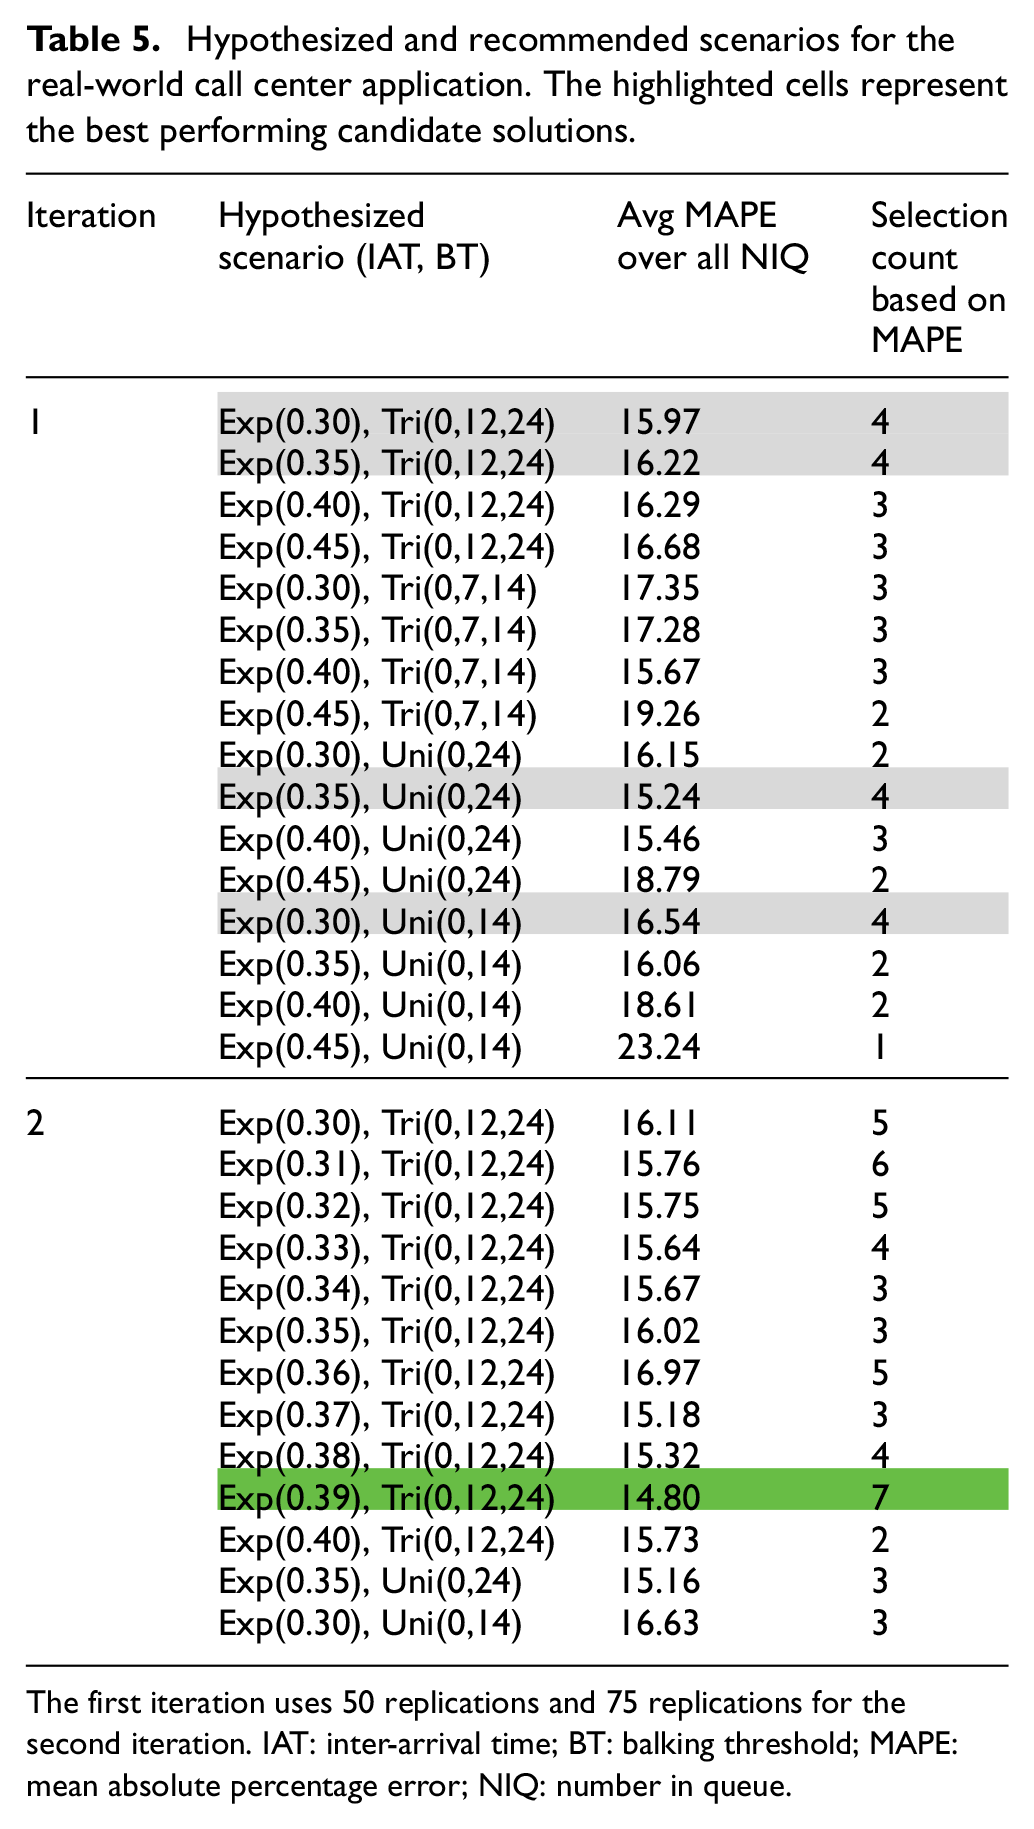
The first iteration uses 50 replications and 75 replications for the second iteration. IAT: inter-arrival time; BT: balking threshold; MAPE: mean absolute percentage error; NIQ: number in queue.
7. Conclusion
The paper formulates the estimation of the true arrival, balking, and reneging processes in a queueing system as an optimization model and proposes an iterative simulation-based inference approach integrating quantile-based measures and subset selection to detect appropriate probability distributions for modeling these processes. The method is applicable in any complex queueing situation as long as it can be simulated, and for the case of known and unknown reneging distribution. Extensive simulation experiments are used to develop general guidelines for specifying the parameters of the proposed approach, namely sample size and number of replications, given limited computational resources/time. The method is also validated via a real-world application in a call center, where the true arrivals, balking, and reneging events are observable.
There are two aspects of the proposed method that would benefit from further clarification:
Possibility of multiple solutions: There may be more than a single set of IAT, balking, and reneging distributions that result in similar dynamics, and the proposed method does not guarantee returning the exact answer. However, this limitation is not unique to the method proposed here. Even simple distribution fitting commonly used in simulation input analysis does not provide such guarantees. Goodness-of-fit tests often fail to reject the fit for more than one distribution, requiring the analyst to consider other factors (such as empirical justification) before choosing among the candidate distributions not rejected by the statistical test. In fact, due to the same reason, the goal of input analysis is never to identify the right distribution, but to help select an appropriate distribution that simply provides a reasonable model for the data. The method presented in this paper has a similar goal.
Computational time: For each hypothesized scenario, the proposed method involves performing simulations to obtain a sufficient sample size for the simulated data, and requires comparing multiple percentiles of EIAT(NIQ) under different NIQ values. This process may become computationally expensive depending on the complexity of the simulation, number of hypothesized scenarios, and desired sample sizes. However, it is important to note that we are not concerned with real-time decision-making here. Instead, we strive to estimate balking and reneging thresholds, which are behavioral characteristics of individuals and irrespective of the real-time system performance. Therefore, computational overhead is irrelevant in this paper since there is no meaningful practical significance as to whether these estimates are obtained in a few seconds or a few minutes.
As an interesting area for future research, one could investigate the applicability of the proposed method for the case of infinite variance IATs such as those commonly found in telecommunication, computer networks, traffic, and finance applications. The proposed method can also be extended to include indifference-zone analysis, which requires additional simulation replications of the competitive candidates returned by subset selection. Such procedures guarantee to select the single best candidate with a probability greater than or equal to the confidence level, whenever the best hypothesized scenario is at least a user-specified amount better than the other candidates. One must be careful when using such methods instead of or in addition to subset selection. In particular, indifference-zone analysis should not be used unless sufficient iterations of the proposed method are performed so that the list of hypothesized distributions is likely to include high-quality candidates. Otherwise, indifference-zone analysis may result in the selection of the best scenario among a set of bad candidates.
It is hoped that the proposed method and its extensions will help businesses better estimate balking and reneging dynamics and facilitate effective decision-making to minimize unsatisfied demand and improve service quality.
Footnotes
Funding
This research received no specific grant from any funding agency in the public, commercial, or not-for-profit sectors.
Data accessibility statement
A working example, including all codes and a sample dataset are available in an open online Mendeley Data repository associated with this paper.4 The files associated with the repository are licensed under a Creative Commons Attribution 4.0 International license. You can share, copy, and modify the files so long as you give appropriate credit to the original author, provide a link to the CC BY license, and indicate if changes were made, but you may not do so in a way that suggests the rights holder has endorsed you or your use of the dataset.
Author biography
![]() http://ashkannegahban.com.
http://ashkannegahban.com.