






Abstract
The COVID-19 pandemic placed tremendous strain on medical resources. To assess intervention strategies and resource planning for metropolitan pandemic response, a hybrid System Dynamics–Discrete-Event Simulation (SD-DES) framework is developed, using Wuhan as a case study. With SD capturing macroscopic infection dynamics and policy intervention and DES simulating medical resource scheduling, bidirectional feedback between macro and micro levels enables a more holistic and comprehensive evaluation of policy effects. By simulating 132 representative scenarios, key factors including containment measures, medical resource capacity, mask adoption, vaccine rollout speed, and the timing of external medical support were examined. Our analysis provides a comprehensive perspective on pandemic prevention and control decision-making, an aspect often underrepresented in prior studies. The model offers an extensible computational framework for complex socioeconomic systems, such as pandemic emergencies, where dynamic and process complexities coexist. It can assist policymakers in enhancing the healthcare system’s preparedness and mitigating the spread of the pandemic. Future research could improve model robustness by incorporating advanced parameter estimation techniques, such as particle filtering. To address computational challenges, we also recommend implementing asynchronous module execution and optimized programming to improve simulation efficiency and scalability.
1. Introduction
The COVID-19 outbreak in Wuhan, China, in December 2019 severely challenged the city’s medical resources as the virus spread rapidly, overwhelming hospitals and depleting medical supplies. Wuhan responded with strict lockdowns and a three-tiered diagnosis and treatment system, including designated hospitals for severe cases (such as the newly constructed Thunder God and Fire God hospitals), temporary centres for mild cases, and centralized quarantine for suspected cases. Over 35,000 medical personnel from across China were deployed to support Wuhan, bringing expertise, equipment, and supplies, which sustained the treatment system during this critical period. Wuhan’s response demonstrated both China’s collective fight against COVID-19 and a supercity’s management of a public health crisis. 1
Despite these efforts, the outbreak caused considerable strain on Wuhan’s medical resources, underscoring the challenges public health emergencies pose to healthcare systems. 2 Improved methods for managing emergency medical resources, such as optimized allocation and coordination, are crucial during outbreaks. This research develops a hybrid model to capture COVID-19 spread dynamics, resource usage, and containment impacts in Wuhan, offering insights to enhance resource management in future emergencies.
This study contributes both methodologically and practically by proposing and elaborating a concrete framework for constructing a hybrid System Dynamics–Discrete-Event Simulation (SD-DES) model, which effectively integrates macro-level system dynamics with micro-level discrete-event processes. Methodologically, the proposed approach addresses the challenge of capturing bidirectional feedback loops between macro-level socioeconomic factors – such as policy decisions and resource allocation – and the progression of the pandemic, as well as the associated micro-level dynamics of medical resource scheduling and utilization. This integrated framework enables a more holistic and comprehensive evaluation of policy impacts. By applying it to the COVID-19 outbreak at a metropolitan scale (beyond a hospital scale), such as Wuhan, the framework provides quantitative assessments of combined intervention strategies, delivering actionable insights for public health policy, including the effects of containment stringency, resource levels, and timing on pandemic outcomes at a regional scale. The research examines key questions, such as how to operationalize feedback between disease spread and healthcare resources within the hybrid model, evaluate the impacts of multi-faceted interventions, and leverage the model’s unique advantages to offer deeper, more integrated policy insights than standalone SD or DES approaches.
The remaining parts of this paper are organized as follows. Section 2 reviews the literature on SD, DES, and their applications in simulating spread dynamics of infectious diseases and health service processes and hybrid SD-DES models. Section 3 details the construction of the hybrid model, data collection, and model calibration. Section 4 presents simulation results, counterfactual analyses, and alternative scenario evaluations. Section 5 discusses policy implications for containment strategies, surge capacity planning, and medical resource allocation, concluding with limitations, challenges, and future research directions.
2. Literature review
This section reviews literature on the applications of SD and DES in health research, along with studies on hybrid SD-DES models.
2.1. Applications of SD models
SD, developed by Jay W. Forrester in the 1950s, 3 captures the behaviours of state variables representing the accumulations in socioeconomic systems, such as products, resources, and even viruses. SD assumes system behaviours are determined by its structure and uses ordinary differential and algebraic equations to portray feedback loops and nonlinear cause–effect relationships. 4
Since its application in the health-related field in the 1990s, SD has become a valuable tool across many areas of the health sector. 5 SD supports the development of effective policies and strategies, 6 guides resource allocation for public health issues, 7 enhances health service capacity and operations,8,9 informs government decision-making on intervention,10,11 and helps evaluate options for health system reform. 12 SD is also extensively employed to model non-communicable disease like obesity, 13 diabetes, 14 cardiovascular disease, 15 HIV/AIDS, 16 and substance abuse. 17
SD is particularly well-suited for modelling epidemic dynamics in infectious disease epidemiology. Compartmental models within SD classify individuals into states such as Susceptible (S), Exposed (E), Infected (I), and Recovered (R). Various model combinations, like SIS, 18 SIR, 3 SIRS, 19 SEINRVseinr, 20 SEIR, and SEIRS, 21 allow researchers to incorporate factors like incubation, latency, and immunity loss. SD has been used to model numerous contagious diseases, including AIDS, 22 dengue fever, 23 fox rabies, 24 tuberculosis, 25 chlamydia, 26 H1N1, 27 and COVID-19, 28 and so on. Emerging diseases like COVID-19 often require additional compartments, such as Asymptomatic (A) and Symptomatic (SY) infections. 29 In response to the complexity of pandemics, Giordano et al. 30 introduced an expanded model with eight state variables for COVID-19.
2.2. Applications of DES models
DES models real-world process or system as a discrete sequence of events with each assigned a logical time based on empirical observations. Originally applied to telephone call scheduling, 31 DES has witnessed significant cross-field applications due to advances in computing and accessible simulation software. 32 Its diverse applications include production process diagnosis, production capacity planning, operation performance improvement, 33 supply chain planning, 34 aircraft maintenance scheduling, 35 programme evaluation, investment evaluation, network simulation, and healthcare capacity planning. 36
In healthcare specifically, DES has been applied since the 1980s, 37 within contexts such as healthcare networks, hospitals, outpatient clinics, emergency department, pharmacy, pharmacoeconomic analysis, and diagnostic and treatment pathways.38,39 Representative applications include improving patient flow, 40 resource allocation optimization (intensive care unit (ICU) bed use), 41 informing policymakers of the economic impact of pharmaceutical interventions, 42 analysing costs of applying new technologies, 43 simulating disease progression and treatment outcomes, 44 assessing disease screening technology and policies, 45 evaluating disease prevention and treatment, 46 simulating body physiology and drug, 47 and investigating interventions for substance abuse. 48 Liu et al. 49 provides a comprehensive review of DES healthcare management.
SD contrasts with DES by capturing feedback-driven dynamics at a system level, facilitating policy development for sustainable impacts. 3 DES, however, captures details but struggles with dynamic complexity and feedback loops.50,51
2.3. Simulation for pandemic planning and capacity management
The COVID-19 pandemic spurred the extensive application of computer simulation techniques to estimate healthcare resource demands and inform capacity management strategies worldwide. These approaches encompassed epidemiological compartmental models (e.g., SEIR variants), SD, DES, Agent-based Model (ABM), and hybrid frameworks, which enable projections of bed occupancy, ICU requirements, and the effects of interventions in diverse global contexts.
In Africa, Aguas et al. 52 and Frost et al. 53 developed SEIR-based tools for several low- and middle-income countries. Recent applications include Daldoul et al., 54 who used DES for emergency department operations in Tunisia. Ansermeah et al. 55 implemented SD to analyse patient flow in South Africa, while Abid et al. 56 applied DES for human resource planning in Tunisia.
In Asia, early research focused on epidemiological simulations to identify capacity gaps in India. 57 Later, studies by Baniasad et al., 58 Khairulbahri, 59 and Zhuang et al. 60 focused on reopening strategies and bed shortages in Southeast and broader Asia, utilizing ABM and SEIR models. Research priorities thereafter shifted towards operational improvements, such as DES for Indian healthcare networks, 61 stochastic compartmental modelling in China, 62 Susceptible-Exposed-Infected-Isolated-Recovered (SEIQR) models for bed management in the Philippines, 63 hybrid ABM and SD in Saudi Arabia, 64 multi-agent simulation for Wuhan, 65 hybrid multi-method approaches in China, 66 and DES for laboratory operations in Nepal. 67
In America, early research by Weissman et al. 68 introduced the CHIME Monte Carlo SIR model to address surge capacity in Philadelphia. By 2021, research diversified, with Alarid-Escudero et al. 69 and Cordova-Pozo et al. 70 applying SD in Mexico and other Latin American contexts, and Lyon et al. 71 utilizing vendor-specific DES for laboratory capacity planning in Canada. By 2023–2024, developments included queueing-microsimulation hybrid models for US hospitals, 72 DES-integrated optimization for hospital reconversion in Mexico, 73 and hybrid or multi-method simulations in Canada.74–76
In Europe, early-stage studies by Wood et al. 77 and Alban et al. 78 employed stochastic DES to optimize ICU capacity in the United Kingdom and the Netherlands, respectively. Subsequent research, including Caro et al. 79 with Discretely Integrated Condition Event (DICE) simulation in Excel for London hospitals and Garcia-Vicuña et al. 80 applying DES in Spanish regions, expanded the focus to patient flow and surge forecasting. McCabe et al. 81 utilized stochastic SEIR modelling to estimate ICU demands across France, Germany, and Italy. More recent work includes Groves-Kirkby et al. 82 using ABM for national-scale planning in England, Redondo et al. 83 applying DES for occupancy prediction in Valencia, Spain, and Pierotti et al. 84 implementing discrete-time simulation for mental health service recovery in southwest England.
In Oceania, Hendy et al. 85 developed custom stochastic branching process models to inform New Zealand’s pandemic response. This was followed by Thompson et al., 86 who applied ABM for Australia and New Zealand, and Lustig et al., 87 who used compartmental models to assess the impact of Omicron subvariants in New Zealand.
Collectively, these global applications illustrate that simulation modelling has become an essential tool for real-time decision support. While initially applied to generate urgent forecasts for surge capacity, these techniques rapidly evolved to inform operational decisions, including patient flow optimization, staffing, resource reconversion, and strategic planning to strengthen long-term system resilience.
2.4. Integrating SD and DES into a unified framework
Hybrid simulation enables interdisciplinary research by capturing unique characteristics across fields. 88 Barton and Tobias 89 introduced a hybrid platform integrating DES and SD, demonstrating their complementary strengths.90,91 In system thinking, proverb “not see the forest for the trees” reflects how focusing on details can obscure the broader view. A hybrid SD and DES model functions like an “observation scope” that can “zoom in” on process details or “zoom out” for a system-wide perspective, balancing granular insights with contextual understanding. For instance, in a pandemic, a hybrid model can address waiting times and staffing in a hospital’s emergency department while also tracking regional disease spread, as demonstrated in our study.
2.5. Applications of hybrid SD and DES models
The concept of hybrid simulation originated in the 1980s, drawing global scholarly attention. 92 Hybrid models have since been applied in manufacturing, supply chain, construction, and healthcare.93–97 Venkateswaran and Son 98 developed a hybrid framework integrating SD for strategic planning and DES for detail complexities of shop-level planning. Further applications in manufacturing, such as Greasley’s 99 cylinder sequencing and Rabelo’s et al. 100 production modelling, show the complementary benefits of combining SD with DES.101–104
In civil engineering, Pena-Mora et al. 105 used the SD-DES model to improve construction management, while Alvanchi et al. 106 modelled the fabrication process using DES with SD to capture feedback loops affecting the fabrication process. Alzraiee et al. 107 proposed a hybrid SD-DES for construction operations, providing guideline for practitioners. They later applied this model to engineering drawings production and earthmoving, with DES simulating operations and SD capturing feedback dynamics. 108 Hybrid SD-DES applications also appear in software development 109 and military field. 95
Hybrid SD-DES models have also been applied in healthcare. Chahal and Eldabi110,111 pioneered a framework for implementing hybrid SD-DES in this sector. In another case, DES was applied to social care staffing, while SD projected long-term demand. 112 Tejada et al. 113 created a DES-SD model for breast cancer screening and treatment in the United States. Other studies include Viana’s 114 work on SD-DES for chlamydia transmission and hybrid SD-ABM models, Mielczarek and Zabawa’s 115 cardiac disease forecasting in Poland, and Morgan et al.’s 116 SD-ABM model for radiotherapy planning.
These pioneering SD-DES studies in healthcare offer a foundation for further research. However, as socioeconomic complexities grow, in-depth studies are needed to assess higher-level policy impacts on organizational operations and systemic outcomes. 117 Recently, Lu et al. 96 used an SD-DES model to evaluate hospital bed planning during COVID-19, while Warde et al. 97 explored surgical volume effects on bed occupancy. Zulkepli et al. 118 modelled an integrated healthcare system using SD and DES, while Morgan et al. 119 developed a toolkit for mixed-method modelling. Palmer and Tian 120 introduced Python-based approaches for embedding DES within SD and vice versa.
Although mixed models have been applied in different fields, there is still a relative lack of integrated modelling research in the field of public health emergency response, especially for the bidirectional dynamic feedback of epidemic transmission and medical resource systems at the scale of megacities. Our research focuses on pandemic prevention and control issues in metropolitan areas, deeply integrating the dynamics of epidemic transmission within the city with the process of medical resource management, a topic that has been less explored in previous studies. Most existing research has focused on process linkage, but this paper achieves daily dynamic bidirectional flow between SD state variables and DES queue resources, capturing the “demand supply” feedback more finely. Second, our proposed hybrid SD-DES model systematically evaluates the combination scenarios of multi-dimensional intervention strategies (stringency of containment measures, medical resource sufficiency, mask-wearing adherence, vaccine rollout speed, and timing of external medical support) by simulating multiple scenarios, providing a more comprehensive and detailed analysis framework for epidemic prevention and control decisions. This helps to develop more scientific and effective intervention strategies in complex epidemic prevention and control environments.
3. Hybrid SD-DES model
Since the proposed hybrid model involves SD, DES, and their interacting mechanisms, we use three parts to describe them, respectively. In this hybrid SD-DES model, SD is used to capture the spreading dynamics of COVID-19 of the whole municipal region and the impacts of containment interventions on the diffusion dynamics of the disease. While DES is employed to depict the service process for COVID-19 treatment along with capacity planning and resource allocation and utilization. And the interacting mechanism illustrates how the hybrid model is constructed and implemented to facilitate the communication between SD and DES.
3.1. Capturing spreading dynamics of COVID-19 using SD
By combining traditional SIR epidemiological model and new features of the emerging pandemic disease, i.e., COVID-19, 121 our SD model is composed of 10 compartments, namely S (Susceptible population), E (Exposed population), A (Tracked asymptomatic infections), SY (Tracked symptomatic infections), US (Untracked/untreated symptomatic infections), UA (Untracked/untreated asymptomatic infections), UM (Untracked/untreated mild patients), UC (Untracked/untreated severe cases), UR (Untracked/untreated recovered patients), and UD (Untracked/untreated death). This model does not address the situation that immunity might be lost after recovery. Because the study focused on the early phase of the Wuhan outbreak (about 5 months), natural immunity waning had not yet become significant, and detailed data on immune attenuation were limited. For these reasons, immune attenuation was intentionally excluded to maintain the model’s reliability and focus on acute outbreak interventions. The SD model is calibrated, and those unknown parameters are estimated based on three available datasets for Wuhan, which are cumulative confirmed infections, cumulative recovered cases, and cumulative death caused by COVID-19. The stringency level of COVID-19 containment interventions – e.g., laxly implemented, moderately stringent level, and extremely stringent level – is represented in the SD model by changing the contact rates (CRs; e.g., average number of people contacted by the infected per day). Figure 1 presents the conceptual framework of the employed SD.

Conceptual structure of system dynamics model (SD).
We built the SD on the commercial simulation platform AnyLogic® (refer to Supplemental Figure A2 in Appendix B). Before incorporating hybridizing SD and DES, we need to separately calibrate the SD model based on the officially released COVID-19 data regarding variables of cumulative confirmed infections, cumulative recovered cases, and cumulative death since the calibration of the hybrid model is anchored in the accuracy of its individual constituent model, i.e., the SD model. The ordinary differential equations (ODEs) for the SD model are listed as follows (Equations (1)–(10)):3,122
where W is the total population in Wuhan after lockdown; S(t) is the susceptible people; E(t) is the exposed people; A(t) is the tracked asymptomatic infections; US(t) is the untracked/untreated symptomatic patients; UA(t) is the untracked/untreated asymptomatic patients; SY(t) is the tracked symptomatic patients; UM(t) is the untracked/untreated mild COVID-19 patients; UC(t) is the untracked/untreated critical COVID-19 patients; UR(t) is the untracked/untreated recovery from COVID-19; UD(t) is the untracked/untreated death from COVID-19;
The individual SD is calibrated against the 152 days (5 months) of officially released data from January 23, 2020, when Wuhan imposed lockdown, to June 22, 2020. Relevant parameters have been estimated when satisfactory fitting between the model simulation outputs and the smoothed official data (Supplemental Table A1 in Appendix A). Now, the calibrated SD is ready to be connected with the DES model.
3.2. Capturing capacity dynamics of COVID-19 treatment using DES
In the COVID-19 treatment process, essentially the same as the traditional DES model, DES intends to capture the resource-constrained structured workflow by using a queueing process or network and waiting time and the performance improvement by optimizing resource configuration and resource utilization. 123 The core concepts of DES model include entities, properties, queues, events, services, delays, and resources. In DES, an event can change the state of the system at any time with the change in resource usage and entity characteristics. By referring to guidelines from the National Health Commission of China124,125 and process portrayal in the relevant literature.126–128 In addition, the administrative orders from the State Council of China required that all related departments in the national, provincial, and municipal administrative hierarchies must bear the principles of “all suspected should be quarantined, all suspected should be tested, all suspected and confirmed patients should be admitted to hospital, and all confirmed patients should be treated.” Therefore, during the containment process, all traceable individuals with possible exposition to COVID-19 patients were required to take necessary diagnosis and test. Our process mapping is presented in Figure 2, which represents how COVID-19 patients are admitted, treated, and discharged in a DES model. Let’s illustrate the “admission-discharge” process from the right side “arrival of tracked infections or suspected infections” to the very right side “death or recovery” in a typical designated healthcare provider for COVID-19 treatment.

Conceptual framework of discrete-event simulation (DES) model.
3.2.1. Structure of a typical admission-to-discharge process
The treatment process presented in Figure 2 is the typical structure used in all involved hospitals and temporary treatment centres.124,125 Tracked individuals exposed to SARS-CoV-2 or self-reported suspected COVID-19 patients waited to be admitted by the fever patient department, and thereafter, preliminary diagnoses were conducted by physicians in diagnostic triage. Regarding the waiting time and diagnosis time in this stage, we refer to relevant studies in the outpatient department of hospitals in China (see Supplemental Table A3 in Appendix A). In order to provide accurate confirmation on the initial diagnosis of those suspected infections, the reverse transcription polymerase chain reaction (RT-PCR) test was taken in the next stage, where the waiting time in the observation room is determined by the capacities and test time. Having done the RT-PCR test, confirmed symptomatic and asymptomatic mild cases needed to wait for their turn for mild treatment in the “mild waiting room.” With exercising a mild treatment protocol in the assigned treatment ward, part of the patients (majority of them) recovered from the diseases and the rest need to be transferred to critical care. Before being able to have access to intensive care unit, COVID-19 patients in critical condition need to wait for the availability of ICU beds. In the mild and critical treatment processes, the allocations of doctors and nurses to bed are based on the guidelines issued by the National Health Commission (See Supplemental Table A4 in Appendix A). It is also assumed that the beds in critical care have been equipped with all necessary equipment such as ventilator or ECMO (Extracorporeal Membrane Oxygenation) equipment. The availability, arrangement, and utilization of beds, doctors, and nurses in each process and the clinical characteristics and progression of COVID-19 jointly determine the waiting time of patients in the queue. Of course, during the surge need, some resources such as doctors and nurses can be rearranged from three shifts per day (8 h/shift) to two shifts per day (12 h/shift). COVID-19 patients with critical conditions were either discharged from the hospital with recovery or were moved out of the process because of death.
3.2.2. DES model illustration
In this study, we use the extended Kendall’s notation in describing the queueing model, i.e., A/S/c/K/N/D in our DES model,129,130 which is detailed as follows:
A: the Poisson arrival process at a particular service point (server or workstation) of healthcare centre (hospital) model;
S: the service time distribution at each service points (including diagnostic triage, RT-PCR test, mild treatment bed, and critical treatment bed);
c: the number of service channels (according to the capacity of a relevant channels such as the number of beds for mild case treatment of COVID-19);
K: the number of places in the queue, since Wuhan adopted “all suspected and confirmed patients should be admitted to hospital and all confirmed patients should be treated”, K is assumed to be ∞;
N: the calling population, as we consider the total population left in Wuhan upon lockdown, N is assumed to be ∞;
D: the queue’s discipline, our model adopts the FCFS (First Come First Serve) service discipline.
In our model, all time units are transformed into day. We have the following formulas manifesting the queueing process: 131
where
3.3. Capturing dynamic interactions between COVID-19 transmission and treatment capacity using a hybridized SD and DES model
3.3.1. Resource dynamics during different states
According to the characteristics of medical resources deployment and utilization in Wuhan during the COVID-19 pandemic, the hybrid model attempts to capture the process behaviours in three stages as follows:
3.3.1.1. Resource shortage stage
Following the lockdown of Wuhan, (1) the state swiftly mobilized and deployed medical resources to Wuhan, bolstering its capacity to manage the pandemic by granting greater authority to activate and coordinate emergency healthcare responses and (2) replenishing resources quickly has been a priority, but it has not kept pace with the surge in demand for hospital beds, medical staff, and supplies. There is a need to mobilize additional medical manpower and resources, as well as construct new hospitals (Mt. Thunder God-“Huoshenshan” hospitals, Mt. Fire God-“Leishenshan” hospitals, and makeshift/mobile cabin hospitals). However, transitioning from resource scarcity to security involves a process. It is anticipated that there will be a delay before sufficient medical staff and beds can be added.
3.3.1.2. Stage of acute tension between demand and supply of resources
Until adequate medical resources arrived and hospital construction was completed, Wuhan’s medical infrastructure remained under significant pressure. Additional national and local containment protocols were issued and rigorously enforced during this time.
3.3.1.3. Winding-down stage of pandemic in Wuhan
As the epidemic stabilized, the withdrawal of additional medical staff and the closure of makeshift hospitals were underway. During this period, the number of newly infected patients steadily decreased until it reached zero, while the number of recovered patients continued to rise.
3.3.2. Major model assumptions
In order to make the model precisely capture and conduct counterfactual assessment to enhance the understanding of how different containment measure and resource allocation strategies might affect the transmission dynamics and vice versa, some major assumptions are made as follows:
Since we attempt to investigate the reciprocal impacts of COVID-19 transmission dynamics and healthcare capacity for COVID-19 patients in Wuhan city, it is assumed that all COVID-19-related treatment facilities and medical resources (including mobilized emergency supply of medical resources outside of Wuhan) are aggregated into a super-large healthcare service centre equipped with all necessary service stations (diagnosis triage, RT-PCR, mild care beds, and critical care beds as depicted in Figure 2) which is same as a dedicated standard COVID-19 care hospital in our study.
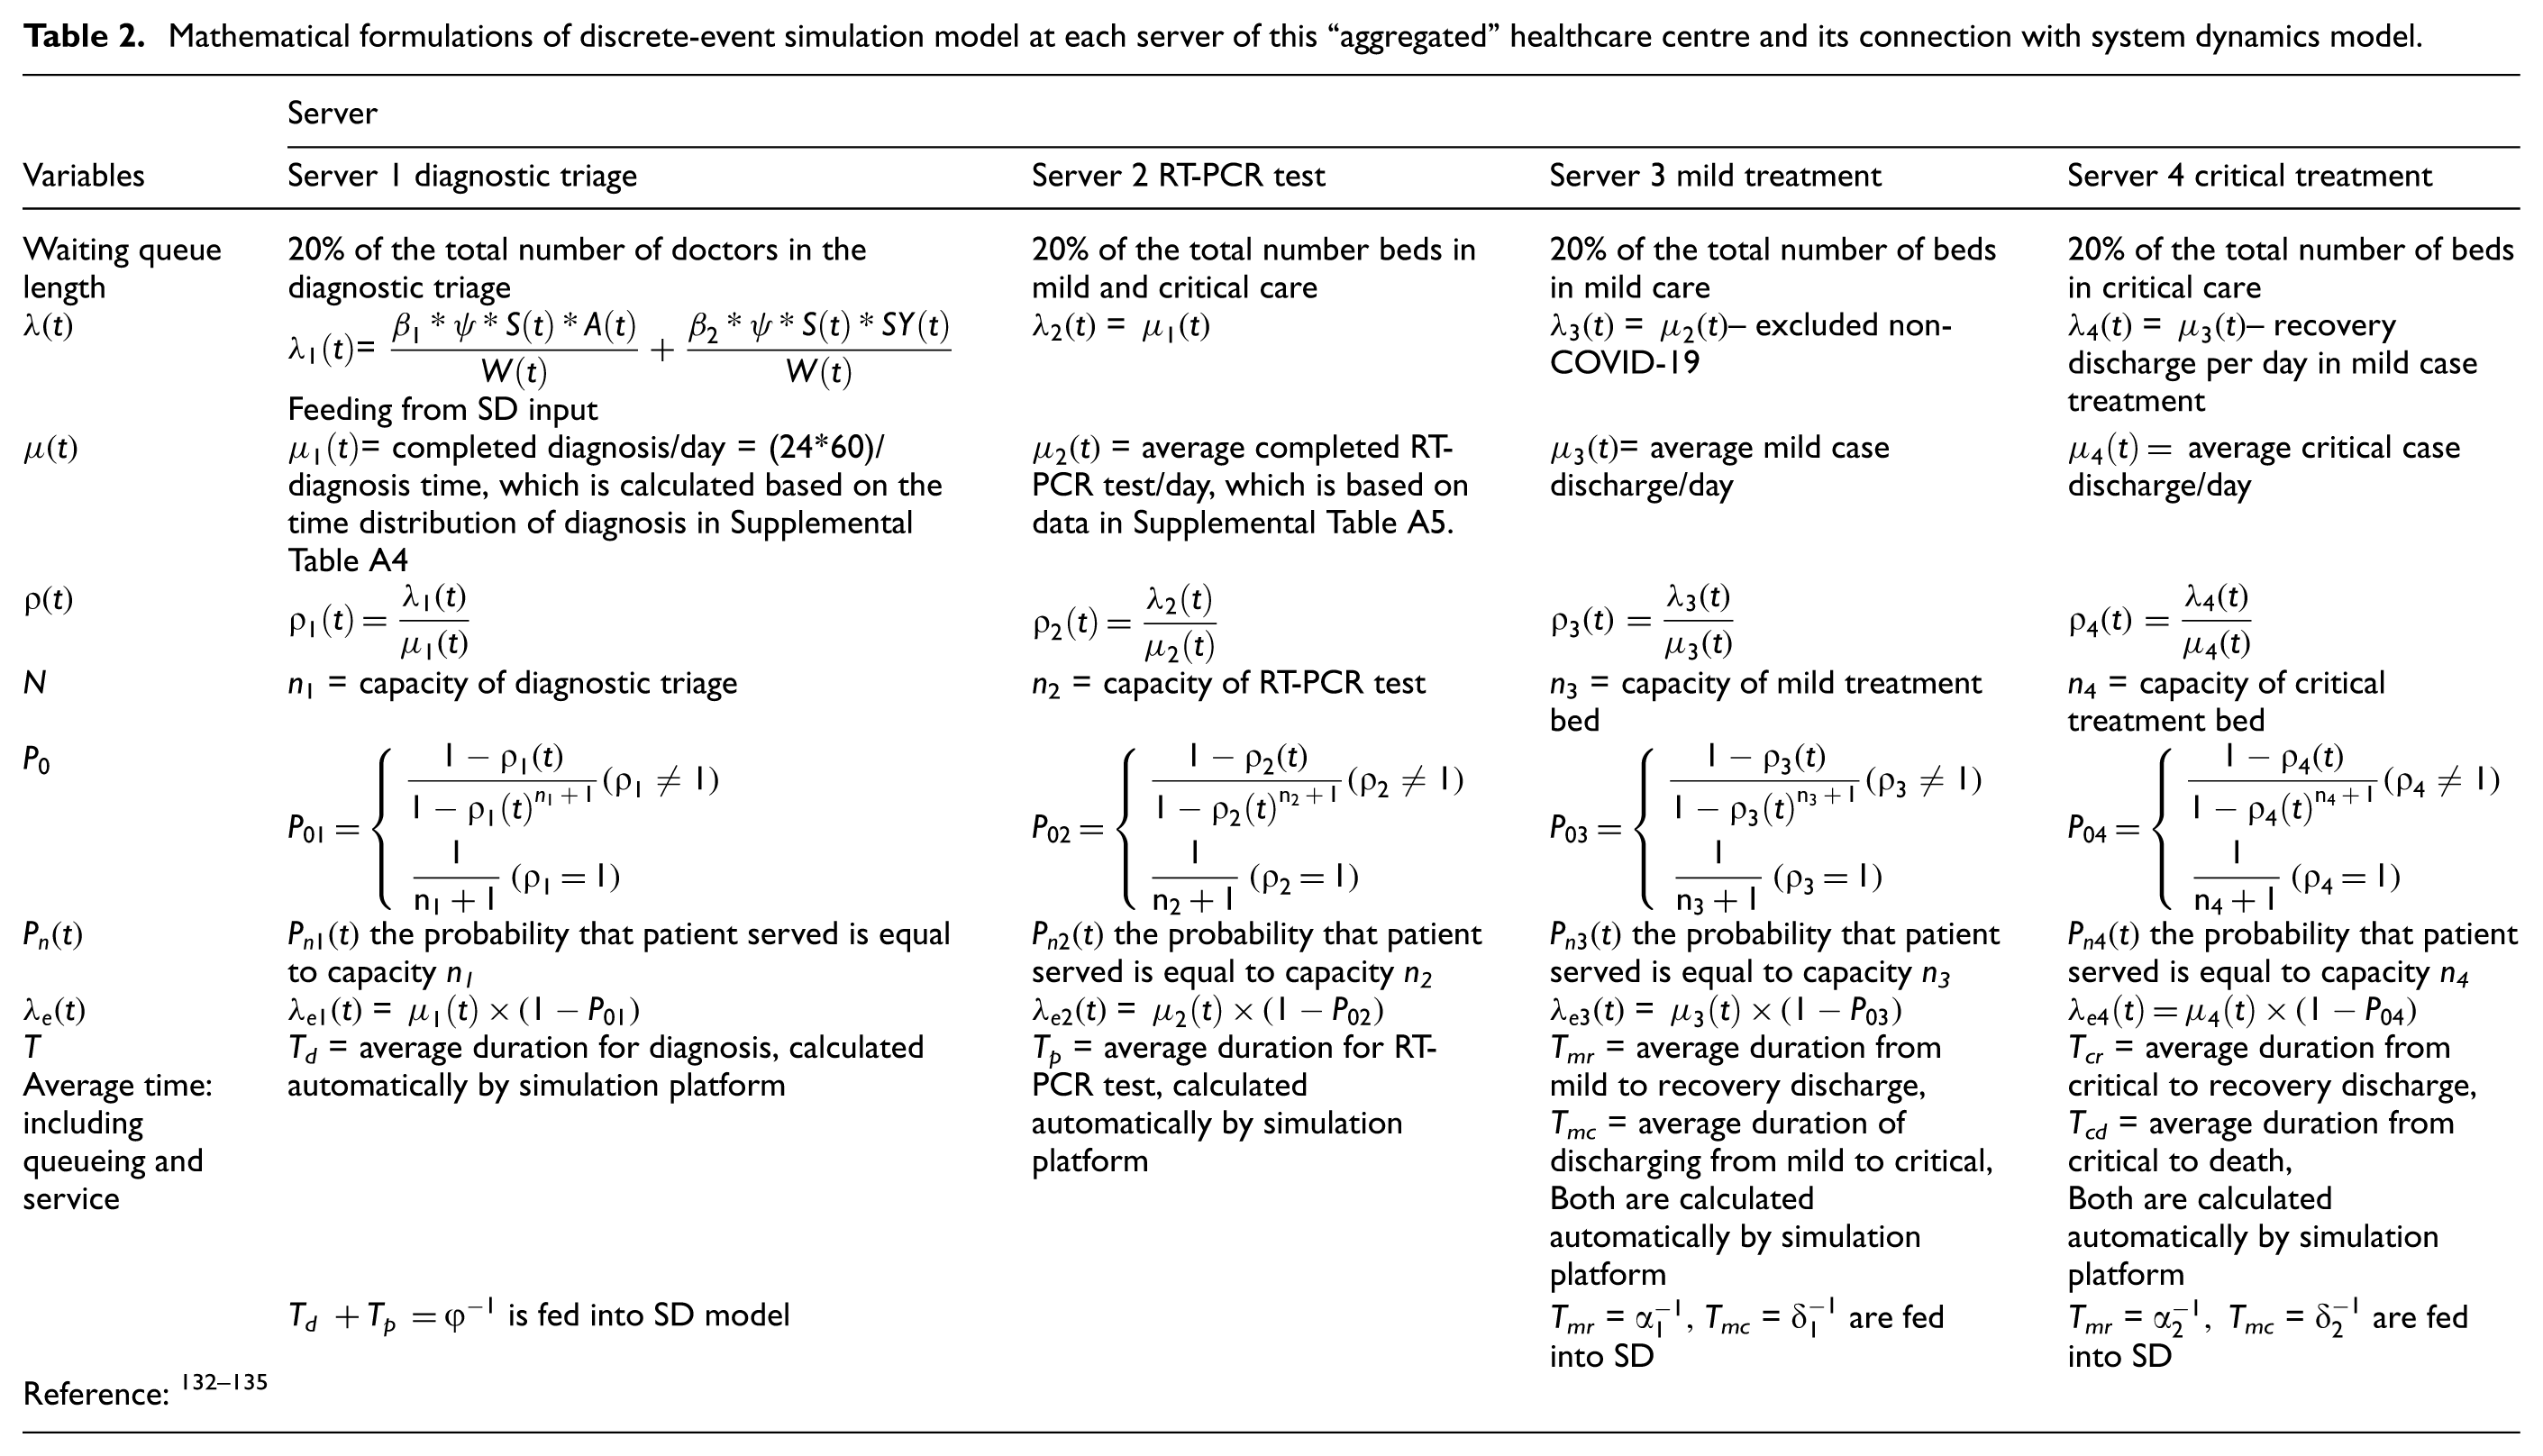
Figure 3 illustrates the logic of accommodating the model scalability and interoperability. In our proposed hybrid model, SD is used to capture the transmission dynamics of COVID-19 in Wuhan, and DES is used to model the aggregated healthcare centre. The best option, of course, is to make the SD communicate with each DES-represented treatment centre located within Wuhan. However, given the geographic and service heterogeneity in the treatment centres, complexity of transportation network, and addition of mobilized medical resources from outside of Wuhan (Table 1), it is prohibitively difficult to capture the process details and their impacts on transmission dynamics of COVID-19. Moreover, the publicly available data regarding added medical resources are all at the aggregate level. Therefore, the second-best option is adopted in this study, and a mathematical representation in illustrating the SD and DES is presented in Figure 4 with the formula in Table 2. In addition, substructure related to vaccination was incorporated in Figure 5 (see other support Supplemental Figures A1–A6 in Appendix A).

Integrating city-level COVID-19 spread dynamics and aggregated treatment processes.
Human resources and medical resources.

Source: National Health Commission, Wuhan Health Commission, Chinese Centre for Disease Control and Prevention, Hubei Daily, and China Economic Net (refer to Table A5 for deployment time of the added resources).

Representation of the dynamic connections between system dynamics model and discrete-event simulation model.
Mathematical formulations of discrete-event simulation model at each server of this “aggregated” healthcare centre and its connection with system dynamics model.

Incorporation of vaccination intervention into the hybrid system dynamics and discrete-event simulation model.
Establishing the mathematical interaction between SD and DES on the AnyLogic® is critical for achieving the expected functions of hybrid SD and DES in our study. In Figure 4, two patient inflows coming from SD (tracked/treated symptomatic COVID-19 patients and untracked/untreated severe/critical COVID-19 patients) are fed into the DES model daily. One inflow enters the block named “Waiting for Admission,” while the other enters the block labelled “Critical Waiting Room” (Equations (15) and (16)). During the shortage stage of medical resources (either mild or critical patients, or both), untreated queueing patients who exceed the threshold time will be returned to the SD model (Equations (17) and (18)). The continuous interactions between SD and DES allow the hybrid model to effectively capture the reciprocal relationship between medical provision and demand, as well as the development of the pandemic. 112 Table 2 shows the detailed formulas involving connections between SD and DES.
In the hybrid SD-DES framework setting, the synchronization mechanism136–138 and flow balancing have been given full consideration:
where C t is the total available medical resources (beds); C s is the available medical resources for severe and critical conditions (beds); SY(t)_SDt is the number of untreated mild COVID-19 patients (exceeding waiting threshold time) returning back to SD (UM in SD); and UC(t)_SDt is the number of untreated severe and critical COVID-19 patients (exceeding waiting threshold time) returning back to SD (UC in SD):
where SV1 is the people who have successfully received the first dose of the vaccine; SV2 is the people who have successfully received the second dose of the vaccine;
In our framework, τ1 and τ2 denote the vaccine efficacy parameters that directly determine the probability of successful protection for susceptible individuals upon vaccination. In our assumptions, a daily supply of first-dose vaccines is available. Susceptible individuals (S) who receive the first dose, with a success rate of τ1, transition into the “First-Dose Vaccinated” stock (SV1). The proportion that fails (1−τ1) is assumed to remain in the S Stock. Individuals in SV1 become eligible for the second dose after a specified interval. Those who are successfully vaccinated with the second dose, with a success rate of τ2, move into the “Second-Dose Vaccinated” stock (SV2). Individuals in both SV1 and SV2 are assumed to have corresponding levels of protection against infection and no longer participate in the disease transmission dynamics (i.e., they are removed from the force of infection calculation). In our model, vaccine efficacy (τ) scales the flow to reflect the impact of vaccination on the transition from the susceptible population to the vaccinated population. Specifically, ε1*τ1 represents the number of individuals transitioning out of the susceptible population due to the efficacy of the first dose. Meanwhile, min(
3.4. Model calibration, optimization, and validation
For calibrating and optimizing complex system models, heuristic algorithms like Black Box Optimization and Scatter Search are often used. These methods do not require specific mathematical formulas but must be tailored to each case. Black Box Optimizers, which treat the objective function as a black box, have a long history in operations research. 139 Scatter Search, a population-based metaheuristic, is applicable to problems with continuous and discrete variables and single or multiple objectives. The simulation platform used in this research is AnyLogic, which features an optimizer powered by OptQuest, which leverages metaheuristic methods, specifically Scatter Search and Tabu Search, as its primary optimization engines.
In the calibration experiment, the optimizer was used to perform optimal fitting to the given data, so that the model output data could be as close as possible to the empirical data, and the corresponding model parameter values (see Supplemental Table A2 in Appendix A) were found out. The objective function of the model calibration is shown in Equation (22): 140
where
This hybrid simulation model attempts to simulate the outbreak dynamics of COVID-19 in Wuhan under stringent community control and containment measures and adequate medical resources. This stage aims to determine the average time from hospital admission to discharge for COVID-19 patients in Wuhan under actual conditions, as well as the values of various parameters (Supplemental Tables A2–A6 in Appendix A). Our model estimates the average time for mild and severe COVID-19 patients from symptom onset to recovery to be 14.51 days and 20.87 days, respectively, which aligns closely with existing studies reporting such data.141–143 The fitting results are demonstrated in Figure 6.

Simulation results versus released data in model calibration and optimization.
4. Results
4.1. Scenarios under different levels of containment stringencies and medical resource sufficiency
This set of scenarios is designed to examine the impacts of treatment resource sufficiency on the COVID-19 spread dynamics under different levels of containment stringency. In total, 15 scenarios, including the baseline scenario, were compared and analysed (see Table 3).
Scenarios under different containment and control stringencies and levels of medical resource sufficiency.
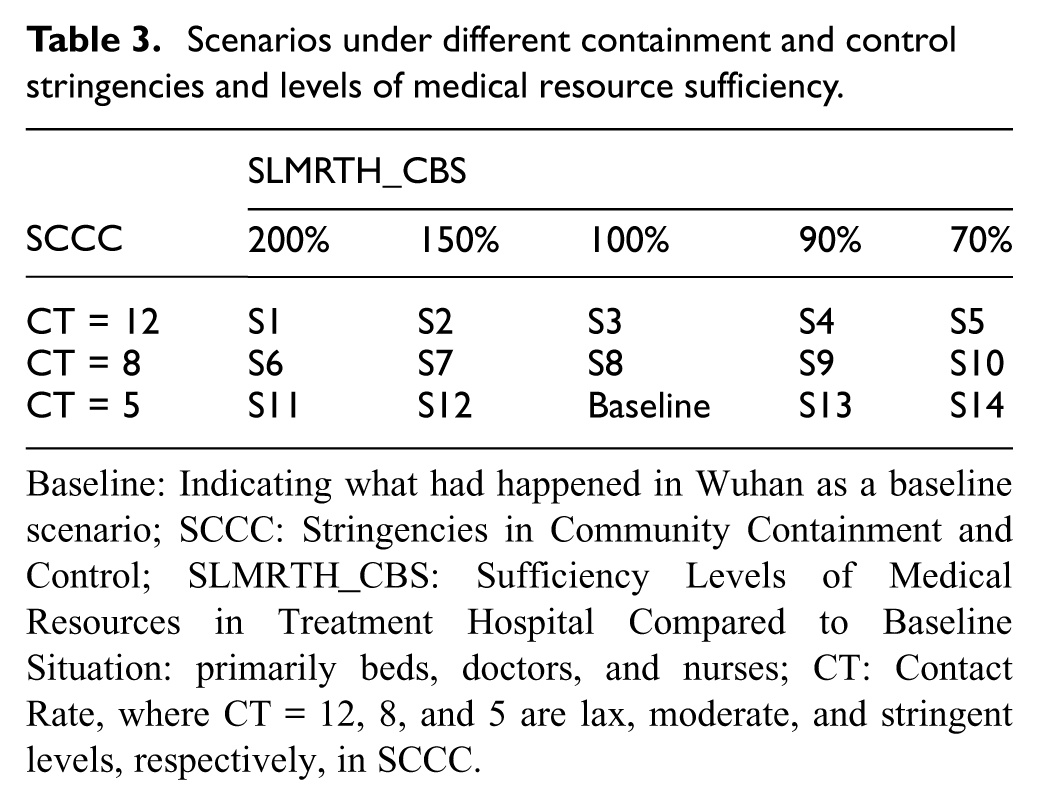
Baseline: Indicating what had happened in Wuhan as a baseline scenario; SCCC: Stringencies in Community Containment and Control; SLMRTH_CBS: Sufficiency Levels of Medical Resources in Treatment Hospital Compared to Baseline Situation: primarily beds, doctors, and nurses; CT: Contact Rate, where CT = 12, 8, and 5 are lax, moderate, and stringent levels, respectively, in SCCC.
When medical resources are sufficient (i.e., 90%–200% of baseline capacity), the accumulative COVID-19 infections show only subtle differences within each group of containment stringency, as indicated by “S1–S4”, “S6–S9”, and “S11–S13 and Baseline” on the left side of Figure 7. However, when the availability of medical resources is assumed to reduce to 70% of baseline capacity, the accumulative infections of COVID-19 and the accumulative death increase dramatically, particularly under lax containment measures. In scenario S5, for example, infections surge to 829,489 and deaths to 8861, compared with 50,339 infections and 3906 deaths in the baseline case. Conversely, increasing containment stringency significantly offsets the negative effects caused by insufficient medical resources, as seen in scenarios S10 and S14. Interestingly, the effects of medical resource sufficiency on accumulative death differ from its impacts on accumulative COVID-19 infections. Specifically, as containment measures become less stringent, the effect of medical resource sufficiency on cumulative deaths becomes more pronounced. Counterintuitively, under conditions of lax and moderate containment, higher availability of medical resources is associated with a slight increase in cumulative deaths. However, this increase remains relatively modest (Supplemental Table A7 in Appendix D). The phenomenon can be explicated by the fact that more severe cases from untracked sources are admitted for treatment when more medical sources are available. As a result, based on the assumptions of a fixed death rate for severe cases, more deaths occur during treatment. In addition, for scenarios within a specific containment stringency level (e.g., S1–S5), higher medical resource availability leads to shorter average recovery times for both mild and severe cases (Supplemental Table A8 in Appendix D).

Accumulative infections and deaths under scenarios S1–S14.
4.2. Scenarios under varying advance times in imposing community containment and control
This group of scenarios is designed to investigate the combined effects of treatment resource sufficiency and varying advance times (5 and 10 days) in implementing different stringent levels of containment measures on the COVID-19 spread dynamics. There are a total of 30 scenarios to be compared and analysed in this set (see Table 4). In the analysis, for the ease of comparison, we compared scenarios in Figure 7 with those in this group under the same stringency level of containment measures (including two different advance times), as shown in Figures 8–10.
Scenarios under different containment and control stringencies, sufficiency levels of medical resources, and different advance times in imposing community containment and control.

DA-ASICCC: Days Ahead (lead time) of Actual Schedule of Imposing Community Containment and Control.

Accumulative infections and deaths under scenarios S1–5 and S15–S24.

Accumulative infections and deaths under scenarios S6–S10 and S25–S34.

Accumulative infections and deaths under scenarios S11–S14, S35–S41, and baseline.
Similar to scenarios S1–S4, when medical resources are relatively sufficient (i.e., 90%–200% of baseline capacity), the accumulative COVID-19 infections exhibit only nuanced differences for the same advance times (5 and 10 days), as shown by scenarios S15–S18 and S20–S24 on the left side of Figure 8. Introducing containment measures with varying advance times not only reduces the overall number of COVID infections but also effectively mitigates the challenges caused by the insufficient supply of medical resources. The results further reveal that, under the same level of stringency in containment measures, earlier implementation results in more effective outcomes in controlling COVID-19. As indicated by the comparison between scenarios S19 and S24, all else being equal, a 10-day advance in implementing containment measures can completely counteract the increasing infection trend caused by insufficient medical resources, meaning that implementing containment measures early can alleviate strain on medical resources. Due to the effects of reducing accumulative COVID-19 infections, implementing containment measures 5 days or 10 days in advance noticeably reduces the accumulative deaths within hospital, with the effects particularly pronounced in scenarios with the least sufficient medical resources (Supplemental Table A9 in Appendix D). While early interventions with 5- and 10-day advance times can remarkably reduce the accumulative COVID-19 infections, the influence on accumulative death is more nuanced. In the results, the difference in death tolls between these two advance times is relatively minor. Early implementation of containment measures progressively influences the average recovery times for both mild and severe cases as medical resources become strained. The longer the advance time before these measures are enacted, the more noticeable these effects become (Supplemental Table A10 in Appendix D). Given the potential negative impacts of implementing containment measures on individuals and the economy, decision-makers must find a balance among the variables of timing of implementation, benefits and costs of early interventions, and the availability of medical resources.
Comparing Figure 8 with Figures 9 and 10 shows that the effects of implementing containment measures in advance on accumulative COVID-19 infections, accumulative death, and the average recovery times for mild and severe infections almost follow the similar pattern when the same level of stringency is applied. Furthermore, when comparing different advance times and varying stringency levels simultaneously, the transition to a more stringent level of containment measure has a larger magnitude of impacts on accumulative COVID-19 infections and deaths than the shift from 5- to 10-day advance time. As the stringency of containment measures increases, the effects generated by early implementation on accumulative infections also increase, although with a diminishing trend. And the diminishing effect is not pronounced for cumulative deaths (as indicated in Supplemental Tables A9 and A10 in Appendix D).
4.3. Scenarios with different sufficiency levels and delays in deploying nationwide assistance for medical resources in Wuhan
Scenarios in this set are designed to explore the effects of assumed varying levels of medical resources sufficiency, supplied through nationwide assistance, and different delays in deploying these resources on the COVID-19 spread dynamics under varying stringency levels of containment measures. A total of 42 scenarios, including the baseline scenario, S3 and S8, were compared, analysed, and visualized (Table 5).
Scenarios under different containment and control stringencies, sufficiency levels, and delays in deploying nationwide assistance for medical resources in Wuhan.

SLNAMSW_CBS: Sufficiency Levels of Nationwide Assistance for Medical Resources in Wuhan Compared to Baseline Situation; D-DNAMSW: Delays in the Deployment of Nationwide Assistance for Medical Supplies in Wuhan.
Under the lax stringent level of containment measures (Figure 11), a comparison of scenarios S45–S56 with scenario S3, where the amount and deployment timing of medical resources from nationwide assistance match the baseline scenario, reveals several key findings as follows. First, even with a 15-day delay in deploying resources, the effects remain similar to those of scenario S3 when the medical resources increase to 200% of the baseline level, as indicated by scenarios S45, S48, S52, and S55. Second, if the provided medical resources are 150% of the baseline level, this increase can counteract the negative effects of the deployment delays as long as the delay is 10 days or less, as revealed in scenarios S46, S49, and S53. However, when the delay extends to 15 days, the infections shoot up to 146,399, as seen in S56, compared to 50,339 in the baseline scenario. Third, as the sufficiency levels of assisted medical resources decrease to 100% and 90% of baseline, the effect of increased delay times becomes very severe, with cumulative infections exceeding 8 million and cumulative deaths expected to surpass one million, as indicated in scenarios S51 and S54. In addition, scenarios S50 and S56 exhibit somewhat higher death counts than other scenarios, revealing that an insufficient level of resources fails to counteract the negative impacts caused by delays in deploying these medical resources. Under the same containment stringency level, delays in deploying assisted medical resources result in longer average recovery time for mild and severe infections. The longer the delay, the longer the recovery times become (see Supplemental Tables A11 in Appendix D). The reason is that as the delay in deploying resources increases, more COVID-19 patients have to wait longer to be admitted to the hospitals. The lengthened waiting time leads to longer average recovery times for both mild and severe infections.

Accumulative infections and deaths under scenarios S3 and S45–S56.
As demonstrated in Figures 12 and 13, the increase in containment stringency levels shows that the timing of delays and the sufficiency of medical resources have a similar pattern of impacts on cumulative COVID-19 infections and death, as indicated in Figure 11; the magnitude of these impacts differs, though. Moreover, regarding the average recovery times for mild and severe infections, all else being equal, they increase as the containment stringency level rises when medical sources are sufficient (at 200% and 150% of baseline) but decrease as containment stringency levels rise when medical sources are less sufficient (at 100% and 70% of baseline) (see Supplemental Tables A11 and A12 in Appendix D). The reason for this phenomenon is that as containment stringency intensifies, cumulative COVID-19 infections for both mild and severe cases decrease, allowing more patients to be admitted to hospitals when medical resources are sufficient, consequently increasing the average recovery times for both mild and severe infections. Conversely, for situation where medical resources are insufficient, despite the reductions in cumulative infections, the limited capacity of care negatively influences the patient admitted, leading to pre-admission deaths in severe cases, which therefore reduces the average recovery times for both mild and severe cases.

Accumulative infections and deaths under scenarios S8 and S57–S68.

Accumulative infections and deaths under scenarios baseline and S59–S83.
4.4. Scenarios under different advance times in deploying nationwide assistance for medical resources in Wuhan
This set of scenarios intends to examine the combined impacts of the sufficiency in assisted medical resources and varying advance times (5 and 10 days) in deploying these resources on the COVID-19 spread dynamics under different containment stringency levels. A total of 36 scenarios are compared and analysed in this set (see Table 6).
Scenarios under different containment and control stringencies, sufficiency levels, and advance times in deploying nationwide assistance for medical resources in Wuhan.

SLNAMSW_CBS: Sufficiency Levels of Nationwide Assistance for Medical Resources in Wuhan Compared to Baseline Situation; DAS_DNAMSW: Days Ahead of Schedule in the Deployment of Nationwide Assistance for Medical Supplies in Wuhan.
As demonstrated in Figures 14–16, when assisted medical resources are sufficient (100%–200% of baseline), advancing their deployment 5 or 10 days does not have noticeable differences in the impacts on cumulative COVID-19 infections. These advance times, however, offset the negative effects caused by insufficient assisted medical resources as evidenced by scenarios S88, S92, S97, S101, S106, and S110. In contrast, scenarios S84, S93, and S102 reveal that insufficient assisted medical resources lead to a significant increase in cumulative infections. The timing and sufficiency of assisted medical sources in these scenarios do not significantly change the effects of varying containment measure stringencies on cumulative death. This means that, all else being equal, the higher stringency levels lead to larger reductions in cumulative deaths. In addition, early deployment of assisted medical resources can help mitigate the negative impact of resource shortages on cumulative deaths, although this influence diminishes as resource sufficiency increases (see Supplemental Table A13 in Appendix D). The simulation results show that the advance timing and sufficiency of assisted medical sources remarkably influence the average recovery times of both mild and severe infections under varying containment stringency level. When other conditions remain equal, insufficient assisted medical resources result in increased average recovery times for both mild and severe infections. With sufficient assisted medical resources (200% and 150% of baseline capacity), early deployment doses not significantly affect the average recovery times for both mild and severe infections. However, as resource sufficiency drops to 100% or less (100% and 70% of baseline capacity), the average recovery times for both mild and severe infections increase, and the larger the resource shortage, the more remarkable the increase in the average time. In addition, when all else being equal, the effects of elevated containment stringency on average recovery times for both mild and severe infections are consistent across both sufficient and insufficient assisted medical resources, as discussed at the end of Section 4.4 (see Supplemental Table A14 in Appendix D).

Accumulative infections and deaths under scenarios S45, S46, S3, S84–S92.

Accumulative infections and deaths under scenarios S45–S92.

Accumulative infections and deaths under scenarios S45–S92.
4.5. Scenarios related to mask protection
This group of scenarios is designed to explore the impacts of mask-wearing on cumulative infections, death, and the average recovery time for mild and severe infections. These scenarios consider varying levels of containment stringency and the sufficiency of medical resources in the treatment hospital, including a total of 15 scenarios (see Table 7). The effect of mask-wearing is directly reflected in the change of actual transmission rate (infectivity) for both asymptomatic and symptomatic individuals. The percentage of the population wearing masks is affected by mask production and actual supply levels. Based on Assumption 9 and related literature, it is assumed that properly wearing a mask offers a protection efficacy of 94%.144–147
Scenarios under assumed mask protection efficacies.

SLMRTH_CBS: Sufficiency Levels of Medical Resources in Treatment Hospital Compared to Baseline Situation: primarily beds, doctors, and nurses.
Actual transmission rate of asymptomatic case:
Actual transmission rate of symptomatic case:
where W represents the total population in Wuhan during the period when COVID-19 broke out; and
Regarding the impact of mask-wearing on cumulative infections and deaths, a comparison between scenarios of S5, S10, and S14 (shown in Figures 8–10) and the results in Figure 17 reveals that, under conditions of insufficient medical resources in treatment hospitals (70% of baseline capacity), a continuous increase in the percentage of population wearing masks significantly reduces cumulative COVID-19 infections and deaths. However, the magnitude of this reduction becomes diminishing as containment stringency rises. On the contrary, when medical resources in treatment hospitals are sufficient, the effects of mask-wearing are relatively limited. Moreover, at the same level of containment stringency, changes in the sufficiency of medical resources (ranging from 90% to 200% of baseline capacity) in the treatment hospital do not produce noticeable effects on the cumulative infections, even when considering the effect of mask-wearing. Containment stringency and medical resource sufficiency demonstrate similar effect patterns, although at different scales, as discussed at the end of Section 4.2 (see Figure 7), even when considering wearing masks.

Accumulative infections and deaths under mask-wearing-related scenarios S111–S125.
When looking into the impact on average recovery times of mild and severe infections, incorporating mask-wearing effects has minimal marginal influence
4.6. Scenarios evaluating the impacts of assumed early vaccination
This set of scenarios examines the effects of early vaccination administration under different supply capacities and varying vaccine efficacies, including both the first and second doses. Scenarios are created based on key conditions mentioned in Assumptions 10 through 12 under a 100% of baseline capacity in the sufficiency level of medical resources in the treatment hospital. In addition, scenarios designed by altering these conditions are evaluated. A total of six scenarios are analysed, visualized, and compared with those discussed in the previous section (Table 8).
Scenarios evaluating the impacts of early vaccination.

In scenarios with less stringent containment measures (see S126 and S127 in Figure 18), vaccine administration has a pronounced effect in reducing cumulative COVID-19 infections and deaths, when compared with the scenario without vaccination (see S3 in Figure 7). However, as the stringency level of containment measures rises, the effect of vaccines diminishes. In addition, the positive effects generated by enhanced vaccine efficacy and increased supply capacity disappear as the containment measures become more stringent. This aligns with previous analyses that elevated containment stringency through measures such as lockdown, curfew, social distancing, and closure of public places tends to overshadow other interventions. Given the negative externalities associated with these stringent containment measures, it is essential to consider less disruptive alternatives, as addressed previously. By comparing scenarios S126, S128, and S130 to S3, S8, and baseline, it reveals that early vaccine administration moderately reduces the average recovery times for both mild and severe infections. These reductions become more pronounced as containment stringency rises (see Supplemental Table A18 in Appendix D). In addition, improved supply capacity and efficacy further augment these reductions.

Accumulative infections and deaths under vaccination-related scenarios S126–S131.
5. Discussion and conclusion
This paper presents a hybrid model integrating SD and DES to design and evaluate interventions for enhancing COVID-19 pandemic response in a metropolitan area, specifically Wuhan. The SD captures citywide transmission dynamics of COVID-19, while the DES model represents the healthcare treatment process, including patient admission, waiting, treatment, and discharge at an assumed aggregate healthcare centre in Wuhan. Dynamic links between SD and DES models deal with patient flow between the healthcare centre and the metropolitan context. A total of 132 representative scenarios, including baseline, were simulated, analysed, and compared. Key factors considered in the scenario design include varying stringency levels of containment measures, sufficiency of medical resources, timing of containment measures, sufficiency and deployment delays of nationwide medical assistance, mask supply and usage rate, and early administration of vaccines with different assumptions on supply and efficacy. This study examined the effects of these factors along with their combinations on cumulative infections, cumulative deaths (with and without treatment), and average recovery times for mild and severe infections. Additional metrics such as hospital admission rate and treatment outcomes for mild and severe cases were also investigated (see Supplemental Tables A7, A9, A11, A13, A15, and A17 in Appendix D). The comparison of different scenarios provides valuable insights for policymakers and implementers regarding pandemic progression, healthcare capacity under surge demand, and the impacts of various interventions. Some interesting or counterintuitive findings were identified during the comparison. For example, under lax and moderate containment, increased medical resources slightly raise cumulative deaths. Early interventions (by 5–10 days) significantly reduce cumulative infections but exert minimal impact on cumulative deaths, as earlier measures do not necessarily lower mortality. Stricter containment measures yield greater reductions in infections and deaths than early interventions, with diminishing returns for cumulative infections as stringency increases. Policymakers must balance intervention timing, containment duration, and medical resource allocation to optimize outcomes. The model framework can be adapted to different scales, from the micro level (hospital or community) to the macro level (regional, state, or global), helping policymakers design high-leverage polices for sustainable outcomes.
Regarding the theoretical and practical contribution, the hybrid SD-DES framework proves instrumental in addressing complex system dynamics. Although a standalone SD model effectively captures macro-level feedback and policy impacts, it cannot capture micro-level details, such as patient-specific pathways and detailed queueing under resource constraints. Conversely, a standalone DES model simulates individual patient flows and resource use but often relies on externally generated arrival rates, which makes it difficult to model the dynamic evolution of an epidemic or to assess the impact of macro-level interventions on transmission. Our hybrid framework addresses these limitations by modelling both citywide epidemic progression (SD) and granular patient processing within the healthcare system (DES). This allows direct analysis of their interaction, such as how macro-level transmission drives healthcare demand and how micro-level resource bottlenecks feed back into community transmission rates. Moreover, integrating SD and DES enables us to gain a more comprehensive understanding of the interdependent factors in epidemic control, providing a strong basis for designing effective intervention strategies. For example, the simulation results indicate that a moderate increase in critical care resources could, under certain conditions, slightly raise cumulative deaths. This result arises from the hybrid feedback loop: increased resources lead to the admission of more severe cases, which, given a fixed severe-case mortality rate, increase deaths, and then affect macro-level statistics. Such nuanced insight, linking operational decisions to population-level outcomes, remains hidden in single-method models. Last but not least, this research confirms the strong potential of hybrid simulation in addressing cross-scale problems characterized by “macro-policy and micro-operation” interdependencies. The developed framework provides a reference for modelling complex systems in which strategic decisions interact with operational constraints, such as enhancing supply chain resilience, planning urban infrastructure, or managing other public health crises.
It is worth noting that modelling the city’s medical resources as a single, aggregated centre may introduce biases into the results. For instance, it could overlook differences in hospital capabilities (such as medical expertise and resource allocation), geographic disparities in healthcare accessibility, and patient hospital selection behaviours. This might overestimate the actual resource utilization efficiency and underestimate treatment delays caused by transportation or information barriers for some patients. To validate this as a reasonable simplification, we conducted several checks. First, we drew on extensive real-world data, including the total medical resources and patient distribution across Wuhan’s hospitals, ensuring the single-aggregated model could broadly reflect the city’s healthcare landscape. Second, we referenced the policy context at the time: during the pandemic, Wuhan implemented a “centralized admission and unified dispatch” command system, which significantly facilitated citywide resource allocation and reduced the distortion in aggregated modelling. In scenario design, we indirectly tested the model’s sensitivity to the core parameter of “resource utilization efficiency”– a potential source of bias in aggregation – by substantially varying resource adequacy levels (70%–200%). The results demonstrated the robustness of key conclusions across different resource levels.
As with all other studies, this research has certain limitations. First, since this study aimed to capture the treatment process for COVID-19 patients at the citywide aggregate level, variations in individual hospital treatment protocols and patient mobility behaviour from home or community to hospitals were not reflected in the hybrid model. Therefore, modifications will be necessary when applying this approach at the hospital or community level. Second, due to the extensive scope of the study, only the Tabu Search approach embedded within the AnyLogic simulation platform was used to calibrate the hybrid model. Third, only a delicately selected number of representative scenarios were simulated and analysed, given the vast number of possible combinations. Finally, because the event modelled is historical, only counterfactual analyses were conducted, and no predictions were made.
The increasing application of hybrid models that integrate DES, SD, and ABM across various domains highlights their ability to simultaneously capture multiple complexities, such as combinatorial and dynamic challenges, within complex socioeconomic systems. This versatility has drawn growing interest from scholars across a wide range of disciplines. 148 In order to enhance the feasibility and applicability of these models, future research could focus on the following aspects. First, to enhance the robustness and accuracy of hybrid models, various parameter estimation techniques can be explored. In addition to the Tabu Search algorithm embedded in the AnyLogic, other methods such as Descent Methods (including Gradient Descent and Stochastic Gradient Descent), Simulated Annealing, Monte Carlo Markov Chain (MCMC), Particle Filtering (PF), and Particle Monte Carlo Markov Chain (PMCMC) can be examined. These approaches provide diverse strategies for optimizing model parameters and improving overall model performance. The second perspective area one can pursue is to explore the techniques (e.g., convergent cross-mapping) for determining the cause-and-effect relationship existing between two or more variables in complex systems being examined, which is crucial for understanding how the changes of different elements of a system might affect one another. Third, given the hybrid models’ ability to simultaneously capture both macro dynamics and micro interactions within complex socioeconomic systems, future research should focus on expanding their application to diverse areas. These include, but are not limited to: healthcare systems, such as emergency departments, where DES can model environmental and process variables, ABM can capture individual behaviours, and SD can capture resource allocation mechanisms and capacity-building dynamics; supply chain management, where DES models the flow of goods and services and SD simulates process capacity dynamics under various investment and operational strategies; urban planning, where ABM models passenger interactions, DES represents infrastructure properties, and SD stimulates long-term urban development strategies; financial markets, where ABM captures individual investor decision-making behaviours and SD models overall market dynamics; and social systems, where ABM simulates interactions of individuals in physical and virtual social networks and SD captures the effects of intervention policies and resource allocation mechanisms. Last but not least, given the computational intensity and time-consuming nature of hybrid model simulations, a promising area for future research could involve exploring the asynchronous execution of different modules, utilizing varying update frequencies, optimizing computing hardware, employing a more efficient programming language, or a combination of these strategies.
Supplemental Material
sj-docx-1-sim-10.1177_00375497261441339 – Supplemental material for Pandemics and urban emergency response: employing hybrid simulation to enhance optimal design of intervention measures
Supplemental material, sj-docx-1-sim-10.1177_00375497261441339 for Pandemics and urban emergency response: employing hybrid simulation to enhance optimal design of intervention measures by Hongli Zhu, Shiyong Liu, Kefeng Xu and Wai Kin Victor Chan in SIMULATION
Footnotes

Funding
The authors disclosed receipt of the following financial support for the research, authorship, and/or publication of this article: This research has been supported by the National Natural Science Foundation of China (NSFC #72474029).
Declaration of conflicting interests
The authors declared no potential conflicts of interest with respect to the research, authorship, and/or publication of this article.
Data availability statement
The authors have included all necessary data in the supplemental file.
Supplemental material
Supplemental material for this article is available online.
Author biographies
References
Supplementary Material
Please find the following supplemental material available below.
For Open Access articles published under a Creative Commons License, all supplemental material carries the same license as the article it is associated with.
For non-Open Access articles published, all supplemental material carries a non-exclusive license, and permission requests for re-use of supplemental material or any part of supplemental material shall be sent directly to the copyright owner as specified in the copyright notice associated with the article.
