






Abstract
The strain-gauge type textile sensors adopted in many studies on respiration-sensing wearable systems have been reported to have two major limitations that result in reduced sensing accuracy and insufficient durability of the sensor. The two limitations are the inability to accurately monitor the changes in the three-dimensional (3D) body contour during changes in the respiration cycle and the frequent occurrence of baseline drifts. To solve these issues, this study proposes new types of textile respiration rate sensors with a 3D structure, which measure the respiration rate based on the variation in the size of the contacting section’s surface during respiration, rather than the changes in the length of the sensor, as in existing strain-gauge type sensors. Firstly, the sensing signals were analyzed based on morphology and size measurements. Then, the sensing reliability of three respiration rate sensor types, namely the no-filler, 3D hard, and 3D soft types, was analyzed by comparing their measurements with those of the SS5LB. Finally, the reproducibility and baseline drifts of the sensors’ measurements were evaluated by taking and comparing repeated measurements. As a result, the consistency of the sensing signals of the SS5LB and those of the two types of 3D sensors was higher than those of the no-filler type sensor, and the 3D soft type sensor had the highest reliability and reproducibility among the three new types of sensors. The result showed relatively reduced baseline drifts in the two types of 3D sensors.
Keywords
According to experts from the World Health Organization, the number of patients with respiratory diseases has been sharply increasing, owing to the deterioration of the atmospheric environment. 1 Respiration rate sensing has been mainly implemented through wearable devices, which have been widely used owing to their non-restrictive features. 2 The general principle of respiration rate sensing is the measurement of the variations in the body trunk’s (thorax and abdomen) volume between the inhalation and exhalation phases from the variations in capacitance, inductance, piezoelectric voltage, and electric resistance of sensors. The majority of the existing respiration sensors have been developed based on the measurement principle of the strain gauge, which measures changes in the thoracic surface, which occur during inhalation and exhalation, through changes in the electric resistance. 3
The strain-gauge type respiration sensor has the inherent limitation that it cannot accurately monitor the three-dimensional (3D) body contour changes during the respiration cycle. This is because it measures the respiration rate from two-dimensional variations in the sensor’s length. Furthermore, most of the strain-gauge type respiration sensors detect also the fluctuation of the electrical resistance due to changes in the sensor’s length caused by body movements not related to respiration that changes the chest’s circumference. The detection of these signals by the strain-gauge type respiration sensors ultimately decreases their sensing accuracy. These sensors have low durability owing to baseline drifts caused by the continuous fluctuations induced by repeated respiration. 4 In sensing, the baseline indicates the initial value of the sensed signal, which is expected to change over time. Baseline drifts cause the measurement of the respiration cycle to start from an elevated starting point owing to the sensing hysteresis or other noises. Therefore, baseline drifts frequently result in the reduction of sensing accuracy.
Only a few studies have investigated the acquisition of biosignals with 3D wearable textile electrode sensors. These studies reported superior performance of the 3D wearable textile electrodes over that of planar textile electrodes on the acquisition of heart activity signals.5,6 In light of the above discussion, the present study focused on the two aforementioned major problems in existing strain-gauge type respiration rate sensors, namely the insufficiently accurate monitoring of the 3D body contour changes during the respiration cycle and the frequent occurrence of the baseline drifts. We addressed these problems by testing sensors with different structures. Many existing strain-gauge type respiration sensors detect the fluctuations of the electrical resistance due to changes in the sensor’s length during the respiration cycle. 7 In contrast, in this study, we designed 3D textile sensors that measure the respiration rate according to the variations in the size of a section’s surface within a 3D sensor during respiration. The 3D textile sensors were built in a supporting module with an elastic open-and-close structure; it was assumed the 3D structure of the textile sensors could reflect changes in the contacting section’s surface within a sensor by opening and closing the supporting module depending on the changes in the thoracic volume during respiration; this mechanism would allow the direct monitoring of the 3D changes in the chest contours, reducing baseline drifts.
The objectives of this study were as follows. The first objective was to investigate the sensing reliability and reproducibility of the types of 3D respiration rate sensors developed in this study. The second objective was to investigate the sensing performance of the 3D respiration rate sensors by comparing them with a commercialized strain-gauge based sensor, also in terms of baseline drifts.
We aimed at limiting the respiration measurement parameters for the respiration rate sensing, to allow the commercialization of the proposed sensors as wearable products, and attempted to design a 3D respiration rate sensor using textile materials considering their wearability. We measured the respiration rate in the still state using the new types of 3D textile sensors with the elastic open-and-close sensor-support module. In our next study, the sensing performance of the proposed 3D textile sensors during body movement will be investigated and compared with a larger range of strain-gauge based sensor types.
Theoretical background
Respiration rate measurement methods
With the wearable sensor, the respiratory rate is measured as follows. The respiratory rate is measured for 1 min, and the period from one maximum expansion of the thorax to the next one is considered as one cycle of respiration. The respiration per minute (respiration/min) is obtained by measuring the respiration for 15 s and then multiplying it by four or by measuring the respiration for 30 s and multiplying it by two. The respiratory rate of normal adults at rest is 16–18 respiration/min, whereas that of children younger than 13 years and neonates is approximately 20–30 and 30–50 respiration/min, respectively.
8
Respiration is generally measured using flow meters, spirometers, body plethysmography, or thoracic plethysmography. Among the widely used plethysmographic methods, inductive capacitive plethysmography, strain-gauge plethysmography, capacitive plethysmography, and piezoelectric plethysmography have been applied to measure the respiration rate with wearable sensors.
9
Inductive capacitive plethysmography measures the changes in inductance depending on the changes in volume during respiration using sensors worn on the chest and abdomen. The sensors are belt-shaped and consist of conductive coils with a zigzag shape (Figure 1).10,11
System used in this study: (1) flow at the mouth from PNT; (2) Pbody from the whole BP; (3) RC and ABD signals from RIP.
10
PNT: Pneumotachograph; BP: Body Plethysmograph; RC: Rib; ABD: Abdomen; RIP: Respiratory inductive plethysmography.
The accuracy of a portable respiratory inductive plethysmograph, which allows the monitoring of ventilation without airway instrumentation during exercise in unrestrained subjects, was evaluated. The portable respiratory inductive plethysmograph accurately estimated ventilation during exercise on a treadmill and identified differences in breathing patterns among patients with pulmonary or cardiac diseases and healthy subjects. 12
Strain-gauge plethysmography measures the changes in resistance caused by the tension or compression of the sensor, depending on the changes in volume during respiration using sensors worn on the chest and abdomen. 13 The respiratory period, respiration rate, and respiratory patterns can be evaluated through the analysis of the measured data. A previous study performed a comparative review of techniques for recording respiratory events at rest and during deglutition. Following a review of the main techniques employed for recording resting, pre-feeding, feeding, and post-feeding respiration on different subject groups (infants, children, and adults), a critical comparison of the methods was illustrated using simultaneous recordings from various respiratory transducers. As a result, a minimal combination of instruments was recommended, which can provide the necessary respiratory information for routine feeding assessments in a clinical environment. 14 In another study, an Respiratory Inductive Plethysmography (RIP) module with multiple inductive sensors, no variable-frequency Inductor (LC) oscillator, low power consumption, and automatic gain adjustment for each channel was presented. Based on inductance measurements without using a variable-frequency LC oscillator, they further integrated pulse amplitude modulation and time-division multiplexing schemes into a module to support multiple RIP sensors. Performance tests on the outputs with the cross-sectional area and the accuracy of respiratory volume estimation demonstrated good linearity and accurate lung volume estimation. Furthermore, they reported that the RIP module was especially useful for wearable systems with multiple RIP sensors for long-term respiration monitoring. 15 A chest-strap based wireless body sensor has also been developed by applying strain-gauge plethysmography. In this study, the expansion and contraction of the thorax during inhalation and exhalation, respectively, were detected using a force-sensing resistor. Based on the thoracic movements detected, the respiration was determined with a peak detection algorithm. For the evaluation, a treadmill experiment with five subjects was conducted using an ergospirometry system as a reference. A comparison of this system with an RIP-based sensor showed a close relationship with the captured thoracic movements during normal and deep respiration. 16
Kennon and Demirok 13 developed a textile-based strain sensor with a respiration belt. The constituent materials and the knitted structure of the textile sensor were specifically selected and tailored for this application. Electromechanical modeling was developed using Peirce’s loop model to describe the fabric geometry under static and dynamic conditions. Kirchhoff’s node and loop equations were employed to develop a generalized solution for the equivalent electrical resistance of the textile sensor for a given knitted loop geometry and for a specified number of loops. A laboratory test setup was built to characterize the prototype sensor and the resulting equivalent resistance under strain levels of up to 40%, and consistent resistance response levels were obtained from the sensor, whose measurements correlated well with the modeled data. 13 Another study developed strain-gauge type textile respiration sensors (TRSs) coated with transparent conductive oxide and multi-walled carbon nanotubes and measured respiration using strain-gauge plethysmography. In addition, an appropriate measurement location was selected by analyzing human motion through motion capture and measuring the signal sensitivity of the sensor by location; a garment design was proposed by applying the results. 17
Lee et al.
18
proposed a different type of respiration rate sensor based on the strain-gauge principle. Three types of 3D sensors, one with a wide dome shape, one with a narrow round dome shape, and one with a narrow triangular dome shape (all with the same height), were fabricated by using a 3D printer (Figure 2). This TRS measured resistance values from the change in the area of the contact surface between the inner 3D structure and outer shell within the sensor during respiration, in contrast to the existing method of measuring resistance fluctuations according to the changes in the length of the respiration sensor. The accuracy, reproducibility, and reliability of the TRS were investigated and compared to those of the SS5LB respiratory effort transducer model (BIOPAC Systems, Inc.). The performances of the three types of TRSs at different respiration rates and measurement locations in humans were examined. Unlike the other two types of TRSs, the wide dome-shaped sensor positioned at the side of the upper abdomen yielded reliable measurements at all respiration rates. Based on the results, appropriate combinations of TRS types, respiration rates, and measurement positions were suggested.
18
Three-dimensional (3D) respiration rate sensor based on the strain-gauge principle.
18

Capacitive plethysmography measures the changes in electrostatic capacity according to the changes in volume detected by a belt-type sensor made of conductive and non-conductive textiles worn on the chest or abdomen.
19
Textile capacitive pressure sensors (TCPSs) were developed by bonding two types of conductive textiles and three types of non-conductive textiles. To investigate their respiration measurement performance, the TCPSs and flowmeters were worn, and the correlation between their measurements was analyzed. The results showed a significant correlation coefficient of 0.96 (p < 0.0001) with an error of 0.001 in the average respiration rate (Figure 3).
20
Design of a band-type textile capacitive pressure sensor.
20

In piezoelectric plethysmography, a belt-type sensor made of a piezoelectric polymeric material worn on the chest measures the electrical signals generated between both electrodes by the pull on the polymeric material owing to the changes in volume during respiration.
21
Piezoelectric film-based respiratory belts have been described and tested. A two-degree-of-freedom model considering the motion of the rib cage and abdomen was used to quantify ventilation, and the piezoelectric belts were used to monitor flow in a manner analogous to the monitoring of the volume with two magnetometer pairs or two respiratory inductive plethysmograph belts.
22
In another study, a sensor was designed using a polyvinylidene fluoride film, which is a piezoelectric polymeric material, and the respiratory rate of a group of firefighters was monitored through a respiration signal generation simulator (Figure 4).
23
Furthermore, a novel garment-based sensing system for the long-term monitoring of breathing rhythm has been reported. The prototype garment was tested on five subjects, and its measurements were compared with those of a standard piezoelectric respiratory belt.
24
Structure of a respiration rate sensor constructed using polyvinylidene fluoride.
23

Commercialization and certified respiration rate sensors
The Pneumotrace transducer by UFI, Inc. is a commercial product that uses piezoelectric plethysmography.
25
The “Model 1132 Pneumotrace II™” is a sturdy piezoelectric respiration transducer that generates high-level linear signals in response to changes in the thoracic circumference associated with respiration (Figure 5).
Model 1132 Pneumotrace II™.
25

The SS5LB developed by BIOPAC Systems, Inc. is a commercial respiratory transducer using a force-sensing resistor-based strain assembly (i.e., a force-sensing resistor combined with strain-gauge plethysmography) that can measure the changes in the thoracic or abdominal circumference (Figure 6).
26
The SS5LB transducer is used to record respiration via chest or abdomen expansion and contraction. To avoid losses in signal amplitude while maintaining linearity and minimal baseline drift, the developer of the SS5LB recommends this device be applied for the measurement of extremely slow respiration patterns, owing to its problems of baseline drifts. The specifications of the SS5LB are shown in Table 1.
The SS5LB with strain-gauge plethysmography.
26
Specifications of the SS5LB DC: Direct Current.

According to a study on the modeling of estimated respiratory waveforms, the recorded signal suffers from several types of artifacts, such as noise, baseline drift, and saturation. Figure 7 shows a respiratory signal of 7 s. The baseline drift is caused by the repetition of inhalation and exhalation phases and it is the short time variation of the baseline from a straight line caused by electric signal fluctuations. There are several ways to remove baseline drifts, including linear approximations, cubic spline interpolated approximations, and the calculation of the first and second derivatives of the signal.
27
Respiratory signal and baseline drift due to the repetition of inhalation and exhalation phases.
27

Research method
Structure, measurement principle, and materials of the respiration rate sensor
Overview of the sensor and the measurement principle
The respiration rate sensors developed in this study have the shape of a chest belt, and they consist of a sensor part and a sensor-supporting module part. The sensor part is located in the front center of the belt, and it consists of two sensors arranged in parallel in two layers, base fabrics to which each sensor is attached, and a barrier layer between the sensor layers. Figure 8 illustrates how the lower sensor pushes upward on the 3D curvature of the wearer’s body during inhalation. The sensors in the two layers fabricated with conductive fabric were arranged in parallel in the front center of the chest belt so that they face each other, and a pair of non-conductive barriers (a part belonged to the elastic open-and-close structure of the supporting module) is placed between the two layers. The outside of the barriers is connected at both ends of the chest belt. The function of the elastic supporting module with an open-and-close structure is to either separate the two layers of sensors from each other (Figure 8(a)) or to stick them together (Figure 8(b)). During exhalation, the two sensors are separated from each other because the two barriers are in contact with each other; during inhalation, the volume of the thoracic cavity increases, so the barriers are gradually separated from each other. Owing to the elastic opening-and-closing structure of the supporting module, the size of the surface of the contacting section within a sensor during respiration varies gradually according to the respiration cycle.
Sensor and sensor-supporting module: (a) contraction by exhalation; (b) expansion by inhalation. CNT: carbon nanotube.
The strain-gauge principle is expressed as in Equations (1) and (2). The new types of textile sensors designed in this study measured the fluctuations of the electrical resistance according to the respiration cycle from the change in the area of the contacting section surface (ΔS) within the 3D sensor
7


In the above equations,
Details of the sensor part
Three types of sensor structures were designed in this study. The structure and form of the sensor layers in Figure 8 were subdivided into the three types, shown in Figures 9(a)–(c). The three types of sensors were a no-filler type (Figure 9(a)), a 3D hard type with built-in hard filler (Figure 9(b)) in a 3D-type sensor that changes shape according to contour of the chest, which changes during inhalation and exhalation, and a 3D soft type with built-in soft filler (Figure 9(c)). All three types of sensors were built in the same sensor-supporting module with the elastic open-and-close structure.
Three types of sensor structures: (a) no-filler type; (b) three-dimensional (3D) hard type; (c) 3D soft type. SW CNT: single-walled carbon nanotube.
All the sensors were made of the commercialized COM-14110 EoenTex conductive fabric coated with single-walled carbon nanotubes (SparkFun). This EeonTex fabric is a conductive, nonwoven microfiber used in e-textiles as well as electromagnetic and resistive heating applications. All the sensors were fabricated in the same 3 cm × 3 cm substrate and arranged in the front center of the belt so that the paired sensors faced each other. The base fabric of the sensor consisted of 70% polyester and 30% nylon 6 and had a 0.8 mm thickness. The electrical resistance of each sensor in the 3 cm × 3 cm squares was 8 kΩ, which was evaluated to be appropriate for the respiration measurements. The base fabric was extremely durable with a tensile strength of >450 N and tear resistance of 12 N. The no-filler type sensor among the three types of developed sensors has two conductive fabric layers stacked together without an internal filler, as shown in Figure 9. In contrast, the commercialized internal fillers were used for the 3D soft type and 3D hard type sensors to form a 3D structure. The selection criterion for the filler materials was the resilience, which was expected to affect the change in the section’s surface of the sensors in contact during inhalation. The soft filler of Rich Legend Enterprises Ltd was used for the 3D soft type sensor. The soft filler was made from a non-latex sponge, and its thickness, area, and resilience were 8 mm, 2.8 cm × 2.8 cm, and 10.5%, respectively. The hard filler of Corsair Ltd was used for the 3D hard type sensor. The hard filler was composed of a flush rubber, and its thickness and resilience were 8 mm and 2.1%, respectively. The internal volume of the fillers of the two types of sensors was controlled to be 8 mm in thickness and 2.8 cm × 2.8 cm in size to prevent any effect of the amount of filler. The wires were made of multifilament yarn composed of two-ply stainless steel. The thickness of the yarn was 400 D and the resistance per meter was 14 Ω.
Details of the sensor-supporting module part
The sensor-supporting module consists of a pair of barriers (leatherette), which block electrical currents between the paired sensors, the sensor’s support (elastic band), and a chest belt (elastic band), which supports opening and closing the barrier according to respiration. During inhalation, the elastic band of the sensor’s support stretches owing to thoracic expansion (expansion by inhalation) so that the two barriers open on both sides; consequently, the paired sensors that were facing each other stick together. In contrast, during exhalation, the length of the elastic band returns to its original length owing to the contraction of the thorax (contraction by exhalation), resulting in the two barriers returning to the center and closing the barriers on both sides; then, the paired sensors separate. In addition, Velcro was attached to the back of the chest belt so that the belt was in close contact with the body upon adjusting its length.
Sensor-supporting module materials
Materials of the sensor-supporting module
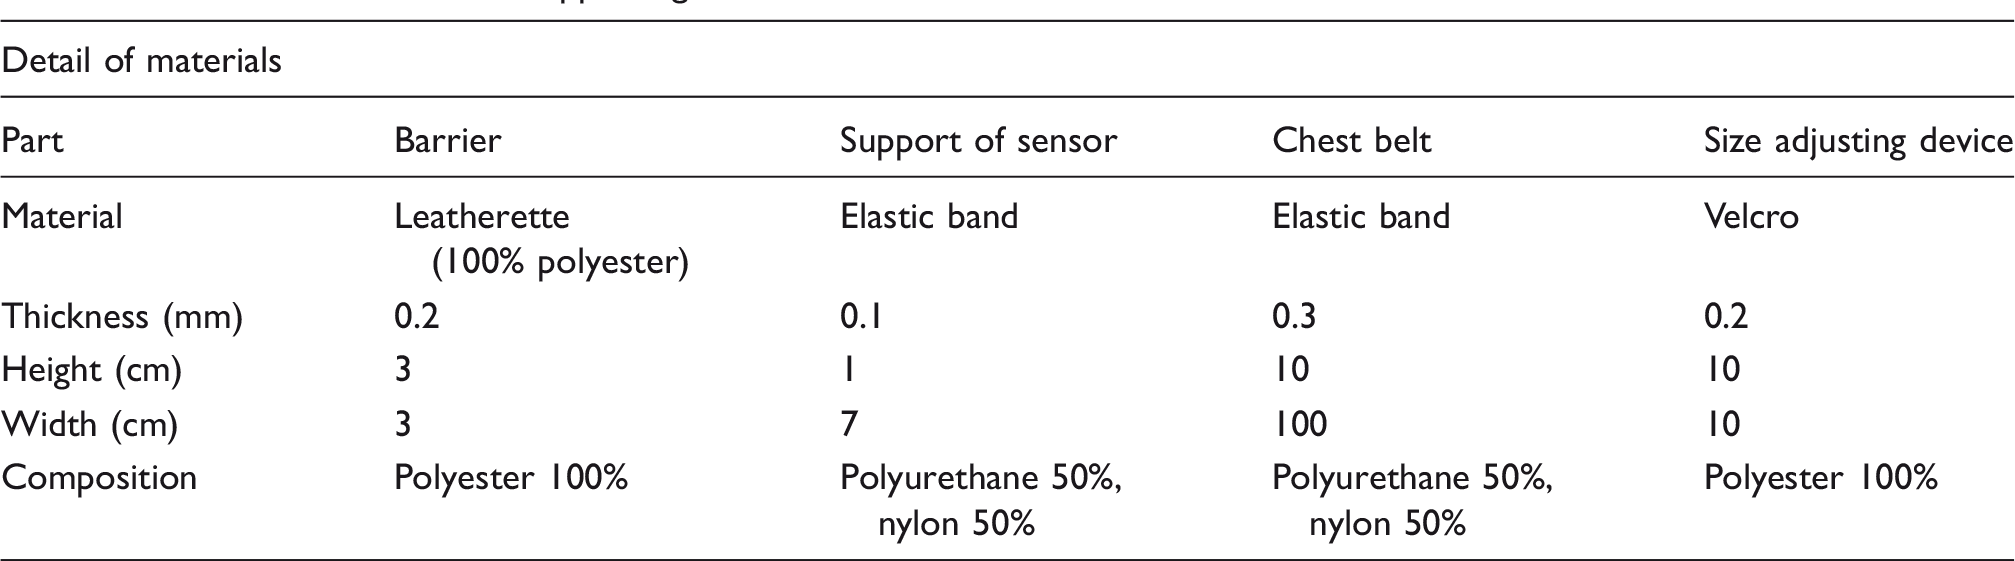
It was necessary to control the pressure, the elasticity of the elastic band, and the initial distance between the sensor layers because they were expected to influence the measurements (given in the Experimental methods section). In order to minimize the influence of the three critical factors, three different fastening sizes of the chest belt (large, medium, and small) were applied depending on the subject’s somatotype. Despite our attempt to maintain the pressure uniformly and to minimize the variation in the elasticity and the difference in the initial distance between the sensor layers, it was not possible to completely control these factors while the sensors were worn.
Experimental methods
Respiration rate protocol and location of respiration rate measurements
In this study, the respiration rate was first measured for 30 s with the subject standing and the arms hanging by their side and then for another 30 s after the subject rested for 10 s. During the measurement, tempo and beat were maintained constant at 30 BPM and 2 /2 (inhalation, exhalation), respectively, using a metronome (Panoramic Software Inc.).
The three types of respiration rate sensor belts were used in sequence to measure the respiration rate. To obtain the reference signal, a transducer (the SS5LB by BIOPAC Systems, Inc.), which is a nasal thermocouple sensor that uses the international standard method of respiration measurements,
26
was worn by the subjects along with the respiration rate sensors developed in this study. Based on the results from previous studies, the optimal location for the respiration rate sensors was determined to be in an intersection between the chest line and the front center line.
4
Accordingly, the horizontal centerline of the respiration rate belt was aligned with the chest line that passes the nipple point, and the center of the respiration rate sensor was placed on top of the vertical centerline (Figure 10). As suggested by the manufacturer, the SS5LB, which was used to measure the respiration rate as a reference signal, was placed approximately 5 cm below the armpit.
Simultaneous measurements of the respiration rate using the reference sensor (the SS5LB) and the developed sensor: (a) photograph of the upper belt (the SS5LB); (b) lower belt (developed sensor).
Subjects
Details of subjects
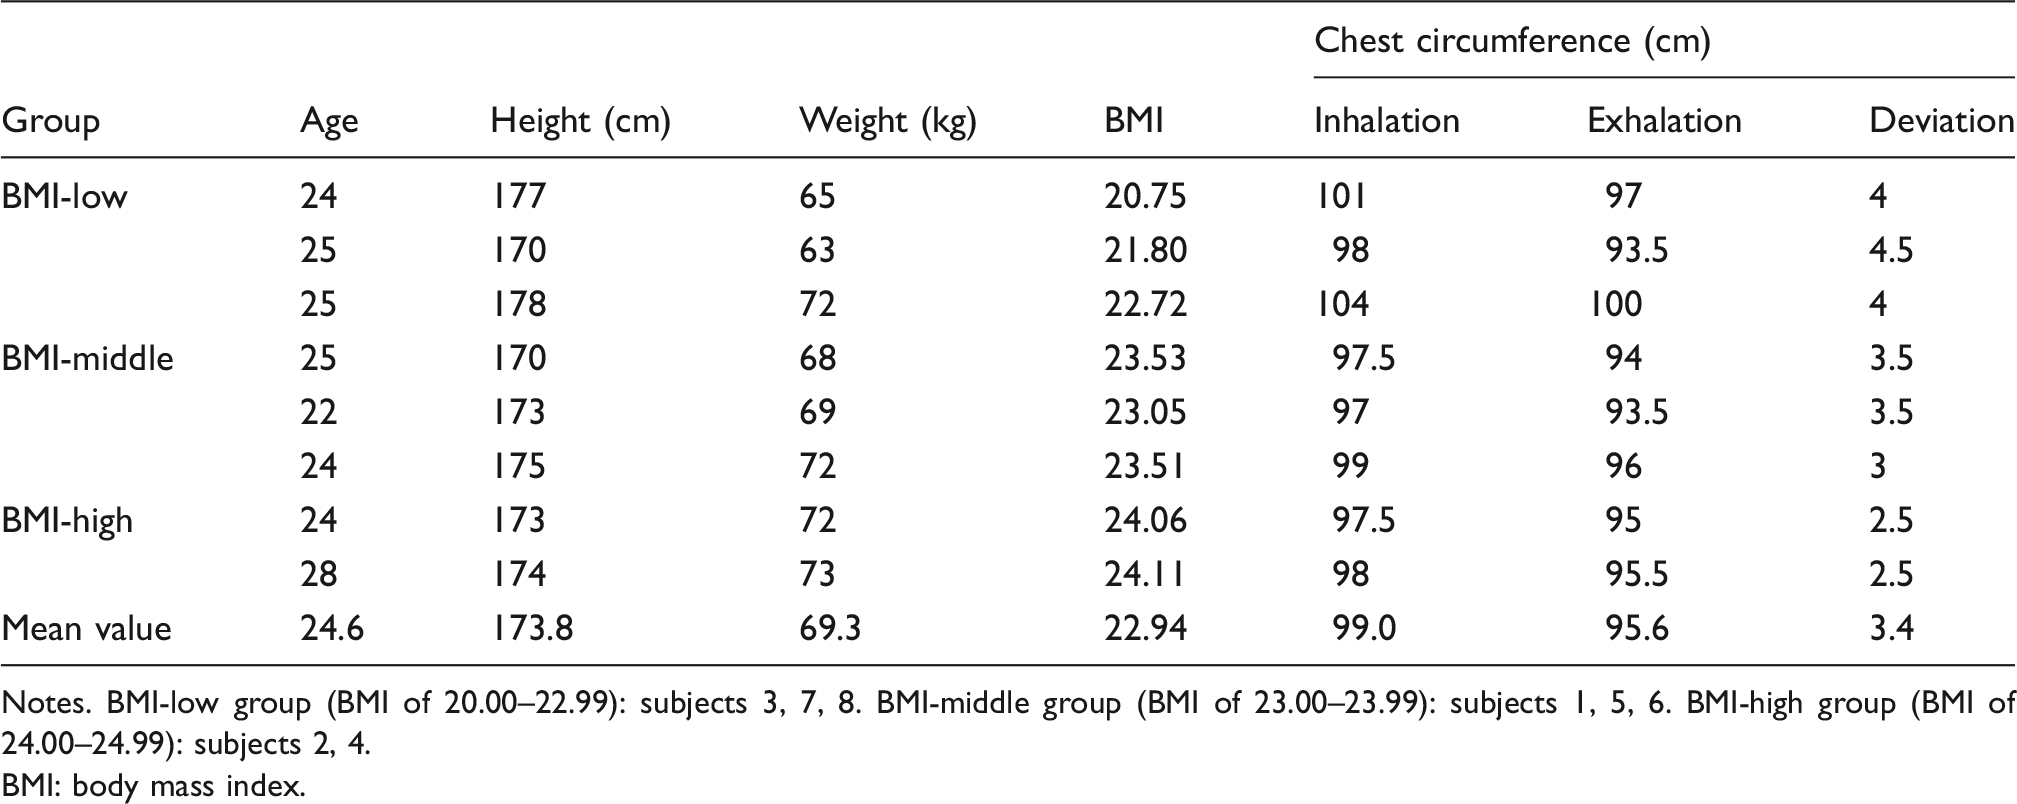
Notes. BMI-low group (BMI of 20.00–22.99): subjects 3, 7, 8. BMI-middle group (BMI of 23.00–23.99): subjects 1, 5, 6. BMI-high group (BMI of 24.00–24.99): subjects 2, 4.
BMI: body mass index.
The subjects were classified into three groups according to the level of thoracic muscle development and body mass index (BMI), which is a measurement of a person's leanness or corpulence based on their height and weight and is intended to quantify the tissue mass. Specifically, the value obtained from the calculation of the BMI is used to categorize people as underweight, normal weight, overweight, or obese, depending on what range the value falls between. People with lower BMIs have less fat and more muscles. 28 Subjects that had deviations of 4–4.5 cm between inhalation and exhalation and had a BMI between 20.00 and 22.99 were categorized as “BMI-low”; those that had deviations of 3–3.5 cm between inhalation and exhalation and had a BMI between 23.00 and 23.99 were classified as “BMI-middle”; those that had deviations of 2.5 cm between inhalation and exhalation and had a BMI between 24.00 and 24.99 were categorized as “BMI-high.” According to these classification criteria, each of the eight subjects was categorized in one of the three groups: subjects 3, 7, and 8 were categorized in the BMI-low group; subjects 1, 5, and 6 were categorized in the BMI-middle group; and subjects 2 and 4 were categorized in the BMI-high group.
Depending on the body type of the subjects, the chest circumference can differ and, accordingly, the pressure of the chest belt can be varied. The fastening of the chest belt was classified into three stages of size adjustment, namely large, medium, and small and, to control the pressure, the size was adjusted at intervals of 2.5 cm to account for variations in chest circumference of the subject group.
Measurement and analysis
For the experiments, we used the MP150 and the SS5LB (BIOPAC Systems, Inc.), and the analysis of the measured data was performed with the software AcqKnowledge 4.2. Measurements were obtained simultaneously with the proposed respiration rate sensor belts and the SS5LB, which is a certified respiration rate sensor, and the measurements of the two sensors were compared. The correlation between the measurements was evaluated using the correlation coefficient tool in the AcqKnowledge 4.2 software. The correlation coefficient, often called the cross-correlation coefficient, is a measure of the quality of a least squares fitting to the original data. To define the correlation coefficient, we first consider the sum of the squared values SSXX, SSXY, and SSYY, which are simply unnormalized forms of the variances and covariance of X and Y given by Equation (3).

The analysis was carried out as follows. Firstly, the morphology and size of the sensing signal were analyzed based on the measurement data. Secondly, the sensing reliability of three respiration rate sensor types, namely the no-filler, 3D hard, and 3D soft types, was analyzed by comparing their measurements with the those of the SS5LB, and the reproducibility and baseline drifts of the sensors’ measurements were evaluated by taking and comparing repeated measurements. Then, the measurements were further analyzed using the statistics in the R program. To compare the performances of the different sensor types, nonparametric statistics were considered because a normal distribution of the data could not be assumed owing to the small sample size. For this, the Kruskal–Wallis test, Bonferroni test, which is a nonparametric post-hoc analysis, and Mann–Whitney U-test were performed. Thirdly, the baseline drift in the sensed signals through the two types of 3D sensors was quantitatively compared with that in the reference signals from the SS5LB by calculating the slopes between the starting points of the signals.
Results and discussion
Amplitude and morphology of the sensing signal
Mean amplitudes of the sensing signal depending upon the sensor type
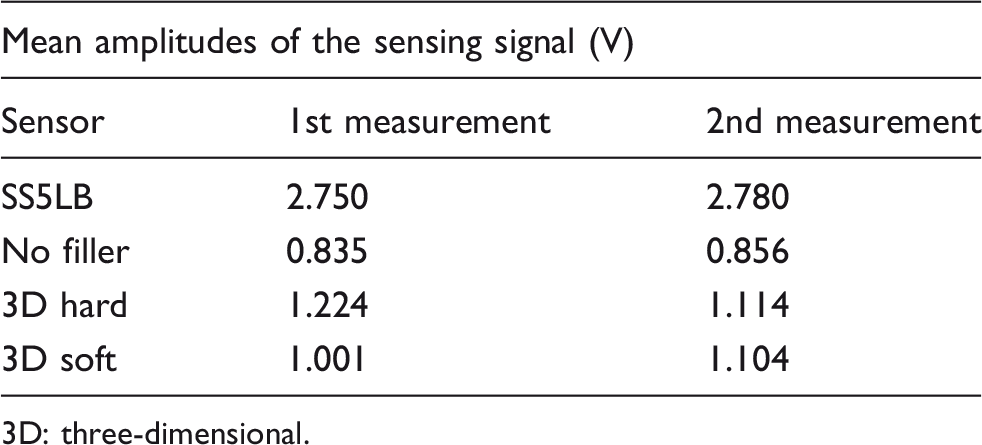
3D: three-dimensional.
The signal morphology (obtained by AcqKnowledge 4.2) of each of the three types of respiration rate sensors from the BMI-low group among the subject groups is presented in Figures 11–13. The SS5LB was set so that the signal intensity increases during inhalation and decreases during exhalation, whereas the proposed sensors were set so that the signal intensity decreases during inhalation and increases during exhalation. Hence, to easily compare the signals obtained from each of the three developed sensor types with the reference signals from the SS5LB, the reference signals were reversed in Figures 11–13.
Morphology of the no-filler type sensor signal: first measurement (a) and second measurement (b). The signal graph of the reference signal (from the SS5LB) is reversed. Morphology of the three-dimensional (3D) hard type sensor signal: first measurement (a) and second measurement (b). The signal graph of the reference signal (from the SS5LB) is reversed. Morphology of the three-dimensional (3D) soft type sensor: first measurement (a) and second measurement (b). The signal graph of the reference signal (from the SS5LB) is reversed.


In the case of the no-filler type sensor, the clarity of the signal is apparently poorer than those of the two 3D sensor types, and the morphological consistency with the SS5LB signal is also inferior. The relatively higher clarity of the sensed signals from both 3D type sensors compared to that from the no-filler type sensor is attributed to the higher contact stability in the two 3D type sensors. This means that when the elastic open-and-close sensor-supporting module smoothly moves according to the 3D thoracic movement during inhalation, the consequent contact of the paired sensors facing each other can be more stable in the 3D type than in the no-filler type sensors, because the former can be in more close contact with the body.
Sensing reliability of the different respiration rate sensor types
Consistency between the actual and the sensed respiration rates
As stated above, one respiration cycle corresponds to the peak of one inhalation, in which the thorax is expanded, to that of the next inhalation, and the respiration rate is the number of respiration cycles per minute (respiration/min). The respiration rate of normal adults at rest has been reported to be 16–18 respiration/min. In this study, the respiration rate was measured for two periods of 30 s.
Consistency between the actual and measured respiration cycles
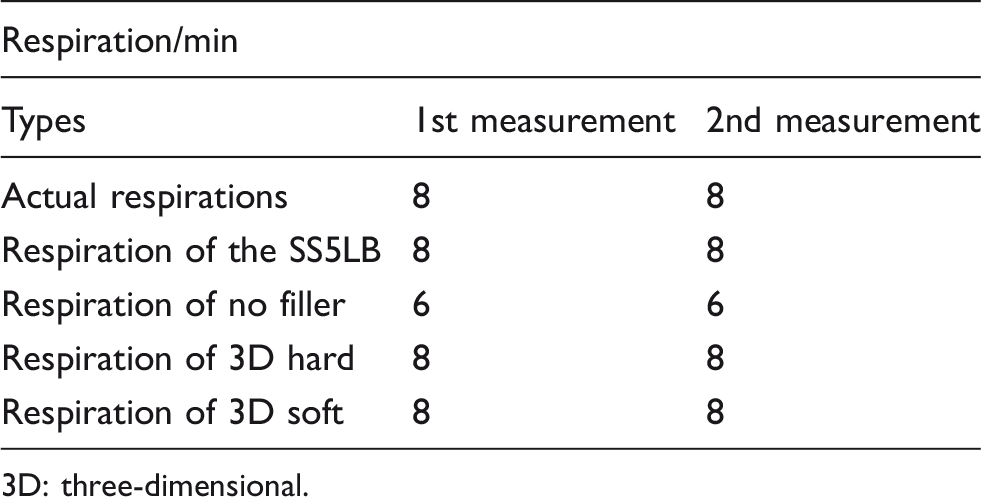
3D: three-dimensional.
Sensing reliability of the proposed sensors in terms of consistency with the SS5LB
To derive the sensing reliability of the respiration rate sensors, the cross-correlation coefficients of their measurements with those of the SS5LB were analyzed. The type of sensor that showed the highest consistency with the SS5LB was identified. The correlation coefficients of the first measurements and the second measurements are presented in Figure 14.
Correlation coefficient of the measurements of the proposed three-dimensional (3D) type sensors and the SS5LB: first measurement (a) and second measurement (b).
Although, as reported in the previous section, the number of respiration cycles obtained from the SS5LB and the two 3D sensors were consistent with the actual number of respirations, the correlation coefficients with the SS5LB were low for both 3D sensor types, which is attributed to the difference in their sensing mechanisms. As mentioned in the Sensing reliability of the different respiration rate sensor types section, the SS5LB signal intensity increases during inhalation and decreases during exhalation, whereas that of the proposed sensors decreases during inhalation and increases during exhalation. Hence, there is a low correlation between the measurements of the SS5LB and those of the 3D sensors.
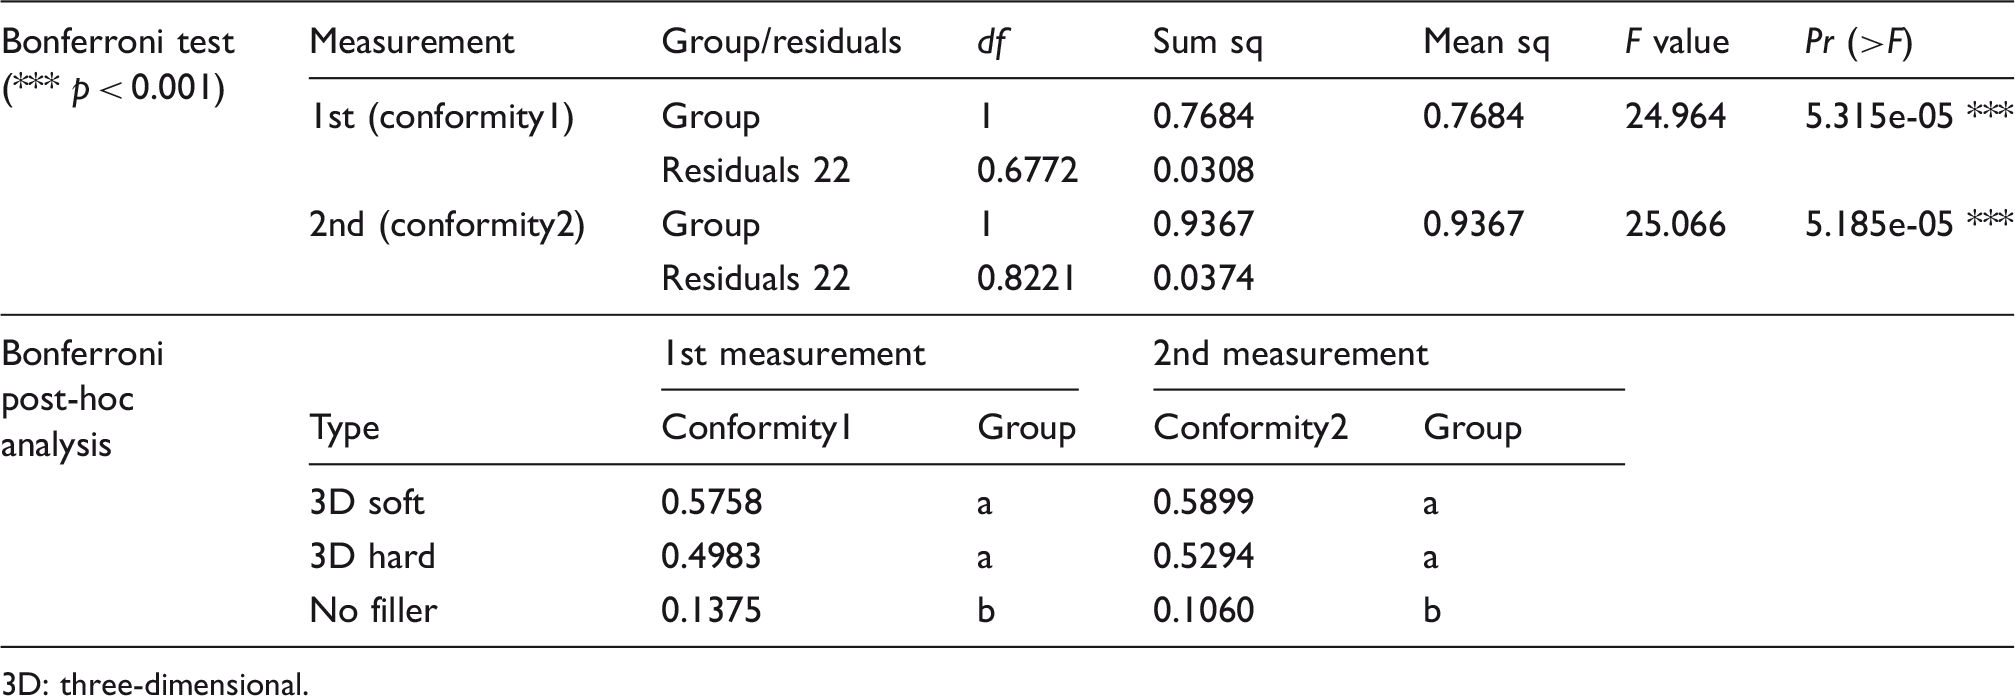
The analysis of the average respiration rate in each subject showed that the 3D soft type had the highest correlation coefficients of the first and second measurements (0.576 and 0.590, respectively), followed by the 3D hard type (0.498 and 0.529, respectively). The no-filler type sensor showed relatively low correlation coefficients compared with the two 3D types (0.137 and 0.106 for the first and second measurements, respectively) (Figure 14). As explained in Figure 8, in the respiration sensors fabricated in this study, the two sensors facing each other contact as the two barriers open to both sides owing to thoracic expansion during inhalation, whereas they separate as the two barriers return to the center and both sides are blocked owing to the contraction of the thorax during exhalation. The efficiency of the elastic open-and-close structure of the supporting module was observed to be higher for the 3D type sensors than the no-filler type sensor. Furthermore, it was observed that the 3D soft type sensor forms a more appropriate combination with the elastic open-and-close sensor-supporting module than the 3D hard type sensor (and no-filler type sensor). This indicates that the 3D soft type sensor has a larger contact with the body owing to the flexible adjustment of the sensor according to thoracic movements during inhalation and, consequently, contact between the paired sensor layers facing each other is greater.
Next, to investigate the statistically significant differences in the reliabilities of the respiration rate sensor types, the Kruskal–Wallis test was performed using the R program on the correlation coefficients of the eight subjects. The independent variables for this test were the three types of sensors, and the value of N was 16 in total, which included two sets of eight correlation coefficients of the first and second measurements on eight subjects. The obtained Kruskal–Wallis chi-squared values were 13.905 (p-value of 0.001) and 14.105 (p-value of 0.001) for the first and second measurements, respectively. Therefore, the differences in the consistency with the SS5LB (sensing reliability) of the proposed types of sensors were significant at the significance level of p < 0.001.
Results of Bonferroni test (p-value adjustment method) and Bonferroni post-hoc analysis
3D: three-dimensional.
As mentioned above, people with lower BMI values have less fat and more muscles. 28 Subjects whose muscles were more developed were grouped into the BMI-low group (subjects 3, 7, 8), those whose muscles were moderately developed were grouped into the BMI-middle group (subjects 1, 5, 6), and those whose muscles were less developed were grouped into the BMI-high group (subjects 2, 4) (Table 3).
For comparison between the somatotype groups, the correlation coefficient of the first and second measurements of each type of sensor with those of the SS5LB were first averaged. Then, the measurement-averaged correlation coefficients of the 3D hard and soft type sensors were averaged again and presented as “3D types” in each subject case in Figure 15. This final average was compared with the correlation coefficients of the no-filler type sensor. In the case of the BMI-low group (subjects 3, 7, and 8), deviations in the correlation coefficients between the no-filler type and the 3D types were large (0.486, 0.796, and 0.525, respectively). In the case of the BMI-middle group (subjects 1, 5, 6), deviations in the correlation coefficients between the no-filler type and 3D types tended to be smaller than those of the BMI-low group (0.296, 0.299, and 0.535, respectively). In the case of the BMI-high group (subjects 2, 4), the deviations were the smallest among the three BMI groups (0.296 and 0.178, respectively) (Figure 15).
Deviations in the correlation coefficients between no-filler type and three-dimensional (3D) type sensors depending upon the somatotype groups. Group A: body mass index (BMI)-low group (subjects 3, 7, 8); group B: BMI-middle group (subjects 1, 5, 6); group C: BMI-high group (subjects 2, 4).
According to the respiration mechanism, 11 the respiration rate signal can be measured at the center of the chest. However, the center of the chest is highly variable, depending on the habitus. More developed thoracic muscles cause greater fluctuations in the chest contour at the center front in the sagittal plane, due to the deepened valley between the protruded right- and left-hand chest muscles. Accordingly, the more deviated chest contour in the BMI-low somatotype group probably leads to a lower contact sensitivity between the chest surface and the respiration sensor in the case of flat type sensors, such as the no-filler type. On the other hand, such deviated chest contour in the BMI-low group has less influence on the contact between the chest surface and the sensor in the cases of the 3D type sensors. This results in the higher discrepancy in the cross-correlation coefficients between the no-filler type and 3D type sensors in the BMI-low group subjects compared to that in the other two somatotype groups.
In other words, because the shape of the thorax and habitus influenced the respiration rate measurements, the accuracy of the sensors was improved by the 3D structure of the sensor.
Reproducibility
For testing the reproducibility according to repeated measurements, the changes in the signals between the first and second measurements obtained by the respiration rate sensors were analyzed. In practice, it is impossible for a human to breathe with the same intensity all the time, and the difference in the intensity of the breaths taken by the subjects was considered to be an intervening variable in the evaluation of the sensing reproducibility. Therefore, the correlation coefficients with the SS5LB (sensing reliability) of each measurement set were used instead of the raw respiration data, as the parameter for the reproducibility analysis.
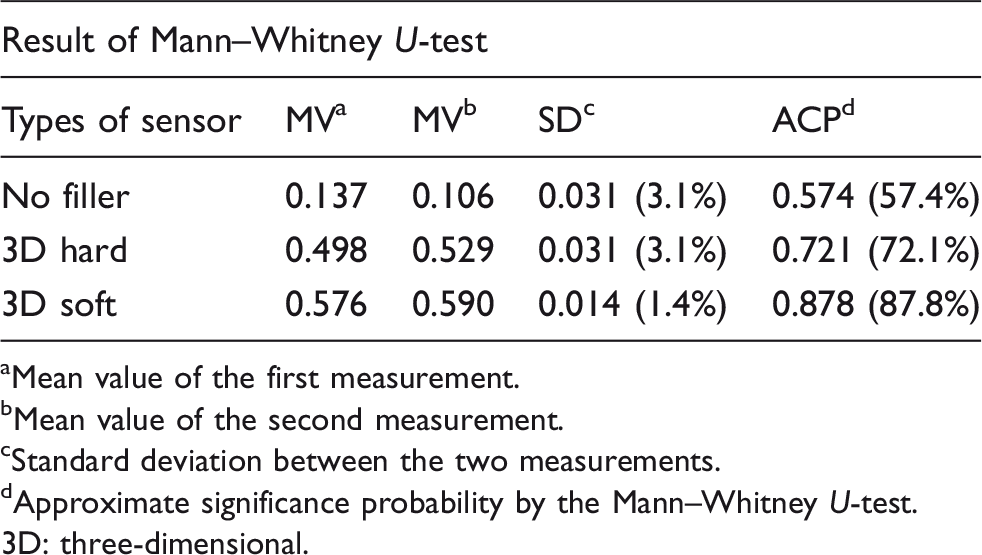
Based on the average values and standard deviations of the correlation coefficients, the differences in the signals between the first and second measurements were found to be 0.031 for the no-filler and 3D hard types, and 0.014 for the 3D soft type; in percentage terms, the differences were 3.1% and 1.4%, respectively, indicating that the three types of sensors have high reproducibility of repeated measurements.
Reproducibility of the sensing measurements
Mean value of the first measurement.
Mean value of the second measurement.
Standard deviation between the two measurements.
Approximate significance probability by the Mann–Whitney U-test.
3D: three-dimensional.
Baseline drift
The respiration signals were measured simultaneously with each of the three developed sensors and the SS5LB. As mentioned in Commercialization and certified respiration rate sensors section, the developers of many existing strain-gauge based respiration sensors, including those of the SS5LB, recommend using this device to measure only slow respiration patterns, in order to maintain linearity and minimal baseline drift. 25 The 3D respiration rate sensors developed in this study measure the respiration rate from the degree of opening and closing of the sensor rather than the changes in the length of the sensor, which could be a cause of baseline drift due to the hysteresis of the sensor.
To test this, the baseline drifts in the proposed 3D respiration rate sensors were quantitatively analyzed and compared with that of the SS5LB. To this end, the slopes between the starting points of the respiration rate signals in the three types of sensors and those in the SS5LB were calculated, and the baseline drift trend was analyzed according to the three groups of habitus. The no-filler type, whose correlation coefficients (sensing reliability) were the lowest among the three types of sensors, was excluded from the analysis. A total of eight signals, four from the first measurements and four from the second measurements, from each 3D type sensor, and four signals from the SS5LB, which were measured simultaneously, were visualized in one graph to calculate the slope between the starting points of inhalation of each respiration cycle. For the comparison of the slope, the numerical values of the beginning point of the first inhalation (height on the vertical axis) were matched for each of the sets of the respiration rate sensors (solid lines in the graph) and the SS5LB (dotted lines in the graph). The fluctuation graphs of the respiration rate, indicating the degree of average baseline drift in the BMI-low group, BMI-middle group, and BMI-high group, were presented (Figure 16). When baseline drifts occur, the slope of the starting point of respiration (inhalation) between each set gradually increases. The results show that the slope connecting the starting points in the respiration signals from the SS5LB (dotted line) was steeper than that of the starting points of respirations of the proposed sensors (solid line). The fluctuation in the slope of the starting point of respiration obtained from the 3D type sensors was generally small. This trend was observed in all four sets of signals of the first and second measurements, in both 3D type sensors. All three BMI groups showed a similar trend of baseline drift (Figure 16).
Average baseline drift in the body mass index (BMI)-low group, BMI-middle group, and BMI-high group. NO.1: first measurement; NO.2: second measurement; 3D: three-dimensional.
Respiration rate sensors using the strain-gauge method are contracted and expanded as the subject inhales and exhales, respectively; after repeated inhalation and exhalation, the sensors may experience baseline drifts. However, the above results show that the proposed 3D sensors experience significantly lower baseline drifts compared to existing respiration rate sensors.
Conclusion
We designed new respiration rate sensors with 3D structures built in the sensor-supporting module with an elastic open-and-close type module that overcomes the two major limitations in respiration rate sensing.
The fundamental sensing ability of the three types of respiration rate sensors proposed this study was evaluated and compared with that of the reference sensor SS5LB, in terms of amplitude and morphological clarity of the sensing signals. In the two 3D type sensors, the signals were clearer, and the morphological consistency with the SS5LB signals was higher than those of the no-filler type. The sensing reliability of each type of sensor was analyzed by comparing their signals with actual respiration rates, and then by calculating the consistency (cross-correlation coefficient) with the SS5LB signals. The comparison analysis against the actual respiration rate revealed that the SS5LB and two 3D type sensors took reliable measurements. The no-filler type sensor took measurements different from the actual respiration rates owing to its decreased sensing efficiency. The consistency of the signals of the SS5LB and those of the two types of 3D sensors was higher than those of the no-filler type sensor. The sensing reliability of the no-filler type sensor varied depending on the wearer’s habitus, whereas that of the 3D soft type was observed to be high for all somatotypes. That is, the shape of the thorax and habitus influenced the respiration rate sensing, and the accuracy of the sensing was observed to be generally improved by the 3D structure of the sensors. The reproducibility of the proposed sensors was examined in terms of the difference between the first and second measurements. The analysis revealed that the 3D soft type sensor had the highest reproducibility among the three types of sensors. The degrees of baseline drift in the respiration signals from the two types of 3D sensors were compared with that from the SS5LB. The comparison showed a reduced baseline drift across the measurement sets in the two types of 3D sensors. The low baseline drift in the proposed 3D sensors gives them high accuracy. Among the three types of sensors proposed in this study, the 3D soft type was determined to be the most appropriate for respiration rate sensing. In particular, the 3D soft sensor overcomes the limitations of existing TRSs based on strain gauges without compromising the wearing comfort.
In this study, we examined the validity of the new types of 3D textile sensors with a sensor-support module having an elastic open-and-close structure for respiration rate sensing in the non-moving state. In the future, the sensing performance of the 3D textile sensors proposed in this study will be investigated during body movements and will be compared to a wider range of strain-gauge based sensors in our following research. In this study, we examined a small number of subjects and performed a small number of repeat measurements. In future studies, the number of subjects and readings should be increased to increase the reliability of the result.
Footnotes
Declaration of conflicting interests
The authors declared no potential conflicts of interest with respect to the research, authorship and/or publication of this article.
Funding
The authors disclosed receipt of the following financial support for the research, authorship, and/or publication of this article: This work was supported by a grant to Hanwha Systems funded by the Agency for Defense Department (UC170020ID). Also, the study was supported by the Brain Korea 21 Plus Project of the Department of Clothing and Textiles, Yonsei University in 2019.
