
Abstract
Women’s body shapes often undergo significant transformations in their 30s due to factors such as aging and childbirth. However, clothing manufacturers continue to rely on a body type that corresponds to standard A in the national sizing system to set clothing sizes, making it increasingly challenging for women in this age group to find well-fitting garments. Most existing body shape and clothing-fit research encompasses broad age ranges; limited studies specifically target women in their 30s. This study investigates the fit of standard Chinese medium-sized (M-sized) clothing for women in China aged 30–39 who wear M-sized tops. Findings revealed substantial alterations in the participants’ body characteristics compared with the standard M-size: participants exhibited significantly larger waistlines and increased abdominal and hip circumferences. Following the national standard for body type classification, which is based on the bust-to-waist difference, the majority of the sample population leans toward the national standard's B body type. Virtual try-on simulations demonstrated that existing garments aligned with the standard body type but do not provide an optimal fit for women with these altered proportions. Results underscore the necessity to reassess current sizing standards to accommodate evolving body shapes. This study serves as a scientific foundation for apparel size design, offering valuable insights into improving clothing to meet consumer needs.
Keywords
As women enter their 30s, several physiological indicators begin to change. Metabolism gradually slows, and the distribution of body fat shifts significantly. Childbirth-related physiological changes affect body measurements and proportions. Hormonal fluctuations and a declining metabolic rate further promote subcutaneous fat accumulation. Compared with women in their 20s, those in their 30s develop a more mature body contour with noticeable changes in width, thickness, and circumference. 1 In addition, body type diversity becomes more pronounced. As women approach their late 30s, changes in body measurements peak. Among women of average height, upper-body obesity is most prevalent in their late 30s. 2 As age increases, the circumference and thickness of the bust, waist, abdomen, and hips show a clear upward trend. 3 These physiological changes affect body shape and directly influence clothing preferences and requirements of women. At this stage of life, achieving a good fit is crucial when choosing garments. 4
The standard clothing size system in China, GB/T1335.2-2008, 5 classifies body shapes based on bust-to-waist difference into four types: Y (slim type: bust–waist difference of 19–24 cm), A (standard type: bust–waist difference of 14–18 cm), B (slightly plump type: bust–waist difference of 9–13 cm), and C (full-figured type: bust–waist difference of 4–8 cm) . However, in practice, as the basis for producing clothing sizes, most clothing companies focus only on the body type corresponding to standard A. Clothing sizes of women are typically labeled as S, M, L, and XL, and customers select garments based on height and bust measurements. Size M (160/84A) represents the standard adult body measurement size. The notation is 160/84A. This single-size classification often fails to accommodate women across age groups. Adult female body shapes vary significantly in structure and characteristics. In fact, not all women fall into the standard A body type category. Even when companies follow the same size standards in garment manufacturing, product dimensions often vary across brands. 6 Consequently, consumers struggle to find well-fitting products based solely on size specifications. Many brands struggle with smaller-than-standard sizes 7 and limited-size options. 8 For women in their 30s, whose body shapes change significantly, often overlooks individual differences while attempting to accommodate a broad range of body types. Consequently, the clothing companies' size designs fails to meet the practical needs of this demographic, making it harder for women in their 30s to find well-fitting clothing.
To ensure an optimal fit, apparel size charts must accommodate diverse bodies. 9 Manufacturers must consider their target customers’ body shapes when developing size specifications. 10 However, many brands and retailers struggle to accurately address consumer body shape diversity. Body shape significantly impacts clothing fit, 11 and analyzing female body variation is essential for clothing design and size classification.
Despite their significance in the Chinese consumer market, size systems often overlook the unique characteristics of women in their 30s, who may need a more precise sizing system to meet specific clothing requirements. A deeper understanding of body shape in this age group is essential for designing appropriate clothing patterns and size specifications. However, existing research lacks detailed segmentation of this group. For instance, some studies classify women aged 18–51 as a single group, 12 overlooking subtle age-related body shape differences. Body shape characteristics vary significantly across life stages, yet most Chinese researchers focus on women aged 18–25.13,14 However, as women in this age group are still developing, their body shape classifications have limited applicability. Findings often fail to reflect the body shapes of women who now form a substantial segment of the Chinese apparel market. Some studies classify women aged 29–43 as middle-aged when analyzing body shape characteristics, 3 but women in their 20s, 30s, and 40s often exhibit distinct body shape differences. Lumping these age groups under “middle-aged” may oversimplify analyses and obscure unique characteristics. Groups must be analyzed separately to understand age-related body shape differences better. While existing research has extensively classified and analyzed body shapes in Chinese women, most studies cover broad age ranges and lack detailed investigations into specific age groups. Specifically, studies focusing solely on women in their 30s remain scarce. Furthermore, beyond age group segmentation, existing research primarily emphasizes macro-level classifications of body shapes across different regions, 15 genders, 16 and special populations. 17 Studies specifically examining body shapes of women about clothing sizes are notably lacking. This gap presents challenges in achieving precise size matching in clothing production.
Body classification is the precondition for size designation design. 18 Individuals with identical clothing sizes but different body shapes may experience notable variations in fit and visual appearance, 19 underscoring the need for further research. This study classifies the body shapes of women in their 30s who wear size M tops. Focusing on this group allows for a more precise analysis of body shape variations. This approach captures body shape trends and complexities, offering a more accurate basis for apparel size classification. Moreover, size M, a standard medium size, has a high market demand. It represents a large consumer group, serving as the standard size for sample garment production in China. This study aims to validate the adaptability of current women’s clothing sizes in China by subdividing the body shapes of women who wear size M tops. Therefore, in the present study’s experiment, fit differences among garments of the same style and size from different brands across various body shapes were assessed using 3D virtual fit evaluation technology. Garment fit evaluation is crucial in apparel development and sales. An accurate fit evaluation method can reduce apparel development costs and online return rates. 20 Previous studies primarily relied on the subjective perception of wearers or the experience-based judgments of experts. Virtual try-on technology enables a garment fit assessment without needing physical wear. 21 Virtual fit evaluations reduce costs and time while improving repeatability and accuracy.22,23 Virtual try-on and 3D body-scanning technologies are efficient and reliable tools for visual fit analysis. 24 The findings can assist apparel companies in adjusting and optimizing their sizing standards to better meet market needs, thereby improving product development and contributing to a more precise alignment of apparel sizing with consumer demand.
Method and procedures
Body shape classification
Research subjects and materials
This study utilized 3D anthropometric measurement methods to collect human body data in 2024. The research participants were limited to Chinese women aged 30–39 (born between 1985 and 1994) who primarily wore size M tops.
Measurement items
This study primarily examined the characteristics of the female upper body shape, focusing on anthropometric measurements of the torso. Circumference is a crucial parameter for classifying trunk shapes in women, while height is an essential variable for determining garment fit and customer satisfaction. 25 Among these, bust, waist, and hip circumferences are the most critical dimensions for clothing assessment. 26 Based on these considerations, this study focused on key areas of the female torso. Six measurement variables affecting the structural characteristics of the female upper body were identified: height, shoulder width, bust, waist, hip, and abdominal circumferences.
Research method
Data preprocessing
Factors such as lighting conditions, subject posture, and clothing can introduce errors during 3D body measurement. Therefore, a preliminary descriptive analysis of the measurement data was conducted to identify and remove anomalies caused by measurement inaccuracies. To ensure data representativeness and reliability, descriptive statistical analysis was performed on each variable to detect outliers. Based on the box plot analysis’ results, in the dimension of bust girth, two significant outliers were identified that deviated considerably from the standard M-size measurements for female bust circumferences; therefore, these two samples were excluded. Ultimately, 175 samples were retained for further analyses.
Descriptive statistical analysis of body shape variables
Descriptive analysis involves summarizing the fundamental characteristics of the sample data. This examines sample variables’ numerical distribution to assess overall data properties. Descriptive statistics were computed for height, shoulder width, bust, waist, abdominal, and hip circumferences. These variables were analyzed using mean and standard deviations, skewness, and kurtosis (Table 1).
Descriptive statistics of body shape variables for Chinese women in their 30s (size M).
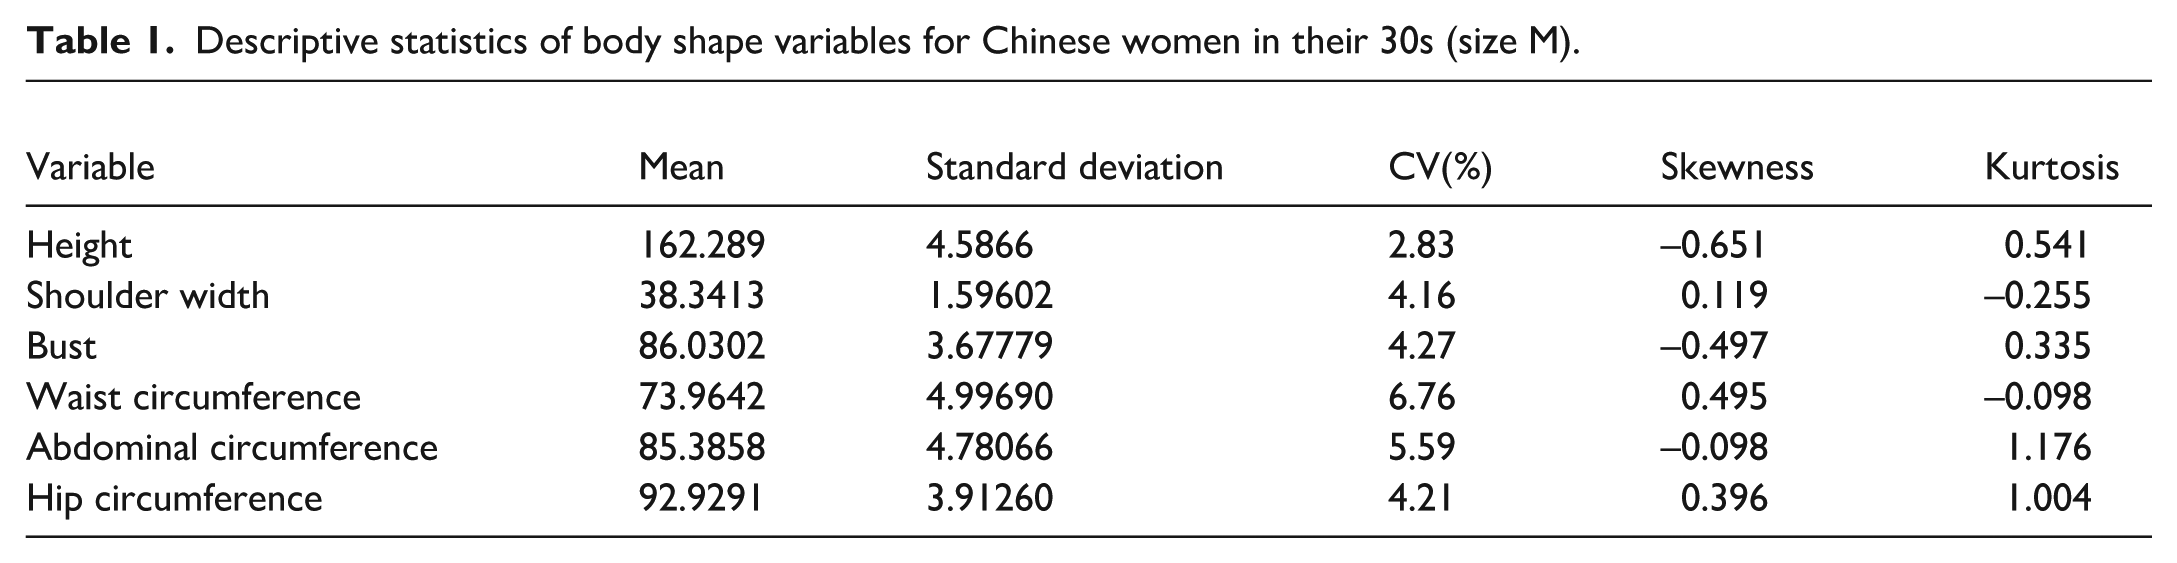
Analysis revealed that all variables had skewness values between 0 and 1, indicating approximate normality, and all variables had kurtosis values below 3, suggesting that their distributions are flatter compared to a standard normal distribution. The standard deviation of height was relatively large, indicating significant variability among women in their 30s wearing size M. Similarly, bust, waist, abdominal, and hip circumferences showed relatively large standard deviations, indicating notable variability. Conversely, shoulder width had a smaller standard deviation, suggesting lower variability. Based on the coefficient of variation, height showed the least variation, while waist and abdominal circumferences exhibited the most. A normality test confirmed that all variables approximately followed a normal distribution.
Comparison with standard M-size variables in the national standard
The sample body shape variables were compared with the national M-size standard defined in GB/T 1335.2-2008: Standard Sizing Systems for Garments - Women. Key upper-body dimensions for M-size (height, shoulder width, bust, waist, abdominal, and hip circumferences) from the national standard served as reference values. A one-sample t-test was conducted, and the results are given in Table 2. The findings indicate that the average upper body dimensions of the sample, including height, shoulder width, bust, waist circumference, abdominal circumference, and hip circumference, show significant differences compared to the M-size standard’s average dimensions. Furthermore, participants had greater height, bust, waist, abdominal, and hip circumferences than the M-size standard average.
One-sample t-test for mean values of the study sample and national standard M-size.
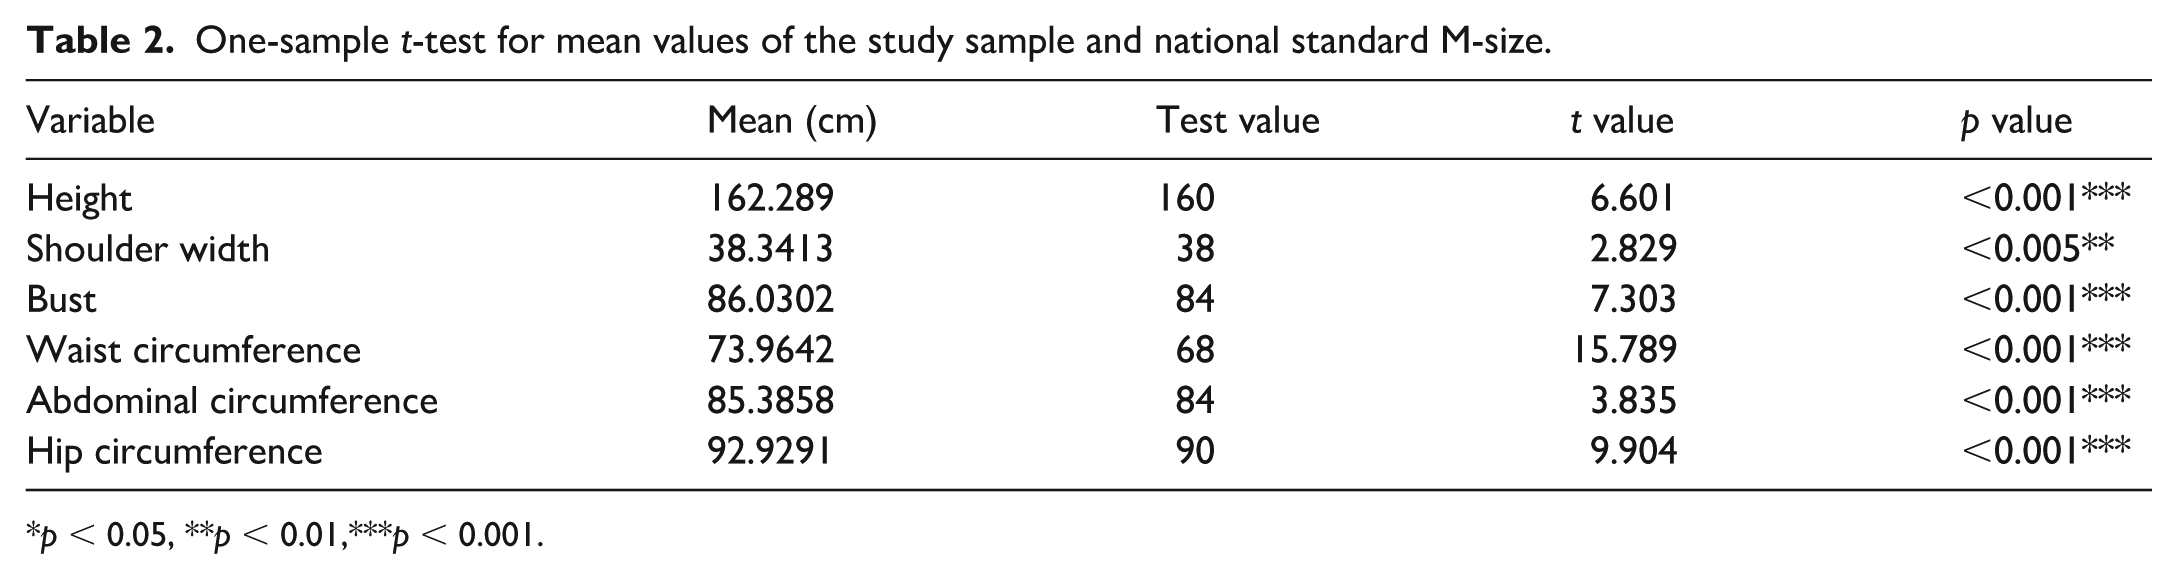
p < 0.05, **p < 0.01,***p < 0.001.
These results indicate that the participants’ body shape deviates from the standard M-size profile. Specifically, they were slightly taller and fuller than the standard model. However, their body shapes generally conform to the expected characteristics of M-sized women.
k-means clustering analysis
During the execution of k-means clustering analysis, the elbow method was employed in combination with practical classification results to determine the optimal number of clusters. 27 The “elbow point” on the curve, where the slope starts to flatten significantly, was selected as the optimal value for k; that is, the number of clusters. Once the rate of decrease becomes negligible, additional clusters no longer enhance clustering effectiveness. The graph shows that the curve flattens noticeably between four and five clusters, leading to selecting four as the optimal number. Figure 1 shows the k-value distribution.
Based on the final clustering results, the 175 research samples were grouped into four clusters. The final cluster centers define key indicators for each M-size body shape category, facilitating the identification of representative prototypes for each cluster.
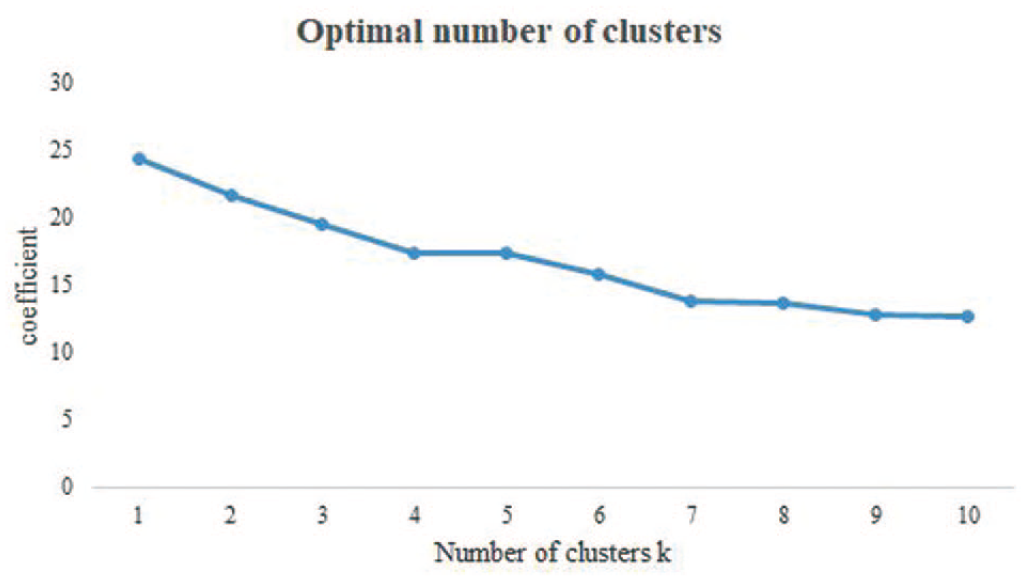
k-value distribution.
Figure 2 illustrates the clustering results, with similar body shape characteristics. Each cluster exhibited a high degree of consistency in body shape traits. This visual representation enhances the intuitive understanding of the body shape characteristics across groups.
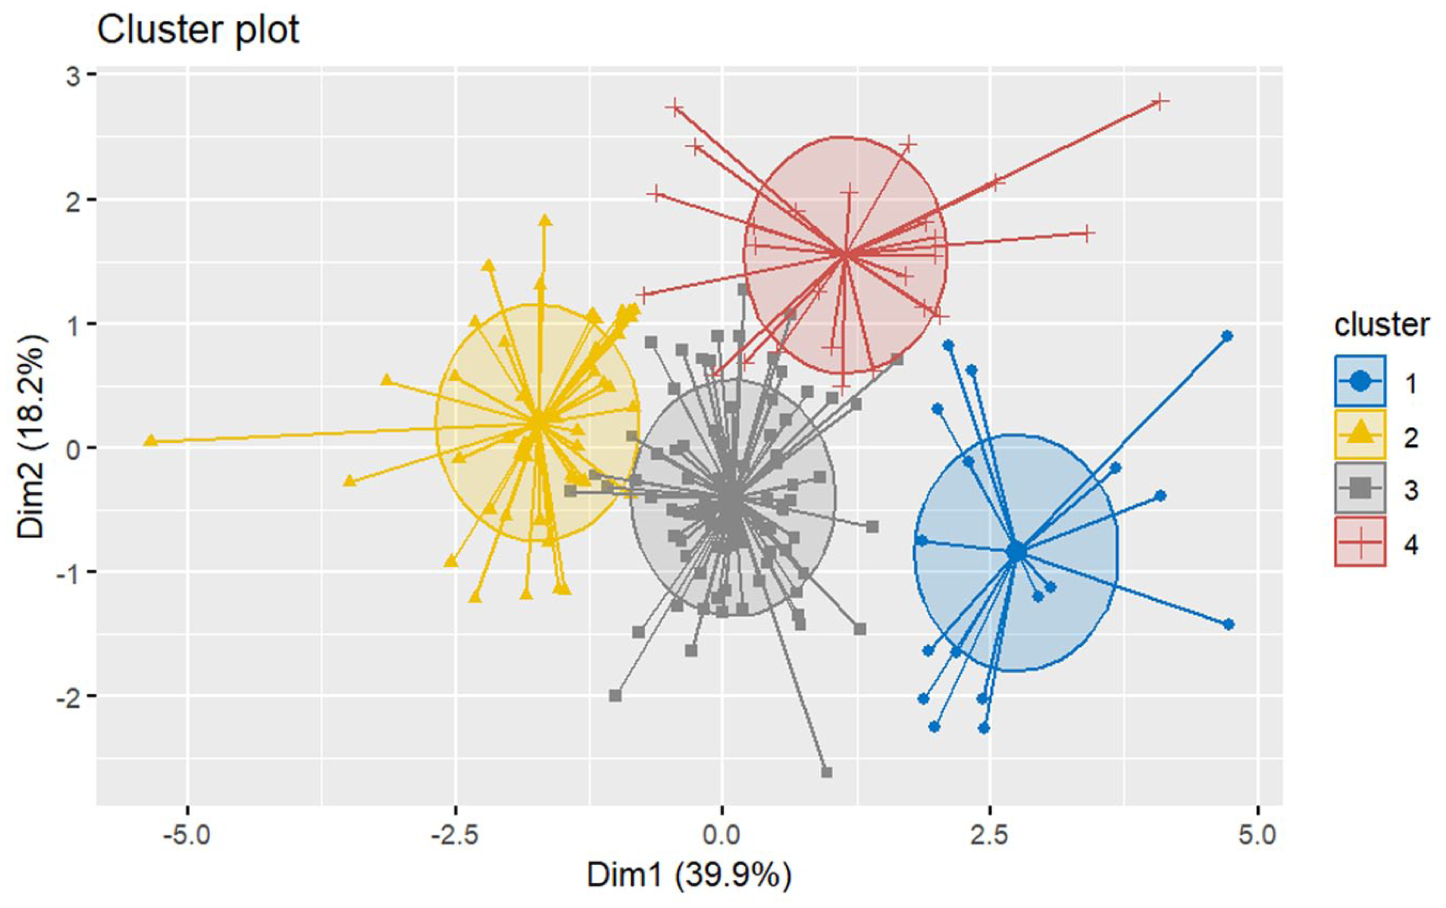
Body shape classification diagram.
Cluster result analysis and validation
Following the initial clustering, an analysis of variance (ANOVA) test was performed to validate the accuracy of the classification. The ANOVA results (Table 3) showed significant differences among the four clusters across six key variables. This supports the validity of classifying the data into four clusters.
ANOVA analysis.
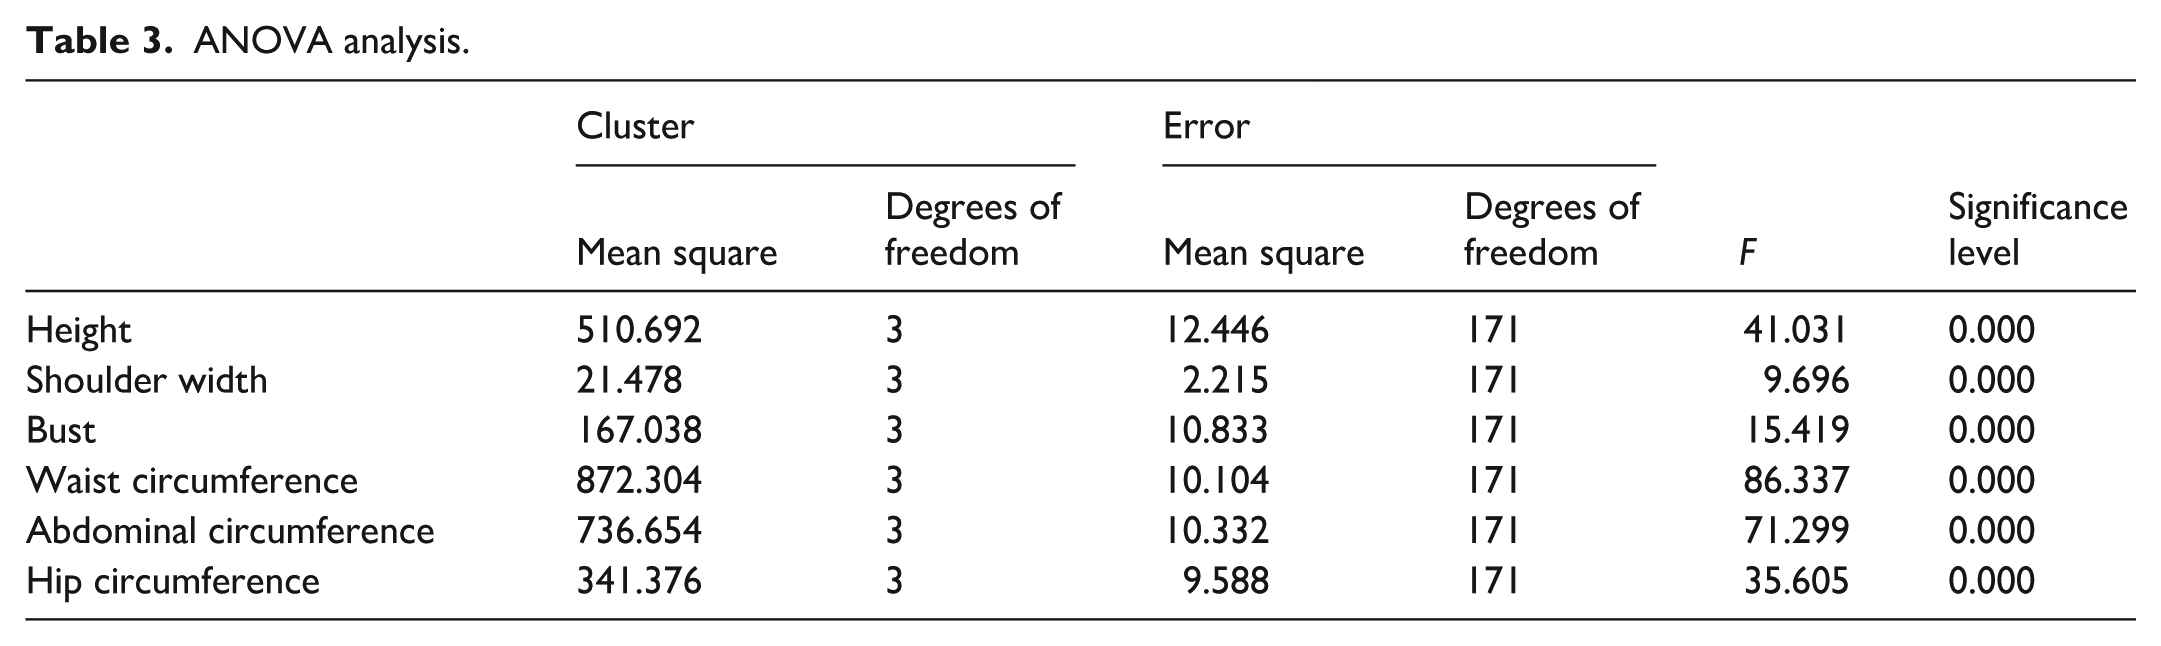
An ANOVA test was conducted to compare the four clusters, revealing significant differences in height, shoulder width, bust, waist, abdominal, and hip circumferences.
Body shape classification results
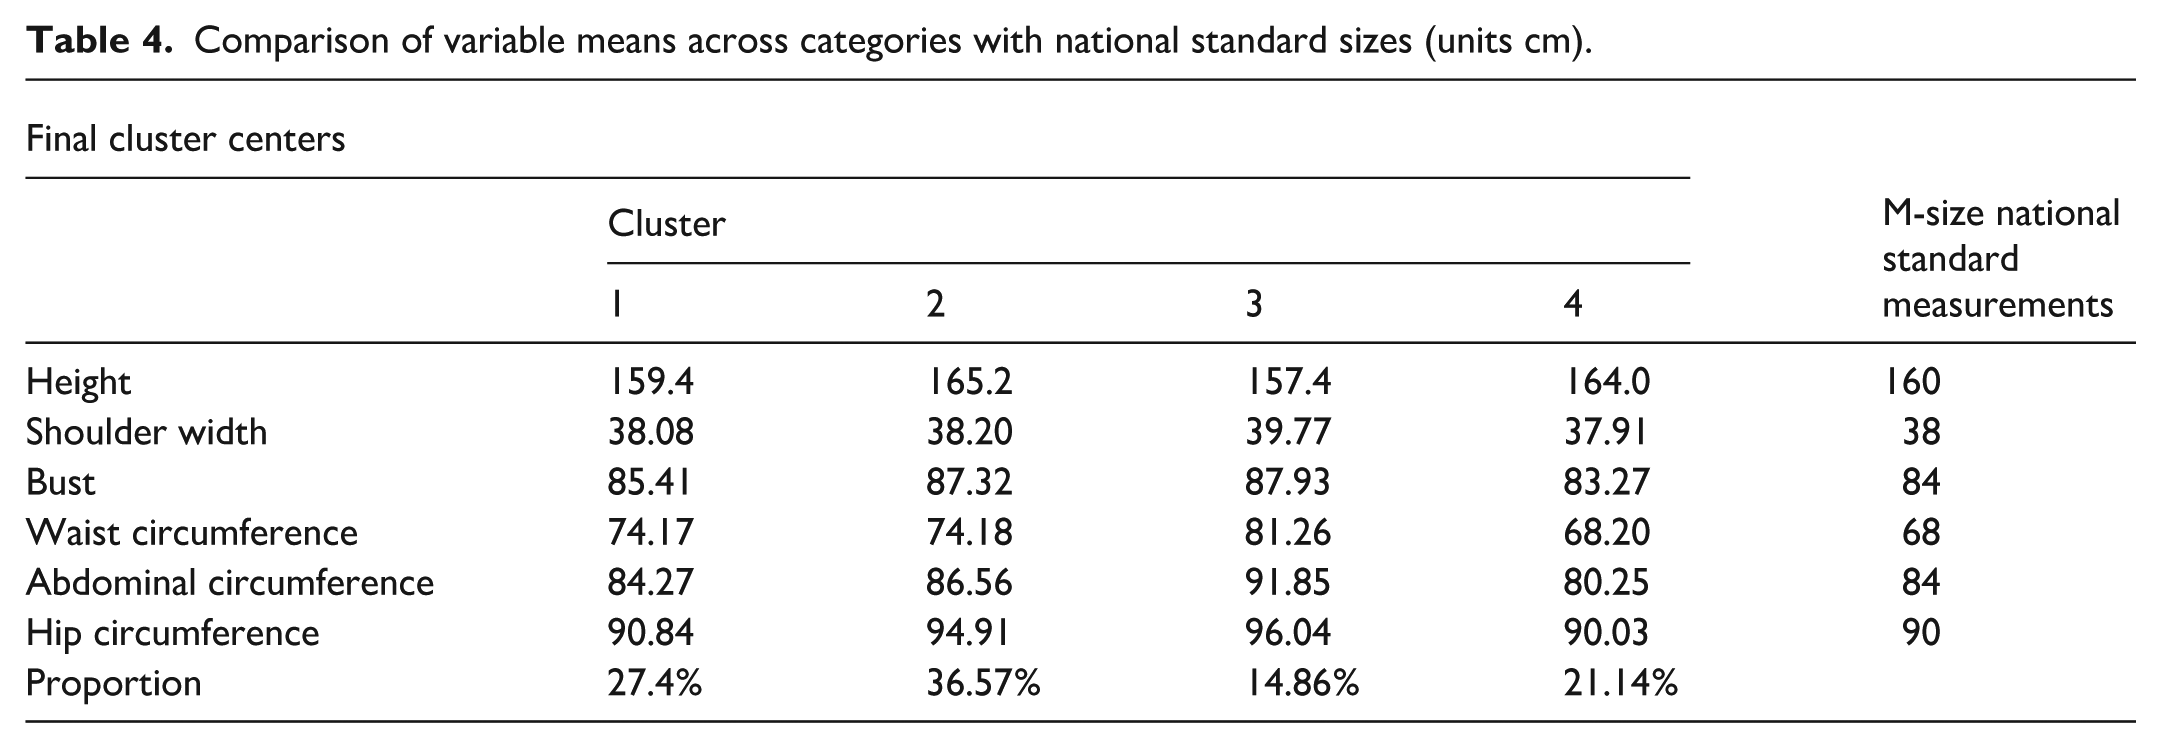
The final cluster center results classified the body shape distribution as follows: Category 1 includes 48 samples, accounting for 27.4%; Category 2 includes 64 samples, accounting for 36.57%; Category 3 includes 26 samples, accounting for 14.86%; and Category 4 includes 37 samples, accounting for 21.14%. The M-size body measurements for each category, derived from the final cluster centers, were compared with the standard measurements of M-size clothing in the Chinese women’s sizing standard. The comparison results are presented in Table 4. The cluster center values for each category represent the overall characteristics of the respective body shapes.
Comparison of variable means across categories with national standard sizes (units cm).
Moreover, to provide a more intuitive understanding of the differences among body types, 3D simulations of each category were conducted using CLO 3D virtual design software. These simulations were compared with a standard M-size body model. The cluster analysis identified the following characteristic differences for each body type.
Type I closely resembles the standard M-size, with only a slightly fuller waist circumference, while height and other measurements remain similar.
Type II is taller, with larger bust, waist, abdomen, and hip measurements, fitting the “tall or curvaceous” category.
Type III is shorter, with significantly larger bust, waist, abdomen, and hip circumferences, particularly in the waist and hips areas, classifying it as “short and curvaceous.”
Type IV is slightly taller than the standard M-size, with similar waist and hip measurements but smaller than other dimensions, fitting the “tall and slender” category.
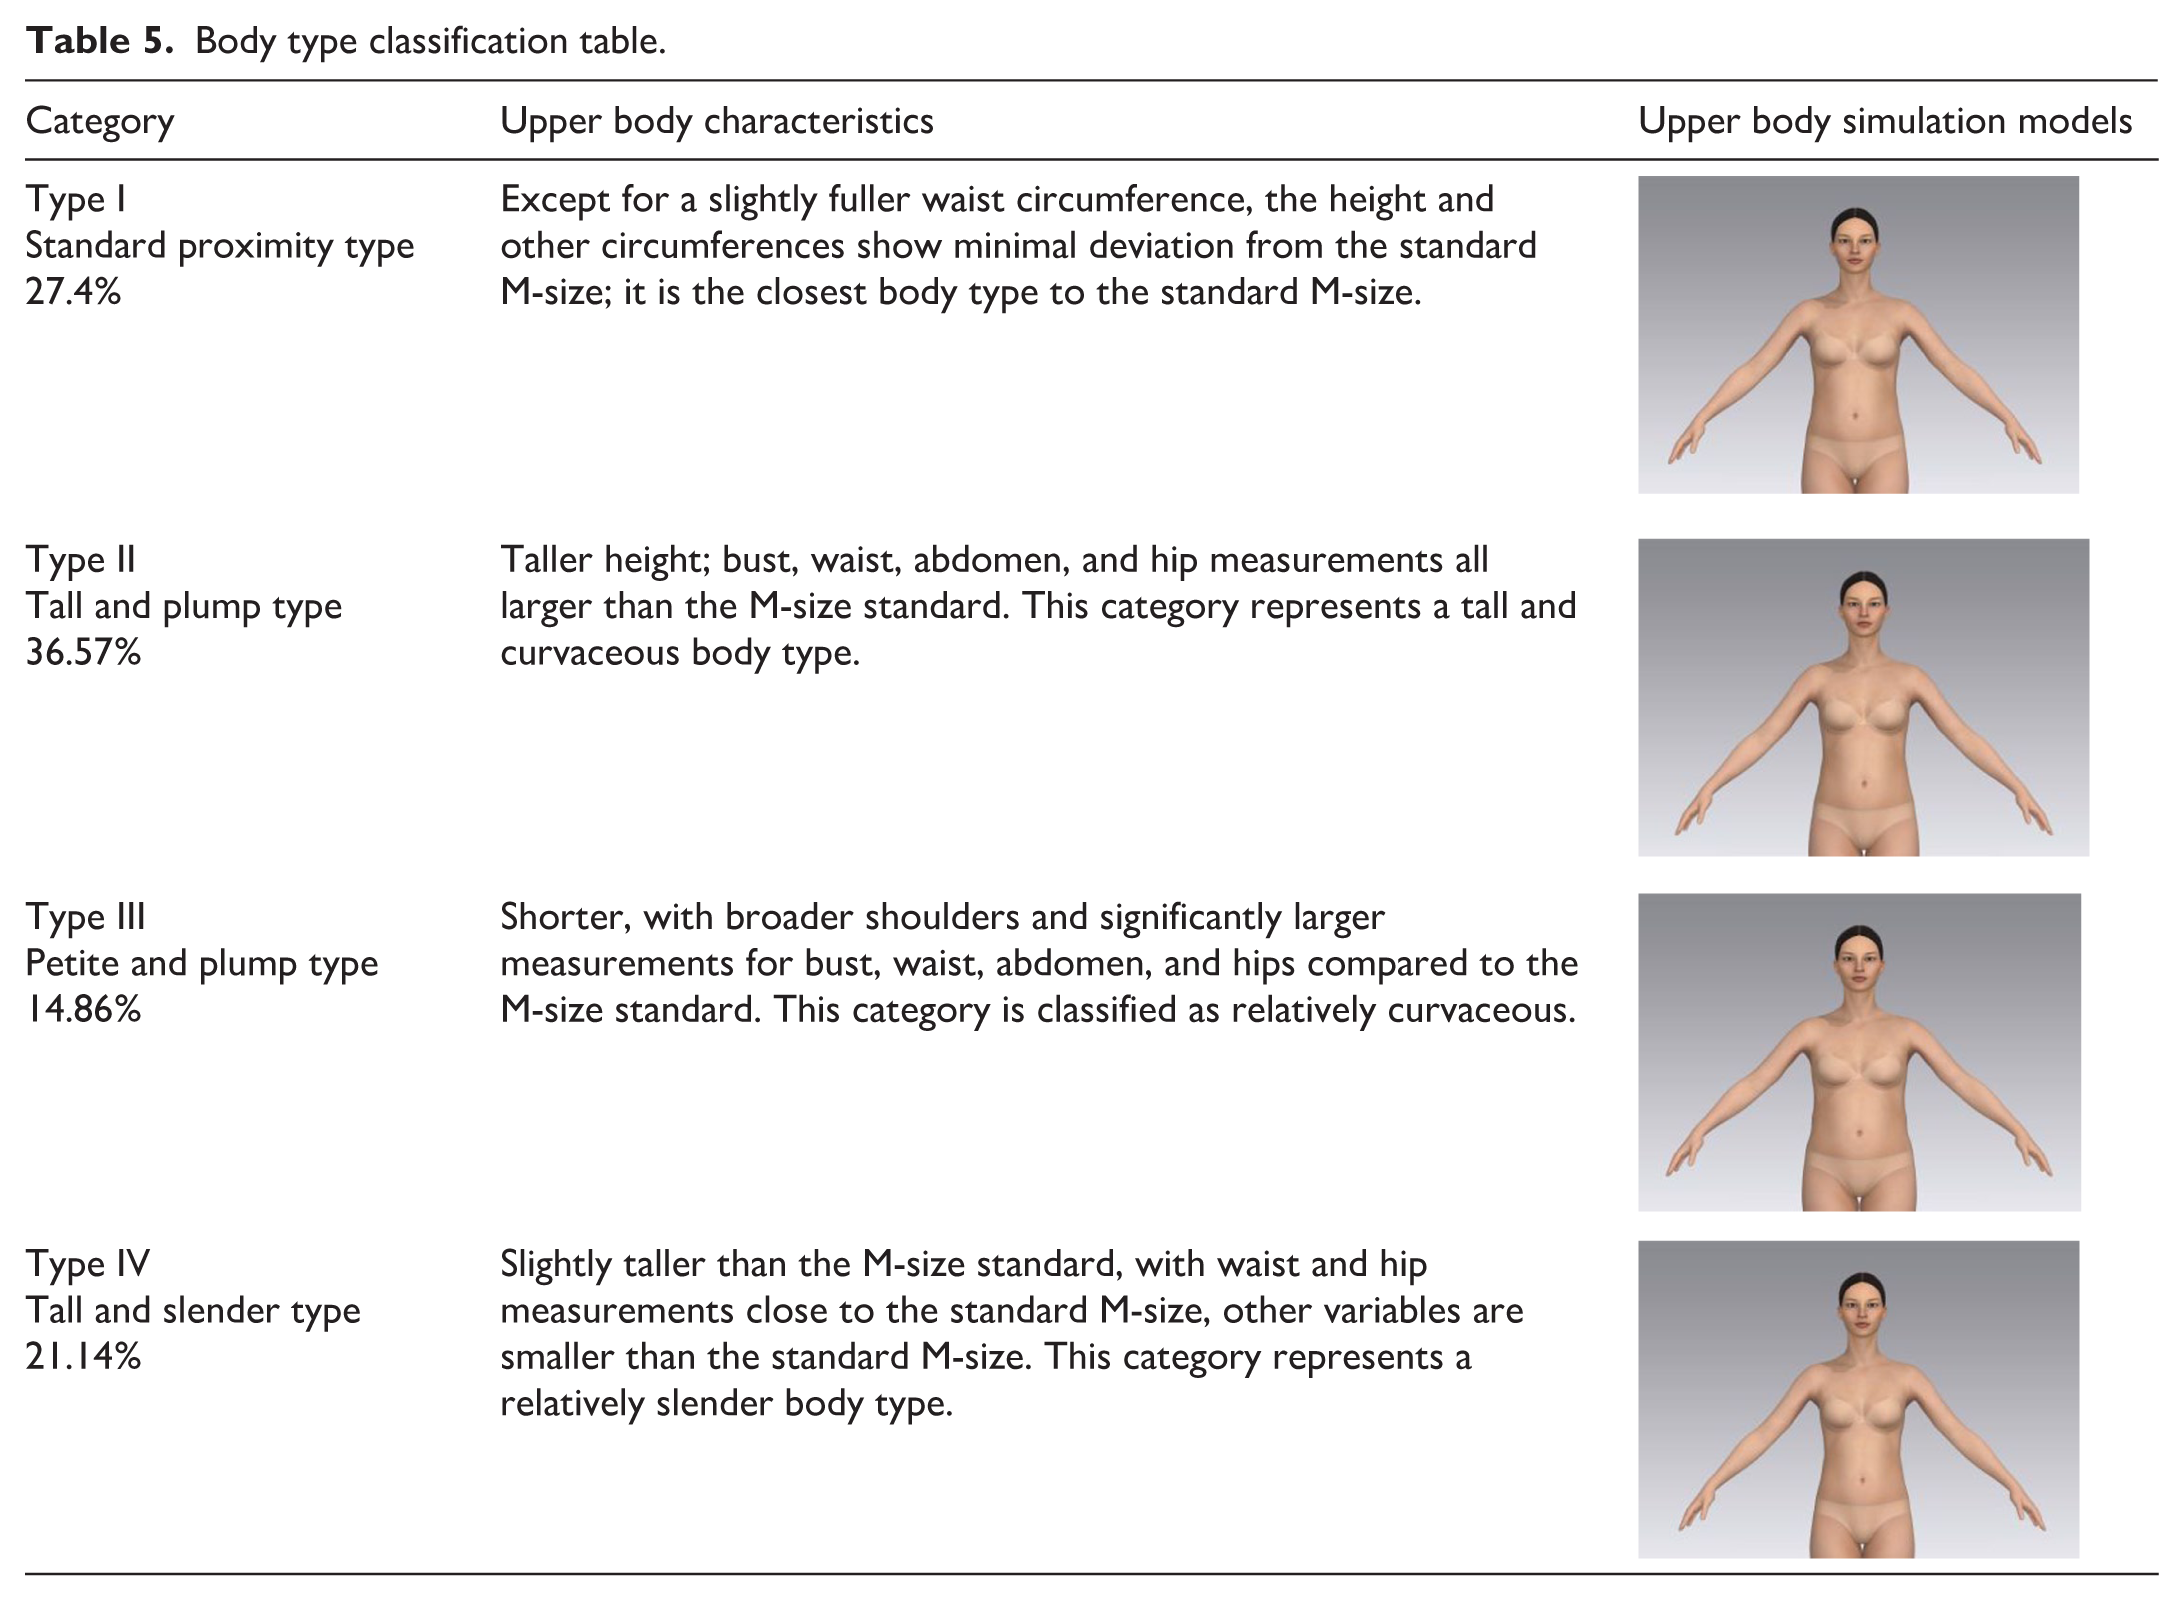
Table 5 details the differences between each body type and the standard M-size measurements. Their labels are Type I—“Standard-Approximating,” Type II—“Tall and Curvaceous,” Type III—“Short and Curvaceous,” and Type IV—“Tall and Slender.”
Body type classification table.
Next, according to the national sizing standard for body types based on bust–waist difference, the four body types in the sample group were compared with the four types in the national standard. The following results were obtained.
Type 1 has a bust–waist difference of 11.24 cm. Although its various measurement indicators are closer to the standard M-size, it should be classified as Type B according to the bust–waist difference criterion.
Type 2 has a bust–waist difference of 13.14 cm, which lies between Type A and Type B.
Type 3 has a bust–waist difference of 6.67 cm and should be classified as Type C.
Type 4 has a bust–waist difference of 15.07 cm, which is the only type that conforms to the range of Type A.
No samples in the four types met the characteristics of Type Y.
Experimental design
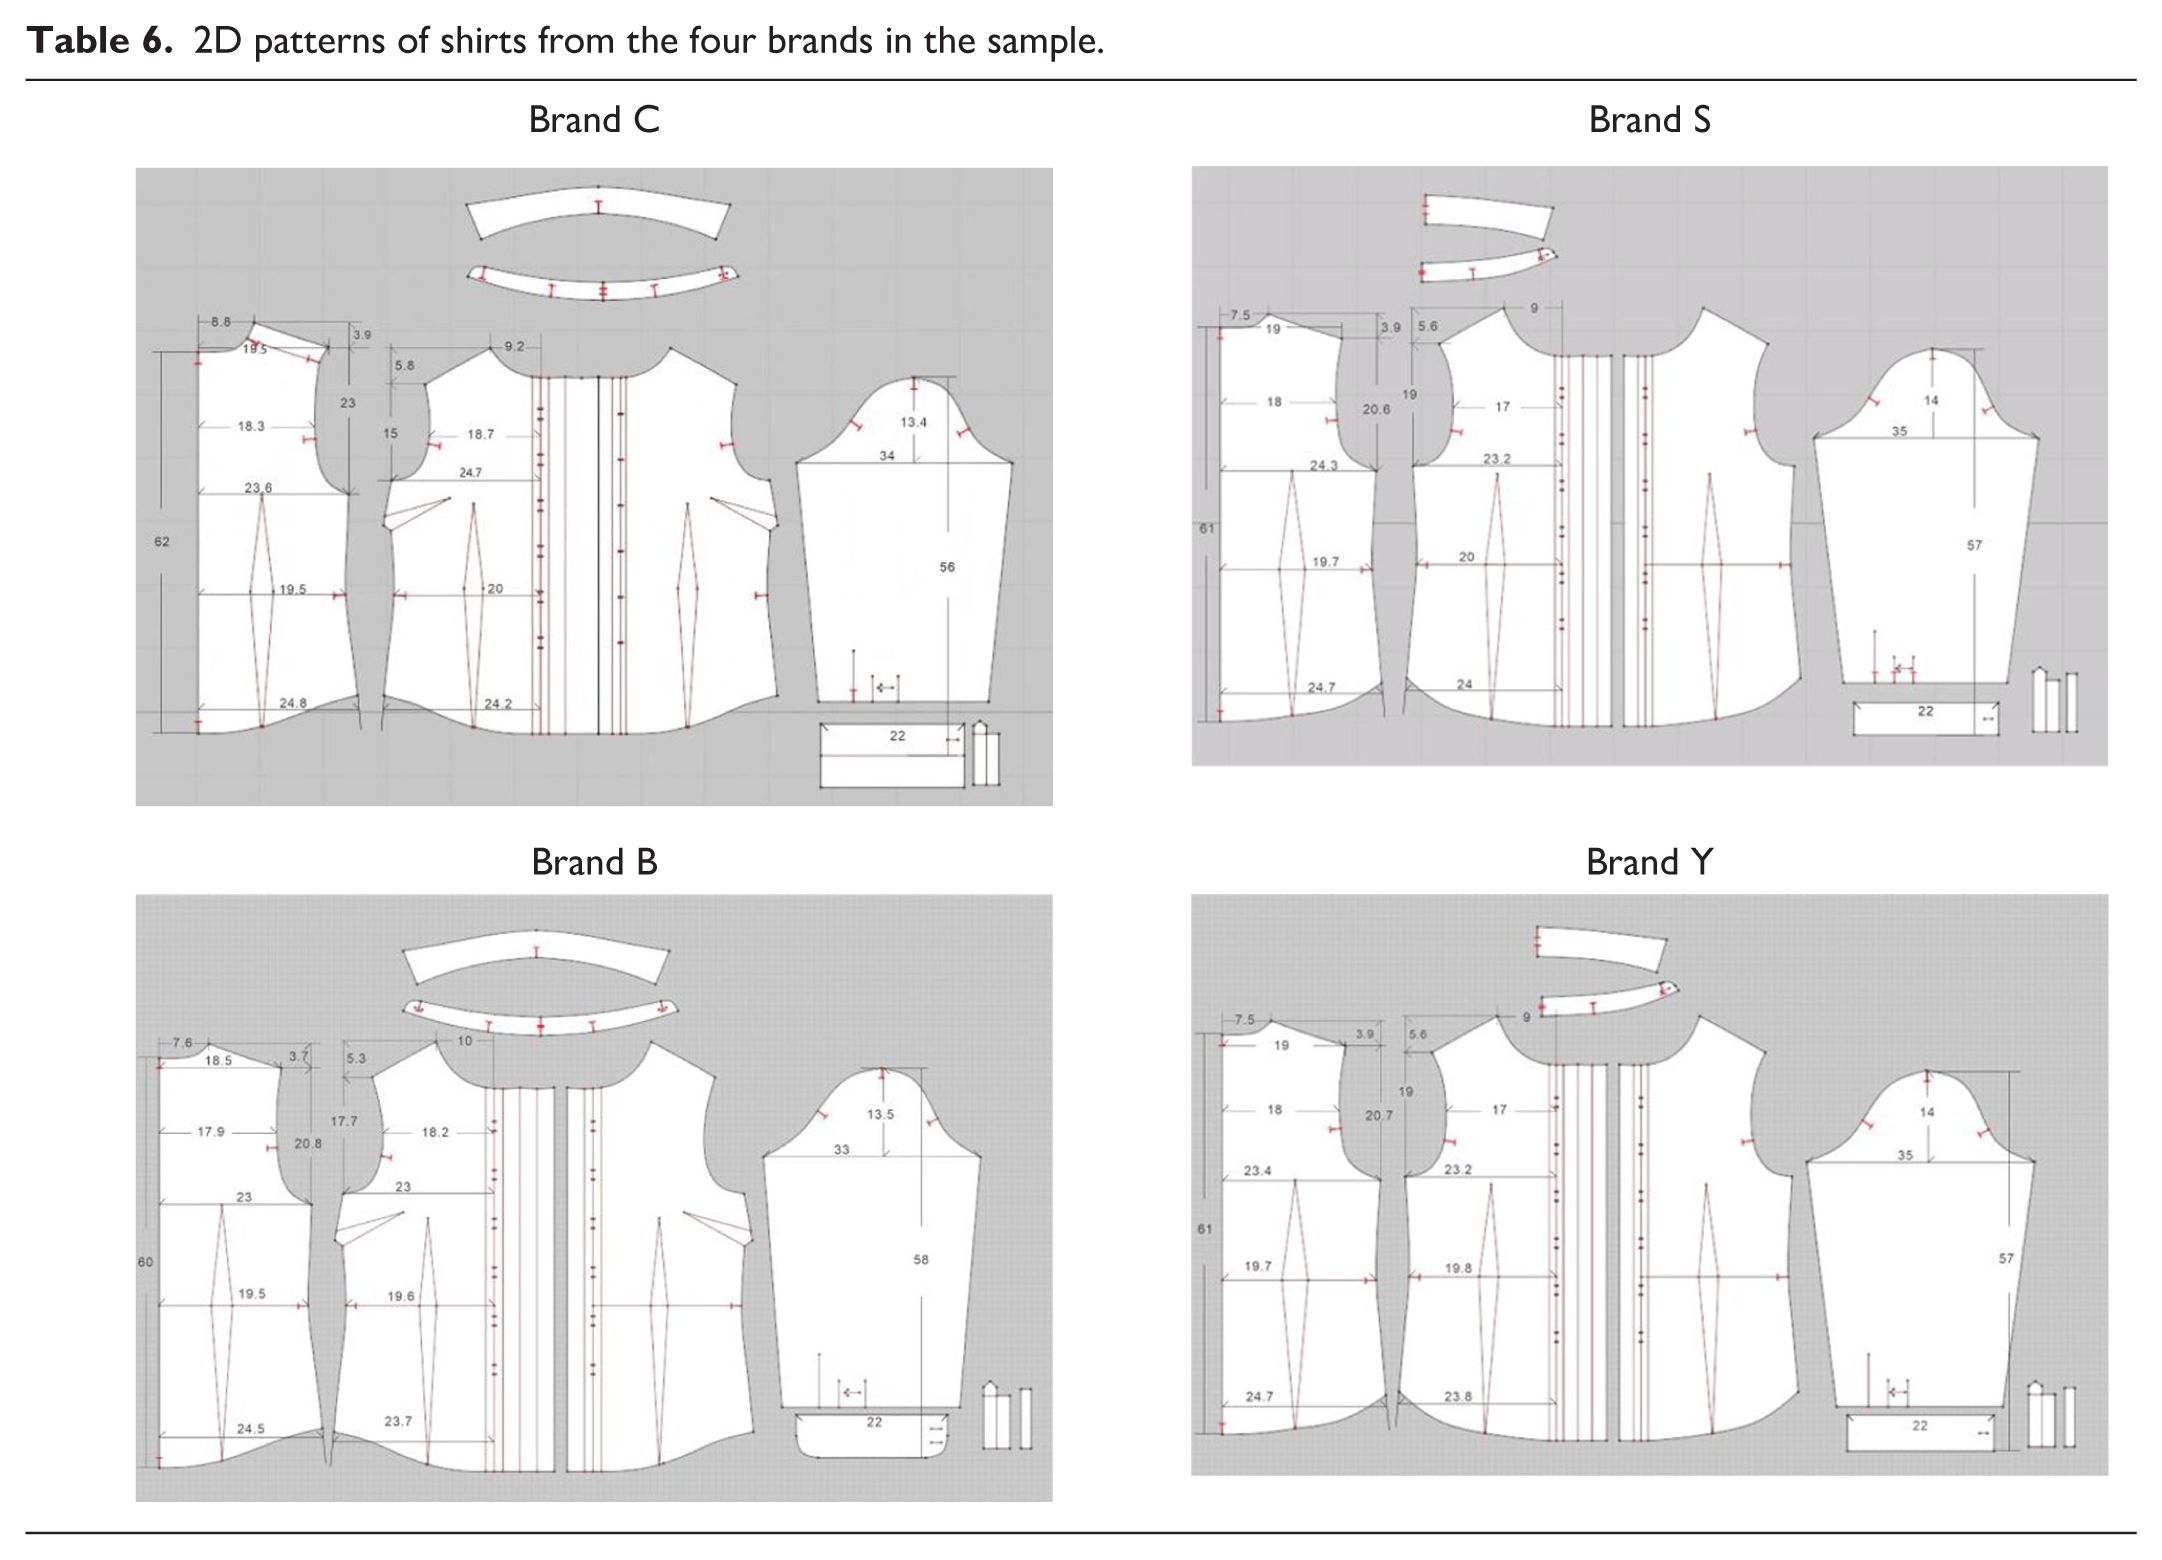
In the present study, basic-fitted shirts from four women's clothing brands with high sales volume on Taobao, the largest online shopping platform in China, were purchased for evaluation and named as follows: Brands B, C, Y, and S. The selected shirt styles and patterns were fundamentally similar; the sample shirts were all in size M, made of 100% cotton without elasticity. To ensure consistency in the dimensions of the shirts during virtual production with the original samples, the original garments were carefully disassembled and each part of the shirt was measured manually with precision. This process was undertaken to obtain the most authentic and accurate garment measurement data. Patterns for each style were drafted using computer-aided design (CAD) and saved in DXF format. 2D patterns of shirts from the four brands are presented in Table 6.
2D patterns of shirts from the four brands in the sample.
These patterns were imported into CLO 3D software to create virtual garments. The virtual garments were modeled to match the physical properties of the actual materials. Specifically, 100% nonelastic pure cotton was used, with a particle distance of 5 for optimal simulation. The virtual garments were fitted onto four preclassified body models for fit evaluation.
Evaluation of clothing fit
To objectively assess virtual try-on results, an evaluation method was developed based on the analytic hierarchy process (AHP) and expert evaluation methods used by Cheng et al. 28 and Jevšnik et al. 29 Static fit evaluation assessed appearance, silhouette, and overall visual impression. Appropriate calculation methods and assessment standards must be established for each evaluation criterion. AHP offers systematic structure, flexibility, and a mix of qualitative and quantitative methods, while expert evaluation ensures professional accuracy through domain expertise. Integrating both methods enhances evaluation reliability by leveraging their respective strengths.
Evaluators and methodology
The evaluation examined virtual fitting results for four body models wearing garments from four brands. An expert survey questionnaire was developed to ensure objectivity and reliability, and six evaluators, comprising professionals with over 10 years of experience in the apparel industry and researchers holding master’s degrees or higher in apparel-related fields, were invited to participate. The evaluators assessed and scored the specified criteria.
Evaluation methodology
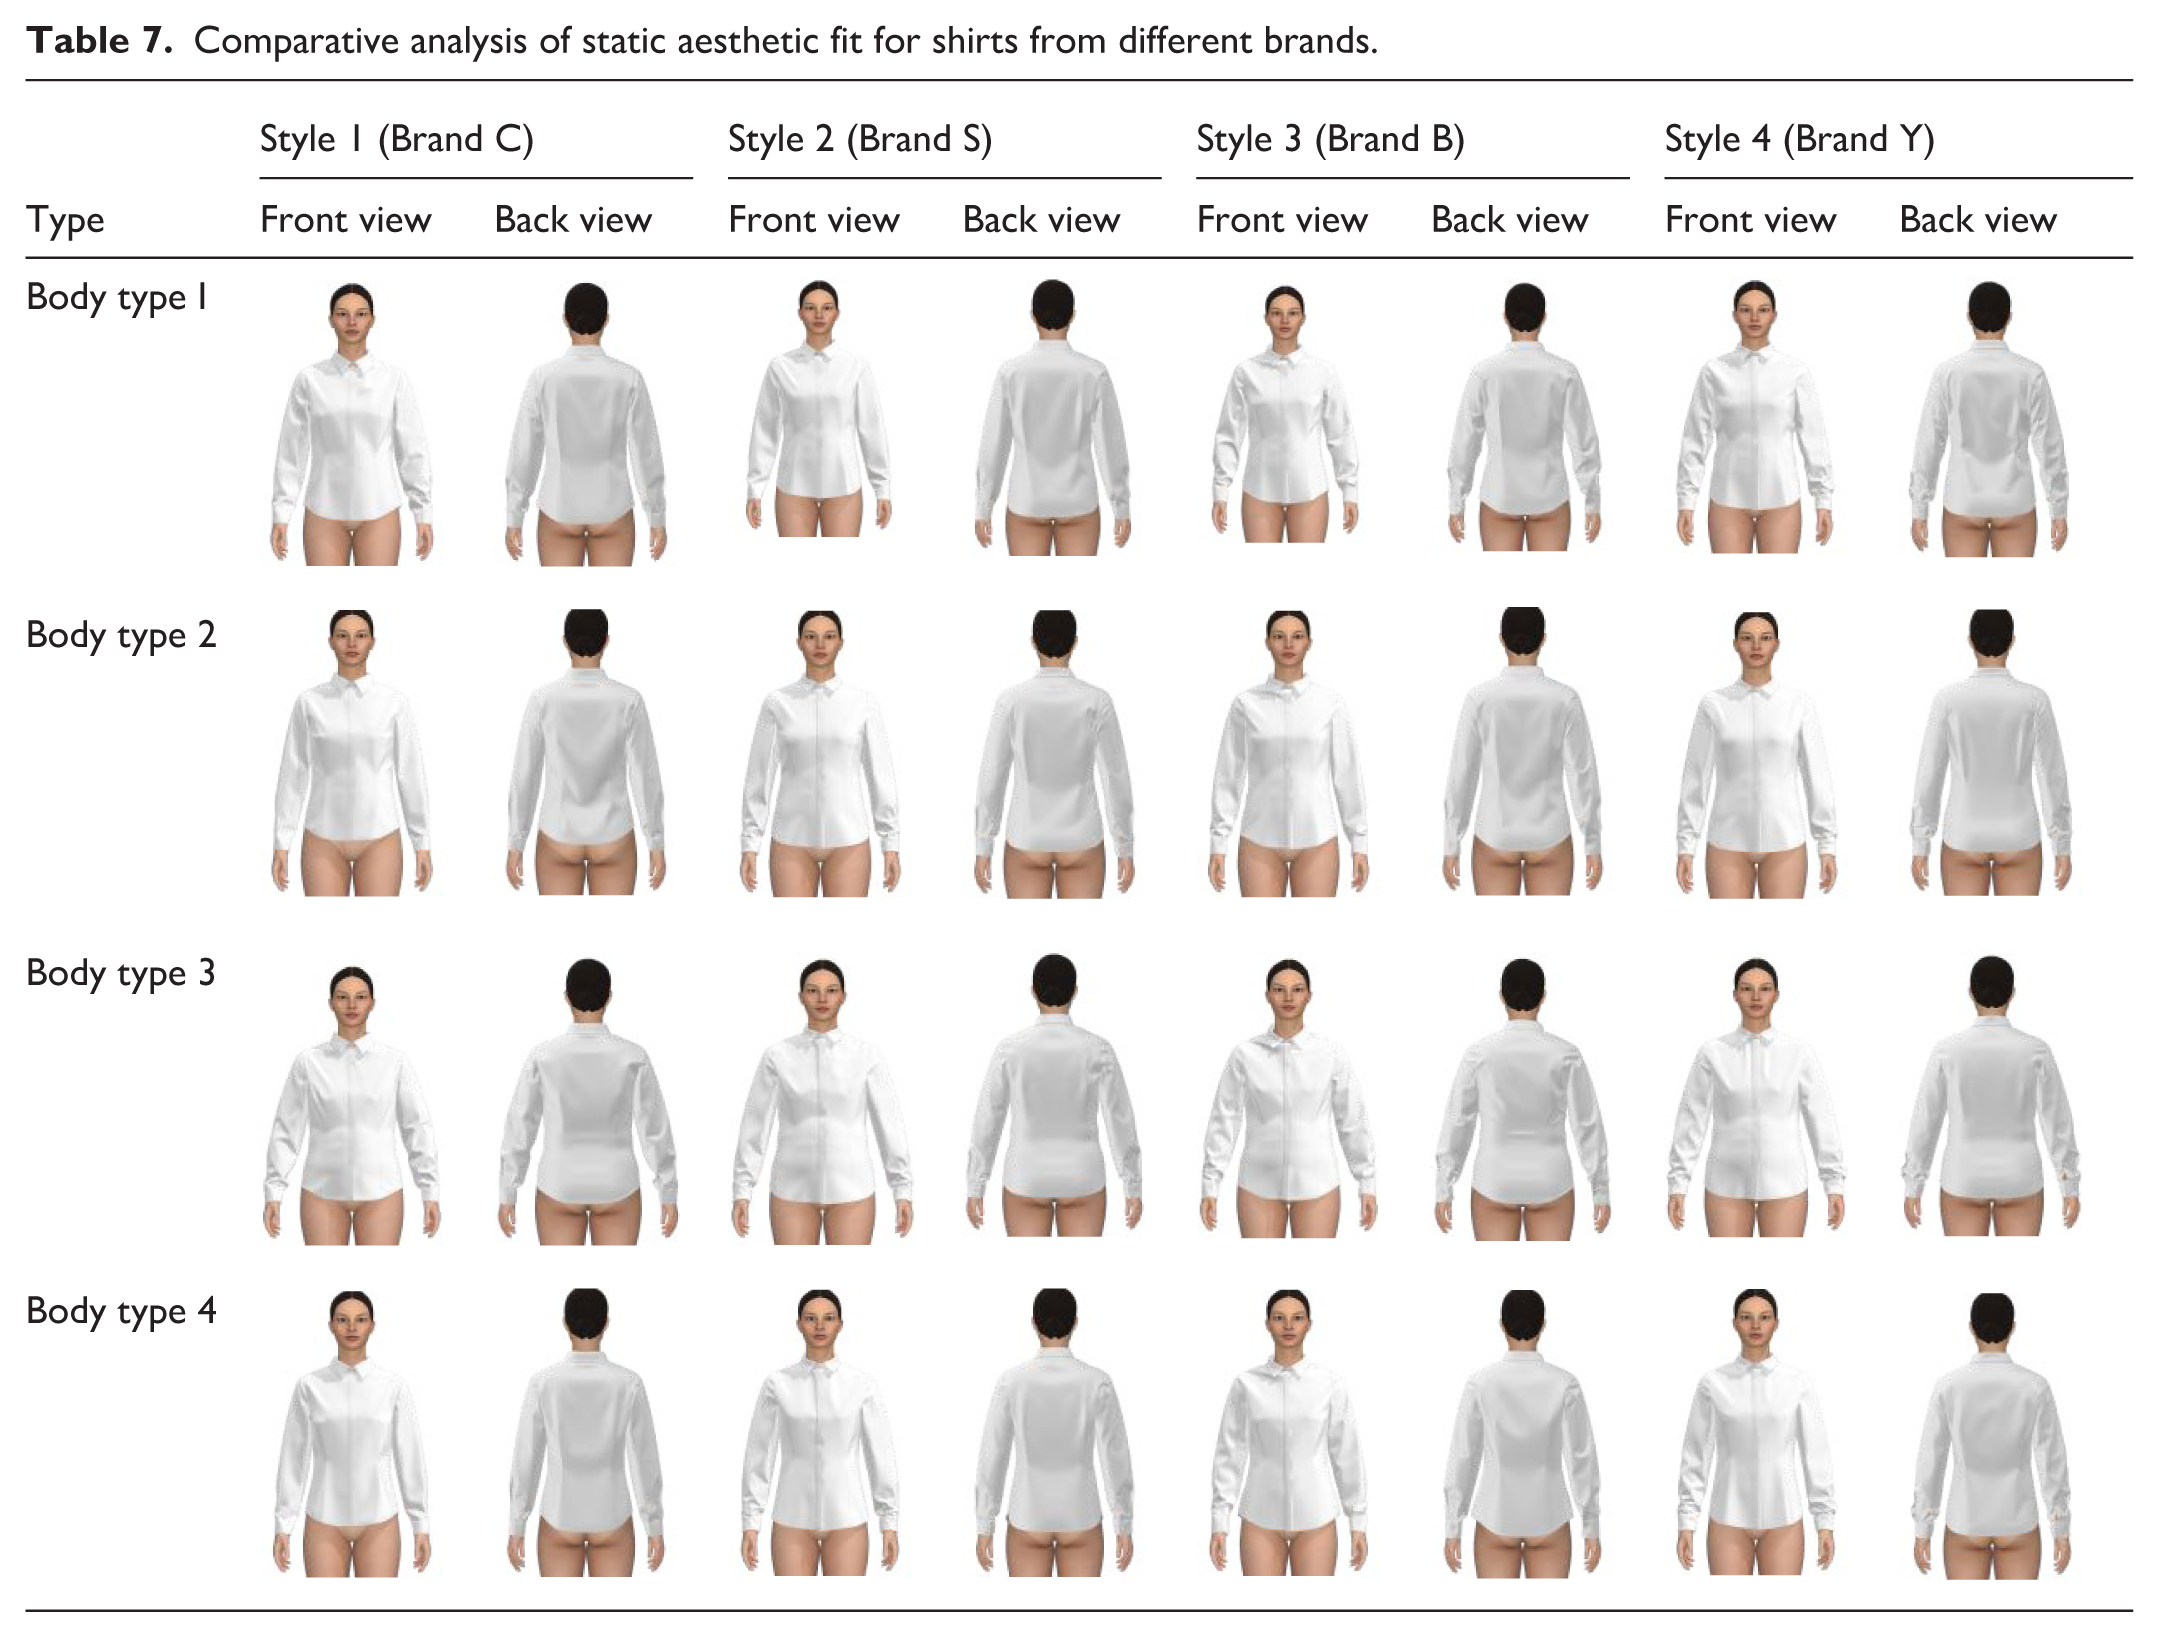
The virtual try-on results for sample garments from the four brands were presented as 2D images, showing front, side, and back views of the garments on the body. Six experts assessed the try-on effects. The evaluation criteria included the visual perception of comfort of the garments on the body and overall aesthetic appeal. Aesthetic appeal refers to the visual perception of comfort and attractiveness of areas such as the chest, back, front armhole points, and shoulders when the body is in a natural standing posture with arms relaxed at the sides, commonly known as static fit. The virtual try-on results are summarized in Table 7.
Comparative analysis of static aesthetic fit for shirts from different brands.
Construction of the evaluation index system
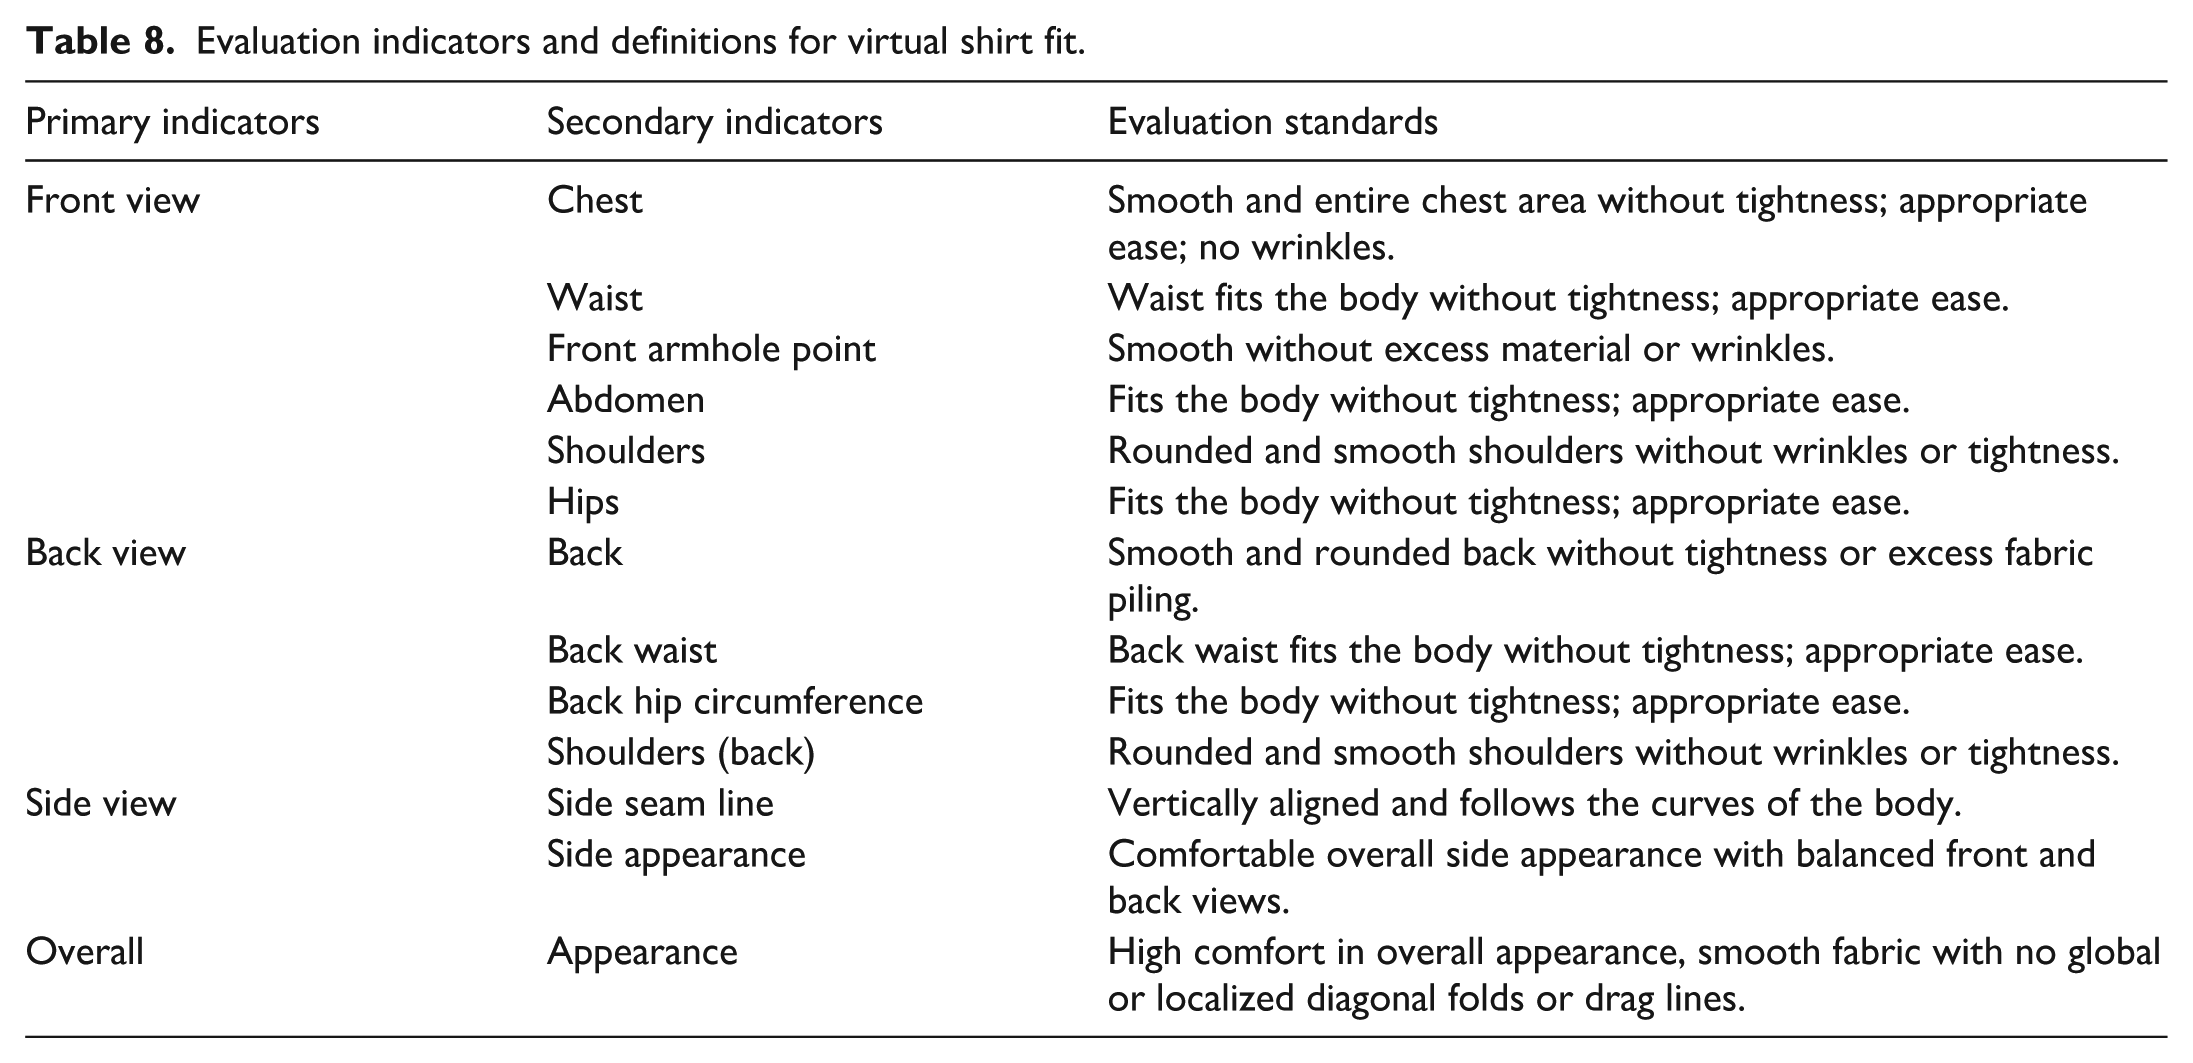
A hierarchical model must first be developed based on the evaluation objectives, systematically breaking down the evaluation goals into multiple layers to form a multitiered analytical structure. A typical hierarchical model consists of four levels: goals, criteria, indices, and alternative layers. Establishing subjective evaluation indices for virtual fit effects in the shirts of women is essential for ensuring evaluation accuracy. The evaluation index system was initially developed by referencing indicator systems established by Mengge and Minzhi. 30 Static fit, focusing on the aesthetic appeal of virtual shirt designs, was set as the evaluation objective. The first-level evaluation indicators (criteria layer) included the front, back, side, and overall visual effects of the virtual shirt. The second-level indicators (index layer) covered overall appearance and aesthetic impact in specific areas, such as the shoulders, chest, front armhole points, waist, and back. These criteria were used to determine static fit evaluation scores, with the alternative layer representing evaluation standards for each body region. To ensure the scientific validity of the initial indicator system, interviews with researchers and experts were conducted to gather feedback on the proposed evaluation framework. The final evaluation indicators were determined based on this feedback. The constructed subjective evaluation index system is shown in Figure 3.Since static fit assesses dimensional compatibility and aesthetic appeal in a stationary state, evaluation criteria were developed based on Xiaoling et al., 31 with modifications tailored to the specific characteristics of the shirt. The detailed evaluation criteria for each indicator in the index layer are listed in Table 8.
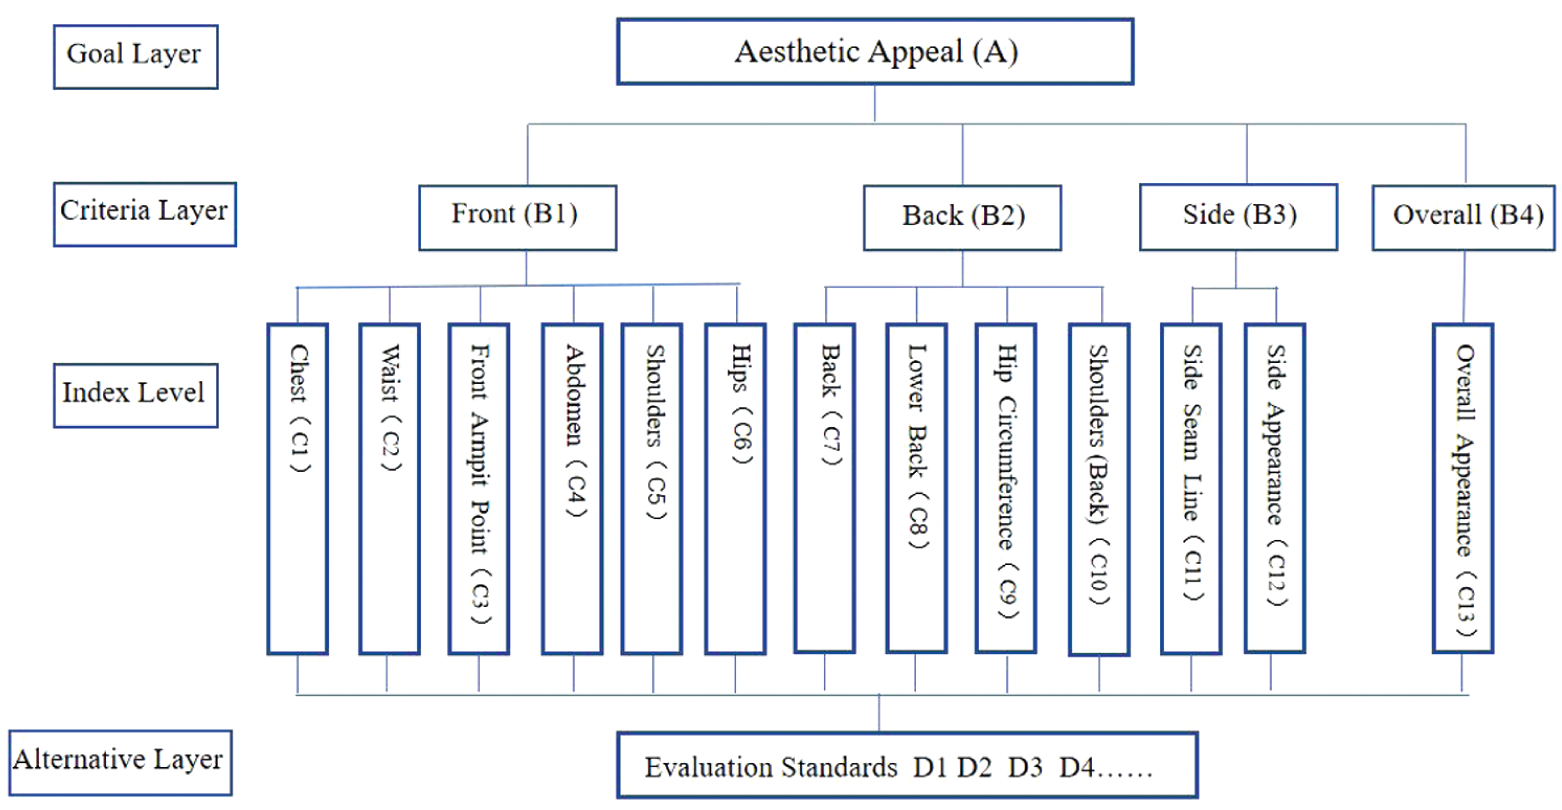
Static aesthetic evaluation system for virtual shirts.
Evaluation indicators and definitions for virtual shirt fit.
A rating scale was developed based on the evaluation indicators and standards for assessing the virtual fit effects of women’s tailored shirts, enabling a quantitative and comprehensive evaluation of fit performance. The scoring scale ranged from 1 to 5, corresponding to “very poor,” “poor,” “average,” “good,” and “excellent,” respectively. Higher scores indicate superior fit performance, whereas lower scores denote poorer fit. The scoring precision was set to 1.
Calculation of index scores
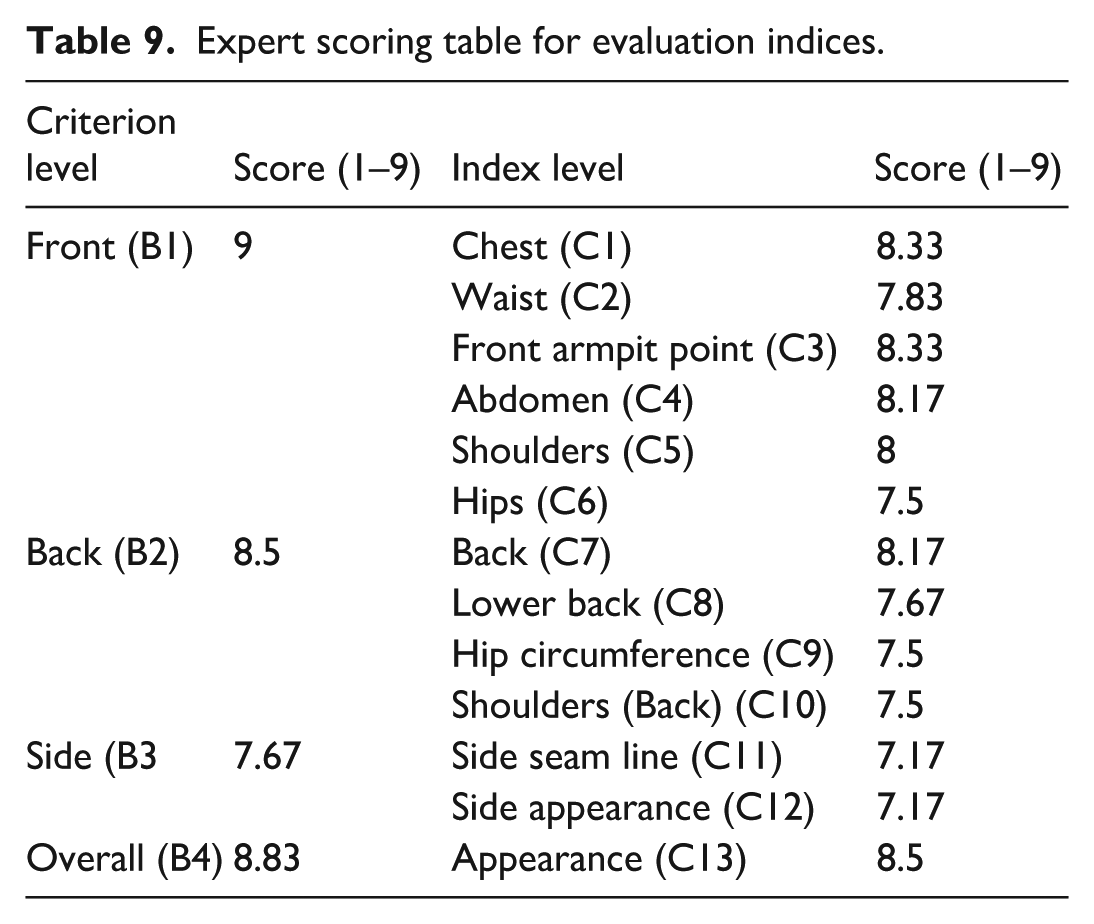
Six experts evaluated the constructed indices using the 1–9 scale of AHP, where 1 represents “extremely unimportant” and 9 represents “extremely important.” Numerical values representing each factor’s relative importance were calculated. Finally, the average expert scores for each index were calculated (Table 9).
Expert scoring table for evaluation indices.
Construction of the judgment matrix
The alignment degree between different clothing components and the human body significantly affects the clothing’s overall aesthetic appearance. Pairwise judgment matrices were constructed for each hierarchical level to determine the relative importance of varying clothing components to the overall aesthetic effect. These matrices evaluated the importance of elements at lower hierarchical levels relative to higher levels. This process generated the weight of relative importance for each index. The Saaty 1–9 ratio scale method 29 was used to represent index importance in constructing the judgment matrix. The expert scoring results in Table 10 were processed and analyzed to build the judgment matrices.
Judgment matrix for the criteria level under the target level.
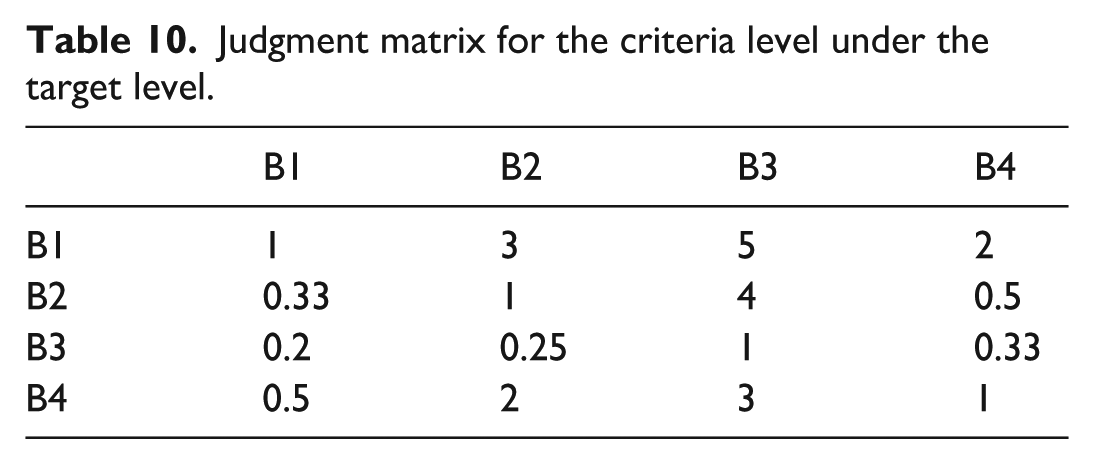
Pairwise comparisons of the four primary criteria-level indicators (B1, B2, B3, and B4) under target level A were conducted using expert scores. A judgment matrix for the primary criteria-level indicators was constructed based on the final evaluation results (Table 10).
No judgment matrix was required since B4 comprised only one indicator at the criteria level. Separate judgment matrices were constructed for indicator levels B1, B2, and B3. Consistency checks and weight calculations were also performed.
Summary of weights in the index system
Expert evaluations determined the influence weights of factors at the criteria and indicator levels on the target level based on the hierarchical structure developed to assess the clothing’s aesthetic appearance in static modeling. The composite weights are listed in Table 11.
Summary of weights in the evaluation index system.
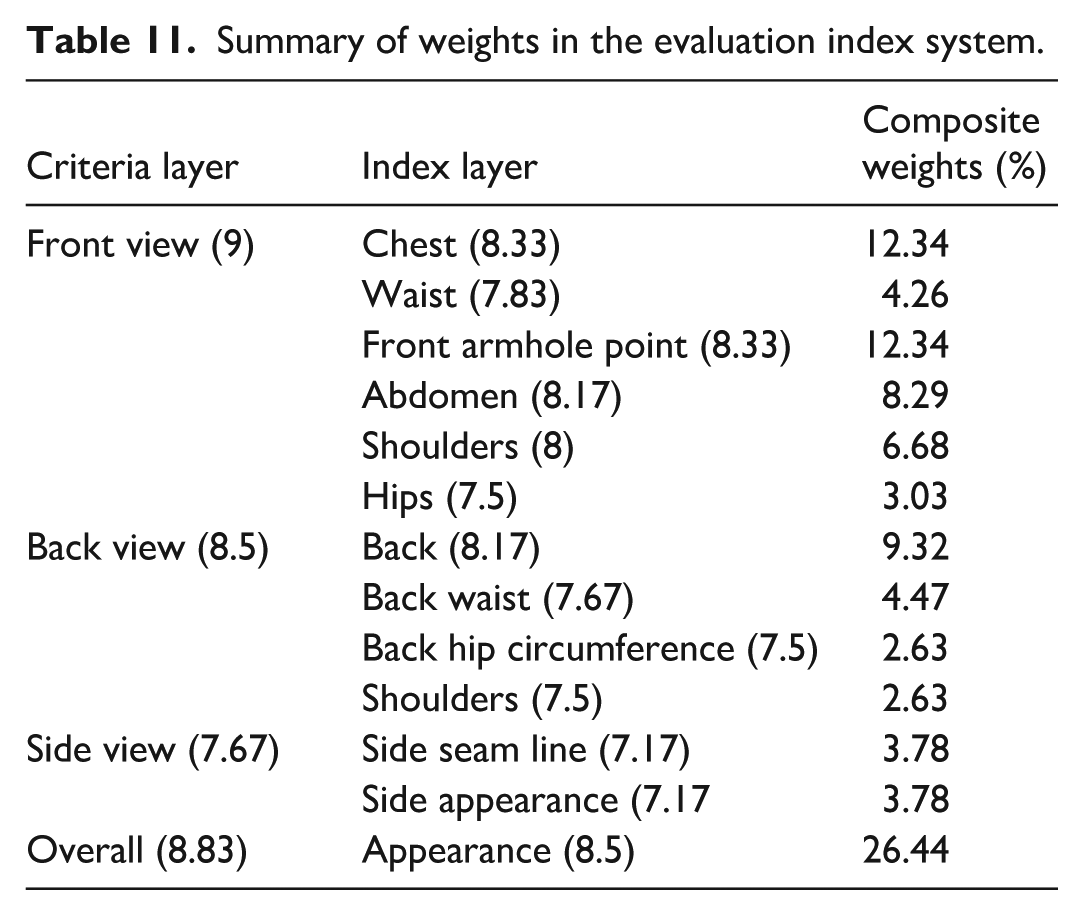
Figure 4 illustrates the indicator-level weights’ distribution relative to the target level. The appearance factor accounts for 26.44%, making it the most critical factor in evaluating the clothing’s aesthetic appearance. The appearance factor represents the clothing design’s overall visual aesthetic effect, followed by the chest and front armpit points, each accounting for 12.34%. This suggests that the fit of the chest and front armpit areas significantly influences the clothing’s overall aesthetic evaluation. Other factors with relatively high weights include the back, abdomen, and shoulders. These weights’ distribution reflects the comprehensive combined influence of various indices on the expert-assessed aesthetic evaluation. These weights serve as a precise basis for assessing the clothing’s aesthetic appearance and fit, as shown in Figure 4
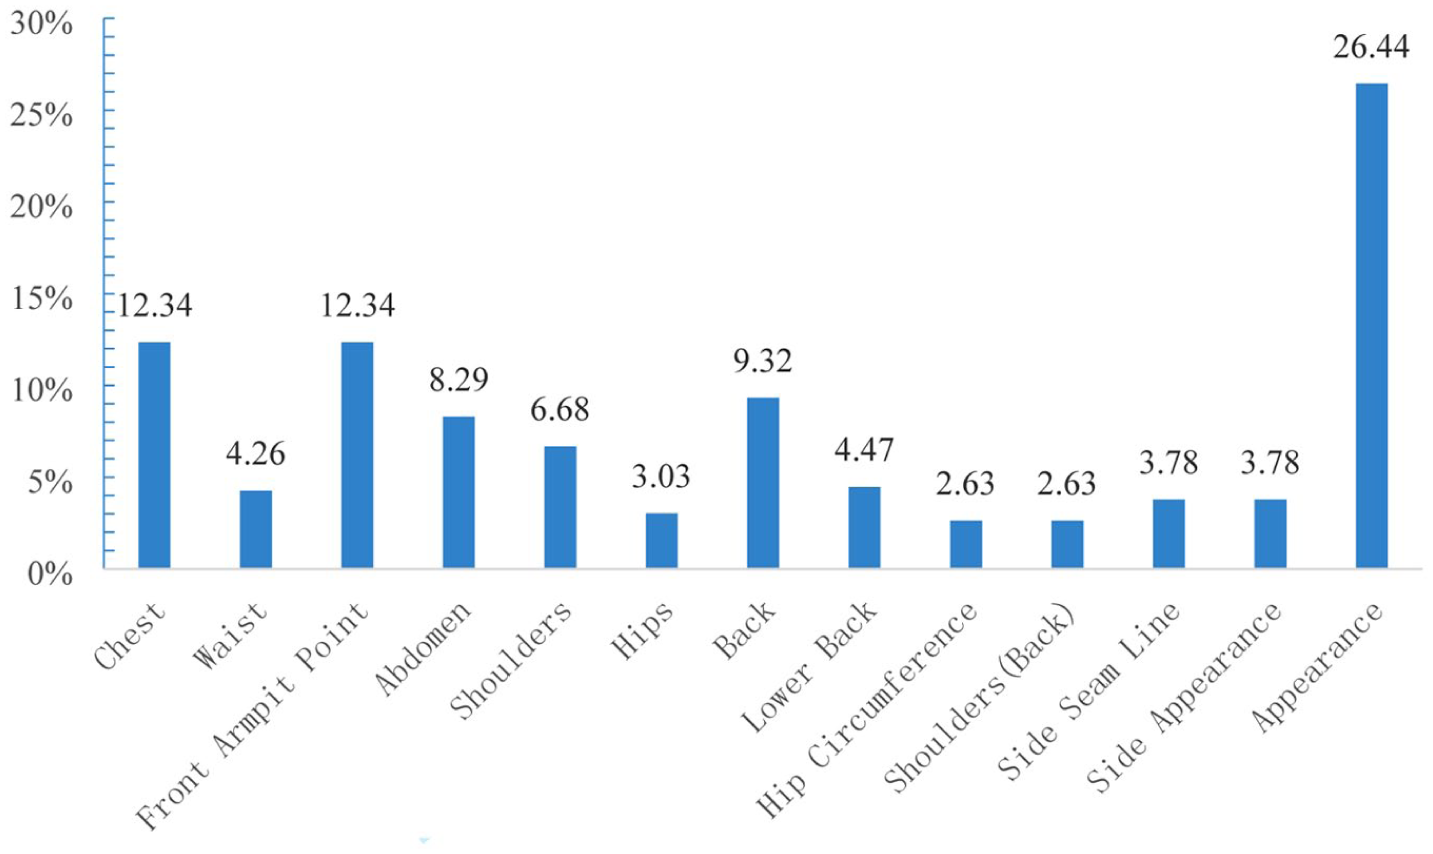
Indicator weight.
Comprehensive evaluation
Fuzzy comprehensive evaluation utilizes fuzzy mathematics to break down complex multifactor problems into single-factor evaluations. After individually evaluating each factor, the results are integrated to form an overall assessment. Since the descriptive terms used in clothing fit evaluation inherently exhibit fuzziness, applying fuzzy mathematics to process and analyze such data ensures a more objective evaluation. Therefore, fuzzy mathematics was employed to quantify the aesthetic qualities’ evaluation indicators in virtually fitted static shapes, ensuring scientific rigor and rationality. The specific steps are as follows.
(1) Construct a fuzzy comprehensive evaluation indicator set
The first step is identifying and decomposing the factors influencing the evaluation object. A hierarchical structure was developed based on the relevance of the indicators.
First, establish the criteria level indicator set A = (Front View (B1), Back View (B2), Side View (B3), Overall Appearance (B4)). The indicator-level sets are as follows: B1 = (C1, C2, C3, C4, C5, C6), B2 = (C7, C8, C9, C10), B3 = (C11, C11), B4 = (C13).
(2) Determination of the evaluation set
The evaluation set comprises results provided by evaluators based on predefined criteria for each level of static aesthetic clothing indicators. In this set, m represents the evaluation levels and

(3) Determination of indicator weight
Each indicator’s weight was calculated using the comprehensive AHP weights.
(4) Comprehensive evaluation
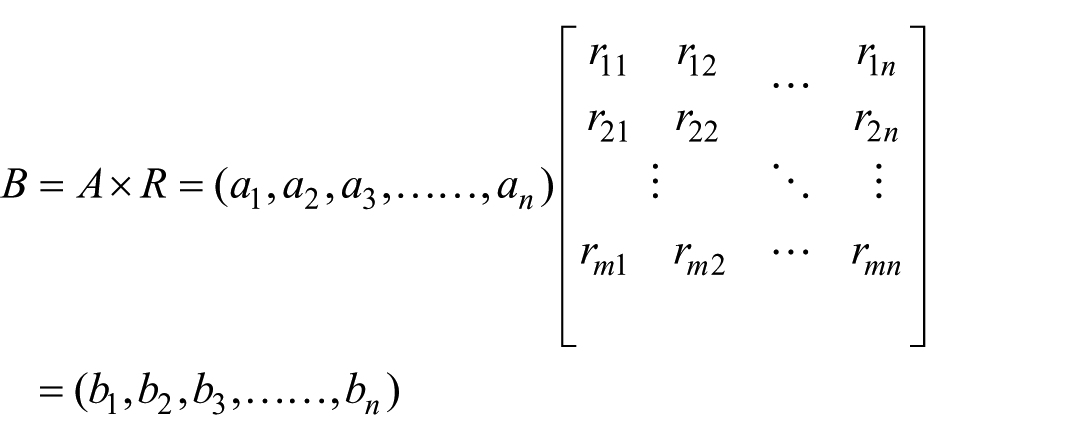
After establishing the evaluation set, a membership matrix R was constructed to represent the degree of membership of the evaluated object at each evaluation level based on individual factors. Using the single-factor fuzzy set
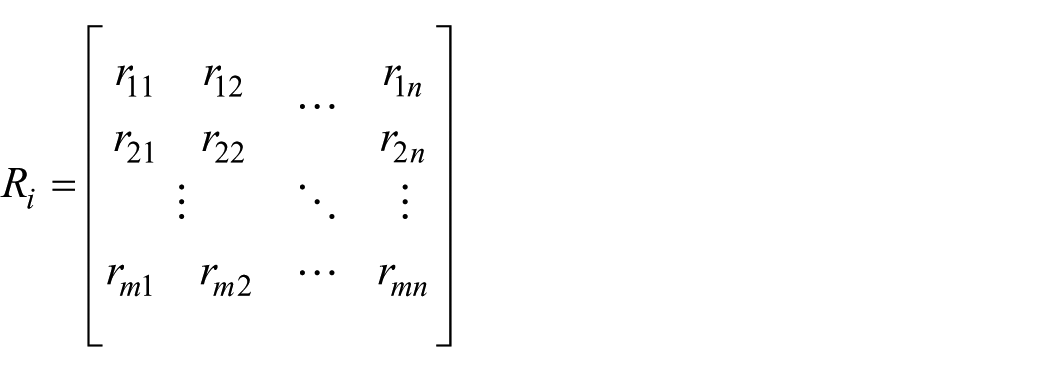
where m represents the number of evaluation indicators under the ith primary indicator and n represents the number of evaluation levels. The term rm1 represents the membership degree of the mth secondary indicator to the first evaluation level v1, while
By applying operations on the indicator weight set A and fuzzy matrix R, the fuzzy comprehensive evaluation model is expressed as
Construction of fuzzy evaluation indicators
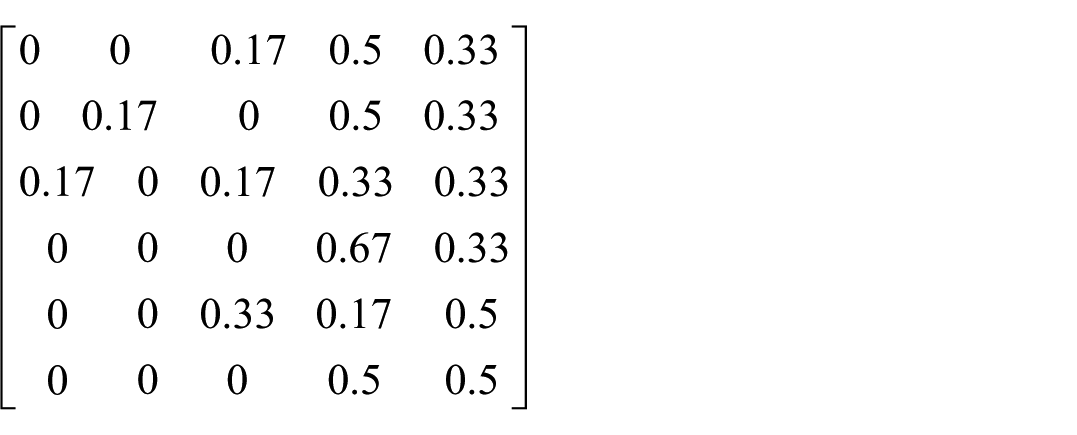
Owing to the large number of items to be evaluated, this study conducted an in-depth analysis using the trial fitting of Brand C clothing for the first body type as an example. Evaluations from six experts on various indicators of Brand C clothing fit for the first body type were used to compute fuzzy evaluation matrices derived from scoring results, as follows.
Fuzzy evaluation matrix for B1:
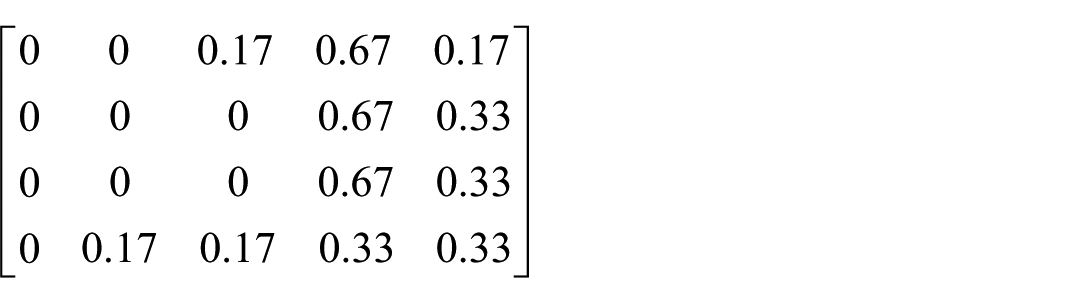
Fuzzy evaluation matrix for B2:
Fuzzy evaluation matrix for B3:
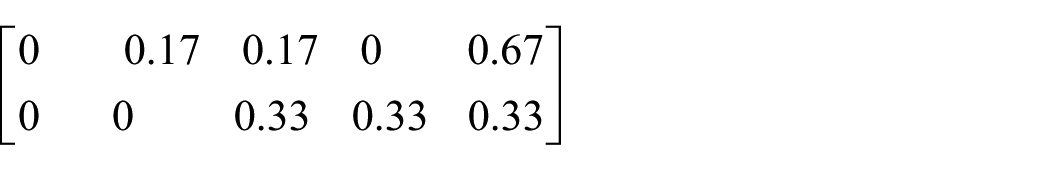
Fuzzy evaluation matrix for B4:

Scoring results and analysis
Based on the constructed fuzzy evaluation matrices, the comprehensive score for the aesthetic appeal of the trial fit of Brand C clothing for the first body type was 82.06 points. Using the same method, fuzzy evaluation matrices were applied to assess different body types wearing various brands, yielding comprehensive scores for each scenario. From the results, the highest comprehensive score was achieved by the first body type wearing Brand S clothing, scoring 83.403 points. The lowest score was observed for the third body type wearing Brand B clothing, at 46.597 points. These scores objectively reflect the compatibility between different body types and shirt brands (Table 12).
Comprehensive scores for different body types wearing the sample’s shirts types.
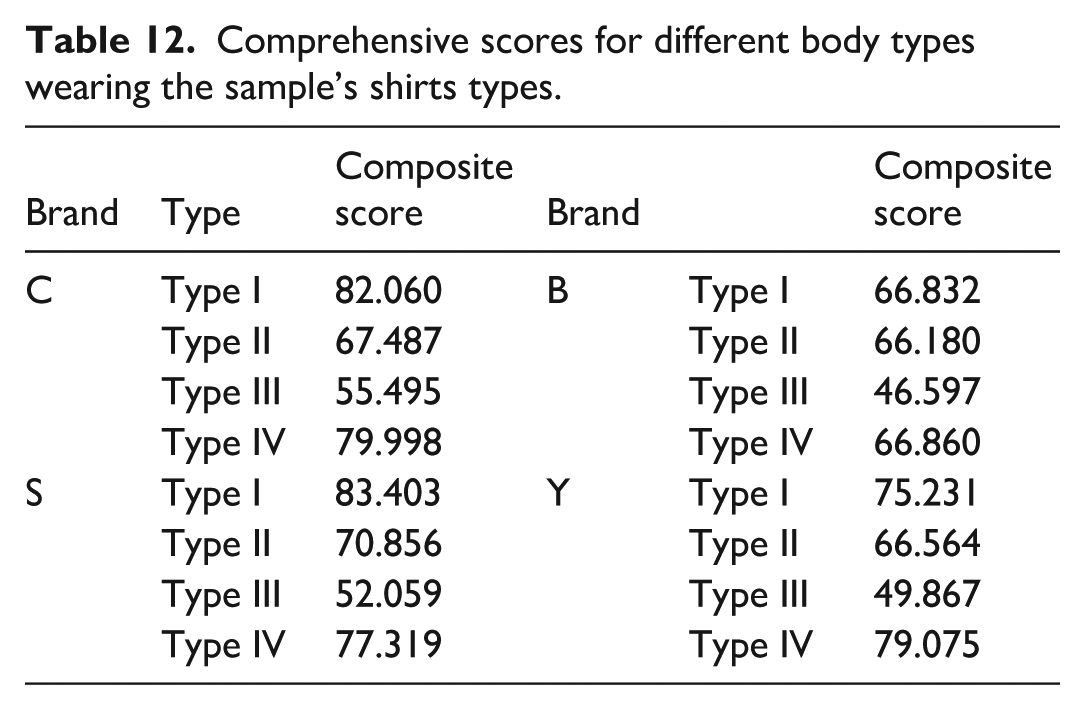
Based on different body types’ comprehensive scores for various brands, a detailed analysis evaluated the aesthetic appeal of clothing fit across body types and brands.
The comprehensive score for Body Type I demonstrated the highest compatibility with Brand S (83.403 points), followed closely by Brand C (82.060 points). This body type closely aligns with the standard M-size, indicating optimal fit for Brands C and S, while presenting moderate fit with Brands Y and B, which scored 75.231 and 66.832 points, respectively.
For Body Type II, characterized by a taller stature and slightly larger chest, waist, abdomen, and hip measurements, moderate adaptability was noted across all brands with scores ranging from 66.180 (Brand B) to 70.856 (Brand S). This suggests a generally average fit quality for this body type across the brands.
Body Type III, representing individuals with shorter stature and fuller waist, abdomen, and hip measurements, received the lowest scores across all brands, with scores ranging from 46.597 (Brand B) to 55.495 (Brand C). The results indicate a minimal compatibility for M-sized shirts with this body type across all brands.
Body Type IV, describing individuals slightly taller than standard with similar waist and hip measurements but smaller in other areas, generally fit well with all brands, scoring between 66.860 (Brand B) and 79.998 (Brand C). Despite the overall good fit, there may be localized fit issues that warrant attention.
Through a comprehensive calculation of the scores for different body types wearing the four brands, the overall scores for each brand (Brands C, S, B, and Y) were determined to be 71.26, 70.91, 61.62, and 67.68, respectively (Table 13). These results indicate that Brand C provides the most consistent fit across all body types, while Brand B exhibits the poorest overall fit.
Ease allowance at key body locations for each brand (units cm).
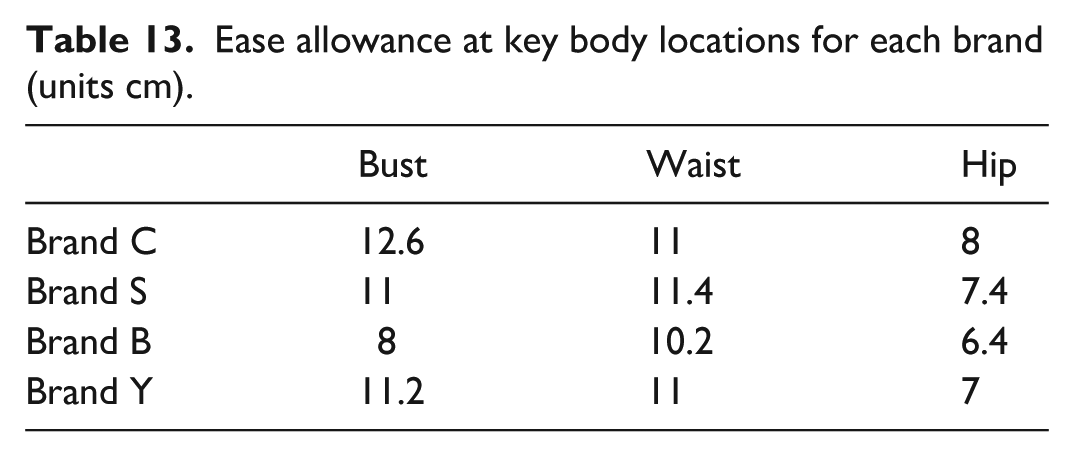
When creating a clothing pattern, ease allowance is set for body dimensions to improve visual appearance and comfort. The appropriate amount of ease allowance varies according to the purpose of wearing and clothing type. No clear standard exists for the amount of ease allowance, especially with women’s shirts. In the Chinese apparel industry, for a well-fitted women’s shirt made from non-stretch fabric, the typical ease allowance at key body locations is: bust 8–10 cm, waist 10–12 cm, and hip 4–10 cm. In actual production, to ensure both fit and comfort, these values are fine-tuned according to wearing requirements and individual body shapes. Based on the above standards, the ease allowances of the four shirts at these key locations are summarized in Table 13.
According to Table 13, the four shirts we analyzed differ slightly in ease allowance at key body locations. Consequently, the same body achieves varying degrees of fit when trying on the different brands. Brand C provides more ease than the other three in all girth measurements, resulting in a comparatively better match, whereas Brand B offers the least ease and, therefore, produces a shirt with a relatively poorer fit.
Conclusion
This study focused on women in China aged 30–39 years who mainly wear M-sized tops. The research results have shown significant differences between this group’s physical characteristics and the standard body shape of size M as defined in the Chinese national standard GB/T 1335.2-2008. Specifically, the average waist circumference (73.96 cm) and hip circumference (92.93 cm) of the sample group are both higher than the national standards (68 cm and 90 cm, respectively), and the protrusion of the abdomen is common. These features are most commonly found in body type B, according to the national standard, instead of body type A, which is commonly used as the standard by clothing companies. This, in turn, validates the limitations of the current clothing size settings in the industry.
By evaluating the fit between the four body types and the M-sized shirts of four brands using virtual fitting technology, results show that the close-to-the-standard type (I) has the best fit with Brand S’s fitted shirt (comprehensive score = 83.403 points), while the short-and-plump type (III) has poor fit among all brands (with the lowest score, 46.597 points). This difference further confirms that the current sizing standard, centered on the “standard A body type” does not appropriately cover the diversity of body shapes of women in their 30s, especially due to morphological changes in the waist, abdomen, and hips. Moreover, differences in fit among brands (e.g., Brand C has the best overall performance and Brand B has the worst) also reflect the inconsistency in sizing design within the industry.
Innovation
The innovation of this study is reflected in three ways.
1. Subdivision of body shape classification. For the first time, body shape classification has been carried out for Chinese women aged 30–39 years old who wear size M, making up for the deficiencies of existing studies with a relatively broad age range and insufficient subdivision of research participants.
2. Integration of technical methods. By combining clustering analysis and virtual fitting technology, a complete research framework from data collection to adaptability evaluation has been established.
3. Industrial enlightenment. Results reveal the disconnect between the sizing standard and consumers’ actual body shapes, providing an empirical basis for clothing enterprises to optimize their sizing systems.
Limitations and future directions
This study has a few limitations. The M-size used in the present study is limited to the M-size standard defined in GB/T 1335.2-2008. Although the sample size (n = 175) meets the statistical requirements, in the future, the geographical coverage can be expanded to include a wider range of factors such as regions, occupations, and lifestyles to ensure that the sample is more representative and diverse. We will also incorporate more comprehensive body shape variables, such as BMI and body cross-section, to further refine the body shape classification and thoroughly investigate the effect of different body shape characteristics on clothing adaptability.
Furthermore, in the present research, the assessment of garment fit was limited to visual comfort. Future research can introduce actual fitting experiments by real people as a supplementary verification of the results of virtual fitting.
Footnotes
Acknowledgements
The content of this paper incorporates part of the first author’s doctoral research.
Author’s Note
Wenshu Wang is now affiliated to Jingdezhen Vocational University of Art, Jingdezhen 333000, Jiangxi Province, P. R. China.
Declaration of conflicting interests
The author(s) declared no potential conflicts of interest with respect to the research, authorship, and/or publication of this article.
Funding
The author(s) disclosed receipt of the following financial support for the research, authorship, and/or publication of this article: This work was supported by the Doctoral Research Special Fund of Jiangxi Private Education Sector (Grant No. JVUASZZX202508).