
Abstract
Knee sleeves are one of the most essential protective items for sports enthusiasts. By exerting pressure on the leg during wear, knee sleeves help reduce muscle vibration, providing protection to the human body while effectively enhancing athletic performance. However, most knee sleeve products currently on the market commonly suffer from issues such as imperfect functionality, pressure distribution that does not conform to human body shape characteristics, and an inability to meet the wearer’s needs for exercise and comfort. To improve the functionality and pressure comfort of knee sleeves after wearing, this study established a three-dimensional finite-element model of the human knee joint based on CT images. Geometric models of the “knee sleeve–knee joint” were constructed using MIMICS and Solidworks. Thirty subjects were selected to wear five types of experimental knee sleeves with different structural designs, and pressure tests were conducted to validate the effectiveness of the finite-element model. To further explore the relationship between pressure and human body surface displacement during knee sleeve wear, displacement data from 16 test points on five cross sections of the human knee joint were extracted through finite-element simulation. The results show that the peak pressure was located at the anterior test points where bones protrude, while the peak displacement was located at the posterior test points with thicker soft tissue, exhibiting a nonlinear relationship between the two. To further quantify the functional relationship among pressure, body surface displacement, and leg cross-sectional points, this study established fitting equations of “pressure/displacement versus leg cross-sectional test points” for each cross section of the knee joint, enabling accurate prediction of human body surface displacement based on pressure values. These conclusions provide a theoretical reference and data support for optimizing the balance between functionality and comfort of knee sleeves in accordance with human physiological characteristics.
Keywords
With the rise of nationwide fitness programs, the demand for sports knee sleeves has been increasing. 1 Knee sleeves stabilize the knee joint, assist movement, and prevent injuries by applying pressure,2,3 with pressure comfort becoming a core factor affecting protective efficacy and user experience. However, most knee sleeve products currently on the market generally suffer from uneven pressure distribution and the difficulty of balancing functionality and comfort. 4 Traditional knee sleeve design often relies on try-on adjustments to accommodate the morphological characteristics of the human knee, which is inefficient and lacks a quantitative basis. Finite-element analysis discretizes a continuous elastic body into finite elements and, with the aid of computer technology, performs numerical solutions on each element, progressively studying each unit to ultimately achieve the purpose of analyzing the overall structure. 5 As a powerful numerical simulation tool, finite-element analysis has been widely applied in research on clothing pressure comfort, 6 enabling accurate simulation of the mechanical interaction between the human body and clothing.
Baek et al. 7 found that skin pressure increases threefold when wearing knee sleeves. Excessive clothing pressure can cause human discomfort and even negatively impact health. 8 Xu et al. 9 used sensors to measure and analyze knee joint forces during kneeling in subjects wearing five types of sports knee sleeves made of different materials. The study found that the five different materials had varying effects on knee joint force distribution, with professional gel offering the best impact protection. Lu et al. 10 knitted nylon, conductive silver yarn, and spandex to prepare an elastic capacitive yarn strain sensor, which was then integrated into sports knee sleeves to construct an intelligent joint injury rehabilitation assistance training system, providing support for the field of rehabilitation training. The aforementioned studies focus on the measurement and evaluation of material properties, pressure, and physiological signals. In contrast, finite-element analysis, by constructing biomechanical models, simulates and quantifies the internal mechanical interaction mechanisms between the knee sleeve and the knee joint during the early design phase, providing a basis for structural optimization. Xie et al. 11 established a finite-element model of the knee joint and knee sleeve, analyzing the impact of wearing knee sleeves on knee ligaments from the two dimensions of pressure and displacement, and used the maximum displacement difference as an evaluation index. This model can predict the protective effect of elastic knee sleeves and provide technical support for their design. Xu and He 12 established a knee joint simulation model based on finite-element analysis. By applying different pressures to the soft tissue of the knee joint, they studied the stress and displacement on the meniscus and tibiofemoral cartilage under different knee flexion angles and knee sleeve tightness levels, offering references for the optimal design of knee sleeves.
In the research on knee sleeves, current achievements mostly focus on overall pressure prediction or material properties. However, there is still a lack of systematic research on the distribution and quantitative relationship between knee sleeve pressure and body surface displacement at different angular positions of the leg. When the human body wears knee sleeves, the inward displacement perpendicular to the body surface generated by knee sleeve pressure is an important indicator affecting pressure comfort and guiding clothing structure optimization design. Therefore, in-depth exploration of the relationship among knee sleeve pressure, displacement, and the points on the leg cross-section holds significant reference value for enhancing the protective performance of knee sleeves, improving human athletic function, and optimizing wearing comfort. Based on this, this study established a three-dimensional finite-element model of the human knee joint using CT images, and constructed geometric models of the “knee sleeve–knee joint” using MIMICS and Solidworks. Thirty subjects were selected to wear five types of experimental knee sleeves with different structural designs for pressure testing. The finite-element model was utilized to investigate the relationship between pressure and human body surface displacement during knee sleeve wear. Through curve fitting, a quantitative relationship was established among knee sleeve pressure, body surface displacement, and leg cross-sectional points. These conclusions provide a theoretical reference and data support for optimizing the balance between functionality and comfort of knee sleeves in accordance with human physiological characteristics.
Finite-element simulation and three-dimensional modeling
Establishment of three-dimensional model of the “knee joint–knee sleeve”
Construction of the finite-element model of the human knee joint
(1) CT scan of the human body
CT scans can record high-quality images of organs and bones within a very short time. 13 Using MIMICS software to process CT images enables the establishment of high-precision three-dimensional models for clinical measurements. 14 To construct an accurate model of the human knee joint, in this study we built a three-dimensional geometric model of the knee joint using MIMICS software based on human CT image data.
In this study, the human CT scan was performed at the positron emission tomography–computed tomography (PET-CT) Center of the First Hospital of Jilin University using a Biograph 16HR PET-CT device. A healthy Chinese male college student (age 24 years, height 175 cm, weight 70 kg, with no prior history of knee trauma or osteoarthritis) who met the national standard “Human Dimensions of Chinese Adults” (GB/T10000-2023) 15 was selected as the subject. Subject selection was based on the national standard, ensuring that the subject’s average height, weight, and other indicators aligned with statistical values within the 95% confidence interval. 16
Spiral CT was used to scan the subject’s lower limbs with the following parameters: slice thickness of 0.5 mm, scan interval of 1 mm, and image resolution of 512 × 512 pixels. A total of 452 tomographic images were obtained and stored in DICOM format. 17 The CT image data of the lower limbs are shown in Figure 1.
(2) Determination of the knee joint modeling scope
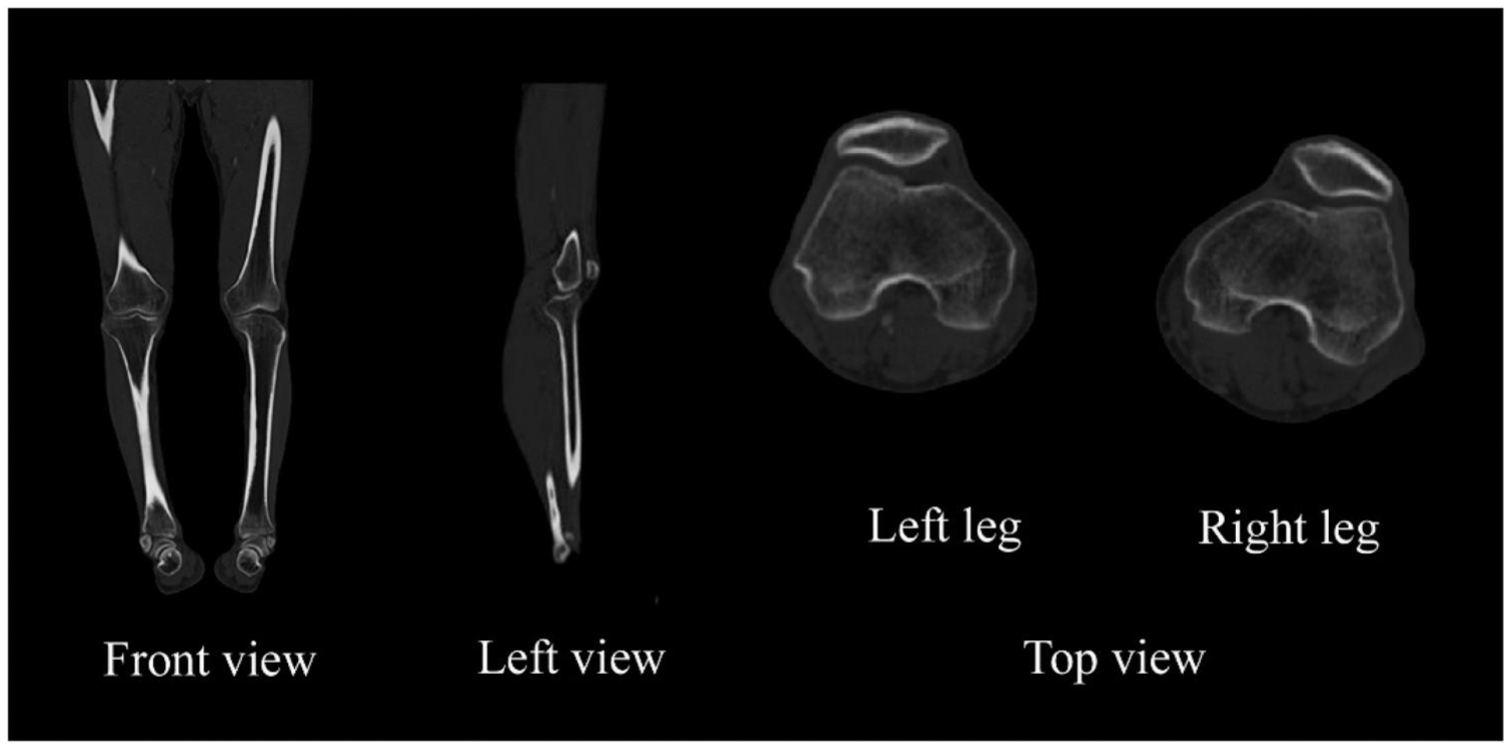
CT image of the subject’s lower limbs.
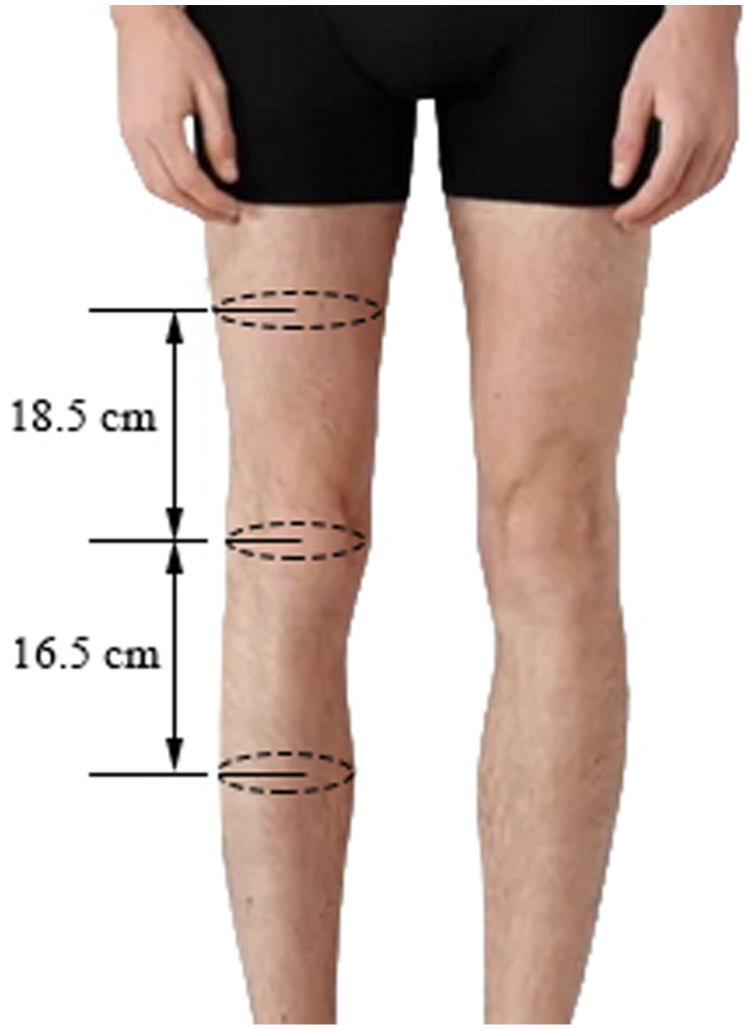
Using MIMICS 20.0 software, the tomographic images of the knee joint in DICOM format were imported, and the geometric model of the knee joint was constructed through functions such as region growing, threshold segmentation, and Boolean operations. Based on the physiological characteristics of human movement and the actual usage scenarios of knee sleeves, the right leg was selected as the modeling object. The modeling scope was set as the horizontal sections from 18.5 cm above to 16.5 cm below the center of the patella, with a total length of 35 cm. 18 A schematic diagram of the knee joint modeling scope is shown in Figure 2.
(3) Establishment of the three-dimensional model of the knee joint
Schematic diagram of the knee joint modeling scope.
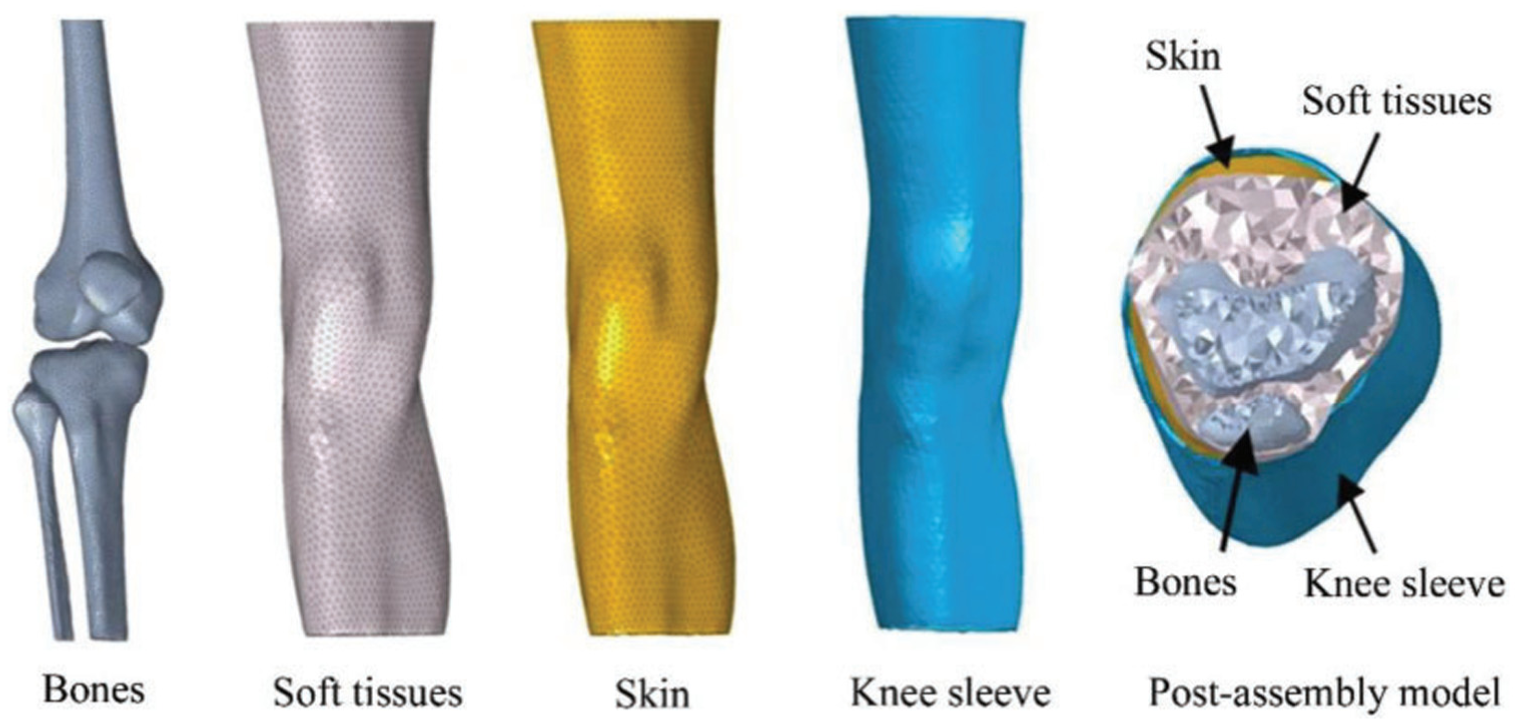
Based on the simplification method of knee joint structure in the authors’ previous study, 19 the knee joint was divided into three main components: bones, soft tissue, and skin. The bones consist of the fibula, femur, patella, tibia, and other parts 20 ; the soft tissue includes the joint capsule, meniscus, cruciate ligaments, tendons, and muscles; the skin primarily consists of three layers: the epidermis, dermis, and subcutaneous tissue. 21
Bone masks were generated using the CT bone segmentation function, and after calculation and smoothing, the bone models were exported in STL format. The bone models are shown in Figure 3.
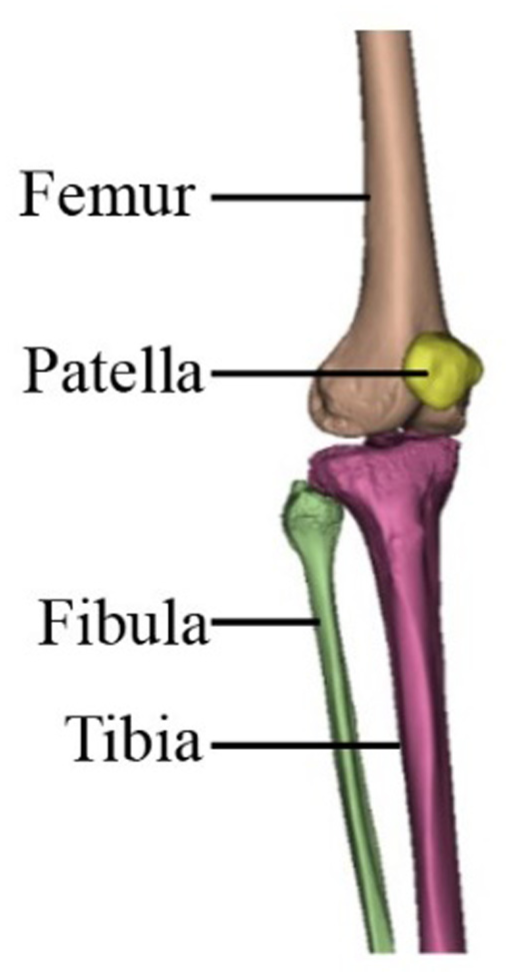
Geometric model of the bones.
During the modeling process of soft tissue and skin, the soft tissue mask was selected through threshold segmentation. Independent masks for the skin and soft tissue were then generated using Boolean operations and morphological operations. After calculation and smoothing, the geometric models of the soft tissue and skin were exported in STL format, as shown in Figure 4.
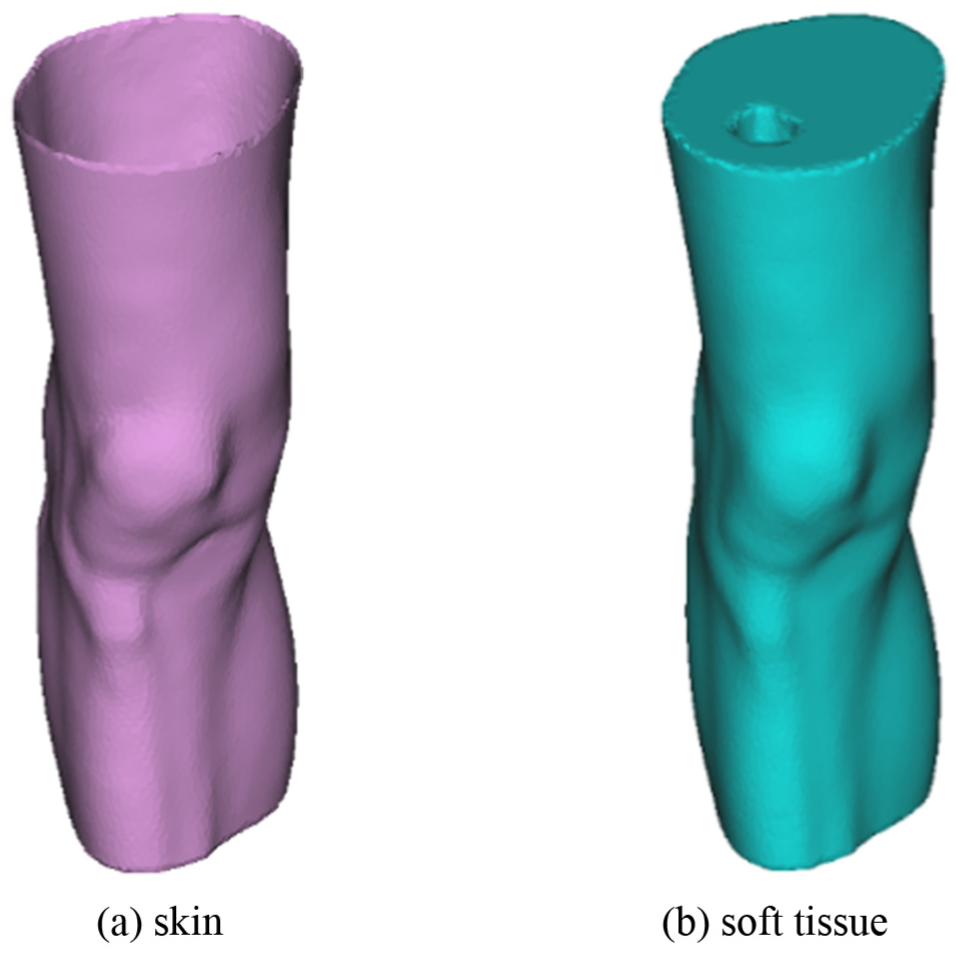
Geometric models of (a) skin and (b) soft tissue.
Three-dimensional construction of the geometric model of the knee sleeve
Given the softness of knee sleeve materials, which makes them prone to wrinkling and deformation in a free state, and the wide application of Solidworks software in product design, 22 this study utilized the “surface editing” function in Solidworks to construct a shell model of the elastic knee sleeve. Specifically, the human body surface was processed to obtain a conforming curved surface, which was then optimized and adjusted according to the actual wearing state. The final three-dimensional model of the knee sleeve was constructed, as shown in Figure 5.
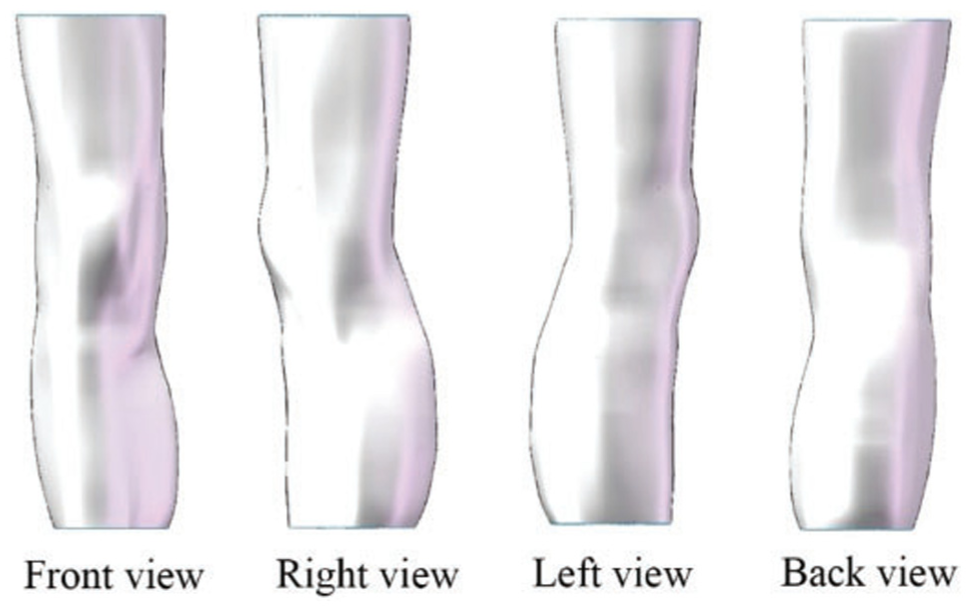
Geometric model of the knee sleeve.
Assembly of the geometric model of the “knee sleeve–knee joint”
The geometric model of the knee joint was initially materialized using 3-matic in MIMICS and exported in STP format. After being imported into Solidworks, the model was inspected and geometric defects were repaired until it was complete. The assembly of bones, soft tissue, and skin was completed using the origin of the coordinate system as a reference. After removing interference areas from the knee joint model, the assembly of the elastic knee sleeve and the joint model was completed, generating a solid model in STEP format and achieving complete geometric modeling of the “knee sleeve–knee joint.”Figure 6 shows a schematic diagram of the assembly of the knee joint and the elastic sleeve-type knee sleeve.
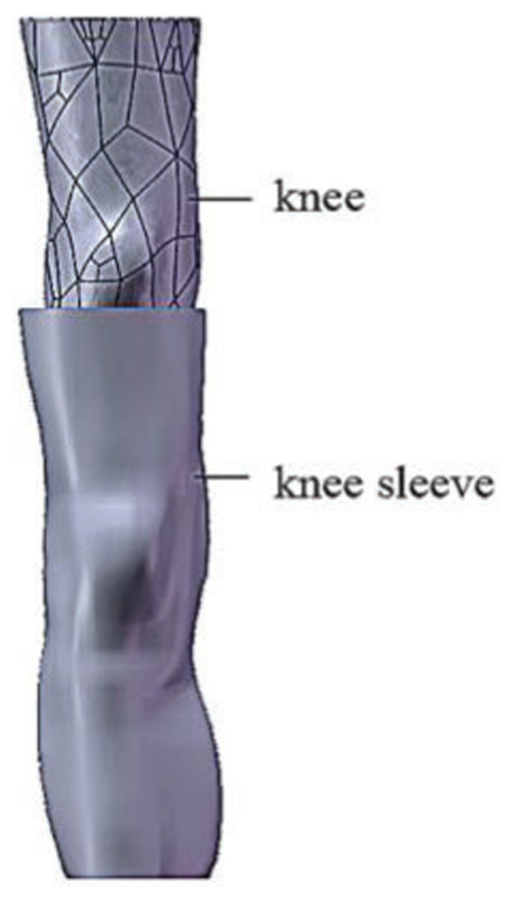
Assembly of the geometric models of the knee sleeve and knee joint.
Pre-processing of the “knee sleeve–knee joint” geometric model
Mesh generation
In finite-element analysis, the accuracy of simulation values primarily depends on the appropriate setting of mesh element types and their size parameters. 23 As triangular meshes are the most fundamental and suitable for handling complex geometries, surface meshes were set as triangular meshes in this study. Tetrahedral elements not only offer high generation efficiency but also automatically refine critical areas 24 ; therefore, the tetrahedral mesh C3D4 was selected as the volume mesh element type in this study. When setting mesh sizes, smaller sizes generally yield higher computational accuracy but simultaneously increase computation time and resource consumption. 25 Conversely, overly fine meshes may not improve accuracy and can waste computational resources. 26 Considering both computational accuracy and efficiency, the mesh sizes for bones and the knee sleeve were ultimately set to 3 mm and 4 mm, respectively, and those for soft tissue and skin were set to 5 mm in this study.
After completing the mesh generation, the model was exported in INP format for subsequent finite-element simulation in ABAQUS software. Since bones and soft tissue are solid models, volume meshes needed to be exported; on the other hand, the knee sleeve and skin are shell models, so surface meshes were selected for export, as shown in Figure 7.
Schematic diagram of surface mesh and volume mesh.
Material assignment
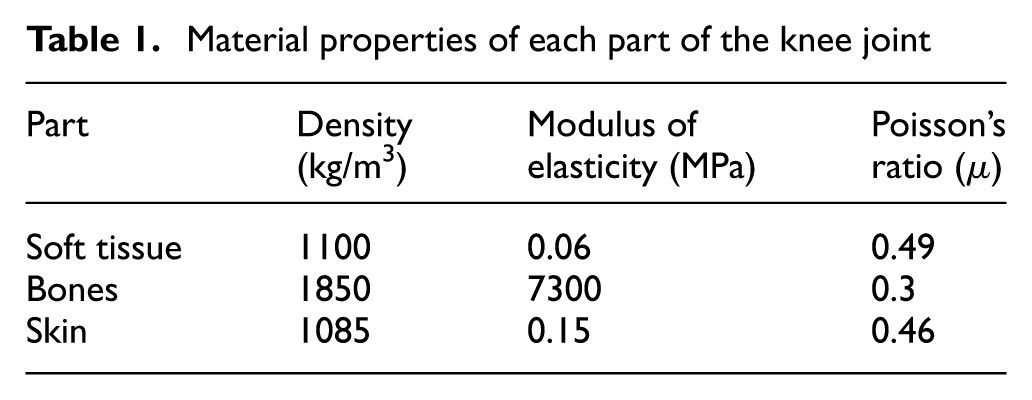
Bones, soft tissue, and skin all exhibit anisotropic behavior under compressive states, and there are also significant differences in the elastic modulus among different parts of the same tissue. To enhance the realism of the finite-element simulation, the material property parameters of each tissue structure must be precisely set to ensure the accuracy and credibility of the analysis results. However, in the process of finite-element analysis, it is challenging to simulate the tissue characteristics of materials with complete fidelity. Studies have shown 27 that ideal simulation results can still be achieved by simplifying bones, soft tissue, and skin as isotropic linear elastic materials for numerical simulation. Therefore, in this study, the skin, bones, and soft tissue were all defined as isotropic linear elastic materials, and material properties were assigned to each model in ABAQUS. The specific values 28 are detailed in Table 1.
Material properties of each part of the knee joint
Contact setting
Based on the physiological and anatomical knowledge of the knee joint, three pairs of contact relationships were defined: “bones–soft tissue,”“soft tissue–skin,” and “skin–knee sleeve,” as shown in Figure 8.
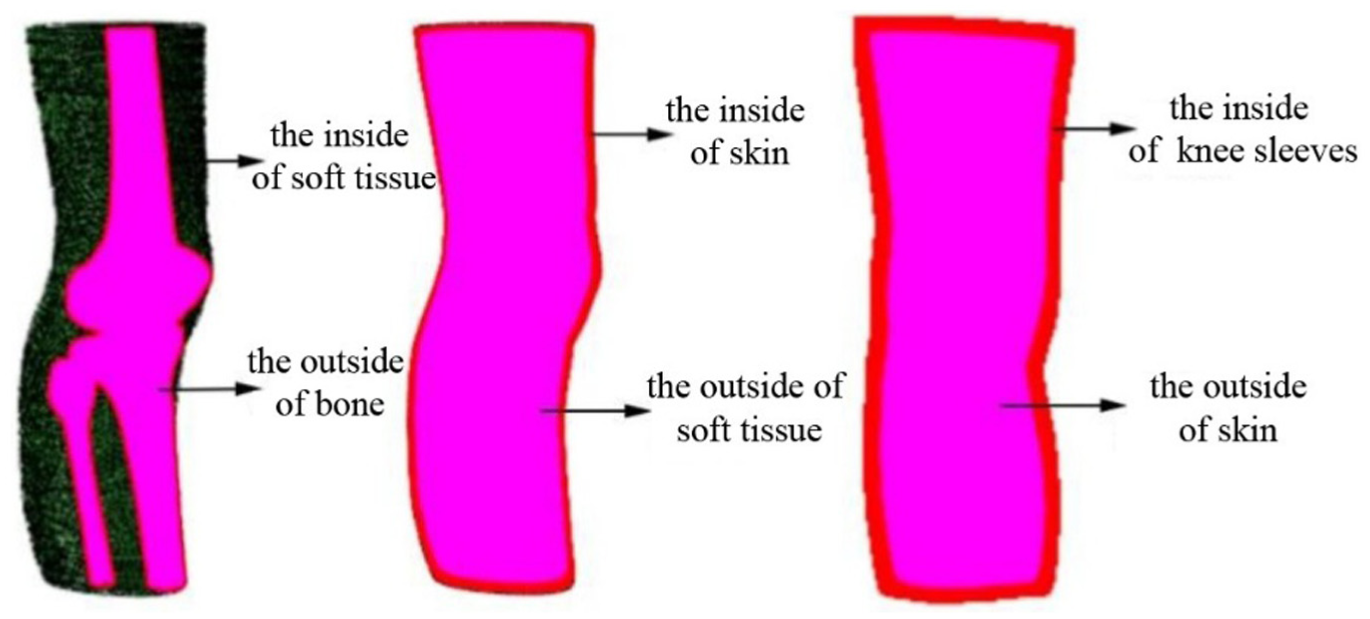
Contact setting.
The first two contact pairs were defined as “tie” constraints to ensure that the components formed an integral whole during the simulation process without mutual penetration. The “skin–knee sleeve” contact was set as friction contact, with a tangential friction coefficient of 0.2, 17 and the normal contact was set as “hard” contact with the penalty function method. The contact tolerance should be set appropriately. If the tolerance is too large, penetration between the skin and soft tissue may occur, 29 causing numerical interference and reducing analysis accuracy. If the tolerance is too small, contact may fail to be generated. Through multiple experiments, the contact tolerance was set to 0.5 mm to achieve automatic contact generation. 17 The contact settings are listed in Table 2.
Contact settings of the model
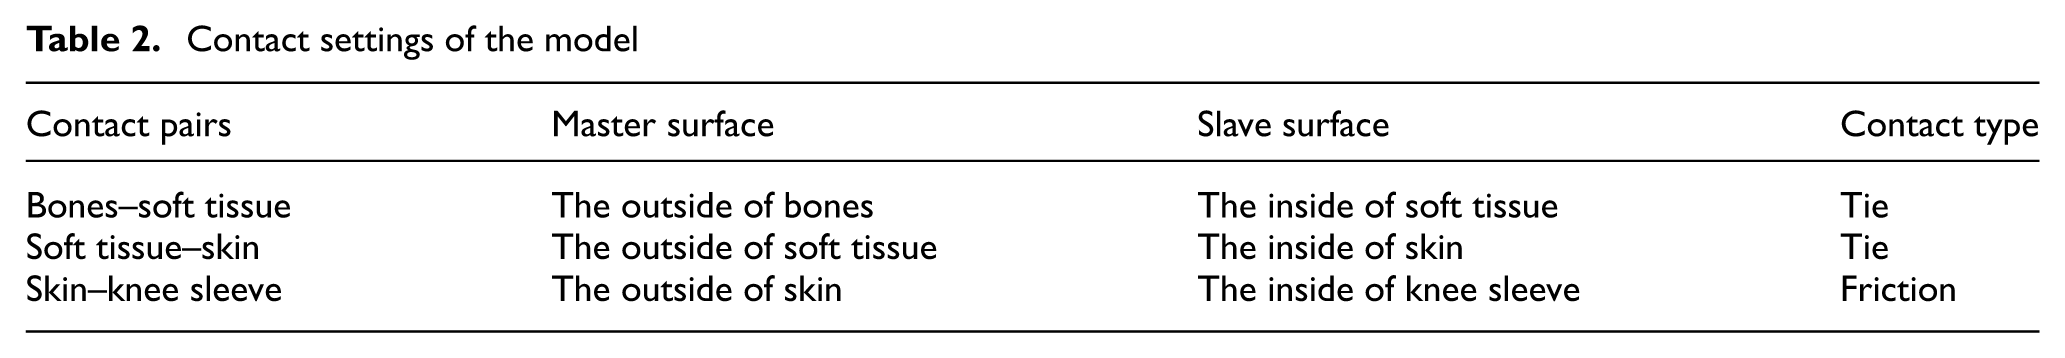
Setting of boundary conditions
The reasonableness of the boundary conditions in finite-element simulation directly affects the correctness and validity of the simulation results. 30 Referring to the real mechanical state of the human body under compression, this study applied boundary constraint conditions in the Load module of ABAQUS. Fixed constraints in three directions were imposed on the upper and lower end surfaces of the joint model, meaning the displacement components of the bones in the X, Y, and Z directions were all set to zero, to accurately simulate the real mechanical state of the human body under compression. The setting of boundary conditions is shown in Figure 9.
Schematic diagram of the boundary condition setting.
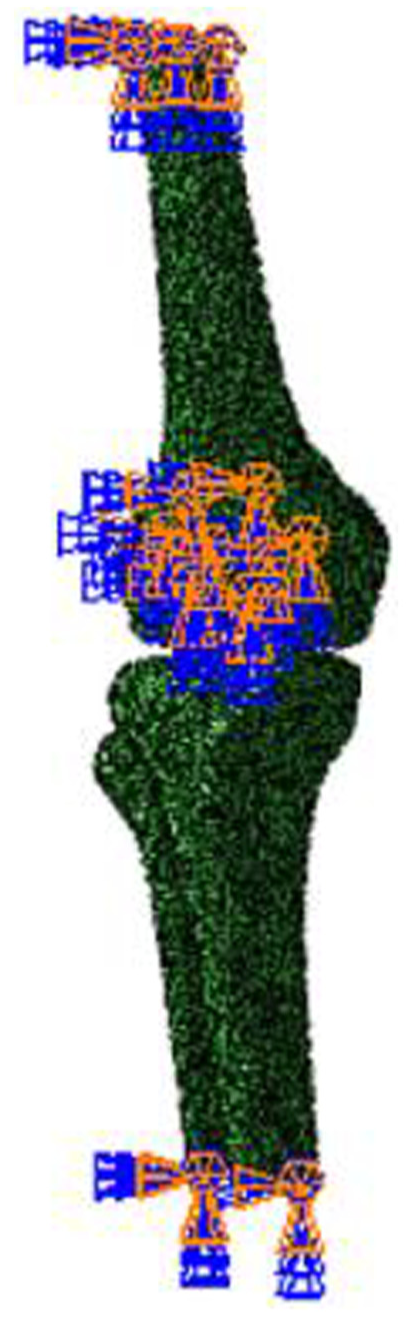
Setting of loads
In this study, loads were applied to the skin surface in the form of pressure to simulate the forces on the knee joint, with the direction perpendicular to the skin surface. The load setting in this study mainly included two aspects: health verification of the knee joint model and validity verification of the “knee sleeve–knee joint” model.
For the health verification of the knee joint model, studies have shown 31 that the pressure interval [5.88 kPa, ∞] represents a high-pressure value area, where wearing knee sleeves would cause human discomfort; the pressure interval [−∞, 1.96 kPa] represents a low-pressure value area, where the protective function of the knee sleeve is weak; other pressure intervals [1.96, 5.88 kPa] represent normal pressure value areas, which are the comfortable zones for the human body when wearing protective gear. Furthermore, Gao 32 pointed out that the optimal pressure interval for sports knee sleeves is 2.1528–2.8617 kPa, which can effectively stabilize the joint and provide protection. Considering both factors mentioned above, at this stage, 1.96, 2.15, 2.86, and 5.88 kPa were selected as load data to simulate the pressure exerted by knee sleeves on the knee joint. Static load was selected as the loading mode, as shown in Figure 10(a).
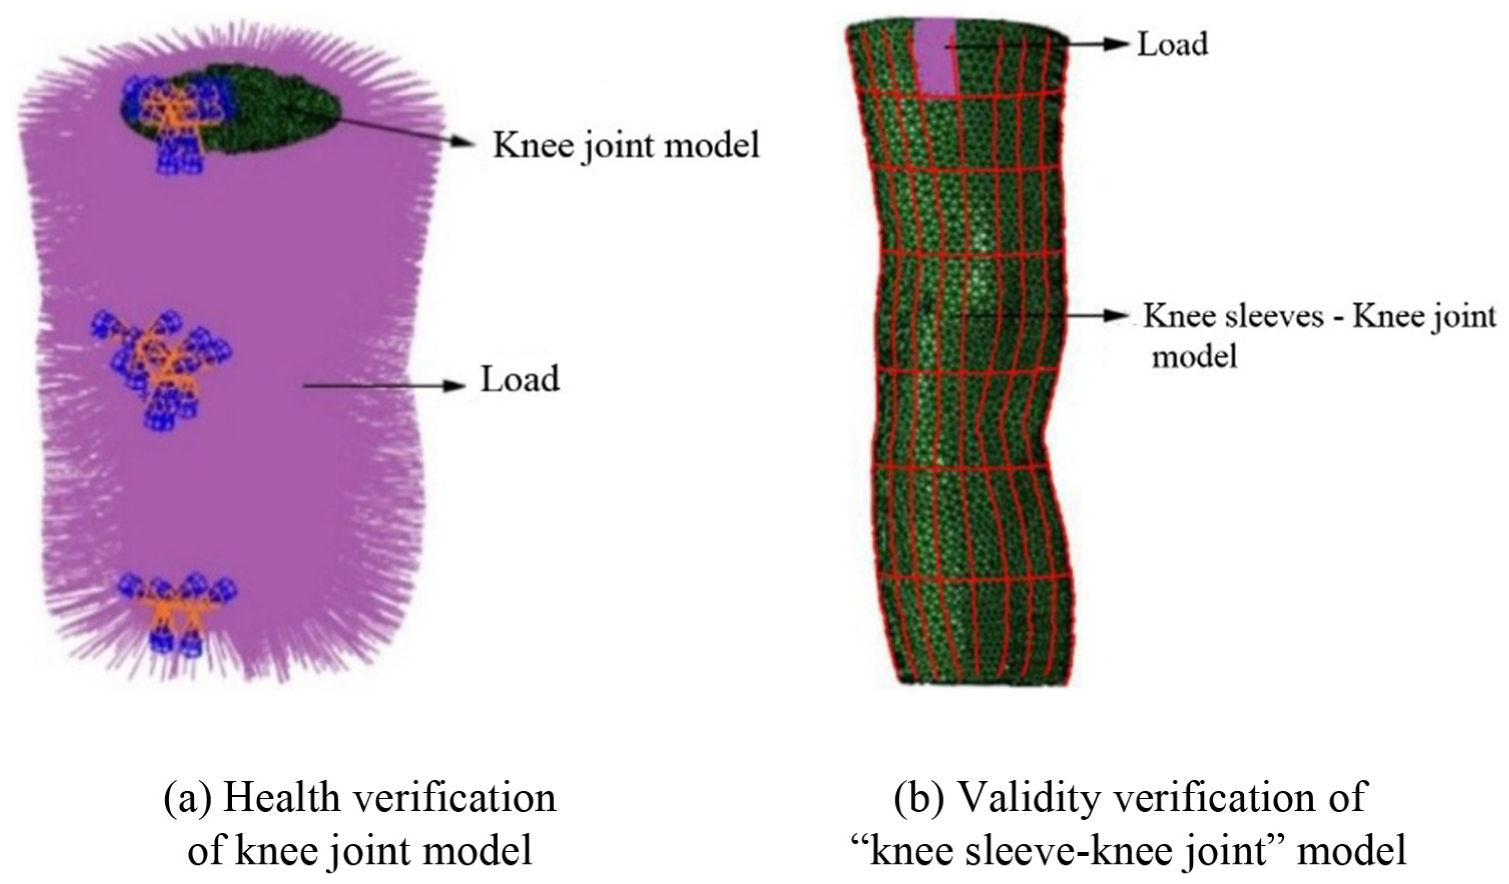
Setting of loads: (a) health verification of knee joint model; (b) validity verification of “knee sleeve–knee joint” model.
For the validity verification of the “knee sleeve–knee joint” model, this study obtained actual measurement data from human clothing pressure tests. These pressure data were applied as loads to the “knee sleeve–knee joint” model, as shown in Figure 10(b). The contact pressure values at the measurement points under the knee sleeve wearing condition were obtained through numerical simulation and then compared and analyzed with the experimental data.
Selection of experimental knee sleeves and pressure testing
Selection of experimental knee sleeves
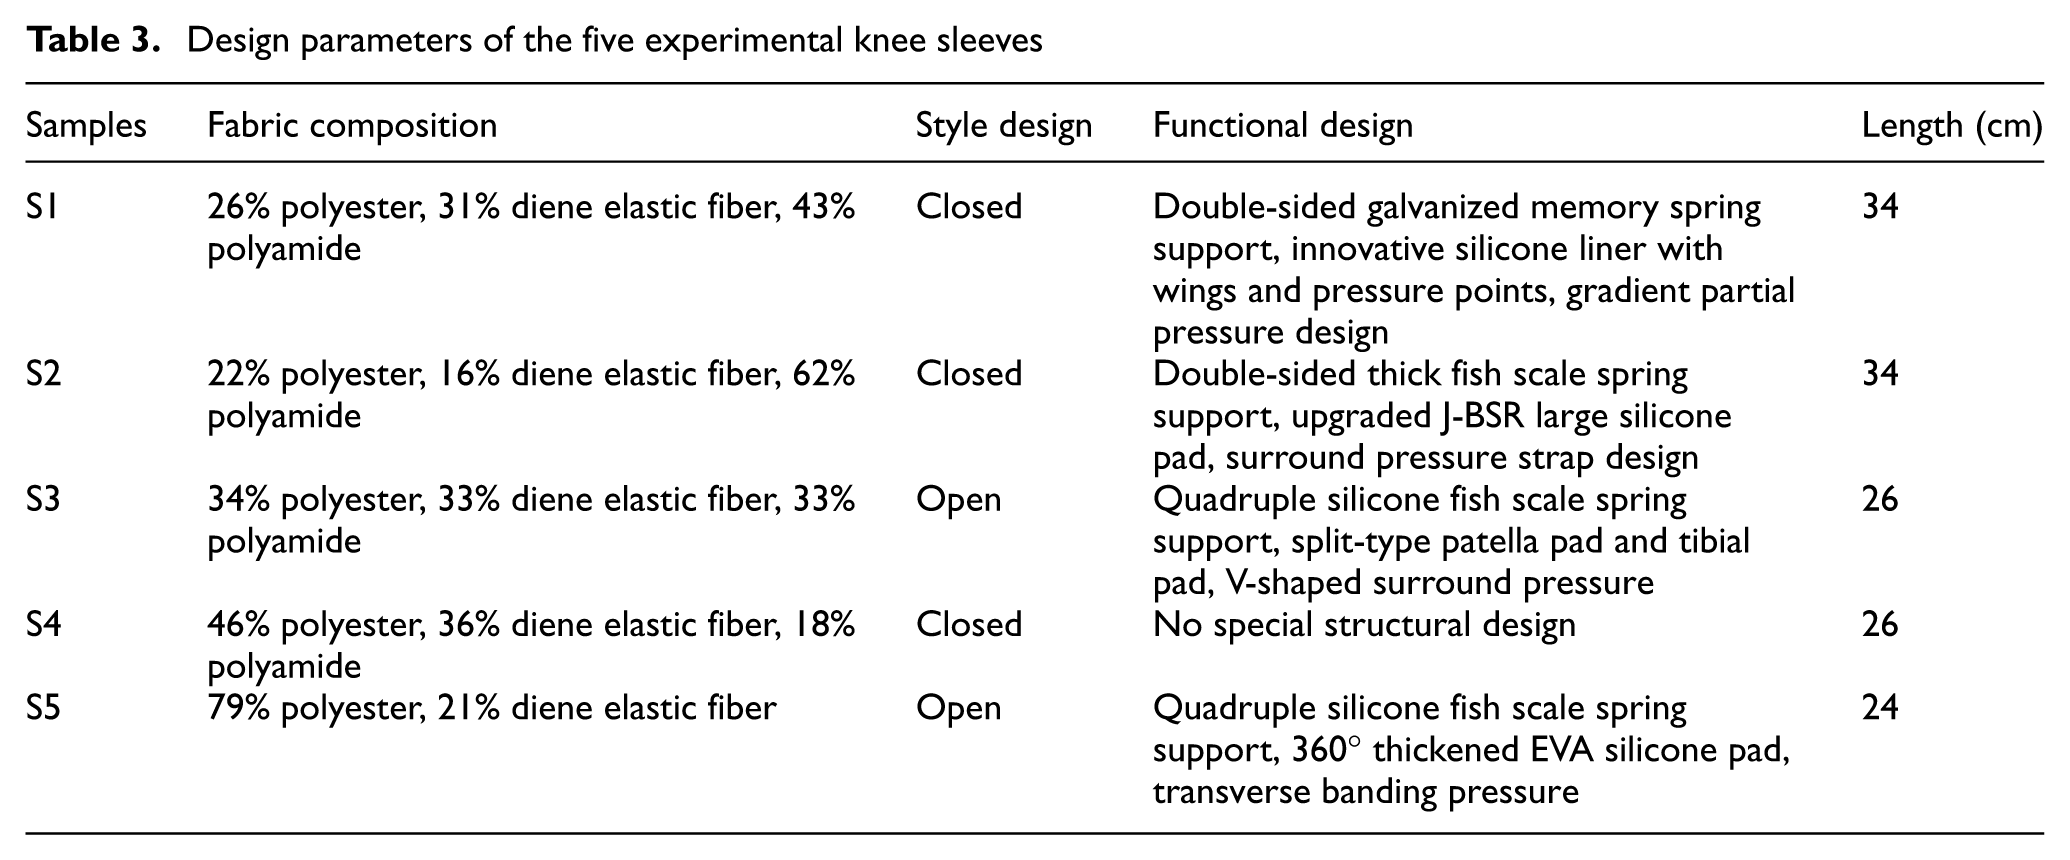
This study selected five types of men’s knee sleeves currently common on the market as experimental samples, labeled S1–S5. The main fabric components were polyester fiber and diene elastic fiber, and all samples were size M. Among them, S1, S2, and S4 were closed-style knee sleeves, whereas S3 and S5 were open-style knee sleeves, as shown in Figure 11. The design parameters of the five experimental knee sleeves are given in Table 3. The knee sleeves selected for this experiment all complied with the standard FZ/T74001-2020 “Textiles - Knitted sports protectors”. 33 Due to the varying fabric components in different parts of the knee sleeves, to facilitate material assignment in ABAQUS, the fabric tested for performance in this study was the fabric with the largest area proportion in each type of knee sleeve.
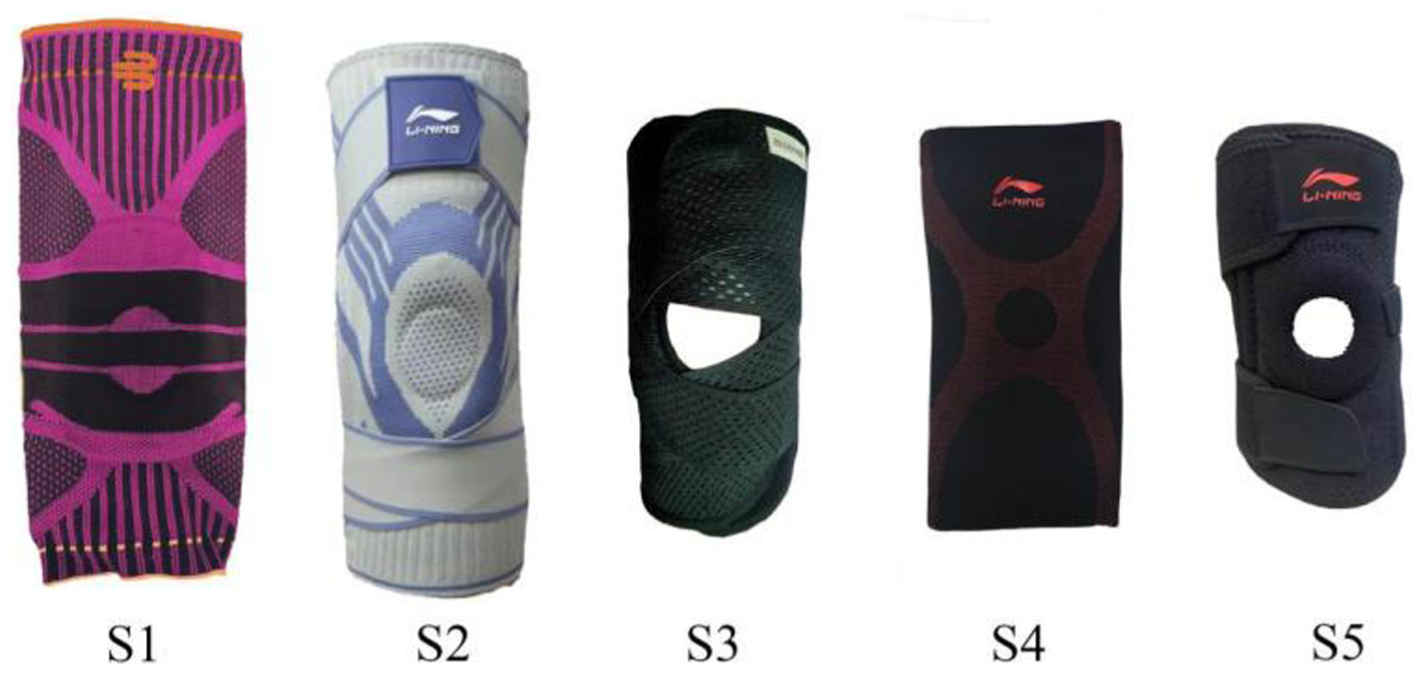
Five experimental knee sleeves.
Design parameters of the five experimental knee sleeves
The elastic modulus test of the knee sleeve materials was conducted using an INSTRON 5967 universal material testing machine (INSTRON, USA). Through testing and calculation, the elastic modulus and Poisson’s ratio of the five experimental knee sleeve materials were obtained, as presented in Table 4.
Material properties of the experimental knee sleeves
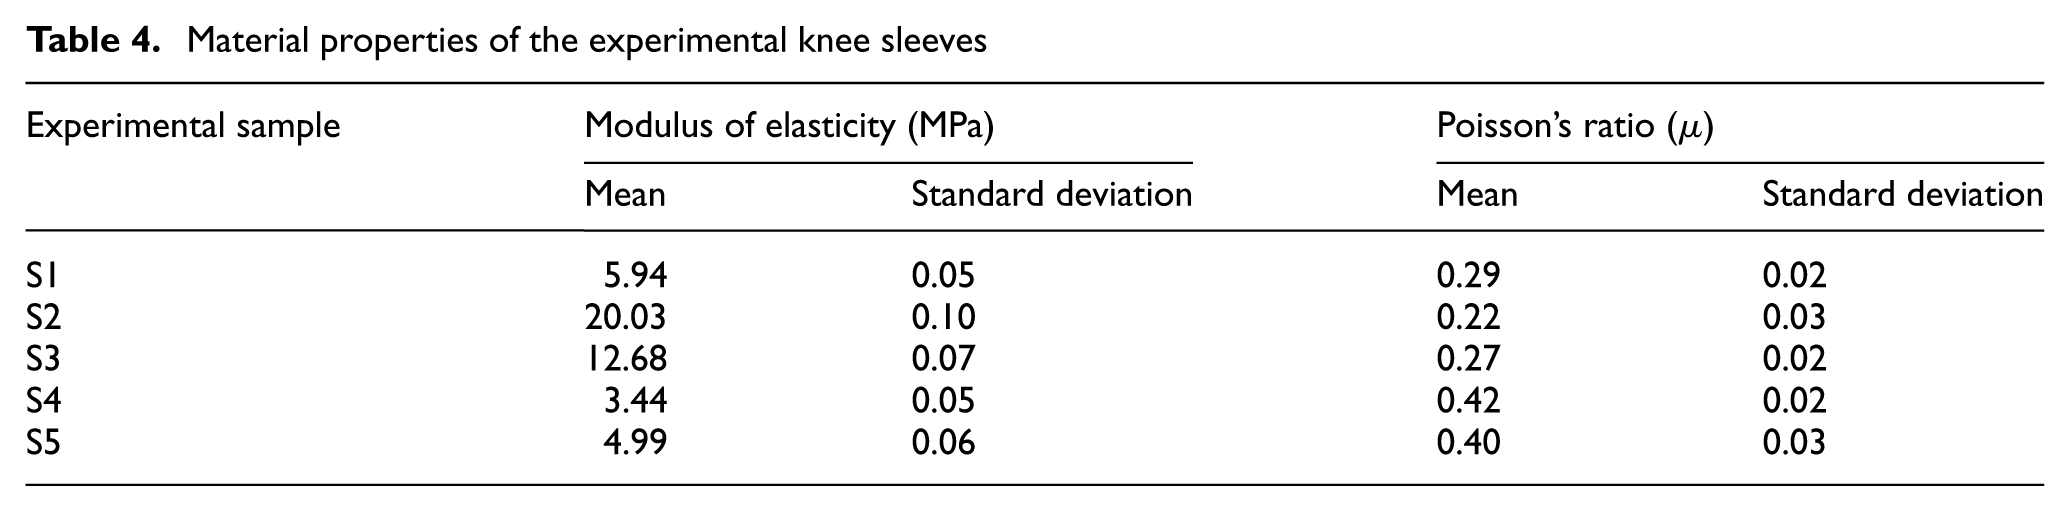
It can be seen from Table 4 that the standard deviations of all samples are relatively small, indicating that the test results have good repeatability, which also demonstrates that the experimental measurement process is stable and reliable.
Clothing pressure experiment of knee sleeves
Experimental instrument: AMI3037-5S airbag contact pressure measurement system manufactured by AMI-TECHNO (Japan).
Experimental samples: Five experimental knee sleeves (S1–S5).
Experimental subjects: Thirty healthy male college students with no history of knee joint diseases were selected as subjects. The subjects were aged between 22 and 26 years, with a height range of 170–180 cm and a body weight range of 65–75 kg. The selection of subjects complied with the national standard “Human Dimensions of Chinese Adults” (GB/T10000-2023).
The selection process for the test reference points was as follows.
Within the coverage area of the knee sleeve, the pressure test was started 2 cm down from the top of the thigh, which was designated as the first circle; the test ended 2 cm up from the bottom of the calf, which was designated as the last circle.
The distance between the first and last circles was divided into seven equal parts (the shorter S3, S4, and S5 knee sleeves were divided into five equal parts). Starting from the first circle, each circle was labeled A, B, C, etc., sequentially until the last circle.
On each cross-section, the center point in front of the patella was taken as the starting point and numbered as test point 1. Then, test points were taken counterclockwise at 22.5° intervals until 16 points were obtained, numbered 1 to 16.
S1 and S2 had a total of 128 test points, S3 had 93 test points, S4 had 96 test points, and S5 had 95 test points (S3 and S5 featured an open-hole patella design, resulting in fewer test points than S4).
During the experiment, the airbag pressure sensor was placed between the subject’s skin and the inner layer of the knee sleeve to obtain pressure values at each measurement point for the 30 subjects wearing the five types of knee sleeves. The pressure measurement process is shown in Figure 12.
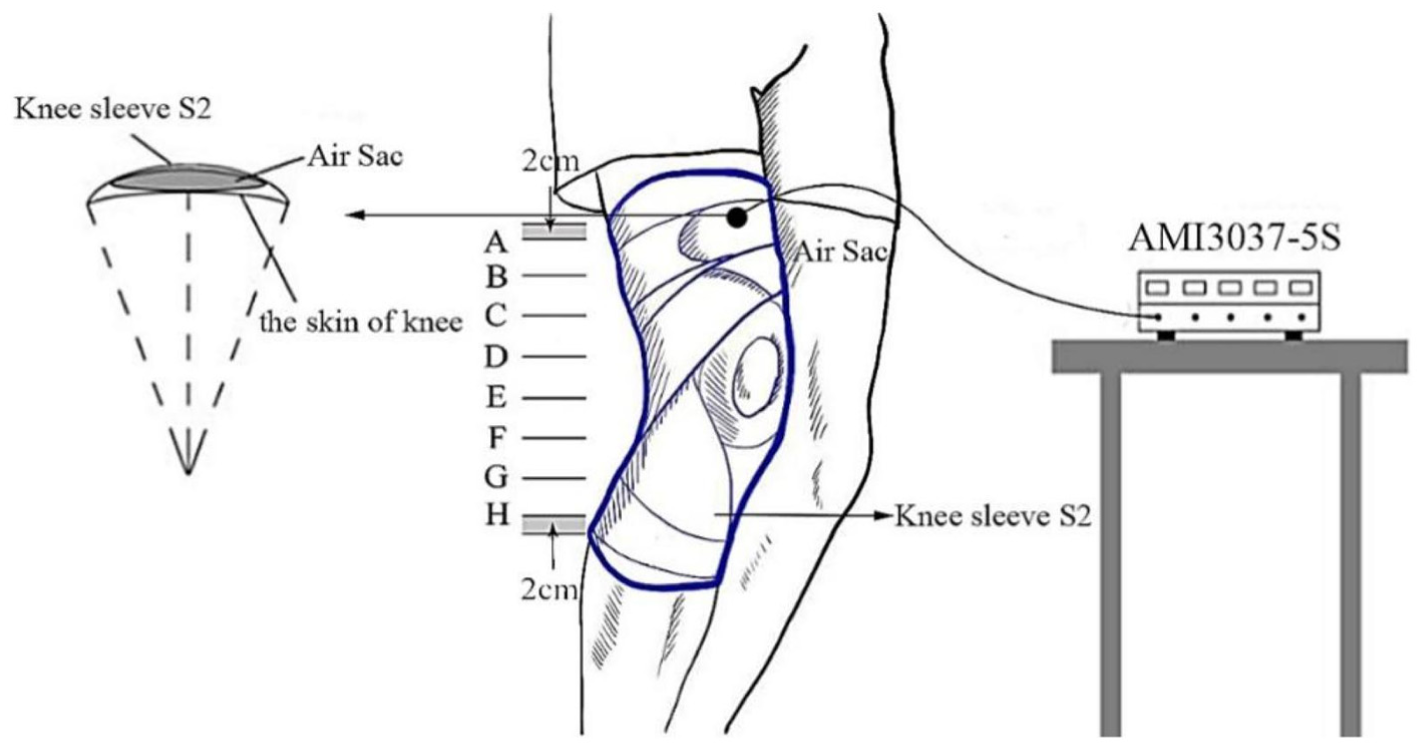
Test procedure of the clothing pressure of knee sleeves.
Due to the different lengths of the five experimental knee sleeves, the number of sections varied. To unify the number of sections across the five experimental knee sleeves, this study adopted a method of merging some pressure test sections. Based on the different lengths of the knee sleeves, Figure 13(a) represents the merging method for experimental knee sleeves S1 and S2, and Figure 13(b) represents the merging method for experimental knee sleeves S3, S4, and S5.
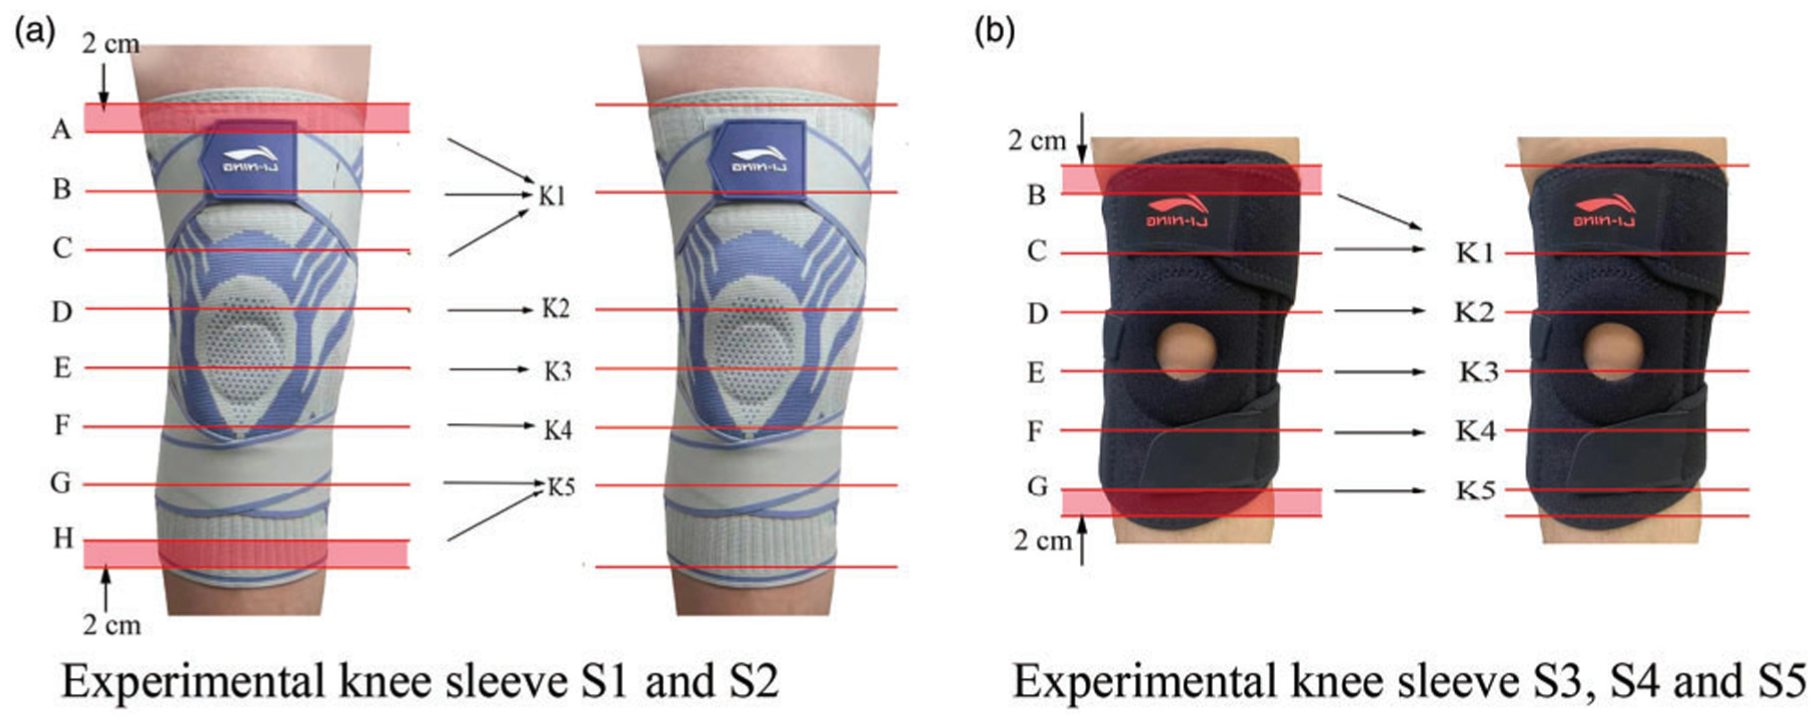
Schematic diagram of merging pressure test points.
Results and discussion
Clothing pressure test results of experimental knee sleeves
Through the knee sleeve pressure test, pressure data for 80 test points were obtained for each of the five experimental knee sleeves, as shown in Figure 14. In the figure, the horizontal axis represents the 16 pressure test points on each section (due to the open-hole design, experimental knee sleeve S3 had no pressure values at points 16, 1, and 2 on section K2, and S5 had no pressure value at point 1 on section K2), and the vertical axis represents the pressure values at different test points, in kPa.
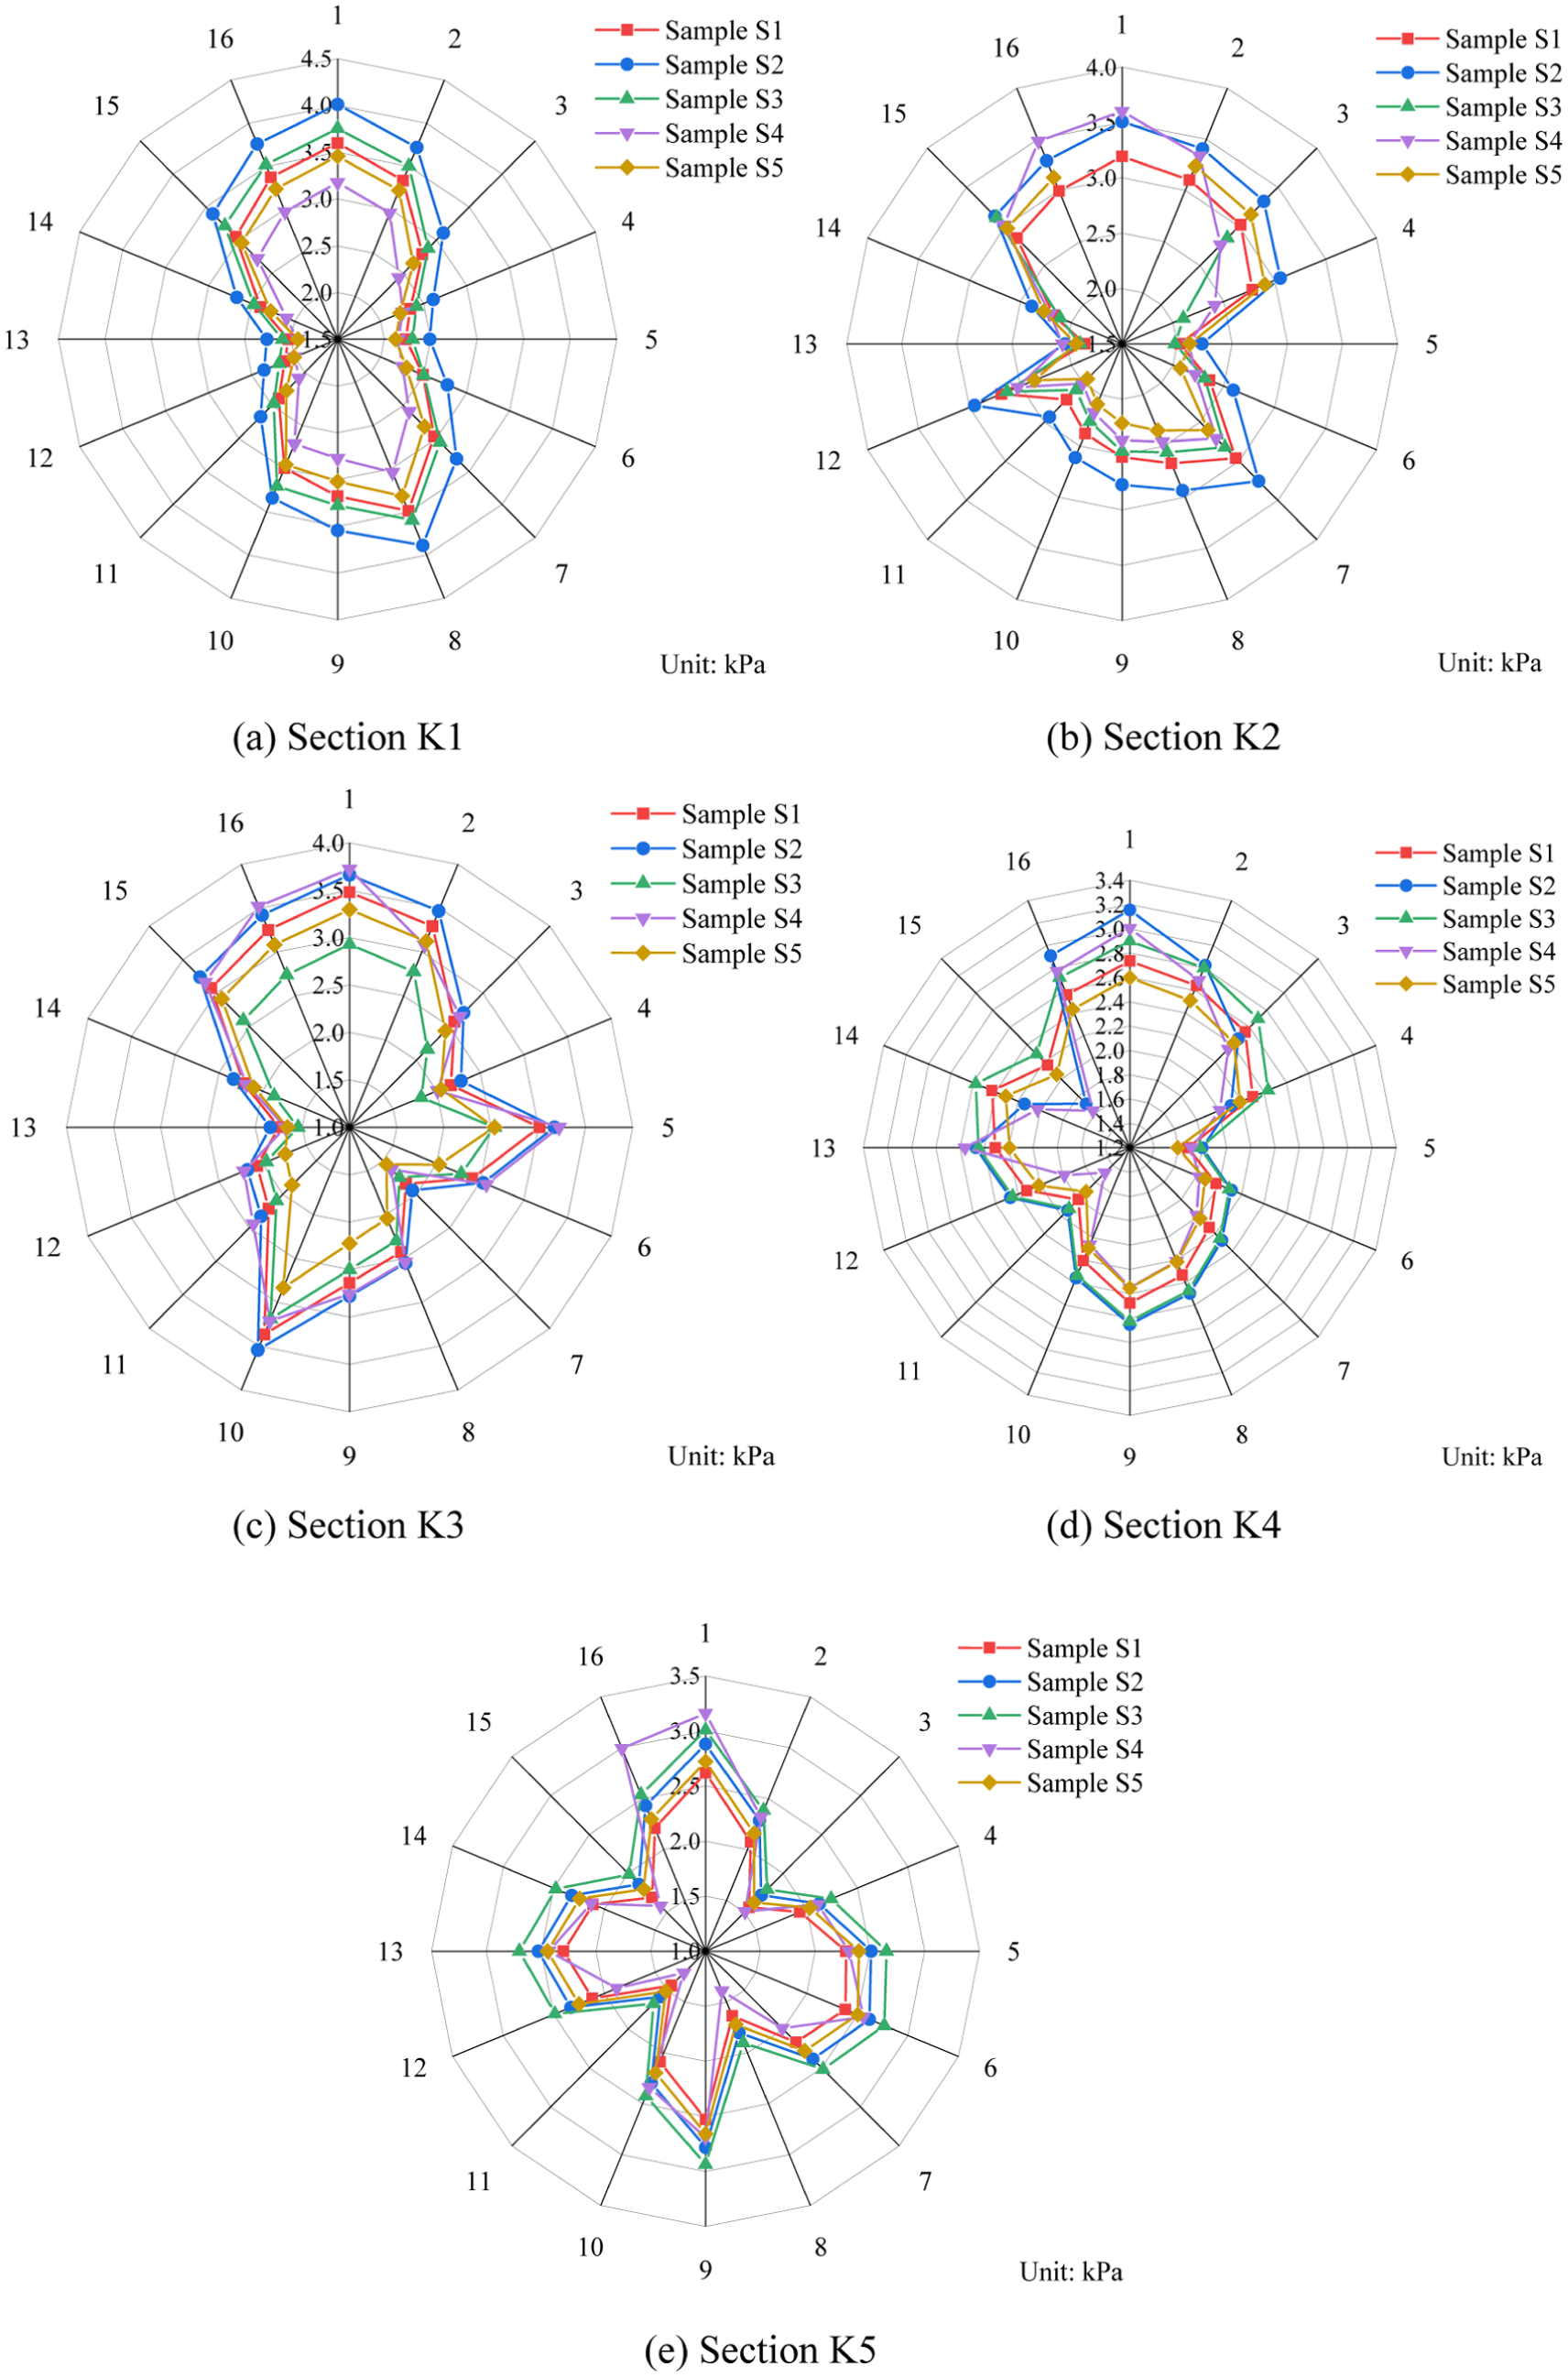
Pressure values of each section of the five experimental knee sleeves: (a) section K1; (b) section K2; (c) section K3; (d) section K4; (e) section K5.
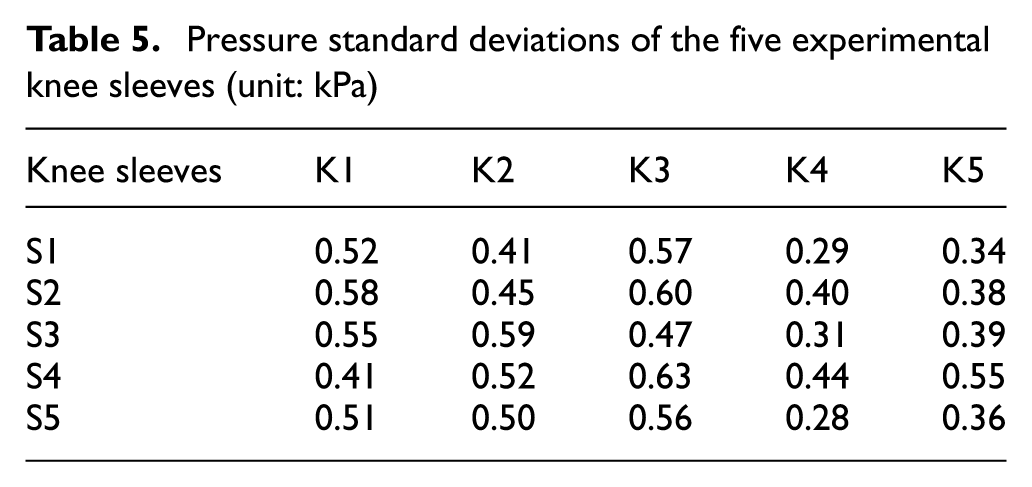
It can be seen from Figure 14 that when wearing the five different types of knee sleeves, the clothing pressure values on the same section of the human knee joint varied, but the overall distribution pattern of clothing pressure remained largely consistent. The standard deviations of the pressure values on each section in Figure 14 are presented in Table 5. From Table 5, it can be seen that the standard deviations of the five knee sleeves on each section are generally small, indicating that the pressure test data have good repeatability and that individual differences among subjects have little effect on the overall pressure distribution pattern. Among them, the standard deviation of section K2 for S3 is relatively high, which may be related to the open-hole design causing increased individual differences in the fit between the knee sleeve and the skin. The standard deviation of section K3 for S4 is the largest; this knee sleeve has no special functional structural design, resulting in large pressure fluctuations and more obvious individual differences. The standard deviations of the remaining sections are within acceptable ranges, further verifying the reliability of the experimental data.
Pressure standard deviations of the five experimental knee sleeves (unit: kPa)
Finite-element simulation of the “knee sleeve–knee joint” model
In the ABAQUS finite-element simulation, the pressure values measured from the pressure experiment were input as loads into the “knee sleeve–knee joint” model, yielding stress and displacement distribution cloud maps of the model. Taking experimental knee sleeve S2 as an example, the stress and displacement distribution cloud maps are shown in Figure 15.
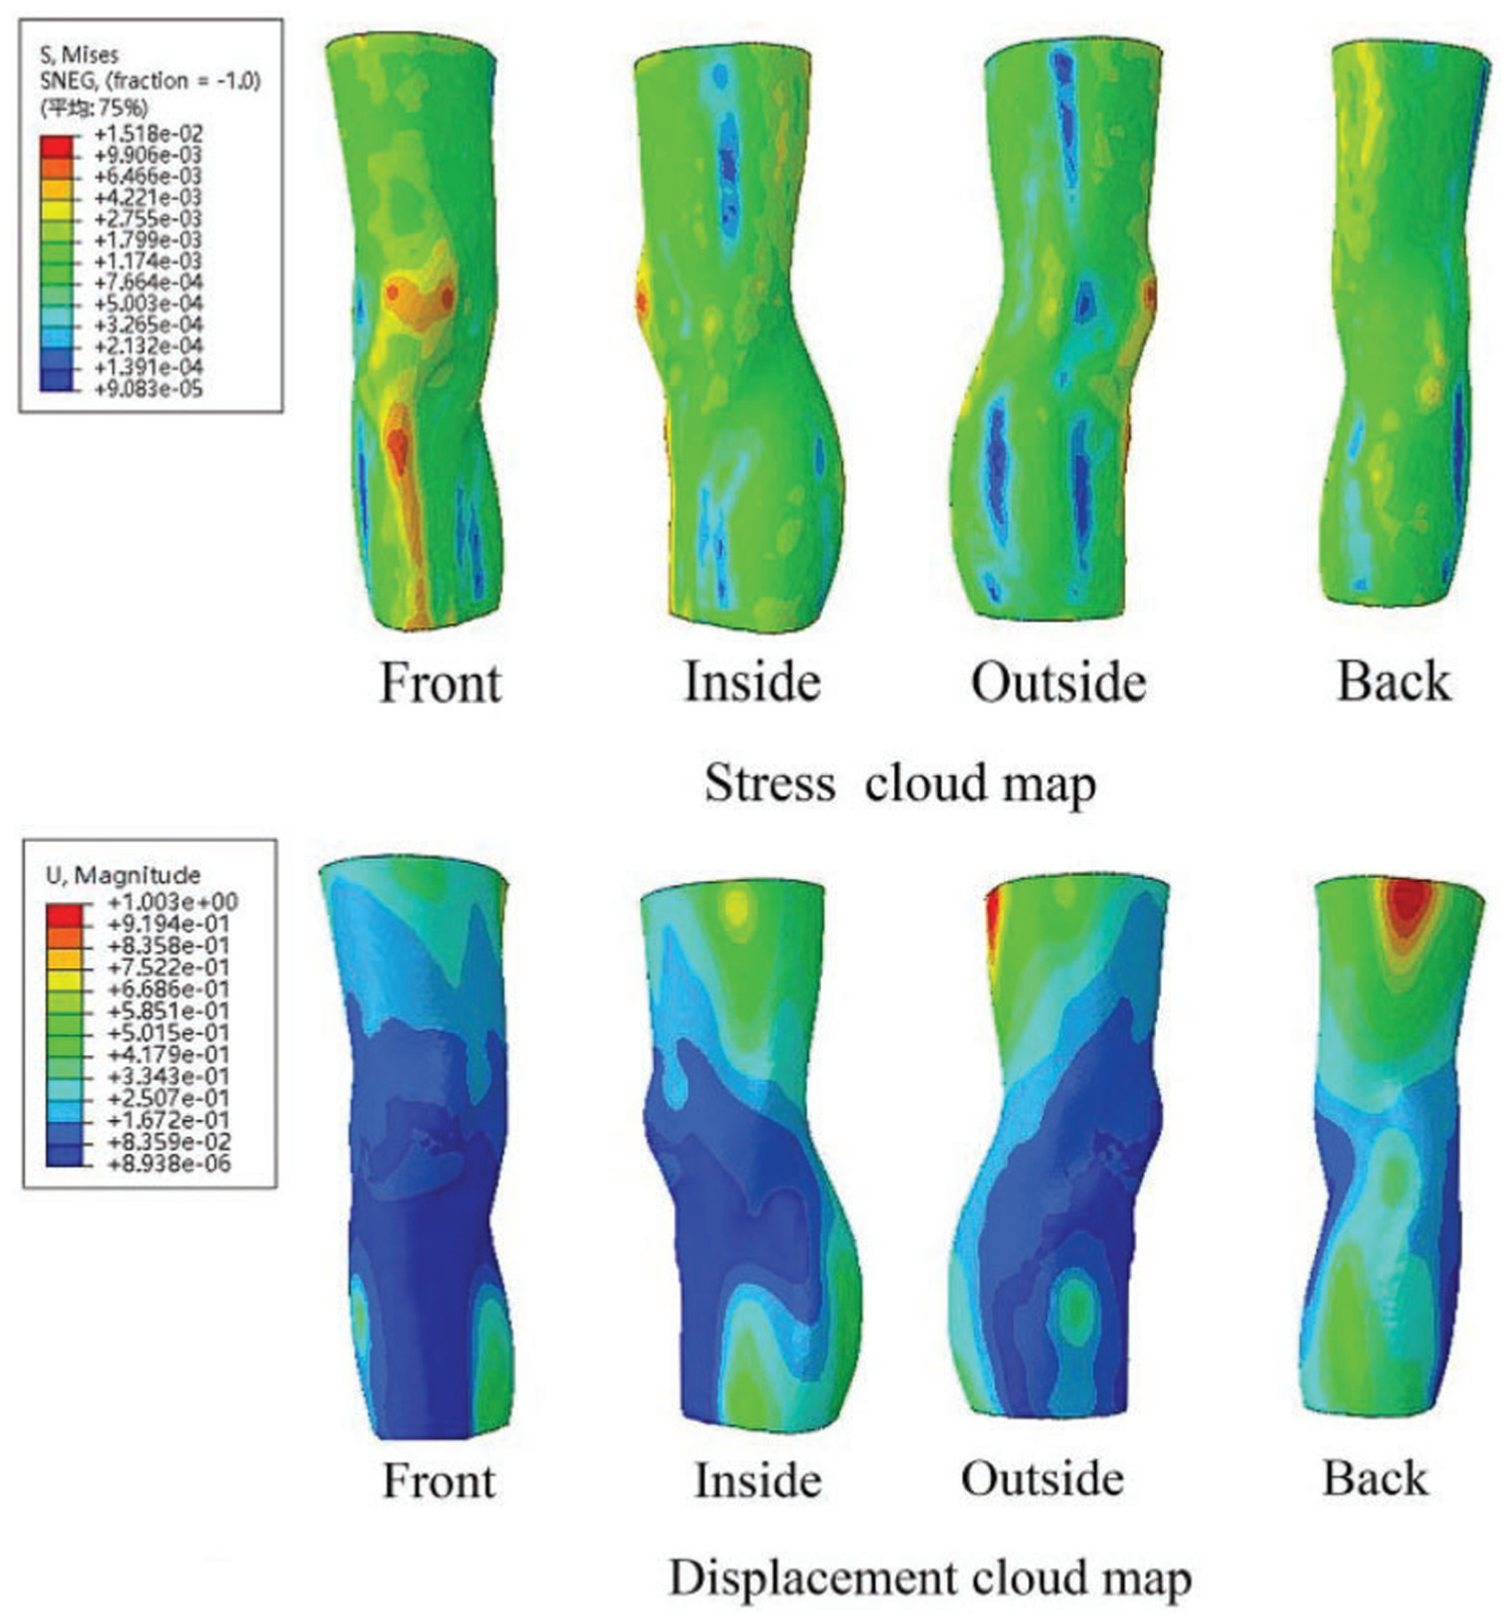
Stress and displacement distribution cloud map of the “knee sleeve–knee joint” model.
From the stress distribution cloud map in Figure 15(a), it can be seen that the stress in the anterior part of the lower leg and the patellar position of the knee joint was relatively high. This is because the radius of curvature in the anterior part of the lower leg and the knee joint is smaller than in other areas, resulting in significant compression near these positions. In contrast, the curvature changes gently in the lateral areas of the lower limbs, with a larger radius, so the pressure experienced there was relatively smaller. By comparing the pressure across each section, it can be concluded that decreasing the radius of curvature increases the pressure on the leg; that is, in regions with a smaller radius of curvature, the leg experiences greater pressure.
The displacement distribution cloud map in Figure 15(b) shows that the areas of the leg undergoing displacement deformation were mainly concentrated on the posterior side of the thigh and calf. Due to the greater thickness of soft tissue in these areas and their greater distance from the bones, they lacked effective support from the bones when compressed, resulting in greater deformation. In contrast, the anterior side of the calf and the areas of the knee joint close to the bones had thinner soft tissue layers and were closer to the bones, so their deformation was relatively low. By comparing the skin displacement across each section, it can be concluded that areas with greater soft tissue thickness experience larger displacement after the knee joint is compressed. These findings are consistent with the research results of Ghorbani et al. 34 and Ye et al. 35
Relationship among knee sleeve pressure, body surface displacement, and leg cross-sectional points
Simulation of human body surface displacement data
The inward displacement perpendicular to the body surface generated by compression garments on the human body is an important indicator affecting pressure comfort and guiding clothing structure optimization design. 36 In-depth exploration of the relationship between clothing pressure and human body surface displacement is crucial for the optimal design of functional compression garments.
Through finite-element simulation, the displacement data at the corresponding pressure test point locations for the subjects wearing the five experimental knee sleeves were obtained. The displacement data for the five sections of the five experimental knee sleeves are shown in Figure 16.
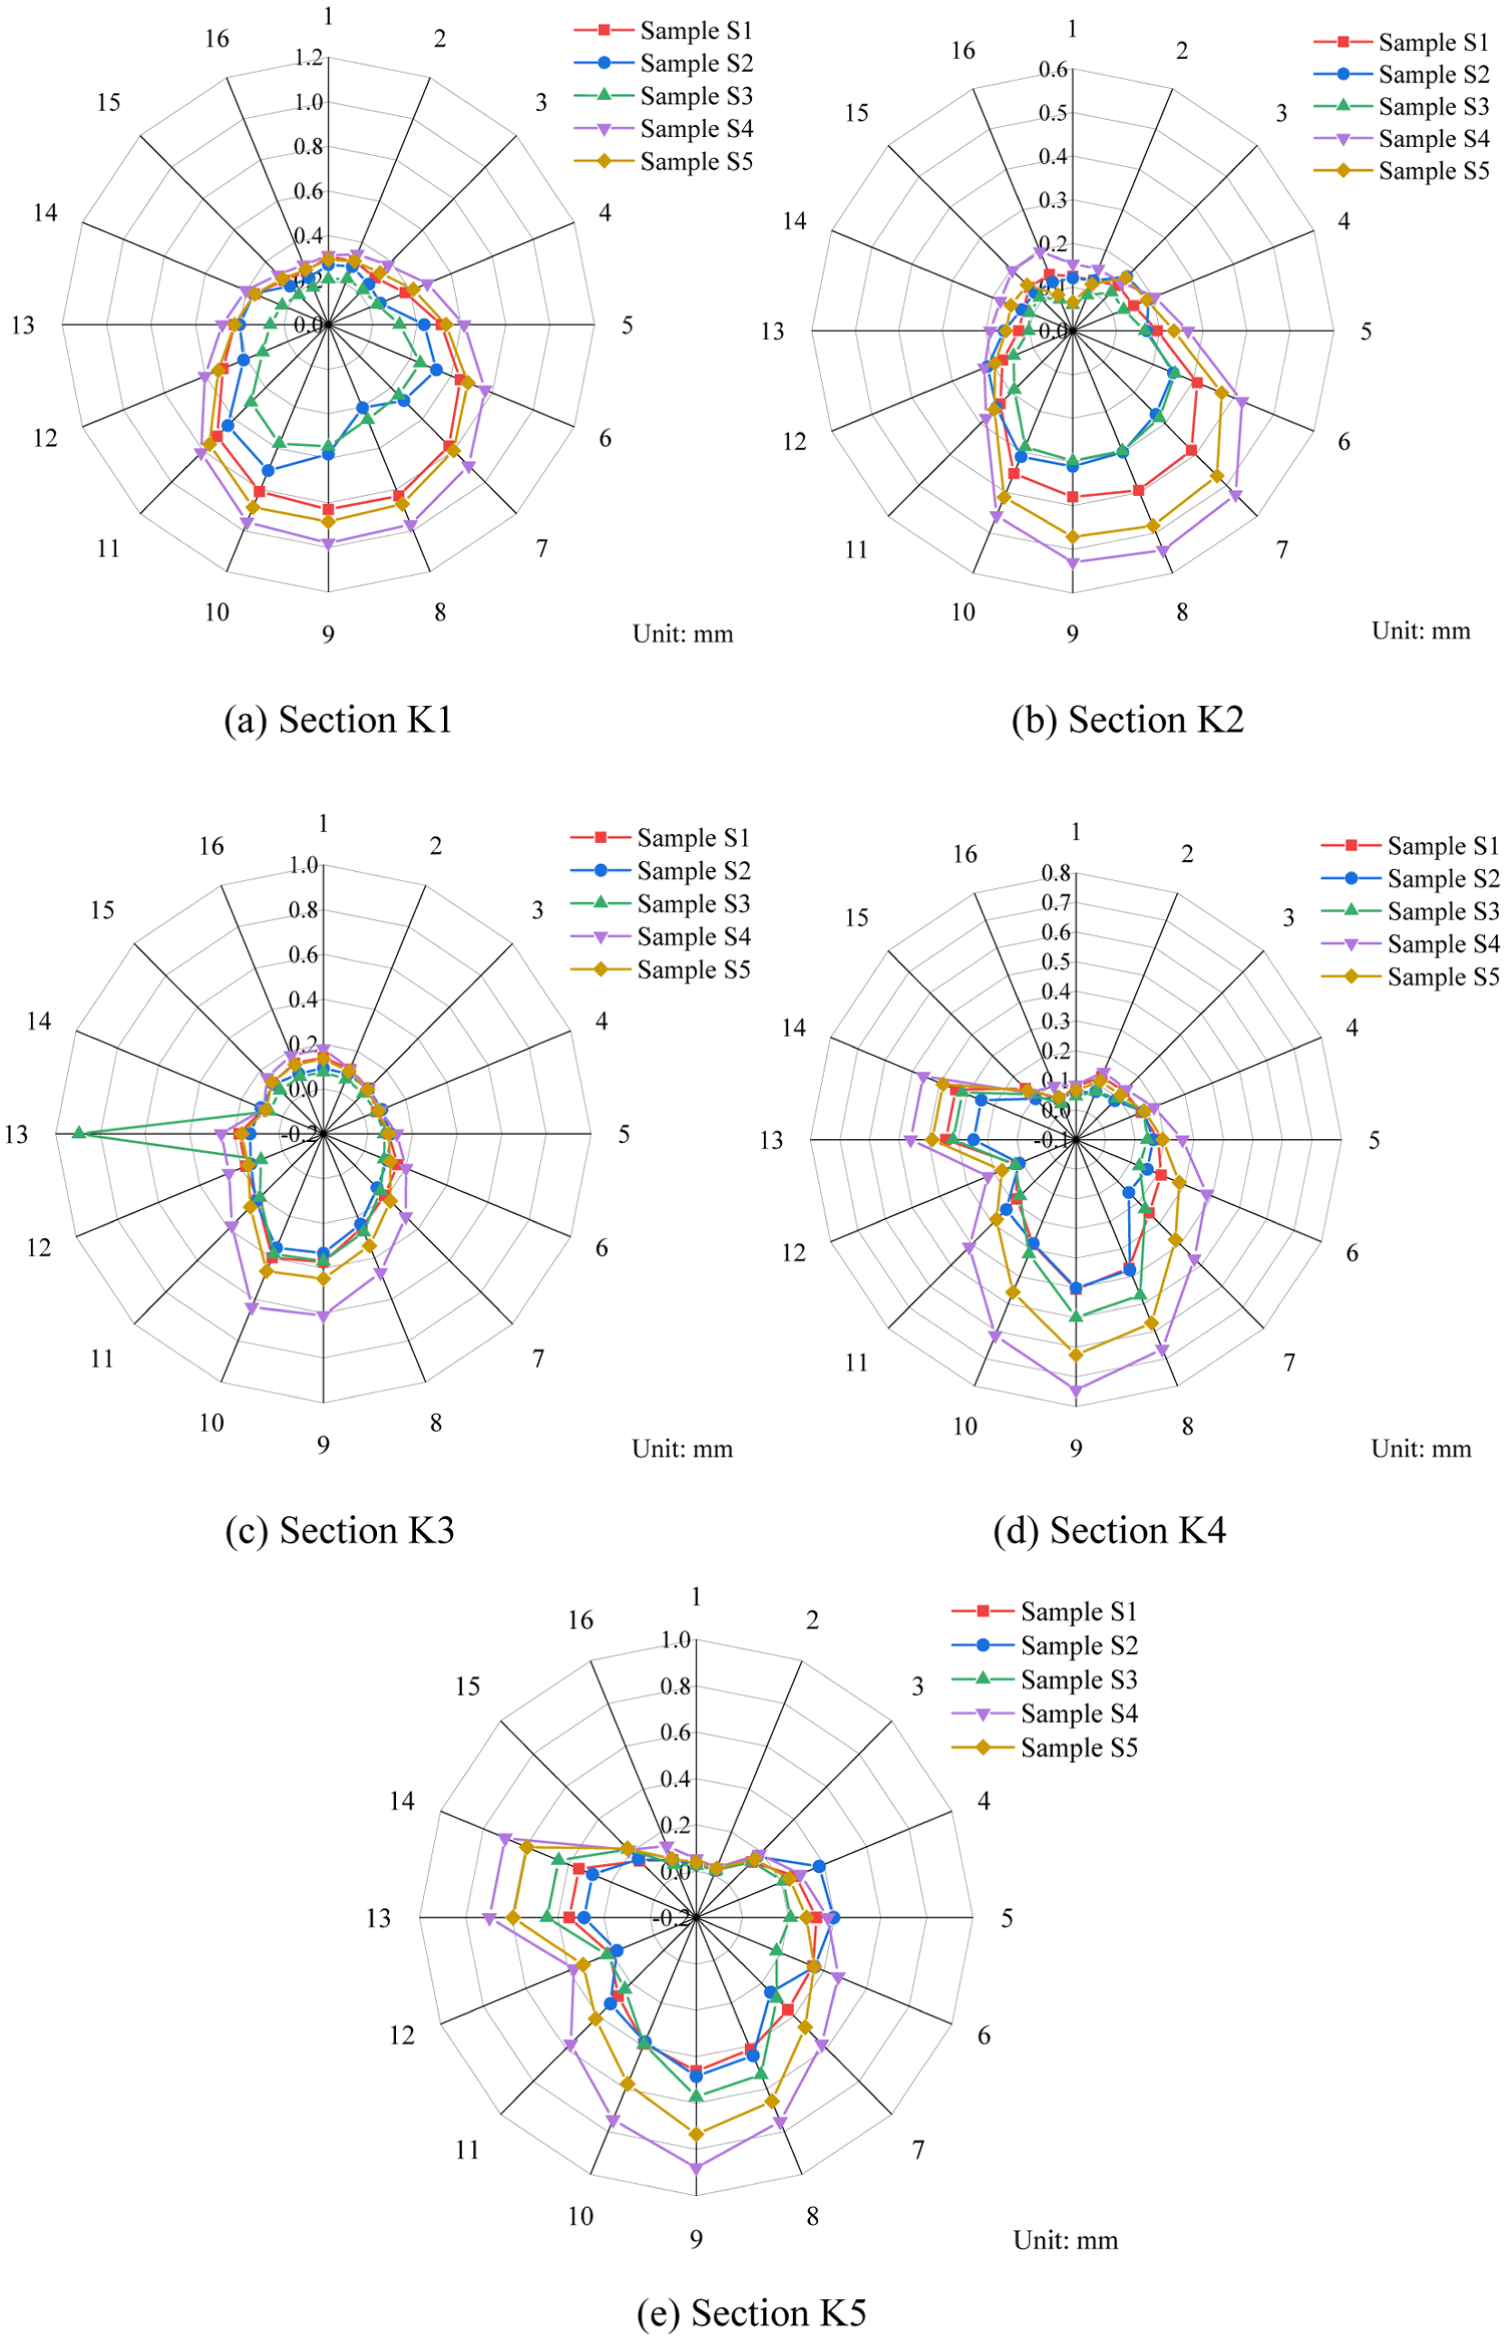
Displacement data at the test points of the five experimental knee sleeves: (a) section K1; (b) section K2; (c) section K3; (d) section K4; (e) section K5.
Relationship among knee sleeve pressure, body surface displacement, and leg cross-sectional points
The distribution patterns of knee sleeve pressure and body surface displacement on the leg cross-section serve as the core basis for achieving zoned compression and optimizing the functional design of knee sleeves. Based on the pressure and displacement data obtained from finite-element simulation, combined with the positions of the 16 pressure test points, the distribution characteristics of the two parameters across the five sections K1–K5 of the knee joint can be quantitatively analyzed.
To quantitatively describe the distribution pattern of “pressure/displacement” (Y) along the leg cross-section (X: test points 1–16), this study calculated the “pressure/displacement” data corresponding to the 16 test point positions for the five experimental knee sleeves across the five test sections. Based on the numerical characteristics of each section, the data were divided into different regions, and curve fitting was performed separately for the data in each region. The fitting equations of “pressure/displacement versus test points” are shown in Figure 17. Due to the open-hole design of experimental knee sleeves S3 and S5, there were no pressure or displacement data near points 1, 2, and 16; therefore, the corresponding data points were excluded during the curve fitting process.
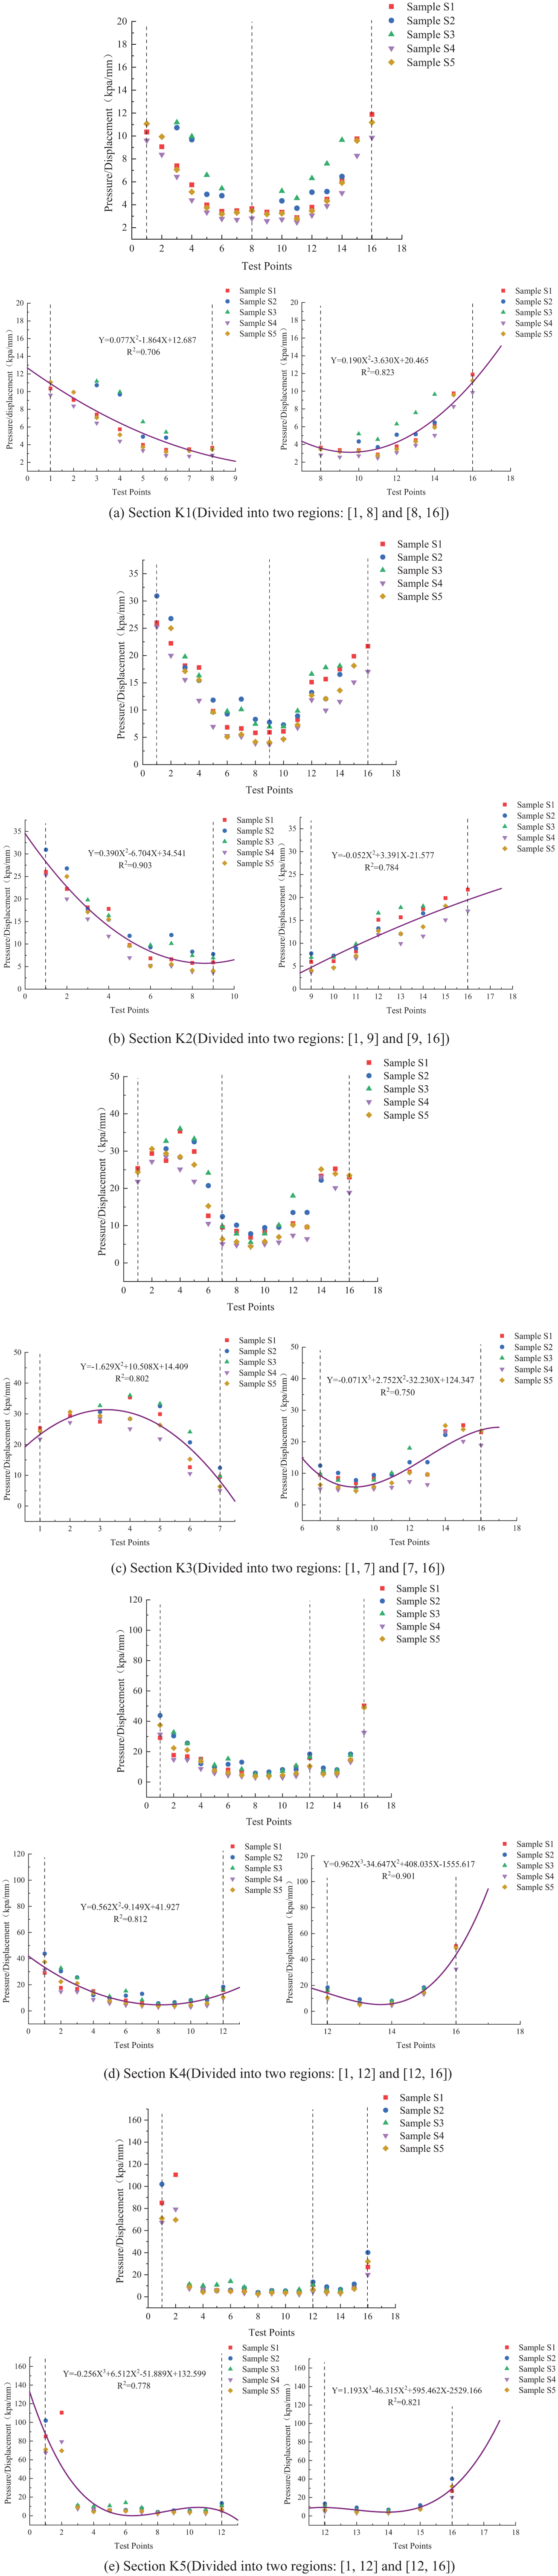
Fitting curve equations of pressure/displacement versus leg cross-sectional points of sections K1–K5. (a) Section K1 (divided into two regions: [1, 8] and [8, 16]). (b) Section K2 (divided into two regions: [1, 9] and [9, 16]). (c) Section K3 (divided into two regions: [1, 7] and [7, 16]). (d) Section K4 (divided into two regions: [1, 12] and [12, 16]). (e) Section K5 (divided into two regions: [1, 12] and [12, 16]).
In Figure 17, quadratic or cubic curve fitting was used for different regions, and the selection criterion was based on the goodness of fit R2 for each region. It can be seen from Figure 17 that the trends of the “pressure/displacement” data at the 16 test points across the five sections for the five experimental knee sleeves were generally similar, and the goodness of fit of the fitting equations was relatively high. It should be noted that the above trends are mainly based on tests under static wearing conditions. In practical use, the stretching rate of knee sleeves, size adaptability for users of different body shapes, and the friction and slippage behavior between the knee sleeve and the skin during dynamic movement may all affect the relationship between pressure and displacement. Therefore, future research should further introduce dynamic loading and personalized body shape adaptation models to verify the universality of the numerical relationship between pressure and displacement. In addition, the selection of experimental knee sleeves in this study mainly considered factors such as fabric composition, style design, and functional design. The differences in pressure and displacement among the five experimental knee sleeves were mainly attributed to structural designs (e.g., patellar pads, straps, and spring supports), human anatomical features (e.g., skin curvature radius and soft tissue thickness), and knee sleeve material properties. Through experimental tests, this study found that the elastic modulus of the five experimental knee sleeves exhibited considerable differences, for example, S2 was 20.03 MPa whereas S4 was only 3.44 MPa. In future research, the influence of differences in material properties on pressure distribution, body surface displacement, or protective performance will be systematically analyzed.
The inward displacement perpendicular to the body surface generated by compression garments on the human body is a key factor for evaluating pressure comfort and conducting clothing structure optimization design. Due to the limited pressure exerted by compression garments on the human body, the body surface displacement resulting from clothing pressure is generally small and difficult to measure accurately using existing instruments and equipment. However, according to the fitting curve equations obtained in this study, the human body surface displacement can be calculated relatively accurately through the fitting equations, provided that the pressure data at any point is known. Furthermore, this method is also applicable to other types of sports protective gear (such as wrist guards and ankle guards). Through the fitting curve equations, displacement data for any compressed part of the human body can be obtained. These findings provide a data reference for the pressure comfort evaluation and optimization design of functional compression garments.
Conclusions
By integrating human CT scanning, three-dimensional modeling of the “knee sleeve–knee joint” pressure experiments, and finite-element simulation, this study has systematically investigated the distribution patterns of pressure and displacement during knee sleeve wear and their quantitative relationship with leg cross-sectional points. The results showed that the “knee sleeve–knee joint” finite-element system, constructed based on the knee joint model, exhibited good effectiveness and could be used to predict the mechanical contact relationship between the knee sleeve and human body. Knee sleeve pressure and body surface displacement exhibited regular distribution patterns along the 16 test points of the leg cross-section: pressure was concentrated at the anterior bony protrusions, while the peak displacement was located in the posterior areas with abundant soft tissue. The relationship between the two was complex, exhibiting nonlinear characteristics. The study further established fitting equations for the relationship between “pressure/displacement” and leg cross-sectional points through zoned fitting. The results indicated that the trends of the “pressure/displacement” data at the 16 test points across the five sections for the five experimental knee sleeves were generally similar, and differences in knee sleeve materials and structures had little impact on the numerical relationship between pressure and displacement. Given the pressure data at any point on the leg cross-section, the human body surface displacement could be directly and accurately calculated. These findings provide a quantitative reference basis for knee sleeve comfort evaluation and the optimization design of knee sleeve structures tailored to human physiological characteristics.
Based on this, future research can be further extended in the following aspects. The current static analysis should be extended to dynamic motion scenarios, such as running, squatting, and jumping, to evaluate the pressure comfort and body surface displacement changes of knee sleeves under dynamic conditions. Meanwhile, developing personalized body shape adaptation models will help improve the universality of the pressure–displacement relationship. In addition, comparative studies using knee sleeves with identical structural designs but different elastic moduli can further reveal the influence of material stiffness differences on the protective performance of knee sleeves, addressing the limitation that this factor was not systematically analyzed in the present study.
Footnotes
Funding
The authors disclosed receipt of the following financial support for the research, authorship, and/or publication of this article: This work was supported by the Key Project of State Key Laboratory of Bio-Fibers and Eco-Textiles (Qingdao University) (grant number ZDKT202103).
Declaration of conflicting interests
The authors declared no potential conflicts of interest with respect to the research, authorship, and/or publication of this article.