
Abstract
Despite the substantial attention given to generative artificial intelligence (GAI), a unified dimensional framework and research on the differences and impact between GAI and human-generated images is still lacking. This study comprises three sub-studies. Study 1 combines a literature review and an expert elicitation approach to construct a visual analysis framework in tourism. Study 2 selects four GAI models to generate 20,000 images, which are then compared with 18,647 human-generated images from Flickr, and finds that visual attributes and quality metric represent the core differences between the two groups. Based on novelty categorization theory and schema congruity theory, study 3 constructs a conceptual model of how visual homogeneity affects tourist travel intentions through perceived creativity and authenticity. Results find that high visual homogeneity significantly reduces perceived creativity and authenticity. This study enriches current theories of tourism image research and provides practical references for tourism practitioners and artificial intelligence developers.
Keywords
Introduction
Compared with traditional textual content, visual content conveys more information while requiring less cognitive effort and allowing for faster processing (W. Zhang et al., 2026). This characteristic has contributed to the explosive growth of online images in hospitality and tourism (HT) and has gradually shifted academic attention from text-based analysis to image-based research. Currently, the role of images has become a central topic in the tourism supply side, which includes marketing, product management, and electronic word-of-mouth (Abbasi et al., 2023), and the tourist demand side, which includes stimulating tourist travel intentions, enhancing the visitor experience, and facilitating social sharing (Ma et al., 2023).
With the rapid development of generative artificial intelligence (GAI) for images, manual photography is no longer the only means to generate tourism images. In addition, humans are no longer the exclusive producers of tourism images. Image-based GAI systems can influence tourist engagement and decision-making by creating visual content for tourism (Ilieva et al., 2024). Existing research acknowledges the value of GAI images. Given GAI’s creativity, personalization, and contextual awareness, images generated by GAI are more likely to transform the tourism industry than those created by humans (Seyfi et al., 2025). Traditional manual photography is limited by practical factors such as lighting, weather, device, and professional expertise (Yu & Meng, 2025) but GAI addresses these constraints (Chan, 2026). GAI can generate customized and exquisite visual content for tourist destinations at a low cost and on a large scale (ETC, 2025). As such, GAI’s automated content creation has changed the mechanisms of destination image production and user perception (Hu & Lin, 2026). However, some studies have pointed out the problem of content homogenization in GAI-generated images; this problem may lead to stereotypes and authenticity (Zhu et al., 2024).
To date, research on tourism images remains underdeveloped largely due to technical challenges associated with processing unstructured visual data, the highly fragmented nature of image features, and the difficulty in analyzing deep semantic dimensions (Zhan et al., 2024). Furthermore, GAI is an emerging field, and thus, related research is still in its early stages. Differential analyses between GAI- and human-generated images are lacking, and the impact of such differences on tourists’ perception is also controversial. Some prior research affirms the positive impact of GAI images, believing that the GAI-generated content can effectively stimulate tourists’ travel imagination and expectations (Yu & Meng, 2025), enhance tourists’ interactive participation (Huang & Rust, 2024), and improve their perceived authenticity (Hartmann et al., 2025). However, other studies deny the positive effect of GAI images in enhancing tourists’ perceived authenticity (H. T. Bui et al., 2024), and they point out that the problem of false information in GAI content can directly cause tourists’ distrust (Kumar & Malhotra, 2025).
Thus, the overall objective of this study is to explore the differences between GAI- and human-generated images. It also aims to investigate the impact of these differences. This overall objective can be further subdivided into the following specific research objectives (ROs):
This study intends to achieve the aforementioned ROs by conducting three studies. Study 1 focuses on framework construction (corresponds to RO1). It employs a systematic literature review to examine existing research progress in tourism image and refines it through an expert elicitation approach. Visual research has a significant impact on both supply-side marketing and demand-side decision-making. However, current tourism visual analysis variables are scattered, using different methods to analyze different features. This dispersion hinders comparability among tourism studies and impedes a holistic understanding of destination image. The framework established in Study 1 helps comprehensively assess the comparability among tourism studies and provides tourism scholars with a systematic set of entry point variables and mining tools. Study 2 is a comparative analysis that intends to collect human-generated images from the Flickr platform and GAI-generated images as research samples. Statistical methods are used to explore the differences between the two sets of images, addressing RO2. Study 2, within the framework of Study 1, quantifies the differences between current GAI- and human-generated images, providing empirical evidence for understanding the performance of current GAI tourism images in content creation. Study 3 builds upon the pattern difference in the most statistically distinct axial category between GAI- and human-generated images identified in Study 2. It uses the pattern difference as explanatory variable to explore how they influence users’ psychology and behavior.
Study 1: Framework Construction
Study 1 constructs a visual analysis framework for tourism images through a literature review and interviews.
Literature Review
This study uses the Scopus platform to investigate the current progress in image mining feature dimensions. Scopus is selected primarily because it represents the world’s largest academic literature database and offers comprehensive coverage of tourism-related journals (Nguyen & Nguyen, 2026). The search strategy targets the literature where titles, abstracts, or keywords contain the following combinations: “(image OR photo OR vision OR visual) AND (‘image attribute’ OR ‘image feature’ OR mining OR ‘vision analysis’ OR ‘vision technique’ OR ‘vision technology’ OR ‘computer vision’) AND (tourism OR hospitality OR hotel OR travel OR Airbnb).” The search is refined by limiting document type to articles, source type to journals, and language to English, resulting in 789 relevant publications. Coders conduct three rounds of screening based on the following criteria to align the literature with the research focus. First round: excluding studies that are unrelated to HT, retracted manuscripts, and literature reviews (293). Second round: excluding studies that are unrelated to image analysis or lack image mining dimensions/methodologies (116). Third round: excluding studies that fail to utilize intrinsic image attributes and focus solely on external information (e.g., location-based point of interest data, 87).
Three coders collaboratively develop a coding book (Supplemental Appendix A), which encompasses four categories: research domain information; data details (sources, platforms, and volume); image dimension information (opening features, axial categories, and selective dimensions); and image mining method.
Research Domain and Data Collection
Figure 1 shows the flow pattern of the data detail connections, which span from research domains to the data categories and specific data collection platforms. Studies that aim to improve methodological or model accuracy by conducting validation with HT data are classified under the domain of computer science. Conversely, research that focuses on constructing HT-related systems and addressing domain-specific research issues is classified under HT.
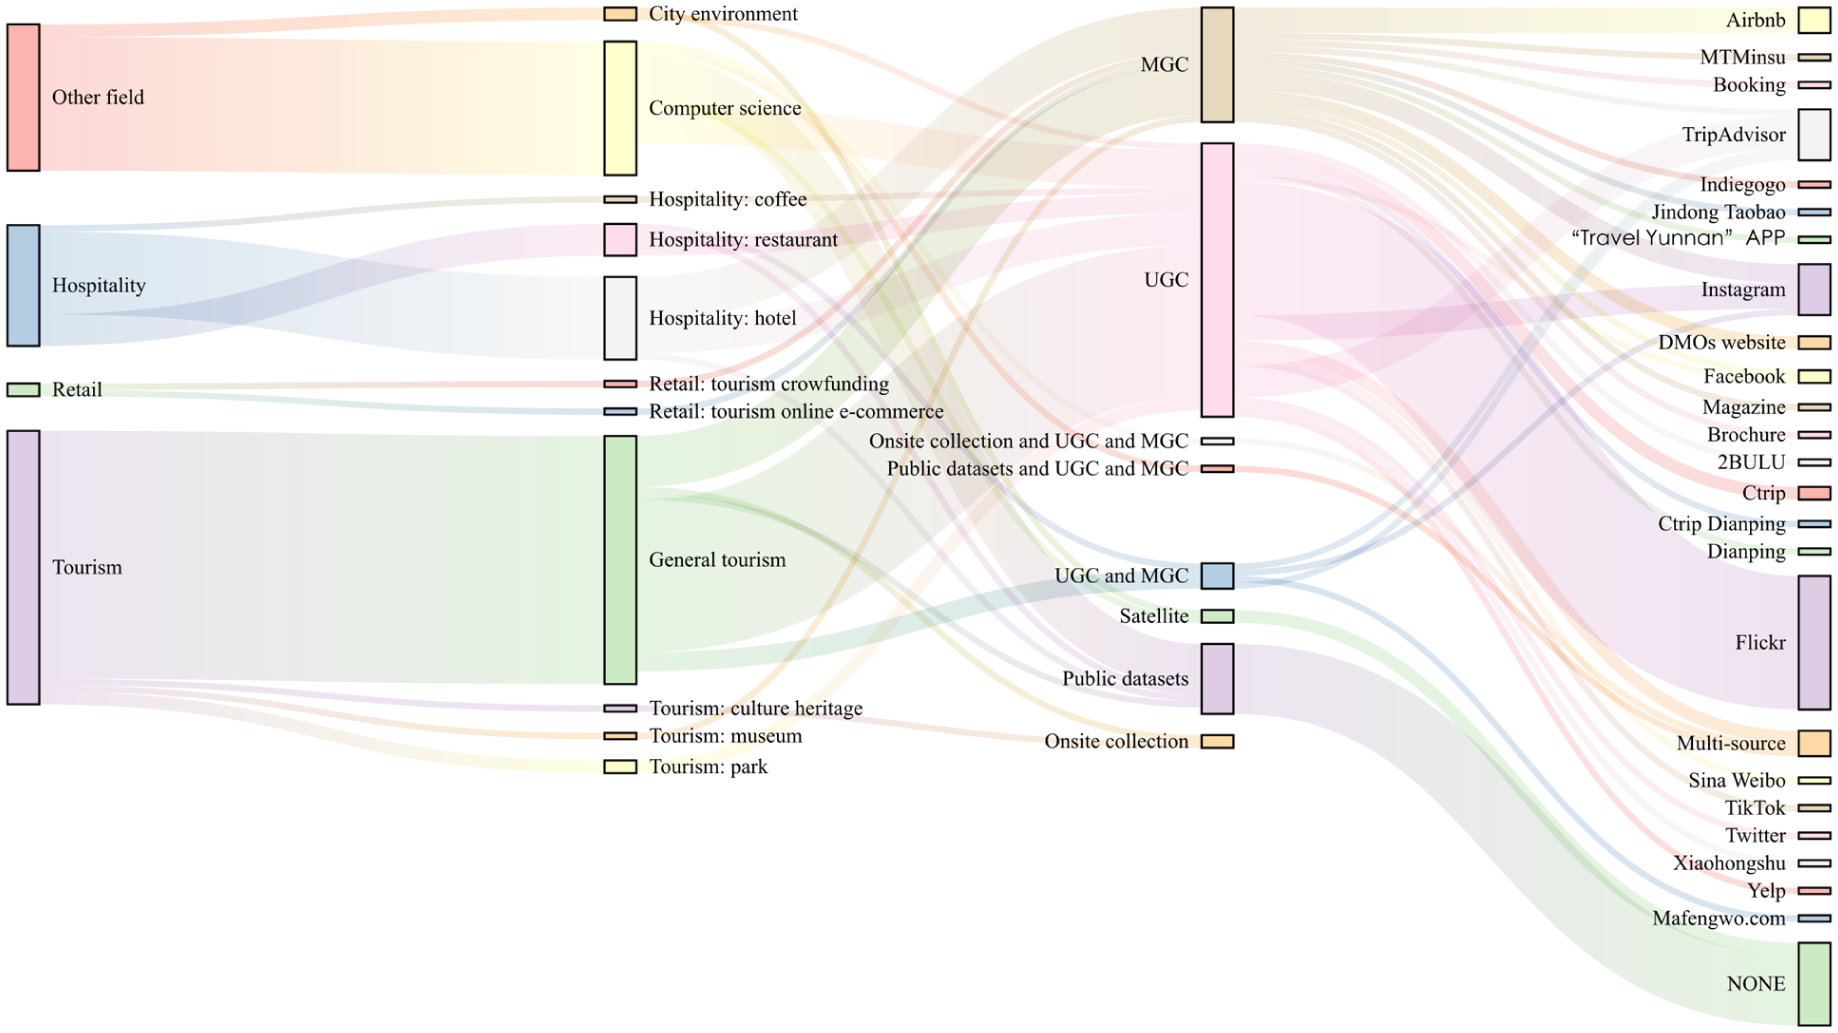
Data details connection.
Within the tourism domain, the most widely applied data type is user-generated content (UGC) that is taken from the Flickr platform. Thus, Study 2 uses Flickr as a sample source for human-generated images for three reasons. First, Flickr is a major data source in tourism research (Vu et al., 2017). Second, compared with those on other social media platforms, photos on Flickr are readily available and have no quota restrictions (V. Bui et al., 2021). Finally, the quality of Flickr’s data makes this platform a recognized resource for image research in academia (Mou et al., 2020). Other image data sources, such as Instagram and TripAdvisor, are also frequently utilized, while onsite photography data is rarely used. In the hotel domain, the most used data originates from merchant-generated content (MGC) on the Airbnb online hotel booking platform.
Feature Dimension and Method
As a product of symbolic interaction (Hall, 2005), images comprise content (i.e., the sum of all constituent elements) and composition (i.e., the structural relationships among elements) (Albers & James, 1988), which jointly function to convey the manifest content (objective) and latent content (subjective) of an image. Manifest content refers to features that are readily observable and explicitly depicted, such as mountains, water, or people. By contrast, latent content (e.g., a sense of tranquility or grandeur) is closely associated with composition. This study employs grounded theory to analyze image mining features in 87 papers. First, by thoroughly reviewing all the literature and using open coding, all image features mentioned in the literature are annotated sentence by sentence to extract initial concepts (e.g., “brightness,” “contrast,” and “emotion”). During this process, features with the same meaning but different expressions are standardized in terminology, and duplicate concepts are eliminated, forming opening features. Second, by continuously comparing the inherent connections among opening features, concepts with common attributes or logical connections are clustered to form 17 axial codes. Finally, by systematically comparing the 17 axial codes and distinguishing those with clear semantic boundaries, this study ultimately forms five selective dimensions: semantic content, visual attributes, human focus, emotion transmission, and aesthetics and authenticity. Although the grounded coding process is not directly embedded in the tourism context, the five dimensions are endogenously aligned with tourism scenarios for the two reasons: (1) the research literature pool strictly focuses on the HT field, ensuring adaptability to tourism scenarios; (2) the dimension construction does not adopt the top-down paradigm of existing computer science frameworks, but rather is formed from the bottom-up induction of visual variables that tourism scholars focus on. Therefore, these five dimensions can effectively represent the core content of tourism image analysis. These selective dimensions are then categorized under the final level: manifest content (semantic content, visual attributes, and human focus) and latent content (emotion transmission, aesthetics, and authenticity). This study fully recognizes the subjectivity inherent in grounded theory coding. Therefore, after one researcher completes the initial coding, two other researchers independently review and evaluate the coding results. For content with disagreements, a consensus is reached through joint discussion, ultimately resulting in a unified coding outcome. Figure 2 shows the hierarchy and frequency of categories, selective dimensions, and axial codes.
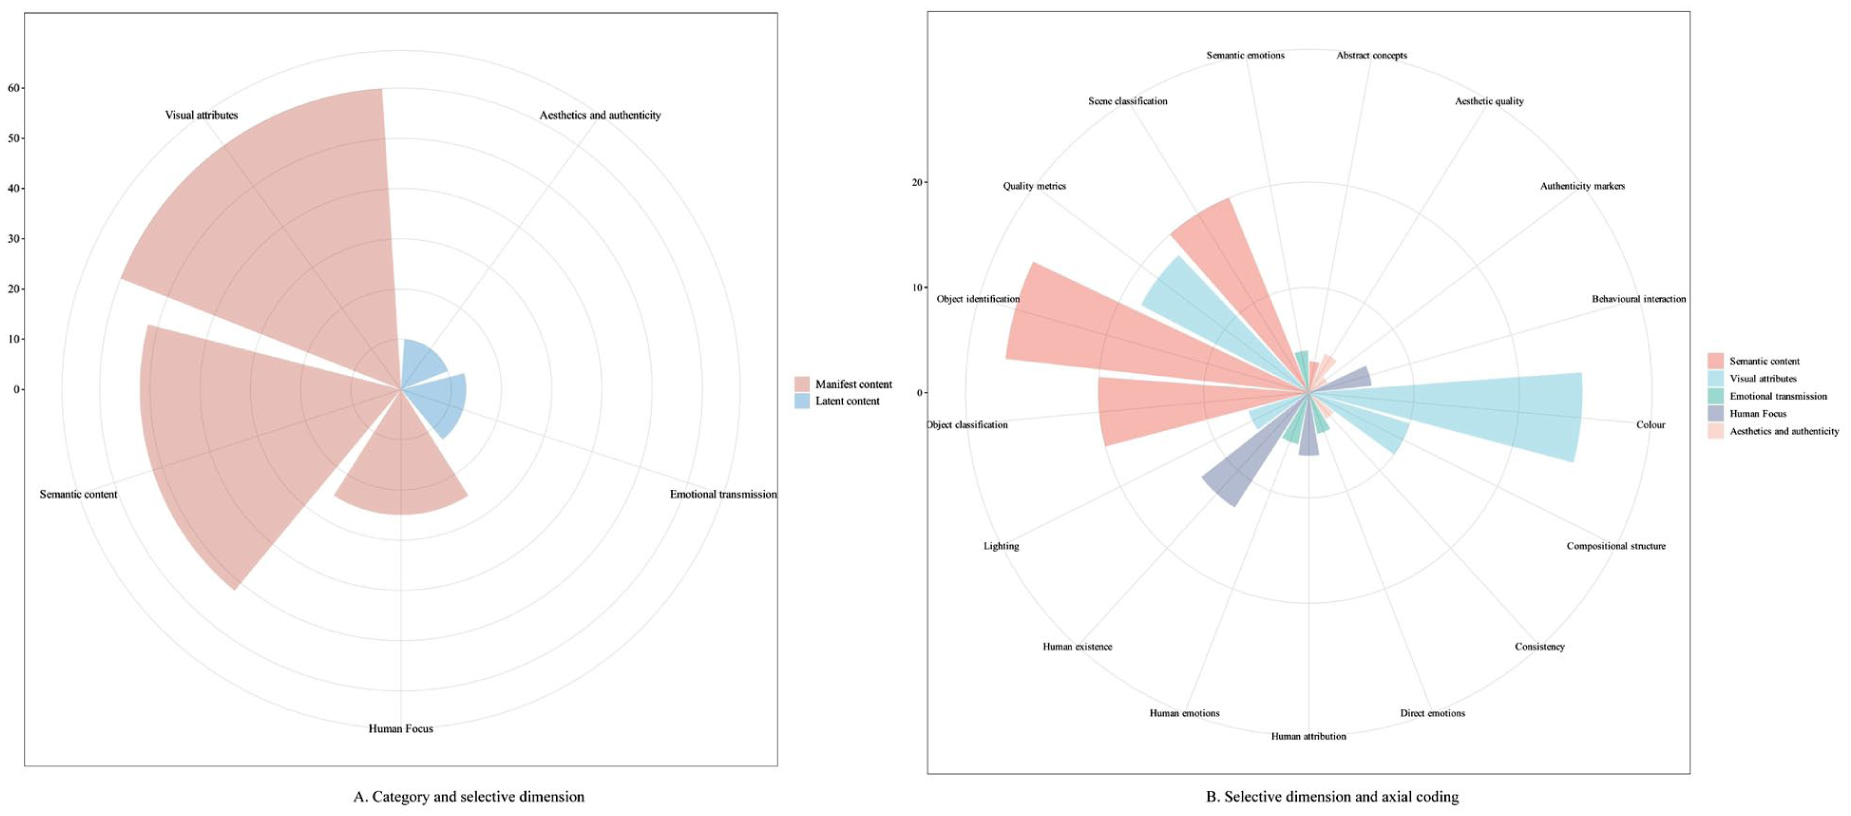
Image mining feature dimensions.
Manifest content is clear and objective, and it can be recorded with high reliability (Kim & Stepchenkova, 2015). Semantic content, visual attributes, and human focus belong to this category. Semantic content refers to “what’s in” a tourism image, which typically includes the destination’s core attractions, such as landmarks or scenes. Visual attributes refer to the visual presentation manner and structure of a tourism image, such as color, compositional structure, lighting, and quality metrics. Such elements are valuable for enriching visual expression; for example, tourism images often attract tourists through specific colors and compositions. Human focus is similar to semantic content. However, this dimension centers on human elements within images while disregarding other objects. This category is separated because people are the core subject of tourism activities.
Semantic content is currently the most extensively mined image feature. It includes four axial codes: Object identification. The methods to identify objects can be divided into three categories: (1) Calling ready-made services deployed in the cloud. (2) Python packages for locally deploying pretrained models. (3) Human coding for small sample sizes. After obtaining multiple labels, studies typically use clustering to extract themes from the labels (Vu et al., 2025) or use dimensionality reduction to simplify vectors (G. Zhang et al., 2024). Object classification: humans first define image categories, which are then classified by neural networks (Kang et al., 2021). Scene classification is a unique image mining feature in HT. In tourism, it enables identification of outdoor scenes, temporal contexts (e.g., morning/night), landscape types (Yan et al., 2023), and activity categories. Within hospitality, it facilitates the recognition of indoor scenes, such as rooms, living rooms, and bedrooms (Han & Lee, 2021). Abstract concepts refer to the definitions of certain image features that are formulated independently in research, such as accessibility, ambience, and attractiveness (Zhao et al., 2024).
Four axial codes of Visual attributes are color, compositional structure, lighting, and quality metrics. Color exerts an influence on the emotional atmosphere of images (Yannacopoulou & Kallinikos, 2024) and is related to the visual attractiveness (Hou & Pan, 2023). Compositional structure facilitates the analysis of the narrative logic and visual expression intentions of images. Shooting angle and lens distances can focus on core elements in the image (J. Dong & Li, 2022). Element layout, the rule of thirds, and symmetry have an impact on the aesthetic quality of images (Xian et al., 2025). Lighting plays a crucial role in the interpretation of image scenes and environmental restoration. It can be used to infer the shooting time, weather, and seasons (Hou & Pan, 2023). Quality metrics is an important basis for evaluating the basic quality and usability of images from the perspective of underlying visual features, which involve characteristic parameters, such as texture, shape, pixels, size, and contour (Y. Chen et al., 2024).
Human focus’s axial code involves identifying basic human attribution, such as gender, age, ethnicity, and type (Yannacopoulou & Kallinikos, 2024). Behavioral interaction analysis explores human gestures (Ren, 2022) and the relational states between humans and internal objects within the image, such as coexistence or usage (W. Dong & Liu, 2025). Human existence pertains to the basic recognition of human presence, which encompasses indicators such as whether humans or human faces are present, the number of individuals, and the proportion of visible faces (Yi et al., 2025). The analytical research methods in this field are mainly divided into three categories: (1) unsupervised learning through cloud-based APIs, (2) rule-based approaches that define features based on key point detection (classifying a pose as “stretching” when limb extension exceeds a defined angle), and (3) supervised image classification following manual dataset annotation.
Emotional transmission consists of three axial categories. The first category, direct emotions, involves identifying or classifying the overall affective tone of images using advanced computer vision techniques. Within this category, sentiment refers to binary positive or negative polarity (G. Chen & Chen, 2023), whereas emotion entails fine-grained affective states, such as pleasure, joy, and sadness (Vu et al., 2025). The second category, human emotions, focuses exclusively on analyzing emotions that are expressed by human faces within images (C. Li et al., 2021). The third dimension is semantic emotions. Emotional analysis at the semantic information level refers to matching and associating colors, objects, and other visual elements in images with preset emotional corpora. For instance, the color red may be correlated with emotional labels, such as “passion,” “energy,” or “anger” (Yannacopoulou & Kallinikos, 2024). Similarly, a “clean house” may be associated with positive affect (Sun et al., 2024). However, this method exhibits significant limitations: it excessively relies on preset association rules, ignores the dynamic influence of contextual factors, simplifies the complexity of visual elements, and fails to consider the emotional transmission mechanism under the interaction of multiple elements.
The final selective dimension concerns aesthetics and authenticity. Aesthetic quality, though inherently abstract, can be quantitatively assessed by synthesizing multiple visual indicators into composite aesthetic metrics based on predefined rules (Hou & Pan, 2023; Xian et al., 2025). Research in this category typically relies on techniques for mining visual attributes. Authenticity markers include repeat display, which may result in information overload and synthetic traces, and manipulated image compositions, such as fused nonrealistic scenes and multi-image stitching (Aramendia-Muneta et al., 2020). Manual annotation remains the predominant method for identifying these authenticity indicators. The final category within this dimension is consistency, which refers to the degree of alignment between image content and its associated textual description (L. Li et al., 2019). The standard approach involves measuring the similarity between this vector and the textual vector by cosine similarity (Adamış & Pınarbaşı, 2022) or latent semantic analysis (Hsu & Song, 2013).
Expert Elicitation Approach
Research Design
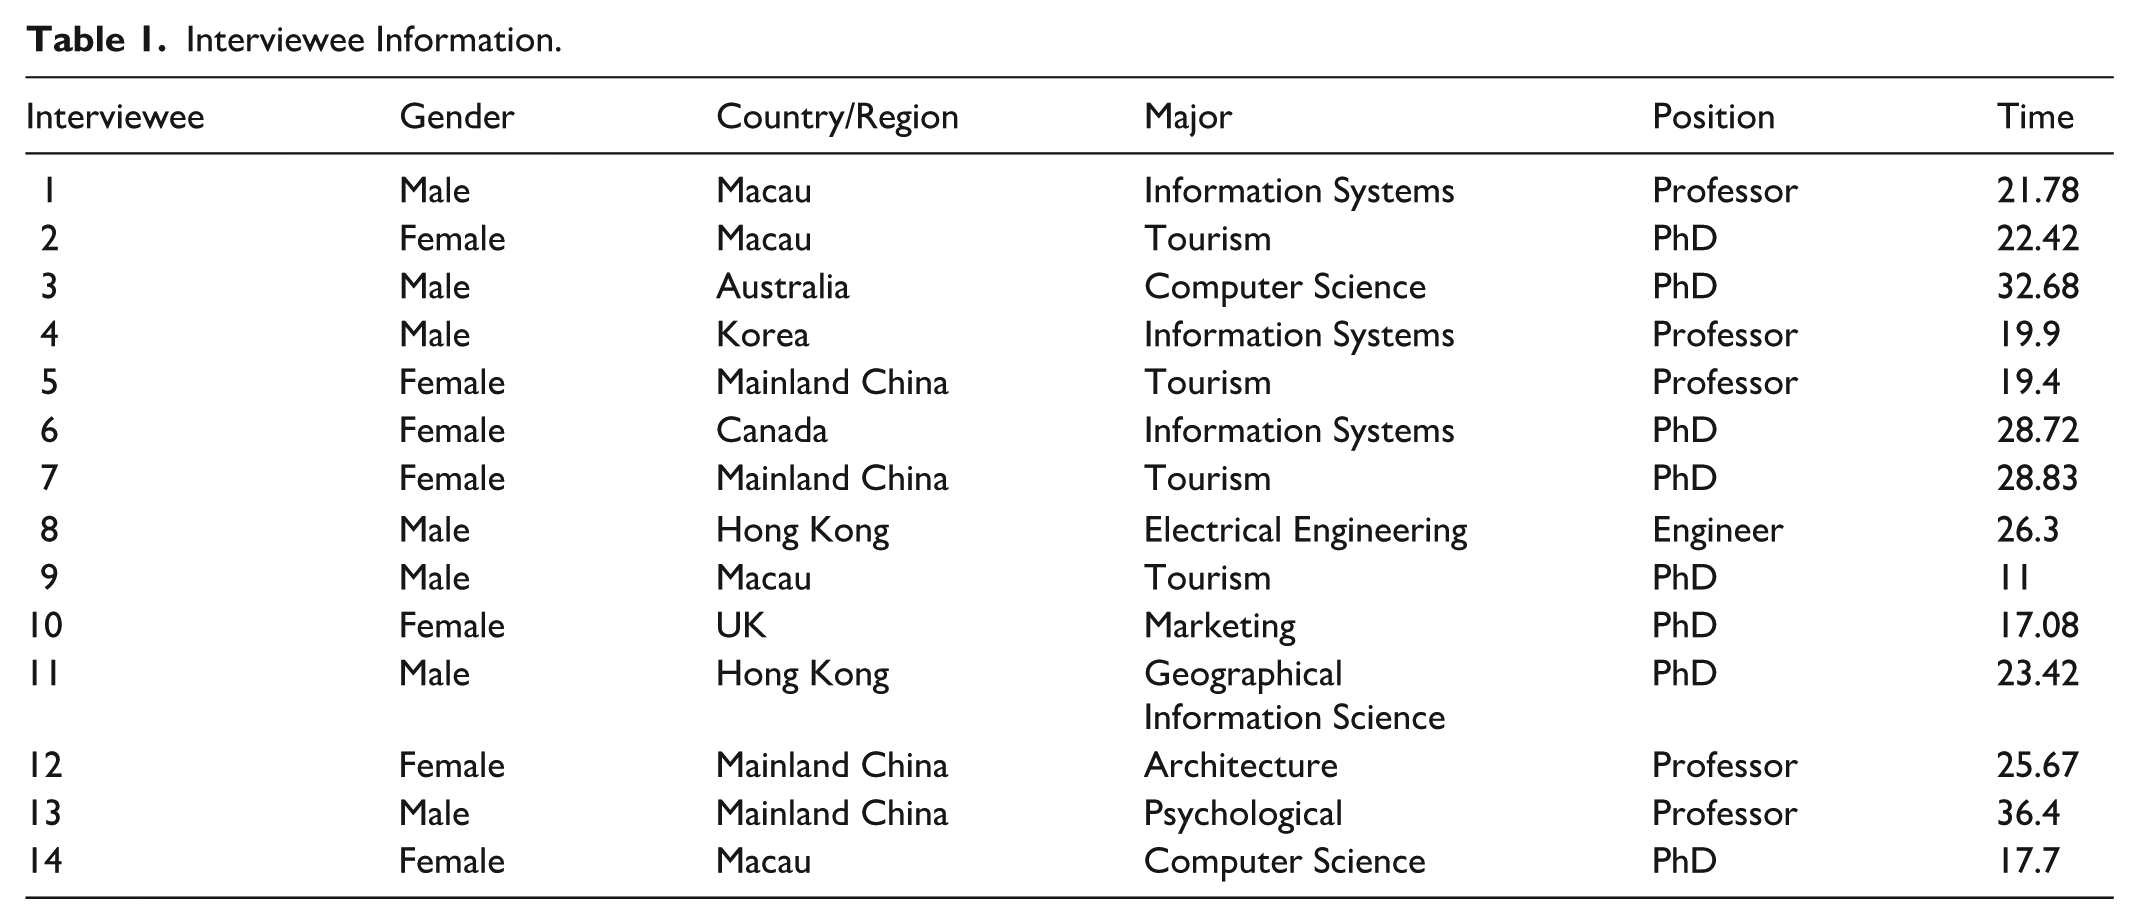
To further refine and verify the visual analysis framework that is built in Section “Literature Review,” this section conducts online interviews using an expert elicitation approach. The designed semi-structured questionnaire is shown in Supplemental Appendix B. The research employs purposive sampling (Campbell et al., 2020) to conduct 14 in-depth interviews in July 2025 until data saturation is reached, with no new dimensions, methods, or concepts added. The target interviewees must have rich practical experience in image mining in academia or industry and possess basic knowledge of image analysis and mining methods. The basic information about the interviewees is shown in Table 1. The transcribed text materials are imported into NVivo 12 software for subsequent analysis. One researcher leads the analysis to ensure consistency of the results. After repeated text review, key information is extracted as initial concepts, and concepts with consistent connotations are clustered and merged (referencing the original context). Any coding discrepancies between the two researchers are resolved through communication to reach a consensus, ensuring the reliability of results.
Interviewee Information.
Interview Results
To further know the core dimensions and methods of current tourism image mining, this study sets two core questions based on interviewer experience:
The reason why the respondents’ research background and practical experience are not limited to HT is twofold: (1) to ensure the comprehensiveness of the constructed visual analysis framework, and (2) to compare the HT field with other fields to clarify the differences in image mining features and methods under different application scenarios. This study conducts a correlation analysis between the respondents’ research fields and the image mining of five selective features, as shown in Figure 3. The research field can be divided into the five major domains (X-axis): medical health, architecture and spatial, HT, intelligent systems and public safety, and online platform marketing and management. The Y-axis is the five selective dimensions identified in Section “Literature Review.”
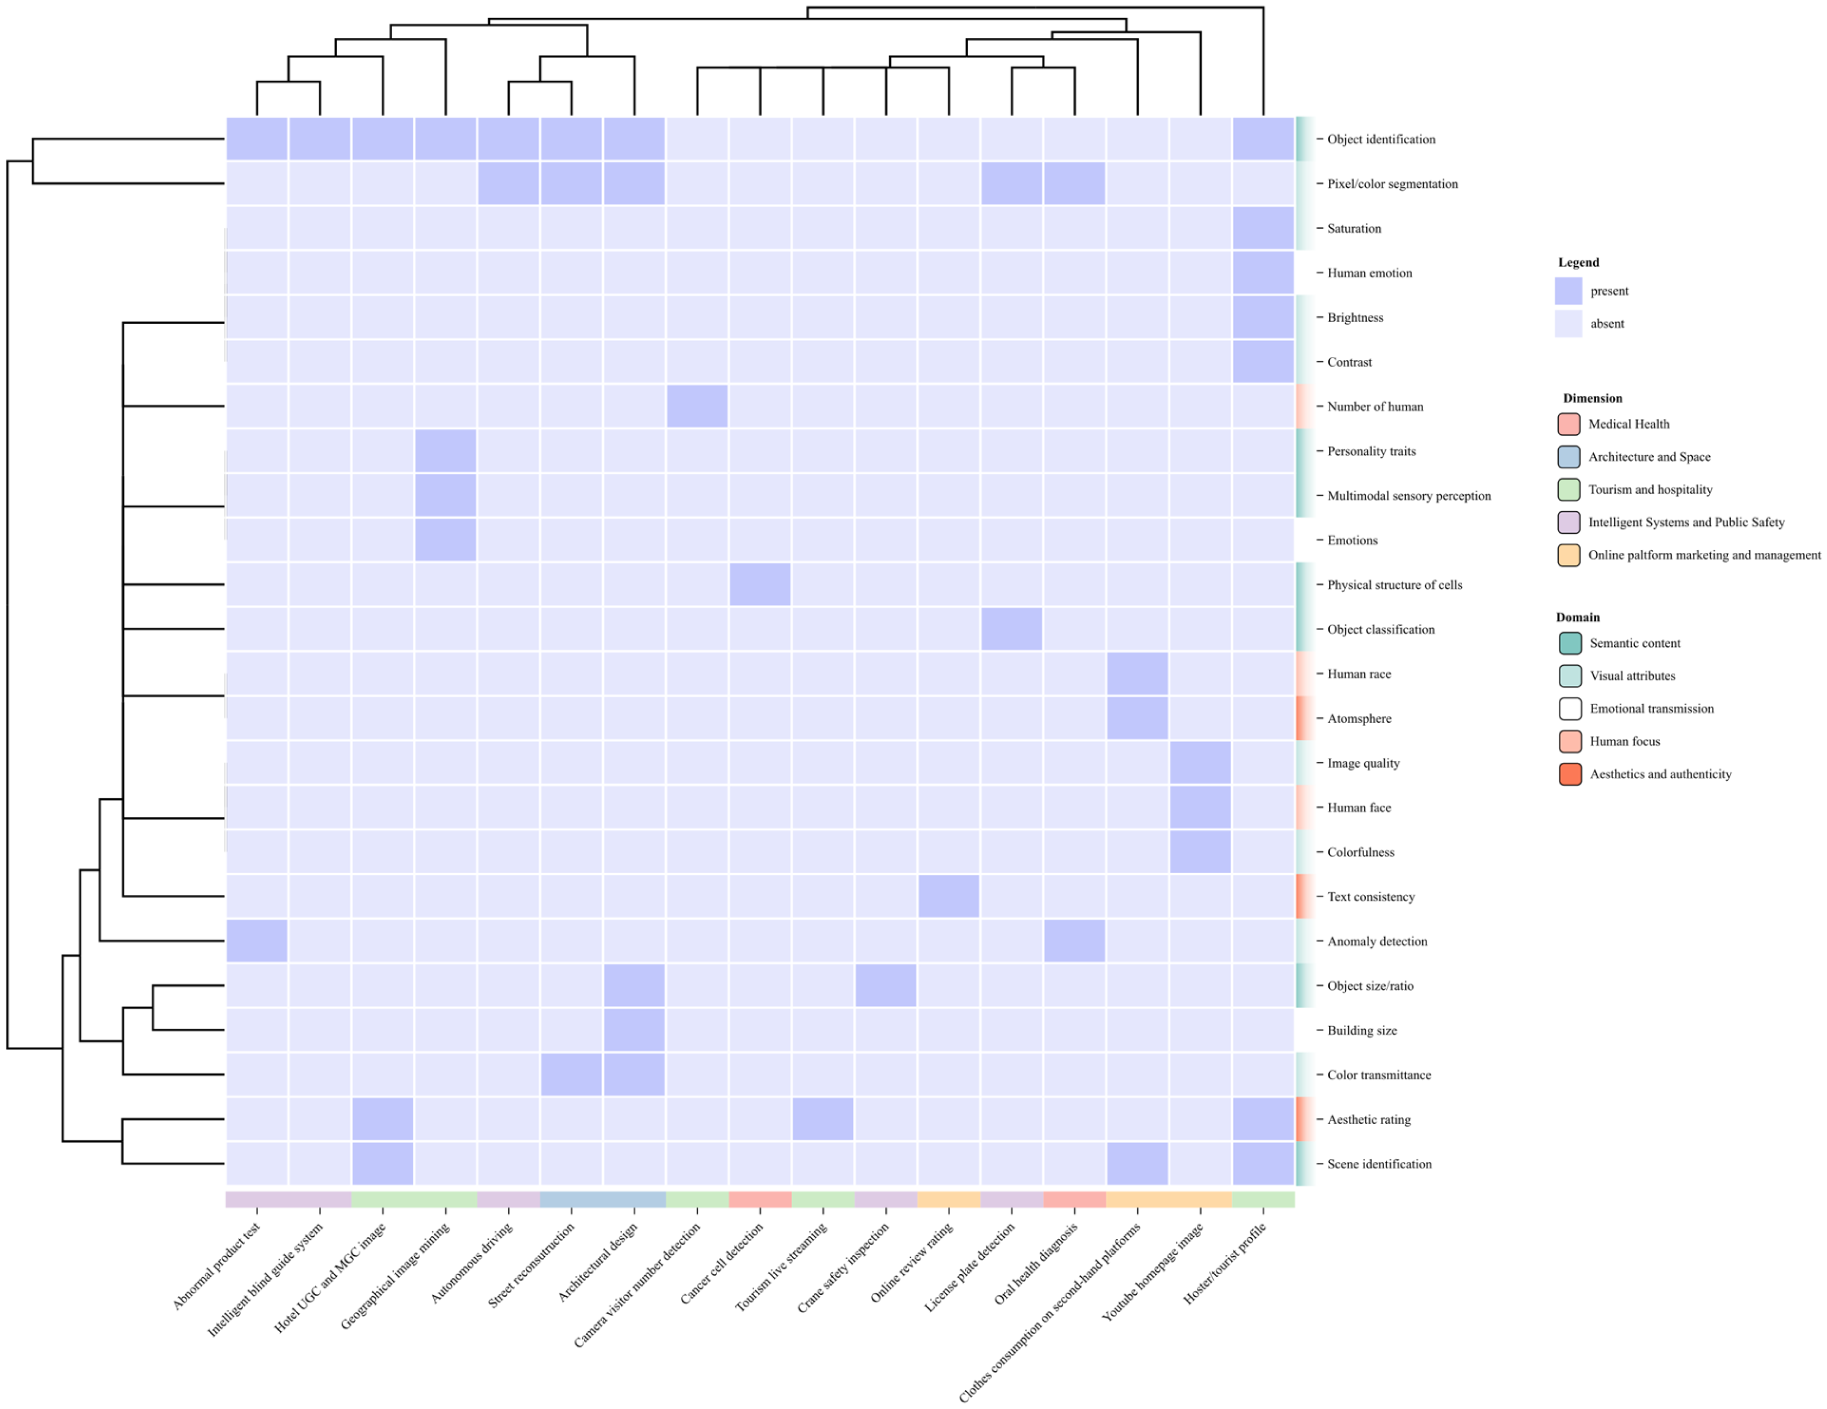
Interviewer’s field and image dimensions.
Other fields focus on manifest content. (1) Semantic content is the fundamental dimension of all fields. Object and scene recognition and classification are core prerequisites for understanding the basic information of images. (2) Visual attributes are also widely analyzed. These physical features provide crucial descriptive information for technical processing and quality assessment. By contrast, HT places greater emphasis on latent content. (1) Emotional transmission is a core focus of HT, and it is closely related to human-centered image analysis. Notably, Interviewee 11 extends this dimension by exploring personality traits, which represent a deep layer beyond emotional expression in the context of geographic imagery. (2) The dimension aesthetics and authenticity is also frequently considered, especially in online travel agency (OTA) platforms, where image–text consistency and sentiment alignment are critical for assessing content credibility and marketing effectiveness. (3) HT also centers on the human focus in manifest content, such as counting visitors through surveillance cameras.
Interviewees provide feedback on the visual analysis framework proposed in Section “Literature Review” based on the following question:
Most interviewees consider the framework to have good comprehensiveness, as exemplified by their comments: It’s quite comprehensive regarding the mentioned dimensions (Interviewee 1); What you’ve organized is quite comprehensive (Interviewee 4); I think it’s quite comprehensive (Interviewee 5); All the dimensions I know have been summarized (Interviewee 6); I think these five categories are good and quite complete. But if you want to dig deeper, you can only analyze them in specific fields (Interviewee 7); I think it’s already very in-depth, but we need to look at specific fields to see if certain dimensions can be analyzed (Interviewee 8); From a general perspective, these dimensions are already quite comprehensive (Interviewee 9); These dimensions are all good (Interviewee 11); “I think it seems quite complete; it’s just that the specific expressions of dimensions may vary across different fields” and “Actually, it’s indeed quite complete” (Interviewee 14).
Therefore, this study does not add new supplements to the axial categories or selective dimensions within the framework. Nonetheless, some interviewees mentioned new opening features that are not included in Section “Literature Review.” For example, Interviewee 11 mentioned, “the five personality traits of the tourist destination reflected in the images, such as extraversion and openness, can help us predict which tourists will be attracted to the destination.” Therefore, “personality traits” are integrated under the “direct emotions” category in the emotional transmission dimension. With regard to hotel/attraction images on OTA platforms, Interviewee 2 observed that the existing framework emphasized positive aesthetic evaluations but disregarded negative aesthetic aspects, as follows: “the impact of how ugly an image is on the decision-making and psychological impact on tourists and consumers.” For example, extremely ugly photos can arouse consumer curiosity. Consequently, an “ugliness score” is incorporated into the “aesthetic quality” category under aesthetics and authenticity. In the analysis of photos shared by tourists on social media, Interviewees 5 and 14 jointly emphasized the multimodal data dimension: mining geolocation and time stamps attached to images to understand tourist consumption patterns associated with the images. This type of data, such as textual information, belongs to image-related content. Consequently, geographic and temporal information are included under the “consistency” dimension of aesthetics and authenticity. Interviewee 3 suggested from a computer technology perspective that the blur noise dimension of an image should be added because the model exhibits limitations in recognizing blurry images.
Building upon the findings of Study 1, Figure 4 presents a comprehensive visual analysis framework for HT. Elements in black represent the core components synthesized from Section “Literature Review,” while those in red indicate newly added dimensions derived from interviews. This integrated framework offers a solid theoretical foundation for future research in image analysis and mining, thus enabling scholars to select dimensions that best align with their specific research objectives for further investigation. As emphasized by interviewees, the actual effects of linear and nonlinear relationships in the transformation process from antecedent variables (e.g., photo-taking motivation, uploading motivation) and mining dimensions to outcome variables (e.g., behavioral intention, satisfaction, or ratings) exhibit heterogeneity across different research domains and datasets. The visual analysis framework, which functions as an intermediary bridge for analysis and a foundational basis for research exploration, possess the feasibility of objective quantification and scientific selection.
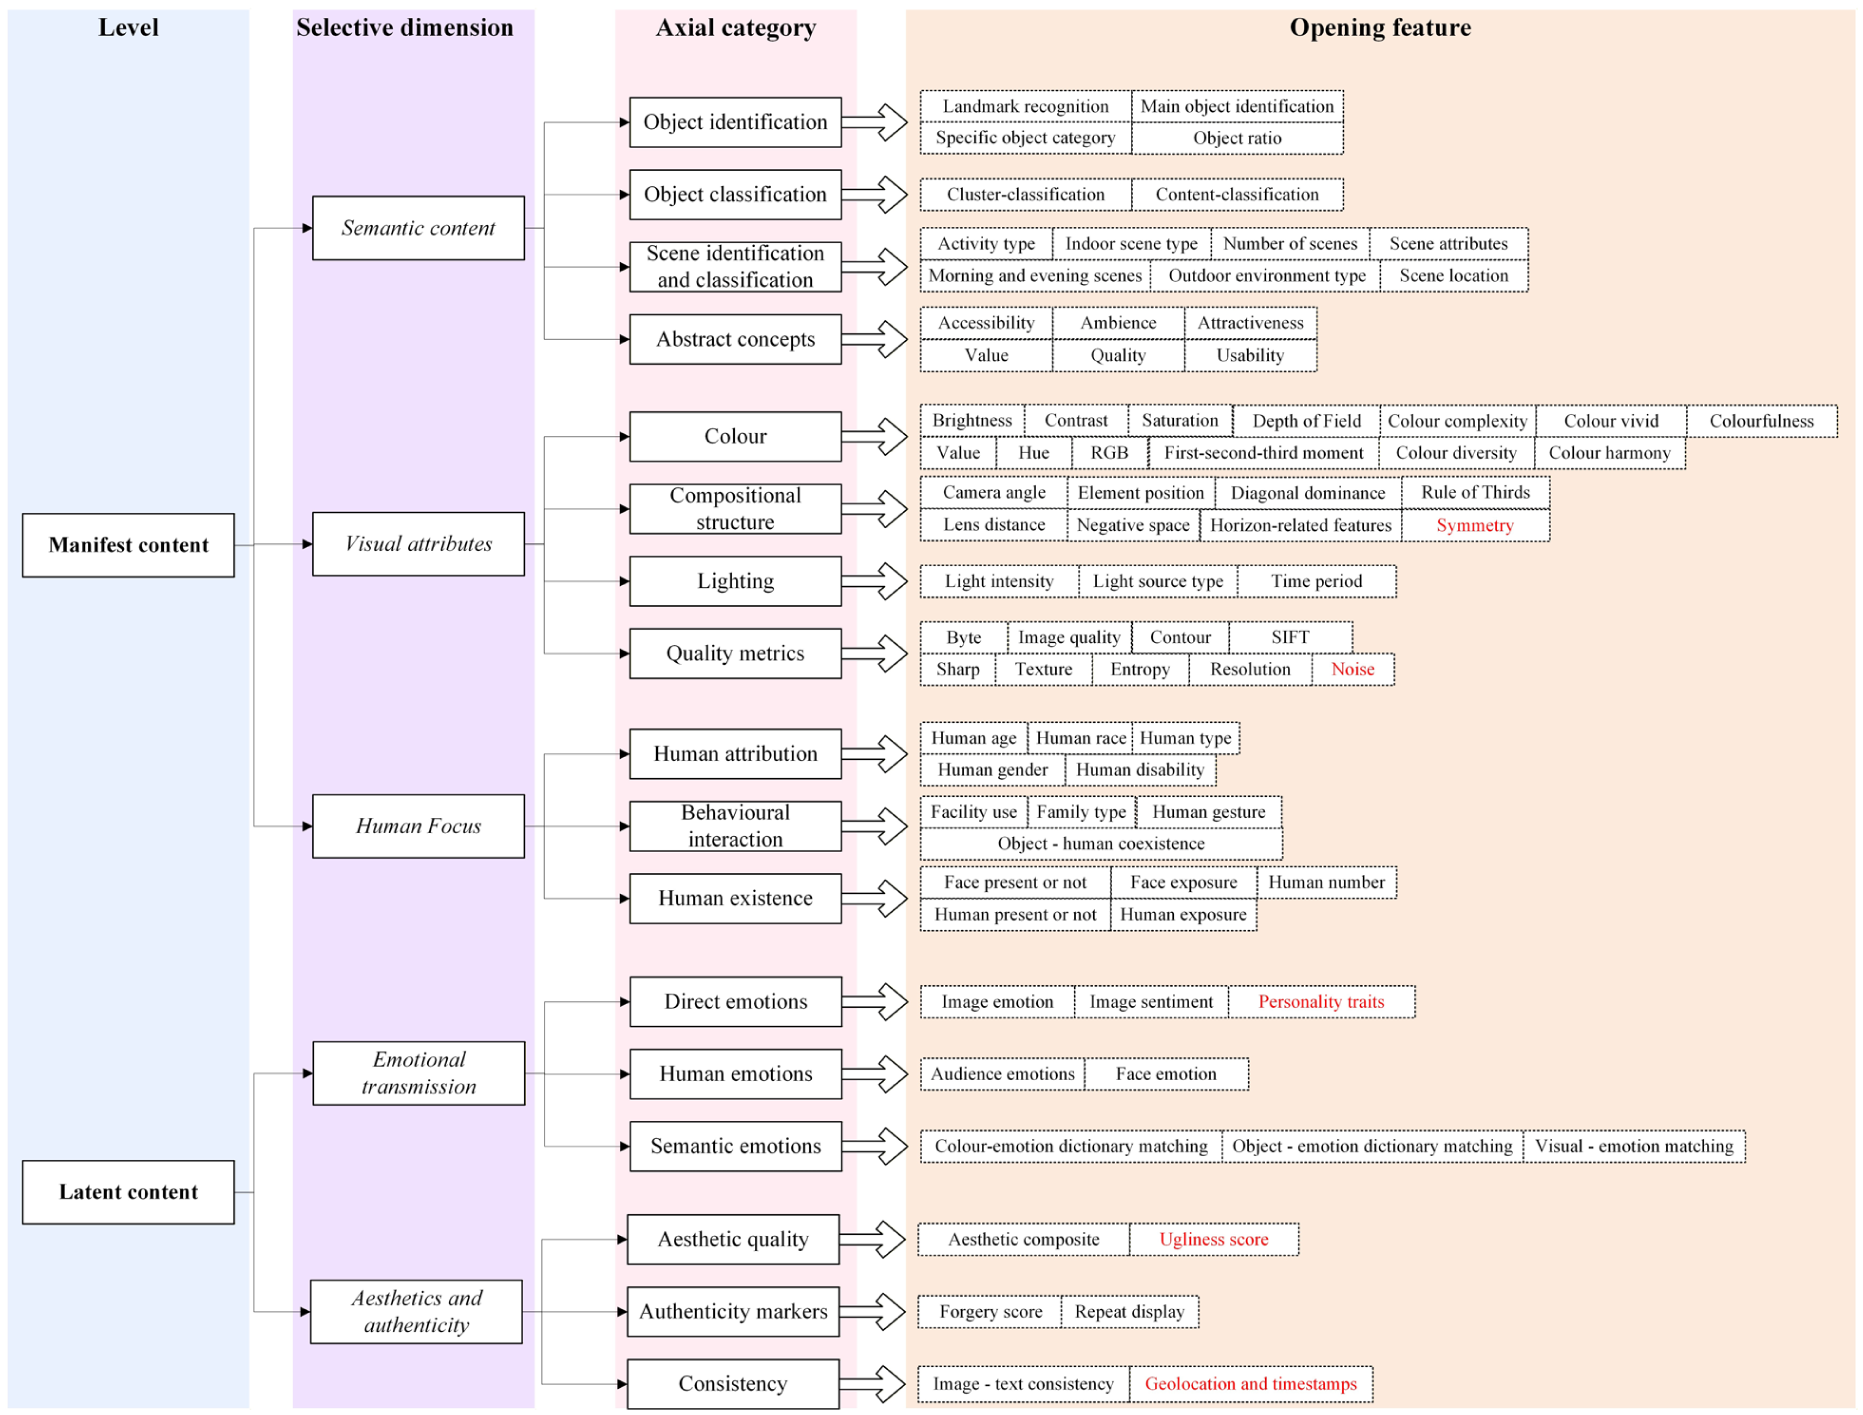
Visual analysis framework for HT images.
Study 2: Comparative Analysis
Data Collection
Study 2 aims to examine the differences between images generated by GAI and humans across the dimensions. It first identifies the dimensions with the greatest differences, and then specifically explores the pattern difference of the two sets of images under that dimension, laying the foundation for the impact analysis of Study 3. Such an investigation not only helps to understand this level of GAI development but also provides suggestions for marketers to design effective visual communication strategies. First, human-generated photographs are collected from Flickr, which is one of the most used platforms for tourism images. Following TripAdvisor’s (2024) ranking of the “World’s Best Travel Destinations,” the top five destinations, namely, London, Bali, Dubai, Sicily, and Paris, are selected. This study uses the Flickr API to retrieve information on images (including ID, title, URL, and upload date), user information (including name, location, ID, and country), and GPS data (including longitude, latitude, country code, and city) for images related to these destinations from January 1 to December 31, 2024. This study fully acknowledges the risk of data contamination caused by the mixing of GAI images in Flickr during this period. Hence, rigorous prevention and verification are implemented through multiple methods. First, Flickr’s core users are primarily photography enthusiasts and professional photographers, and the platform mostly features original, on-site photographs (Strukova et al., 2023). Therefore, its GAI image upload rate is considerably lower than those of ordinary social media platforms. Second, this study only retains images with complete GPS geotags and camera shooting parameters with exchangeable image file format information. Meanwhile, GAI images typically lack these metadata, significantly reducing the probability of contamination. Finally, despite the continued development of GAI technology in 2024, GAI images still generally suffer from several issues, including detail distortion. Researchers manually screen and verify all collected images one by one, ultimately finding no GAI contamination in the dataset.
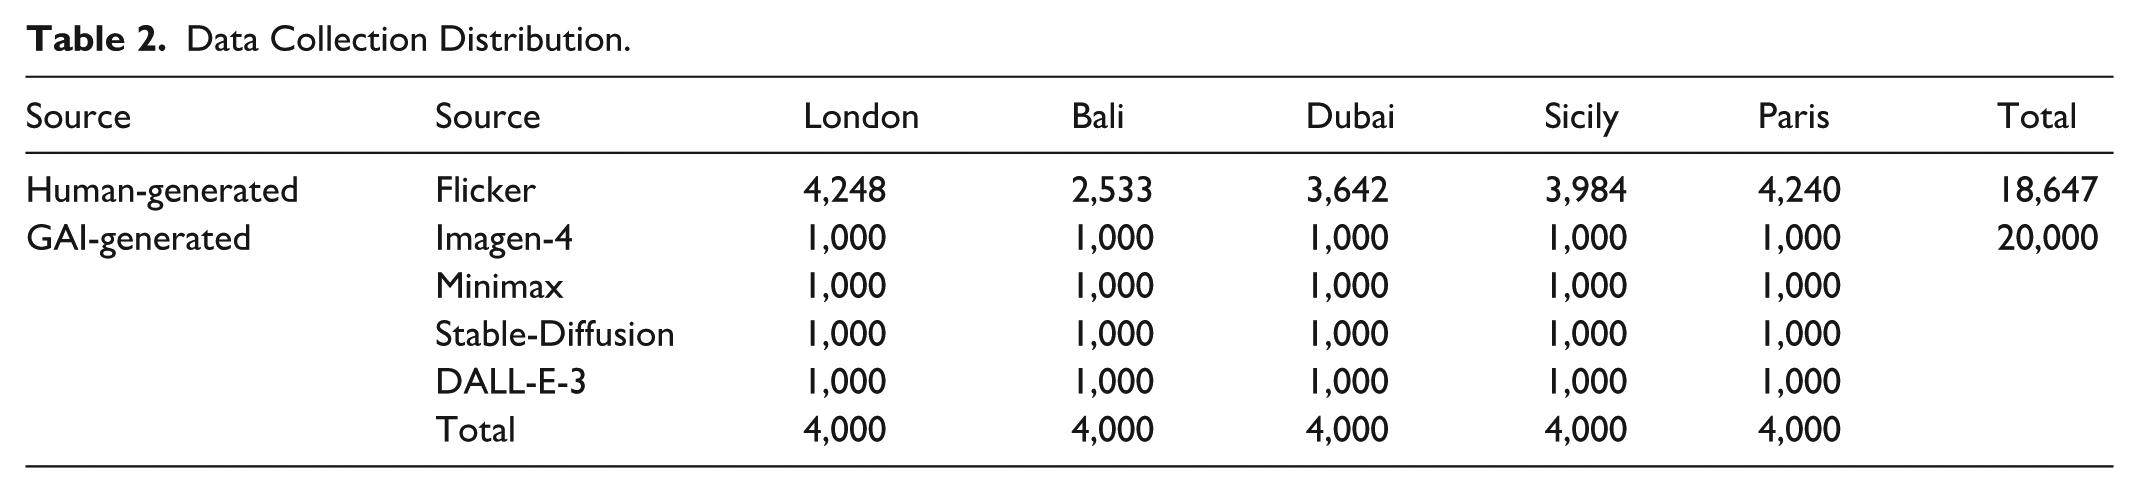
Second, the study employs different GAI models and uses the prompt “Assuming you are traveling in xx, draw a photo of your trip,” adopted by Vu et al. (2025), to generate 1,000 images of the selected destinations for each model. This study selects four models developed by well-known companies to enhance the robustness of the research findings and gain in-depth insight into the differences among various GAI models. As noted by Fini et al. (2025), the most representative Image GAI models currently are OpenAI’s DALL-E series and Google’s Imagen series. Although J. Li et al. (2025) claim that the image generation quality of Imagen 3 is superior to that of Stable Diffusion 3 Large, Stable-Diffusion-3.5-Large-Turbo, developed by Stability AI, which is a pioneer in the field of image generation models, is still incorporated into the scope of this study. Additionally, Image-01, developed by Minimax, is selected as another Image GAI model in this research. Thus, the models that have been ultimately chosen for this study are Imagen-4 (Google, 2025), Image-01 (Minimax, 2025), Stable-Diffusion-3.5-Large-Turbo (Stability AI, 2024), and DALL-E-3 (OpenAI, 2023). Table 2 is the detailed amount and information.
Data Collection Distribution.
Data Mining and Variable Generation
Supplemental Appendix C lists the proxy variables, definitions, simplified code scripts, and extraction methods used in Study 2. In total, 93 proxy variables are considered in Study 2. The analysis of the probabilities of each emotion output by top_probs and emotion_probs under direct emotion is of little significance. Therefore, this study analyzes a total of 91 variables. To avoid overly technical language in the main text, the technical details of all image mining tools are explained in Supplemental Appendix C.
Research Findings
To explore the differences between the two groups of images on opening features, this study uses different statistical tests based on the data type (Figure 5), and the results are shown in Supplemental Appendix D.1 to D.4. The results show that among the 91 variables, most variables show significant statistical differences between groups, with only seven variables showing no significant differences (see the bold part in Supplemental Appendix D). These seven variables include the horizontal position of the subject area, diagonal composition, light source type, and the position of the human’s head. The results indicate that GAI understands the basic compositional patterns of tourism images in basic photography and has also mastered the basic skeletal logic for generating a standard destination photo with reasonable composition and lighting.
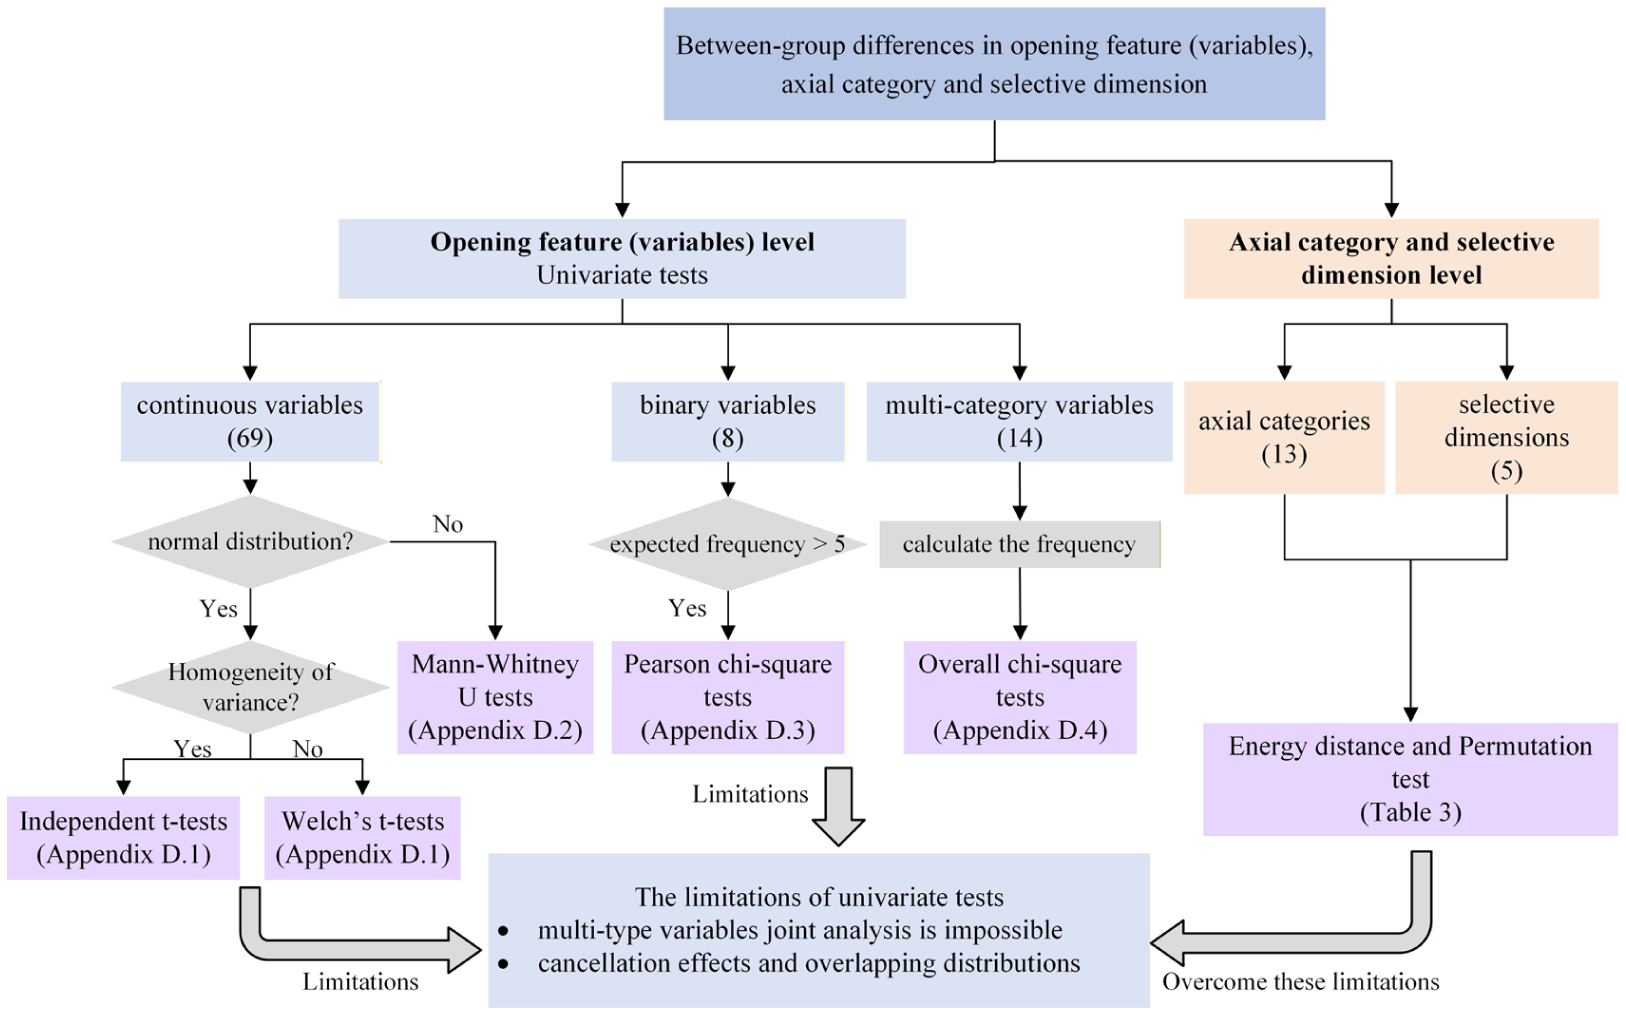
Between-group difference test procedures.
Although the above univariate statistical tests can effectively analyze significant differences in the opening features, such univariate testing methods are insufficient for detecting significant differences at the axial category and selective dimension levels. This limitation stems primarily from: (1) Categories and dimensions typically contain multiple data types (continuous and categorical), and (2) overlap and offsetting effects among variables can make test results difficult to interpret. Therefore, this study uses energy distance (Rizzo & Székely, 2015). and permutation tests (Collingridge, 2012) to examine significant differences among groups at the categorical and dimensional levels. Energy distance is used to test whether there is a difference in the distribution of two samples (GAI and human-generated image), while permutation test is used to verify that such difference is statistically significant rather than random occurrences. These methods can effectively handle multiple types of variables, including continuous and categorical ones. Therefore, it is adapted to the axial categories and selective dimensions of this study.
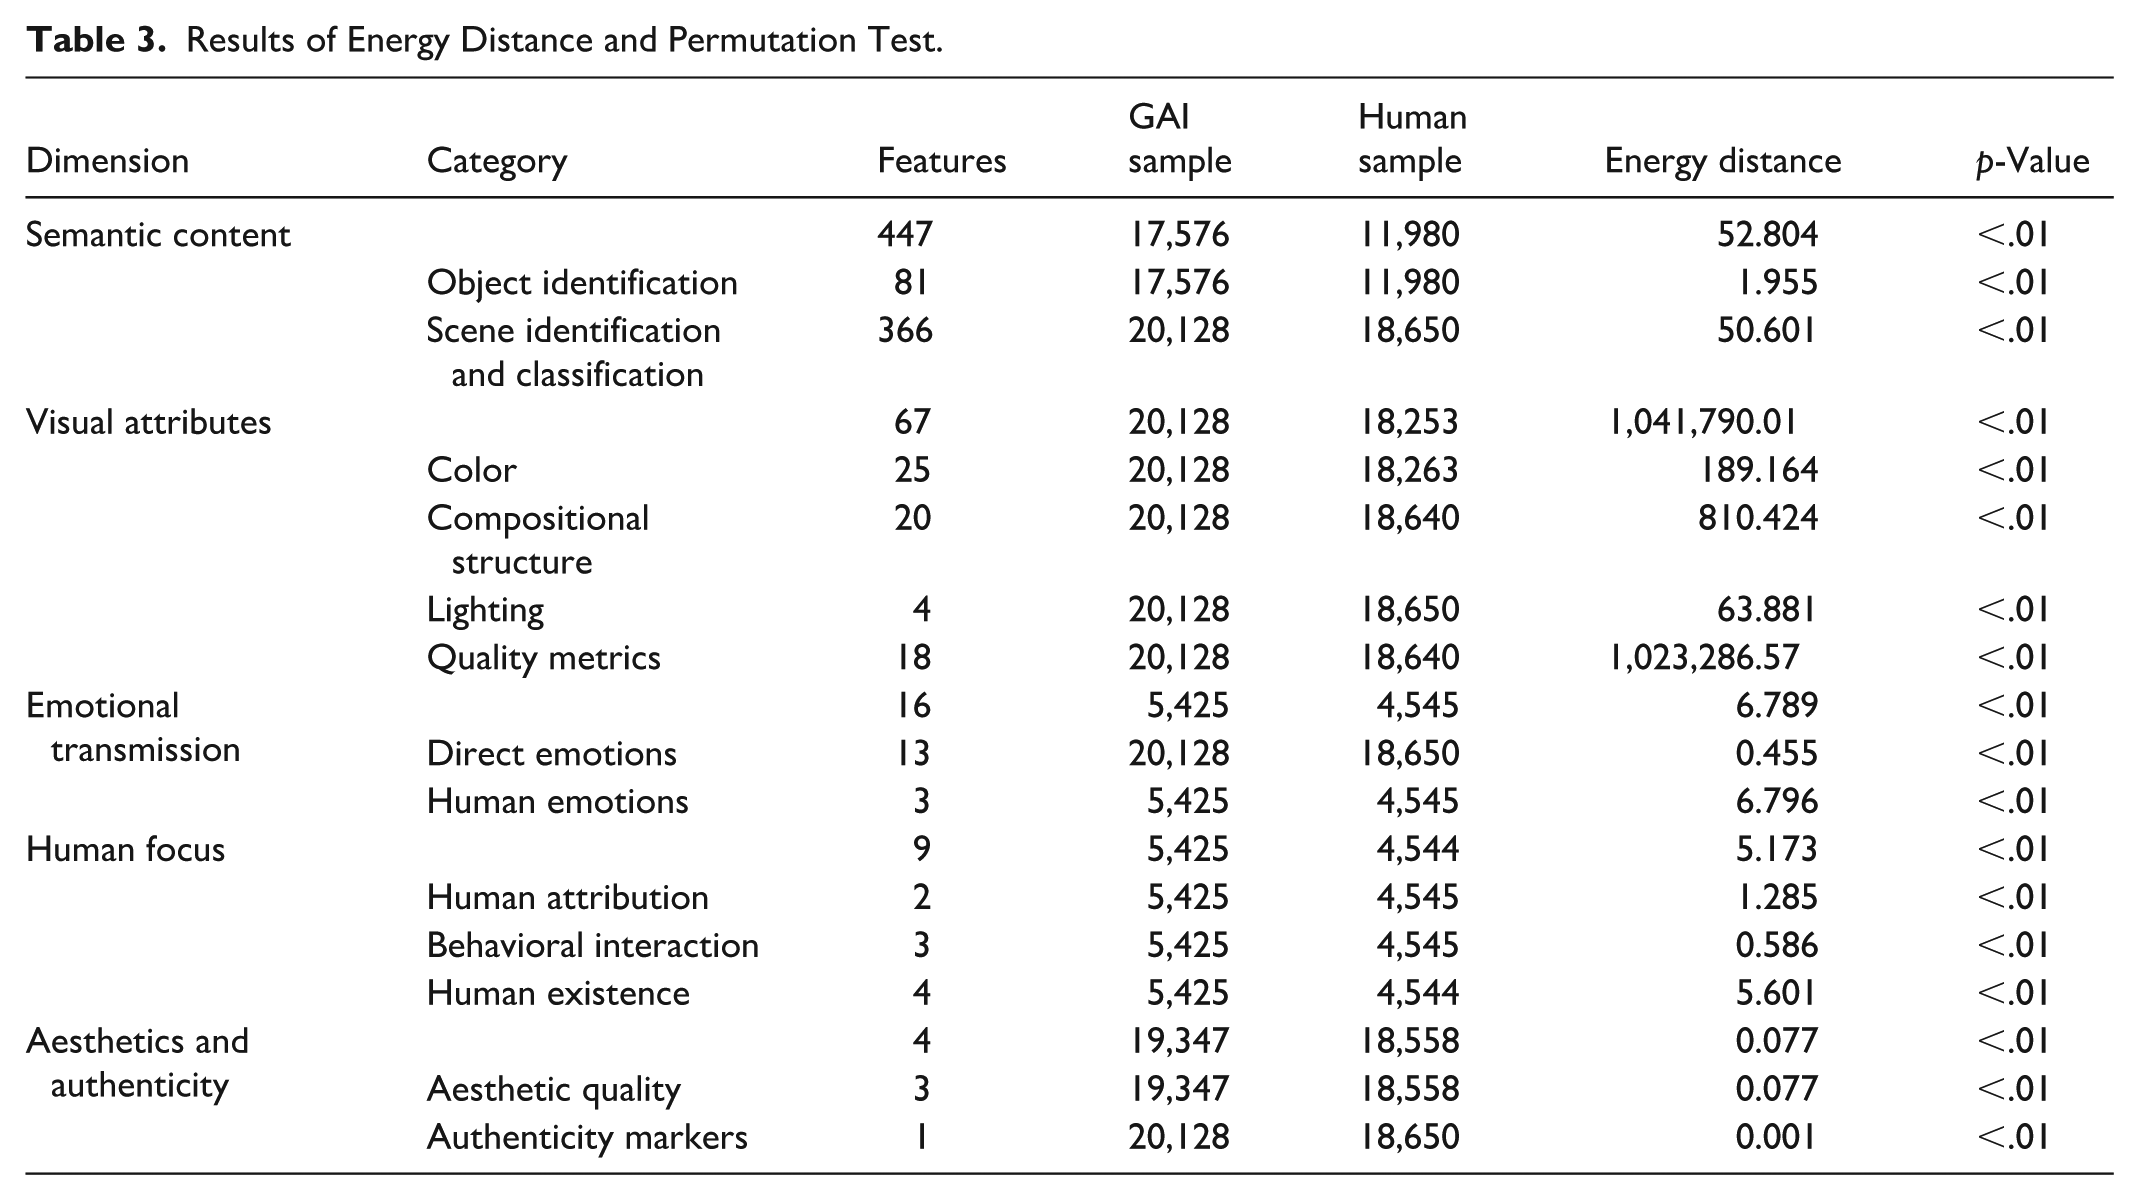
In accordance with the recommendations of Edgington (1969), this study conducts 1,000 permutations. The results in Table 3 show that all axial categories and selective dimensions exhibit significant differences between the two groups. The top dimension with the most significant intergroup differences is visual attributes (1,041,790.01). The top axial category with the most significant intergroup differences is quality metrics (1,023,286.57). The results demonstrate that there are indeed significant differences between GAI and human-generated tourism images. This study further employs the UMAP high-dimensionality reduction visualization method to spatially map the feature dimension distribution to visually compare the differences between two group images: the spatial dispersion of the samples represents feature diversity, while the degree of clustering represents feature similarity (Figure 6). Figures 6a and 6b clearly show that human-generated images have a wide and discrete distribution; while GAI-generated images exhibit high-density clustering, occupying only a small feature space. This indicates that real tourism images possess strong diversity and randomness, while GAI-generated images have been solidified into a fixed and idealized template. This distribution pattern of extremely small variance, and lack of diversity provides direct visual evidence for the extraction of the concept of visual homogeneity in Study 3.
Results of Energy Distance and Permutation Test.
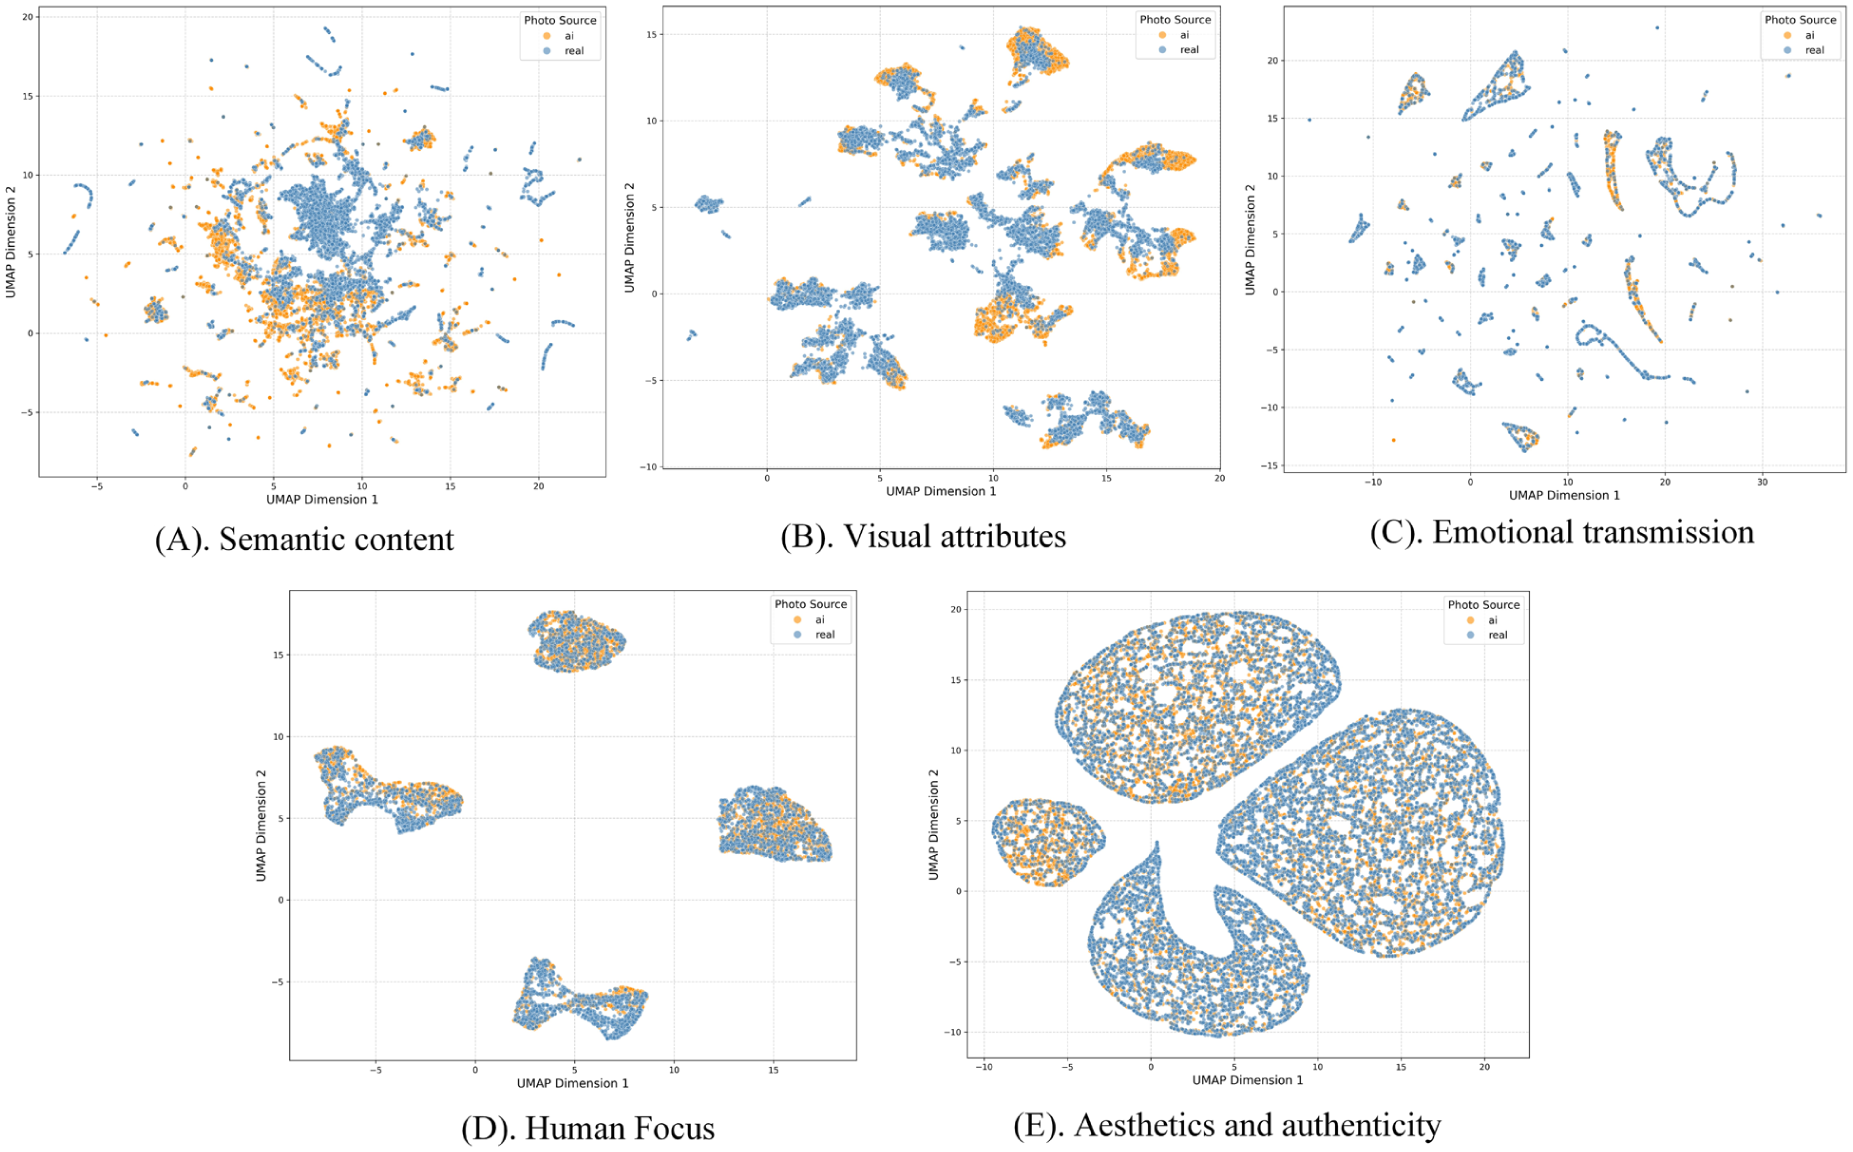
UMAP visualization.
Study 3: Impact Analysis
Study 3 aims to explore the impact mechanism of the axial category (quality metrics) with the greatest intergroup differences identified in Study 2 on higher-order psychological and behavioral variables. The descriptive statistics in Supplemental Appendix E show that the variance of nearly all quality metrics in the GAI group is lower than that in the human-generated group. In particular, the variance of image quality, scale-invariant feature transform, texture, and noise in the GAI group is even 0. This result indicates that GAI-generated images exhibit high homogeneity and templated characteristics in low-order visual features, while their generation process demonstrates a clear standardization tendency. Conversely, human-photographed images exhibit richer diversity and randomness in the aforementioned visual features. This study further employs the interquartile range (IQR) to quantify the dispersion of data distribution (this index indicates the difference between the upper and lower quartiles) (Whaley, 2005). The IQR value of the GAI group is 0.5375, which is significantly lower than that of the human group (1.1875), further verifying the visual homogeneity of the GAI-generated images. Therefore, visual homogeneity is identified as the pattern difference and independent variable in Study 3.
Theoretical Foundations and Hypothesis Development
An exposure experiment confirms that when repeatedly encountered stimuli are highly similar, an individual’s familiarity with such stimuli increases, weakening their perception of novelty (Gordon & Holyoak, 1983). Furthermore, Förster et al. (2009) found that when individuals use a global processing approach, they prioritize the overall features and commonalities of objects (rather than local differences and details). This processing tendency strengthens the perception of similarity among stimuli, ultimately reducing an individual’s evaluation of novelty. On the basis of these experiments, Förster et al. (2010) proposed novelty categorization theory (NCT), which clearly explains the mechanism by which individuals judge novelty (creativity, unprecedentedness). That is, when an event can be categorized into existing mental categories, individuals automatically initiate a similarity search process, and the perception of similarity transforms into familiarity, inhibiting the judgment of an event’s novelty.
In tourism, when tourists browse destination images, highly visual homogeneous image sets essentially constitute repetitive, similar stimuli. This high degree of similarity triggers tourists’ global processing tendency, overlooking unique details in individual images. Simultaneously, this global processing makes it easy for tourists to categorize currently viewed photos into existing cognitive categories. This familiarity derived from similarity ultimately inhibits tourists’ evaluation of the novelty, thereby weakening their perceived creativity. Accordingly, this study proposes Hypothesis 1 (H1):
Natural scene statistics indicate that real-world images typically exhibit natural fluctuations and variations in underlying visual attributes, such as brightness, contrast, color distribution, and texture, rather than being completely constant and unchanging (Geisler, 2008). Through long-term exposure to such visual stimuli, individuals gradually adapt to these statistical patterns and form cognitive schemas about real images (De Cesarei et al., 2017). A schema is a knowledge structure about a specific object or concept; it reflects a stable cognition formed by an individual based on experience (Soni & Kumar, 2024). Schema congruity theory (SCT) further points out that when new information deviates from the original schema, this situation is more likely to trigger doubt and negative judgment (Gao et al., 2022).
In tourism, tourists form the tourism visual scheme based on their past travel experiences and habits. That is, even photos of the same tourist destination will differ in low-order visual features (texture, noise, and sharpness) due to variations in the devices, weather, lighting, and other practical factors. Therefore, when a set of images of a tourist destination exhibits unusually consistent homogeneity in low-order visual features, tourists will perceive these images as deviating from the true visual schema of tourism, thus suspecting them of being edited or forged, significantly reducing their perceived authenticity. On this basis, this study proposes Hypothesis 2 (H2):
In research regarding the correlation between behavior and attitudes, the influences of perceived authenticity and perceived creativity on behavioral intention have been widely verified (H. T. Bui et al., 2024; Heimstad et al., 2025; Wang et al., 2023). This study follows the core hypothetical logic of existing research and proposes Hypotheses 3 (H3) and 4 (H4):
Research Design
To reduce the interference of confounding factors in the stimulus materials, this study conducts a secondary screening based on the GAI- and human-generated image databases constructed in Study 2 from four generative models. A total of 100 images are selected from each database as the image candidate pools for Study 3. The screening follows the principles of similar destinations and scenes, ensuring that the images are as consistent as possible semantically in terms of core content elements. This condition ensures that the two groups of stimuli differ only in low-order visual features rather than in semantic content. For GAI-generated stimuli, this study controls for the potential confounding variable of the generative model. That is, each GAI stimulus group consists of images generated by the same generative model rather than being randomly selected from four different models. This situation avoids the interference of differences in style and image quality among different models in the subjects’ judgment.
The stimulation employs a between-subjects design: four images are randomly selected from image candidate pools to form the stimulation sets. First, this study sets each stimulation set to four images because Sicilia and Ruiz (2010) indicated that an individual can effectively process approximately four to ten images. Second, Zinko et al. (2025) indicated that consumers’ perception of image information does not increase with the number of images. The positive effect is most significant when four images are present, and the marginal benefit decreases after four images. Finally, the participants of the pilot study report difficulty in remembering excessive images, suggesting that four images are preferable.
This study employs a two-stage experimental design. The first stage is a pre-experiment that is designed to verify whether the intergroup differences derived from Study 2 can be translated into subjective perceived differences. In particular, this study randomly assigns participants to one of the stimulation sets (GAI image set or human image set). After browsing the image sets, the participants evaluate perceived visual homogeneity. The purpose of this stage is to examine whether GAI images are subjectively perceived as having higher visual homogeneity in low-order visual features compared with human-generated images. The second stage is the formal experiment, which is designed to examine the psychological mechanisms that underlie the research model. The participants rate the model constructs after viewing a stimulation set under corresponding conditions. All constructs are adapted from the existing literature, and all measurement items use a 7-point Likert scale.
Research Findings
This study collects 150 questionnaires by using the Prolific platform. After removing questionnaires that fail the attention check, 136 valid questionnaires are finally obtained. Supplemental Appendix F provides the questionnaire items (F1) and demographic characteristics (F2). The independent samples t-test results of Stage 1 shows that with regard to visual homogeneity, the participants from the GAI image group score significantly higher than those from the human image group (Mean_GAI = 5.32; Mean_Human = 4.65; Welch t(131.01) = 4.10, p < .001, d = 0.96), with a large effect size. This finding indicates that the phenomenon of greater visual homogeneity in GAI-generated images found in Study 2 data can be subjectively perceived.
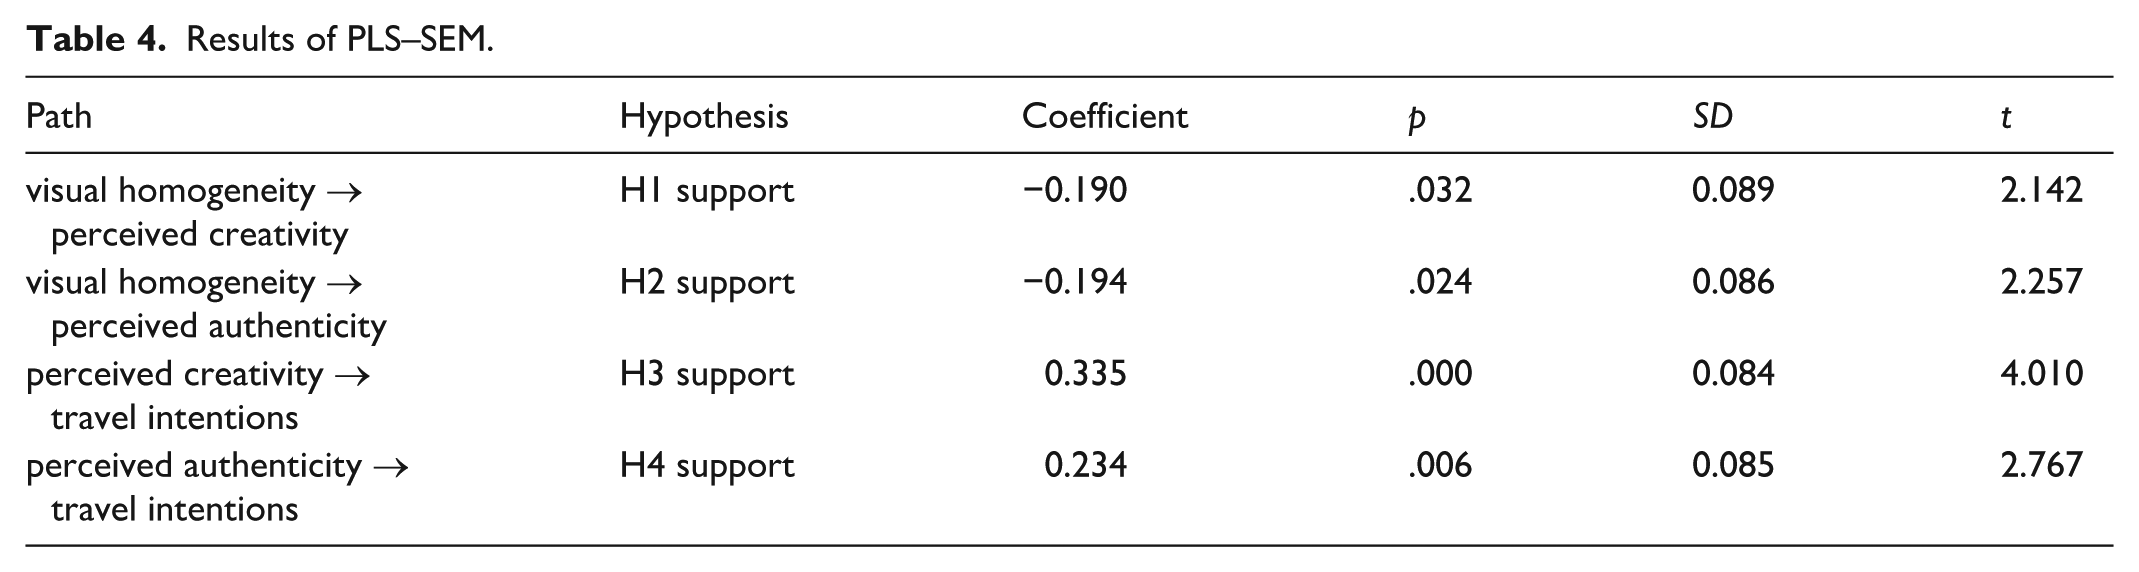
This study employs PLS-SEM to analyze the conceptual model (Table 4). Reliability tests show that the initial Cronbach’s α for the three items in visual homogeneity is .622. After deleting Item 1, α increases to .815, meeting the reliability criterion. Therefore, the two items are retained for measurement. The Cronbach’s α values for intention, perceived creativity, and perceived authenticity are .919, .822, and .966, respectively. All values meet scale reliability requirements. Hypothesis testing results indicate that all hypotheses are empirically supported. Specifically, visual homogeneity exerts a significant negative impact on perceived creativity (−0.190) and perceived authenticity (−0.194), while perceived creativity exerts a significant positive impact on perceived authenticity.
Results of PLS–SEM.
Findings and Discussion
With the rapid development of GAI, a surge of GAI-generated content has flooded the market. This study focuses on the differences between GAI- and human-generated images, and their impact mechanisms, through three progressive stages (Figure 7).
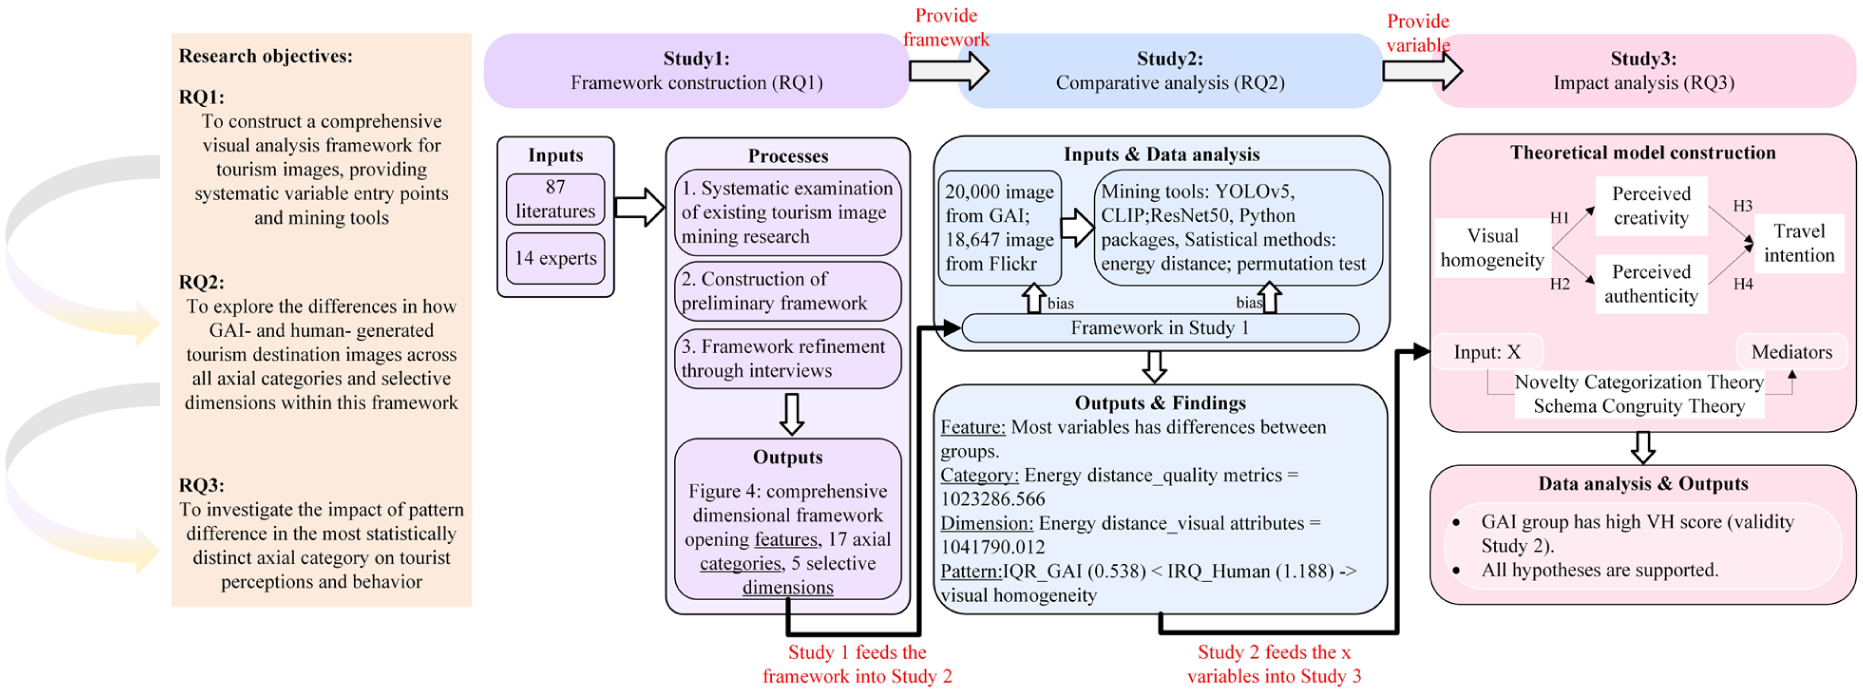
Structure process.
Study 1, which corresponds to RO1, constructs a visual analysis framework for tourism image mining based on a literature review and an expert elicitation approach. It summarizes existing image features into five dimensions and 17 categories and then hierarchically categorizes them by using the manifest and latent theoretical foundations of images. This framework provides an analytical basis for Study 2. Study 2 corresponds to RO2. It acquires human-generated images on Flickr and GAI-generated images by using large language model/API. Building upon the framework of Study 1, Study 2 systematically mines and statistically compares the features, categories, and dimensions of the two types of images. The results show that, except for seven variables, all the other features exhibit significant differences. The dimension with the largest intergroup difference is visual attributes, and the category with the largest difference is quality metrics. Further analysis reveals that under the quality metric dimension, GAI images exhibit higher visual homogeneity characteristic compared with human images, indicating that their low-level visual attributes, such as texture, noise, and overall image quality, fluctuate less. This finding provides a core explanatory variable for Study 3. Study 3 aims to address RO3 by further examining how visual homogeneity affects user perception and behavior. First, Stage 1 experiment shows that the objective differences in visual homogeneity identified in Study 2 can be subjectively perceived by users; that is, users also perceive GAI images as having higher visual homogeneity. Subsequently, Stage 2 experiment validates the theoretical model constructed using NCT and SCT, demonstrating that higher visual homogeneity significantly reduces users’ perceived creativity and perceived authenticity, affecting their behavioral intentions.
The results indicate that understanding the differences between GAI- and human-generated images cannot be limited to the level of different sources. Existing research frequently regards AI and humans as holistic manipulation and explanatory variables (Brüns & Meißner, 2024; H. T. Bui et al., 2024), focusing on the impact of source cues on user attitudes and behavior. However, research has rarely delved deeper into which specific visual features in GAI content trigger these differences. Based on Studies 1 and 2, this research further examines these differences at a more granular visual level, identifying visual homogeneity as a key variable. Study 2 shows that differences in visual homogeneity exist in objective statistical terms. Study 3 indicates that these differences in visual homogeneity can be subjectively perceived by users and influence their behavioral intentions through perceived creativity and perceived authenticity. Therefore, the influence of GAI images does not solely arise from the AI source but is more likely related to the specific visual patterns they present.
Furthermore, this study also indicates that the visual attributes that are worthy of attention in GAI tourism image research should not be limited to visual attributes, such as complexity (Bi et al., 2025), appeal (Ibrahim et al., 2025), or symbol color (He et al., 2023), at the level of a single image. Although different visual attributes can influence consumer attitudes (P. Li et al., 2026), the more important factor when comparing GAI and human images is not complexity versus simplicity, but rather, whether low-level visual quality features are overly similar. That is, users will not only react to individual images but also judge the overall similarity and degree of variation among a group of images. Furthermore, significant differences still exist between current GAI images and human-captured images, indicating that GAI images have not yet fully reached the level of being able to replace manually captured images. Therefore, the conclusion that GAI materials are superior to manually captured images (Hartmann et al., 2025) should be regarded with caution.
Implications and Limitations
Theoretical Implications
Based on the above research processes and findings, this study makes three major theoretical contributions: the construction of an analytical framework, the identification of key pattern differences, and the revelation of influencing mechanisms.
First, the visual analysis framework fills the gap in standardized theoretical paradigms for tourism images. Although visual images play a crucial role in tourism decision-making, existing research on image features remains largely fragmented. The definitions of image variables are vague (Villarroel Ordenes & Zhang, 2019), lacking a systematic understanding of the underlying structure of images and a comparable framework. This study proposes five core dimensions and 17 axial categories, clearly distinguishing between manifest and latent image levels, offering a more standardized variable organization path for subsequent tourism visual research.
Second, this study advances the discussion on the differences between GAI and human images from “whether differences exist between them” to “which difference is the most critical.” Existing GAI research in tourism largely remains at the level of subjective concepts and potential applications, lacking empirical support. This study, through rigorous statistical analysis, is the first to extract and conceptualize visual homogeneity, providing a core theoretical variable and a measurement foundation for quantitatively and qualitatively characterizing the stereotyping and homogenization risks of GAI content.
Finally, this study incorporates visual homogeneity, perceived authenticity, and perceived creativity into a unified analytical framework, and applies the framework to tourist travel intention research, demonstrating significant theoretical innovation. Based on NCT, this study confirms that, in addition to content repetition, highly consistent basic visual features trigger tourists’ global processing and automatic classification mechanisms, thereby reducing perceived creativity. Based on SCT, this study finds that the patterned visual content produced by GAI disrupts tourists’ existing tourism visual schemas, explaining the homogenization risk of tourism marketing materials in the AI era from psychological perspectives.
Practical Implications
From the findings of Studies 2 and 3, this work also has practical implications in the following three aspects.
For tourism marketers, when using GAI images as promotional materials, marketers should select appropriate image types in accordance with different scenarios. In particular, in scenarios that require the delivery of authenticity, creativity, and promotion of travel intentions, high visual homogeneity GAI images should be avoided. A combination of GAI and human images is more suitable to balance efficiency and persuasiveness.
Second, if a set of GAI images is used for marketing, the risk of homogenization in quality metrics should be carefully considered. For example, tourism marketers should consider the following questions: “Are a set of images too similar in clarity, sharpness, texture, and noise?” “Do they present an overly consistent image quality style?” “Do they give the impression of being a template?” Tourism marketers can conduct visual homogeneity prescreening of an image set, prioritizing the identification and elimination of image groups with overly concentrated quality metrics to avoid negative impact to tourists’ attitudes and behavior.
Finally, this study also provides clearer optimization directions for AI model developers and platforms. On the basis of the significant differences identified in Study 2, future research can focus on enhancing the diversity of GAI images in terms of visual attributes and semantic content to reduce the gap with human-generated images. Simultaneously, mechanisms for detecting and controlling visual homogeneity can be incorporated into the generation process to improve the generated outcomes further.
Limitations
This study has several limitations. First, the four GAI models selected only represent advanced solutions under the current technological level. As GAI technology continues to develop, future research can conduct comparative analysis. Continuously tracking the performance of different generations of GAI models to examine whether the visual pattern difference and the psychological effects discovered in this study will weaken, change, or disappear with technological advancements. Second, although this study employs a multi-round screening strategy to ensure that Flickr samples are generated by humans, it still acknowledges a potential risk of data contamination. Meanwhile, although the prompt used to generate GAI tourism images in the present work is designed by following Vu et al. (2025), its expression is relatively broad. Future research can design multiple versions of structured prompts for image generation.
Supplemental Material
sj-docx-1-jtr-10.1177_00472875261459270 – Supplemental material for Visual Divide in Tourism: Multi-Study Analysis of Framework, Differences, and Impacts of GAI Versus Human-Generated Images
Supplemental material, sj-docx-1-jtr-10.1177_00472875261459270 for Visual Divide in Tourism: Multi-Study Analysis of Framework, Differences, and Impacts of GAI Versus Human-Generated Images by Yihong Chen, Ge Zhan and Rob Law in Journal of Travel Research
Footnotes
Ethical Considerations
This article does not contain any studies with human or animal participants.
Consent to Participate
Informed consent was obtained verbally before participation. The consent was audio-recorded in the presence of an independent witness.
Consent for Publication
This article has obtained informed consent from the participants.
Author Contributions
Funding
The authors disclosed receipt of the following financial support for the research, authorship, and/or publication of this article: This project was partly supported by a research grant funded by the University of Macau.
Declaration of Conflicting Interests
The authors declared no potential conflicts of interest with respect to the research, authorship, and/or publication of this article.
Supplemental Material
Supplemental material for this article is available online.
Author Biographies
References
Supplementary Material
Please find the following supplemental material available below.
For Open Access articles published under a Creative Commons License, all supplemental material carries the same license as the article it is associated with.
For non-Open Access articles published, all supplemental material carries a non-exclusive license, and permission requests for re-use of supplemental material or any part of supplemental material shall be sent directly to the copyright owner as specified in the copyright notice associated with the article.