






Abstract
Objective
This study examined the association between the Systemic Inflammatory Response Index (SIRI) and depressive symptoms among emerging adults aged 18-25 years, with an emphasis on the indirect role of sleep duration.
Method
This cross-sectional study utilized data from the National Health and Nutrition Examination Survey (NHANES) 2005-2023. A total of 6563 participants with complete data on the Patient Health Questionnaire-9 (PHQ-9), complete blood count parameters for SIRI calculation, and self-reported sleep duration were included. Depressive symptoms were defined as a PHQ-9 score ≥10. Weighted multivariable logistic regression, restricted cubic spline analysis, and bootstrap-based exploratory mediation analysis (n = 1000) were employed.
Results
Overall, 604 participants (9.2%) met the criteria for depressive symptoms. After full adjustment for covariates, SIRI demonstrated a significant positive association with depressive symptoms (Model 4: OR = 1.16, 95% CI = 1.02-1.33, P = 0.03). Participants in the highest SIRI quartile (Q4) exhibited 33% higher odds of depressive symptoms compared to the lowest quartile (Q1) (OR = 1.33, 95% CI = 1.09-1.61, P = 0.005). No significant nonlinearity was observed (P for nonlinearity = 0.066). Exploratory mediation analysis revealed a negative indirect effect through sleep duration (β = −0.009), accounting for approximately 6.2% of the total effect.
Conclusions
Higher SIRI levels were associated with increased odds of depressive symptoms among emerging adults. Sleep duration played a modest suppressor role in this relationship, suggesting complex interactions between inflammation, sleep, and mental health warranting further investigation through prospective studies.
Keywords
Introduction
Depression represents a major global public health challenge, affecting an estimated 280 million individuals worldwide. 1 Among various age demographics, emerging adults aged 18-25 years experience disproportionately elevated rates of depressive disorders, with recent estimates indicating prevalence rates approaching 17% in the United States—substantially higher than older populations. 2 This developmental period, characterized by significant biological, psychological, and social transitions, coincides with peak onset for most psychiatric disorders.3,4 The burden extends beyond individual suffering, encompassing substantial economic costs and long-term psychosocial impairments. 5 Despite recognition of this crisis, the underlying mechanisms driving depression vulnerability in emerging adults remain incompletely understood.
Growing evidence implicates systemic inflammation as a critical contributor to depressive pathophysiology.6,7 Pro-inflammatory cytokines, including interleukin-1β, interleukin-6, and tumor necrosis factor-α, can traverse the blood-brain barrier to initiate neuroinflammatory cascades that disrupt monoaminergic neurotransmission, impair neuroplasticity, and dysregulate hypothalamic-pituitary-adrenal axis function.8,9 Among various inflammatory biomarkers, the SIRI—calculated from peripheral neutrophil, monocyte, and lymphocyte counts—has emerged as a composite marker reflecting systemic inflammatory status more comprehensively than individual cell measurements. 10 Recent investigations have demonstrated associations between elevated SIRI and treatment-resistant bipolar depression, as well as suicide attempts in major depressive disorder. 11 However, the relationship between SIRI and depressive symptoms specifically among emerging adults remains unexplored.
Sleep disturbances represent both a core symptom and potential mechanistic pathway in depression, with bidirectional relationships increasingly recognized. 12 Beyond its direct associations with depressive symptoms, sleep duration exhibits complex interactions with inflammatory processes. Inflammatory cytokines promote sleep as part of homeostatic regulation, while chronic sleep disruption activates inflammatory pathways. 13 This intricate interplay suggests that sleep duration may influence the inflammation-depression relationship, yet such pathways remain inadequately characterized in young adult populations. Therefore, the present study addressed these knowledge gaps by examining the association between SIRI and depressive symptoms among emerging adults aged 18-25 years using data from NHANES 2005-2023. Additionally, we explored the potential indirect role of sleep duration in this association through exploratory mediation analysis.
Method
Data Source and Study Design
This cross-sectional study utilized publicly accessible data from the NHANES spanning the 2005-2023 cycles. NHANES is a nationally representative survey program conducted by the National Center for Health Statistics (NCHS) to assess the health and nutritional status of the United States population through a complex, multistage probability sampling design. 14 The survey combines standardized interviews, physical examinations, and laboratory assessments. All NHANES protocols were approved by the NCHS Research Ethics Review Board, and written informed consent was obtained from all participants. As this analysis utilized de-identified publicly available data, additional institutional review board approval was not required.
The study population consisted of emerging adults aged 18-25 years who participated in NHANES between 2005 and 2023. The inclusion criteria required participants to have complete data for depressive symptoms (PHQ-9), complete blood count parameters necessary for calculating SIRI, and self-reported sleep duration. Participants were excluded if they had missing values for key variables, extreme outliers in inflammatory markers, or incomplete covariate information essential for the analysis.
Variable Definitions
Outcome Variable: Depressive Symptoms
Depressive symptoms were assessed using the PHQ-9, a validated self-administered screening instrument derived from the Diagnostic and Statistical Manual of Mental Disorders, Fourth Edition (DSM-IV) criteria for major depressive disorder. 15 The PHQ-9 comprises 9 items, each scored on a 4-point Likert scale ranging from 0 (“not at all”) to 3 (“nearly every day”), reflecting the frequency of depressive symptoms over the preceding 2 weeks. Total scores range from 0 to 27, with higher scores indicating greater symptom severity. Consistent with established screening thresholds, participants with a PHQ-9 total score ≥10 were classified as having clinically significant depressive symptoms in this study, as this cutoff demonstrates optimal sensitivity and specificity for screening major depressive disorder. 16 It should be noted that the PHQ-9 is a symptom severity measure rather than a diagnostic instrument; a score ≥10 indicates probable depression warranting further clinical evaluation rather than a definitive diagnosis.
Exposure Variable: Systemic Inflammatory Response Index (SIRI)
The SIRI was calculated using complete blood count parameters obtained during the NHANES physical examination. SIRI represents a composite inflammatory marker derived from peripheral blood cell counts and was computed using the following formula:
17

Where all cell counts were expressed as cells × 109/L. SIRI was analyzed both as a continuous variable and as a categorical variable divided into quartiles. The quartile cutoff values were defined as follows: Q1 (0.000-0.676], Q2 (0.676-0.991], Q3 (0.991-1.418], and Q4 (1.418-2.76]. This stratification approach facilitated the examination of potential dose-response relationships between inflammatory burden and depressive symptoms.
Mediator Variable: Sleep Duration
Sleep duration was assessed via self-report using the question “How many hours do you usually sleep on weekdays or workdays?” Responses were recorded as continuous values in hours. This single-item assessment has been widely utilized in epidemiological research and demonstrates reasonable correlation with objective sleep measures. 18
Covariates
Based on prior literature and theoretical considerations, several potential confounding variables were identified and included in the analysis. Demographic covariates included age (continuous, in years), sex (male/female), race/ethnicity (Mexican American, Other Hispanic, Non-Hispanic White, Non-Hispanic Black, and Other, which included participants who identified as Asian, American Indian/Alaska Native, Native Hawaiian/Other Pacific Islander, multiracial, or another race not otherwise specified), guardian education level (categorized as less than high school, high school or equivalent, college and above), and poverty-income ratio (PIR; categorized as low [≤1.30], middle [1.30-3.50], and high [>3.50]). Clinical and anthropometric variables included body mass index (BMI; continuous, calculated as weight in kilograms divided by height in meters squared).
Health-related behavioral factors encompassed smoking status (categorized as never smoker, current smoker, or former smoker based on responses to “Have you smoked at least 100 cigarettes in your entire life?” and “Do you now smoke cigarettes?”) and alcohol consumption (categorized as never, current, or former drinker based on the average number of alcoholic drinks consumed per day in the past 12 months). Additional covariates included in the fully adjusted model were self-reported history of hypertension, diabetes, cardiovascular disease (CVD), and asthma; physical activity level (categorized as inactive or active based on self-reported leisure-time physical activity); psychotropic medication use (yes/no, ascertained from the NHANES prescription medication questionnaire); Healthy Eating Index-2020 (HEI-2020) total score as an indicator of overall diet quality; and total energy intake (kcal/day) derived from 24-hour dietary recall data. These covariates were selected based on established associations with both inflammatory markers and mental health outcomes, as documented in the epidemiological literature.
Statistical Analysis
All statistical analyses incorporated appropriate NHANES sampling weights to account for the complex survey design, including oversampling of certain demographic groups and non-response adjustments, thereby ensuring nationally representative estimates. Specifically, the full sample 2-year interview weight (WTSAF2YR) was used as the sampling weight, SDMVSTRA as the stratification variable, and SDMVPSU as the primary sampling unit. The study encompassed 8 survey cycles (2005-2006, 2007-2008, 2009-2010, 2011-2012, 2013-2014, 2015-2016, 2017-2020, and 2021-2023). Because the 2017-2020 cycle was truncated to March 2020 due to the COVID-19 pandemic and covered approximately 3.2 years rather than the standard 2-year period, sampling weights were recalculated for multi-cycle combination as follows: for the 2017-2020 cycle, weight = (3.2/17.2) × WTSAF2YR; for all other cycles, weight = (2/17.2) × WTSAF2YR, where 17.2 represents the total coverage in years across all 8 cycles. The svydesign() function from the survey package in R was used for all survey-weighted analyses. Analyses were conducted using R version 4.2.3 (R Foundation for Statistical Computing, Vienna, Austria).
Baseline characteristics of the study population were stratified by SIRI quartiles. Continuous variables were assessed for normality using the Shapiro-Wilk test. For normally distributed variables with homogeneous variances, one-way analysis of variance (ANOVA) was employed to compare differences across SIRI quartiles, with results presented as mean ± standard deviation (SD). For variables that violated normality assumptions or demonstrated heterogeneous variances, the Kruskal-Wallis H test was utilized, with results presented as median (interquartile range). Categorical variables were summarized as frequencies and proportions, with between-group differences evaluated using the chi-square test. When expected cell frequencies were below 5 in more than 20% of cells, Fisher’s exact test was applied instead.
The association between SIRI and depressive symptoms was examined using weighted multivariable logistic regression models. Four sequential models were constructed with progressively increasing covariate adjustment: Model 1 was unadjusted; Model 2 was adjusted for age and sex; Model 3 was additionally adjusted for race/ethnicity, guardian education level, PIR, and BMI; Model 4 was further adjusted for smoking status, alcohol consumption, hypertension, diabetes, CVD history, asthma, physical activity, psychotropic medication use, HEI-2020 total score, and total energy intake. Results were reported as odds ratios (OR) with corresponding 95% confidence intervals (CI) and P-values. SIRI was analyzed both categorically (by quartiles, with Q1 as the reference group) and continuously (per unit increase). Tests for linear trends across SIRI quartiles were performed by modeling the median value of each quartile as a continuous variable.
To evaluate potential nonlinear relationships between SIRI and depressive symptoms, restricted cubic spline (RCS) regression with 4 knots positioned at the 5th, 35th, 65th, and 95th percentiles of the SIRI distribution was employed within the logistic regression framework. The model was adjusted for all covariates included in Model 4, and the statistical significance of nonlinearity was assessed using the Wald test.
Stratified analyses were conducted to explore potential effect modification across subgroups defined by sex, race/ethnicity, PIR categories, smoking status, and alcohol consumption status. Within each stratum, the association between SIRI and depressive symptoms was estimated using multivariable logistic regression adjusted for all covariates except the stratification variable. Multiplicative interaction terms were incorporated into fully adjusted models, with statistical significance evaluated using the Wald test.
Exploratory mediation analysis was performed using bootstrap resampling (n = 1000) to examine the indirect role of sleep duration in the SIRI-depressive symptoms relationship, decomposing the total effect into direct and indirect components. All models were adjusted for covariates specified in Model 4. Given the cross-sectional design, these results should be interpreted as exploratory indirect associations rather than causal mediation pathways.
Sensitivity analyses included: (1) alternative PHQ-9 cutoffs (≥8 and ≥12) for defining depressive symptoms; (2) exclusion of participants with physician-diagnosed sleep disorders (NHANES variable SLQ060); and (3) parallel fully adjusted models using alternative inflammatory markers (neutrophil-to-lymphocyte ratio [NLR], monocyte-to-lymphocyte ratio [MLR], platelet-to-lymphocyte ratio [PLR], systemic immune-inflammation index [SII], and C-reactive protein [CRP]).
All hypothesis tests were two-sided, with statistical significance defined as P < 0.05. Missing data in covariates were handled using complete case analysis, given the relatively small proportion of missingness after initial exclusions.
Results
Sample Characteristics
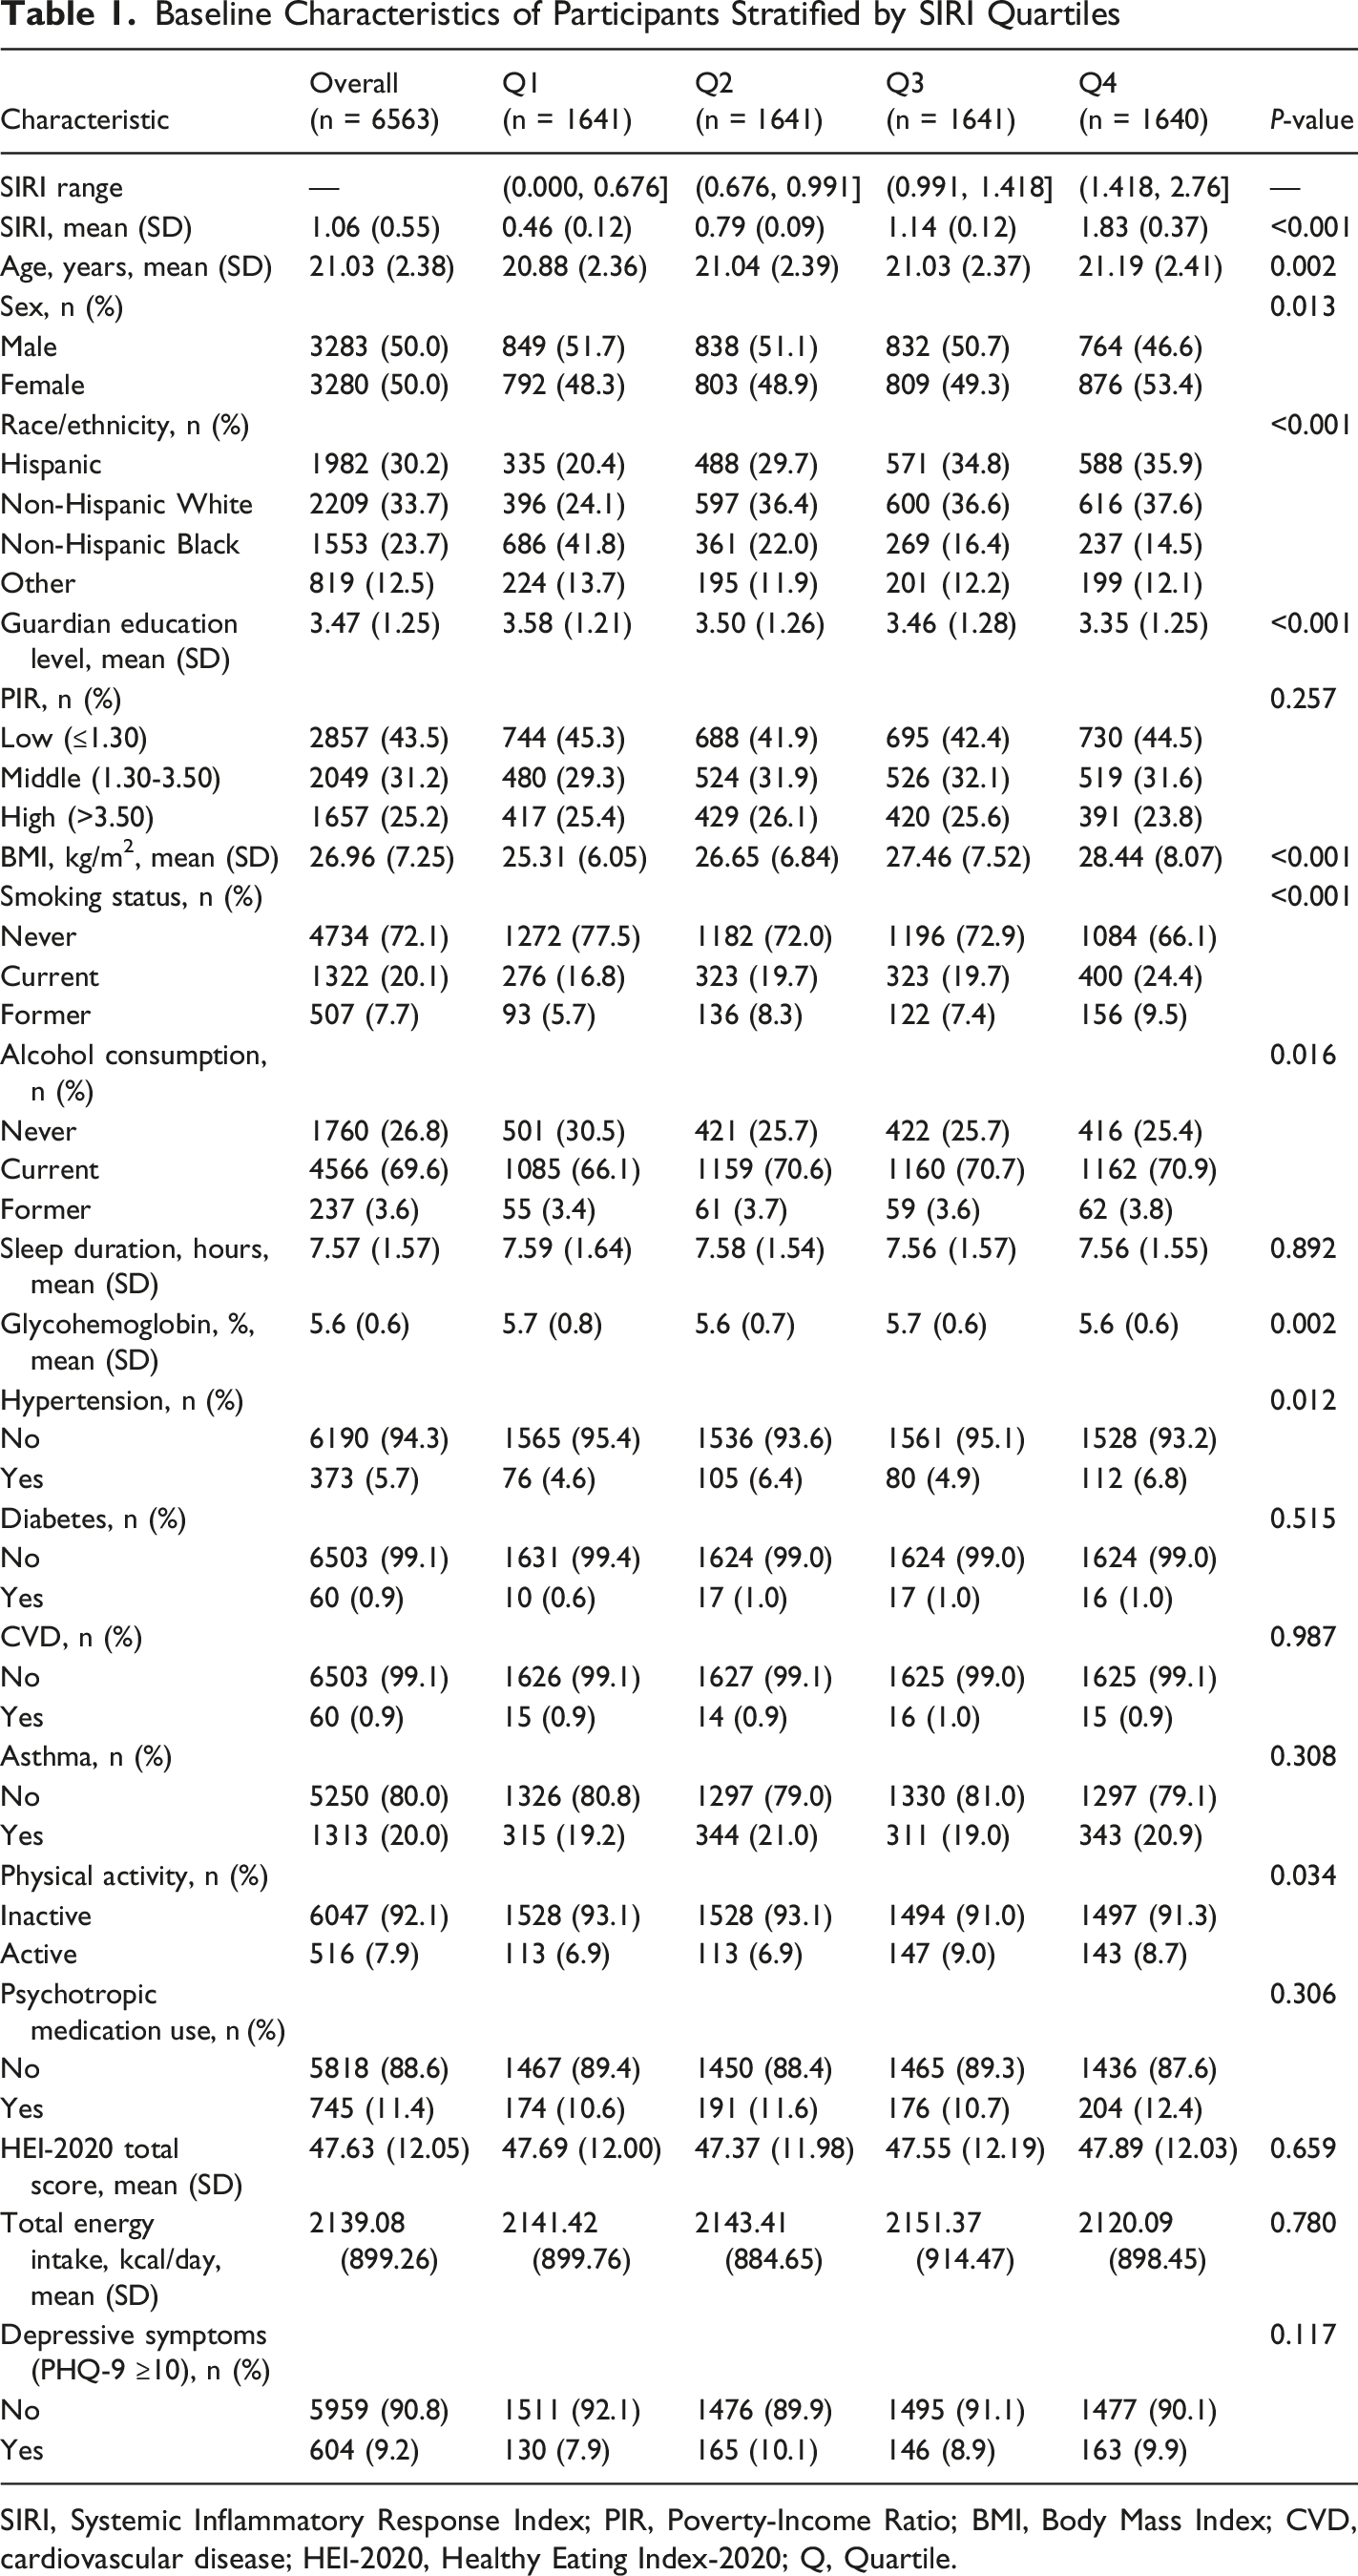
The initial dataset comprised 97,667 participants who completed the NHANES interview during the study period. Of these, 47,568 participants were excluded due to missing PHQ-9 data, leaving 50,099 participants with depressive symptom assessment data. After applying age restrictions (18-25 years), 43,037 participants aged >25 years were excluded. An additional 486 participants lacked complete blood count data necessary for SIRI calculation, and 13 participants had missing sleep duration information. The final analytical sample included 6563 participants, of whom 604 (9.2%) met the criteria for clinically significant depressive symptoms (Figure 1). The mean age was 21.03 ± 2.38 years, with a balanced sex distribution (50.0% male, 50.0% female). The average BMI was 26.96 ± 7.25 kg/m2, and the mean SIRI value was 1.06 ± 0.55. Significant differences were observed across SIRI quartiles for multiple baseline characteristics. Participants in the highest quartile (Q4) were slightly older (21.19 ± 2.41 years vs 20.88 ± 2.36 years in Q1, P = 0.002), more likely to be female (53.4% vs 48.3%, P = 0.013), and demonstrated distinct racial/ethnic distributions (P < 0.001), with higher proportions of Hispanic and Non-Hispanic White individuals but lower proportions of Non-Hispanic Black participants. The Q4 group had lower guardian education levels (3.35 ± 1.25 vs 3.58 ± 1.21, P < 0.001), higher BMI (28.44 ± 8.07 vs 25.31 ± 6.05 kg/m2, P < 0.001), and a greater prevalence of current smoking (24.4% vs 16.8%, P < 0.001). The prevalence of hypertension was significantly higher in Q4 (6.8%) compared with Q1 (4.6%, P = 0.012), whereas diabetes (P = 0.515), CVD (P = 0.987), asthma (P = 0.308), psychotropic medication use (P = 0.306), HEI-2020 total score (P = 0.659), and total energy intake (P = 0.780) did not differ significantly across quartiles. Physical activity levels showed a modest but significant difference (P = 0.034), with slightly higher proportions of active individuals in Q3 and Q4. Although mean sleep duration decreased slightly from Q1 to Q4 (7.59 ± 1.64 hours vs 7.56 ± 1.55 hours), this difference was not statistically significant (P = 0.892). The prevalence of depressive symptoms did not differ significantly across SIRI quartiles (P = 0.117) (Table 1). Sample inclusion flowchart Baseline Characteristics of Participants Stratified by SIRI Quartiles SIRI, Systemic Inflammatory Response Index; PIR, Poverty-Income Ratio; BMI, Body Mass Index; CVD, cardiovascular disease; HEI-2020, Healthy Eating Index-2020; Q, Quartile.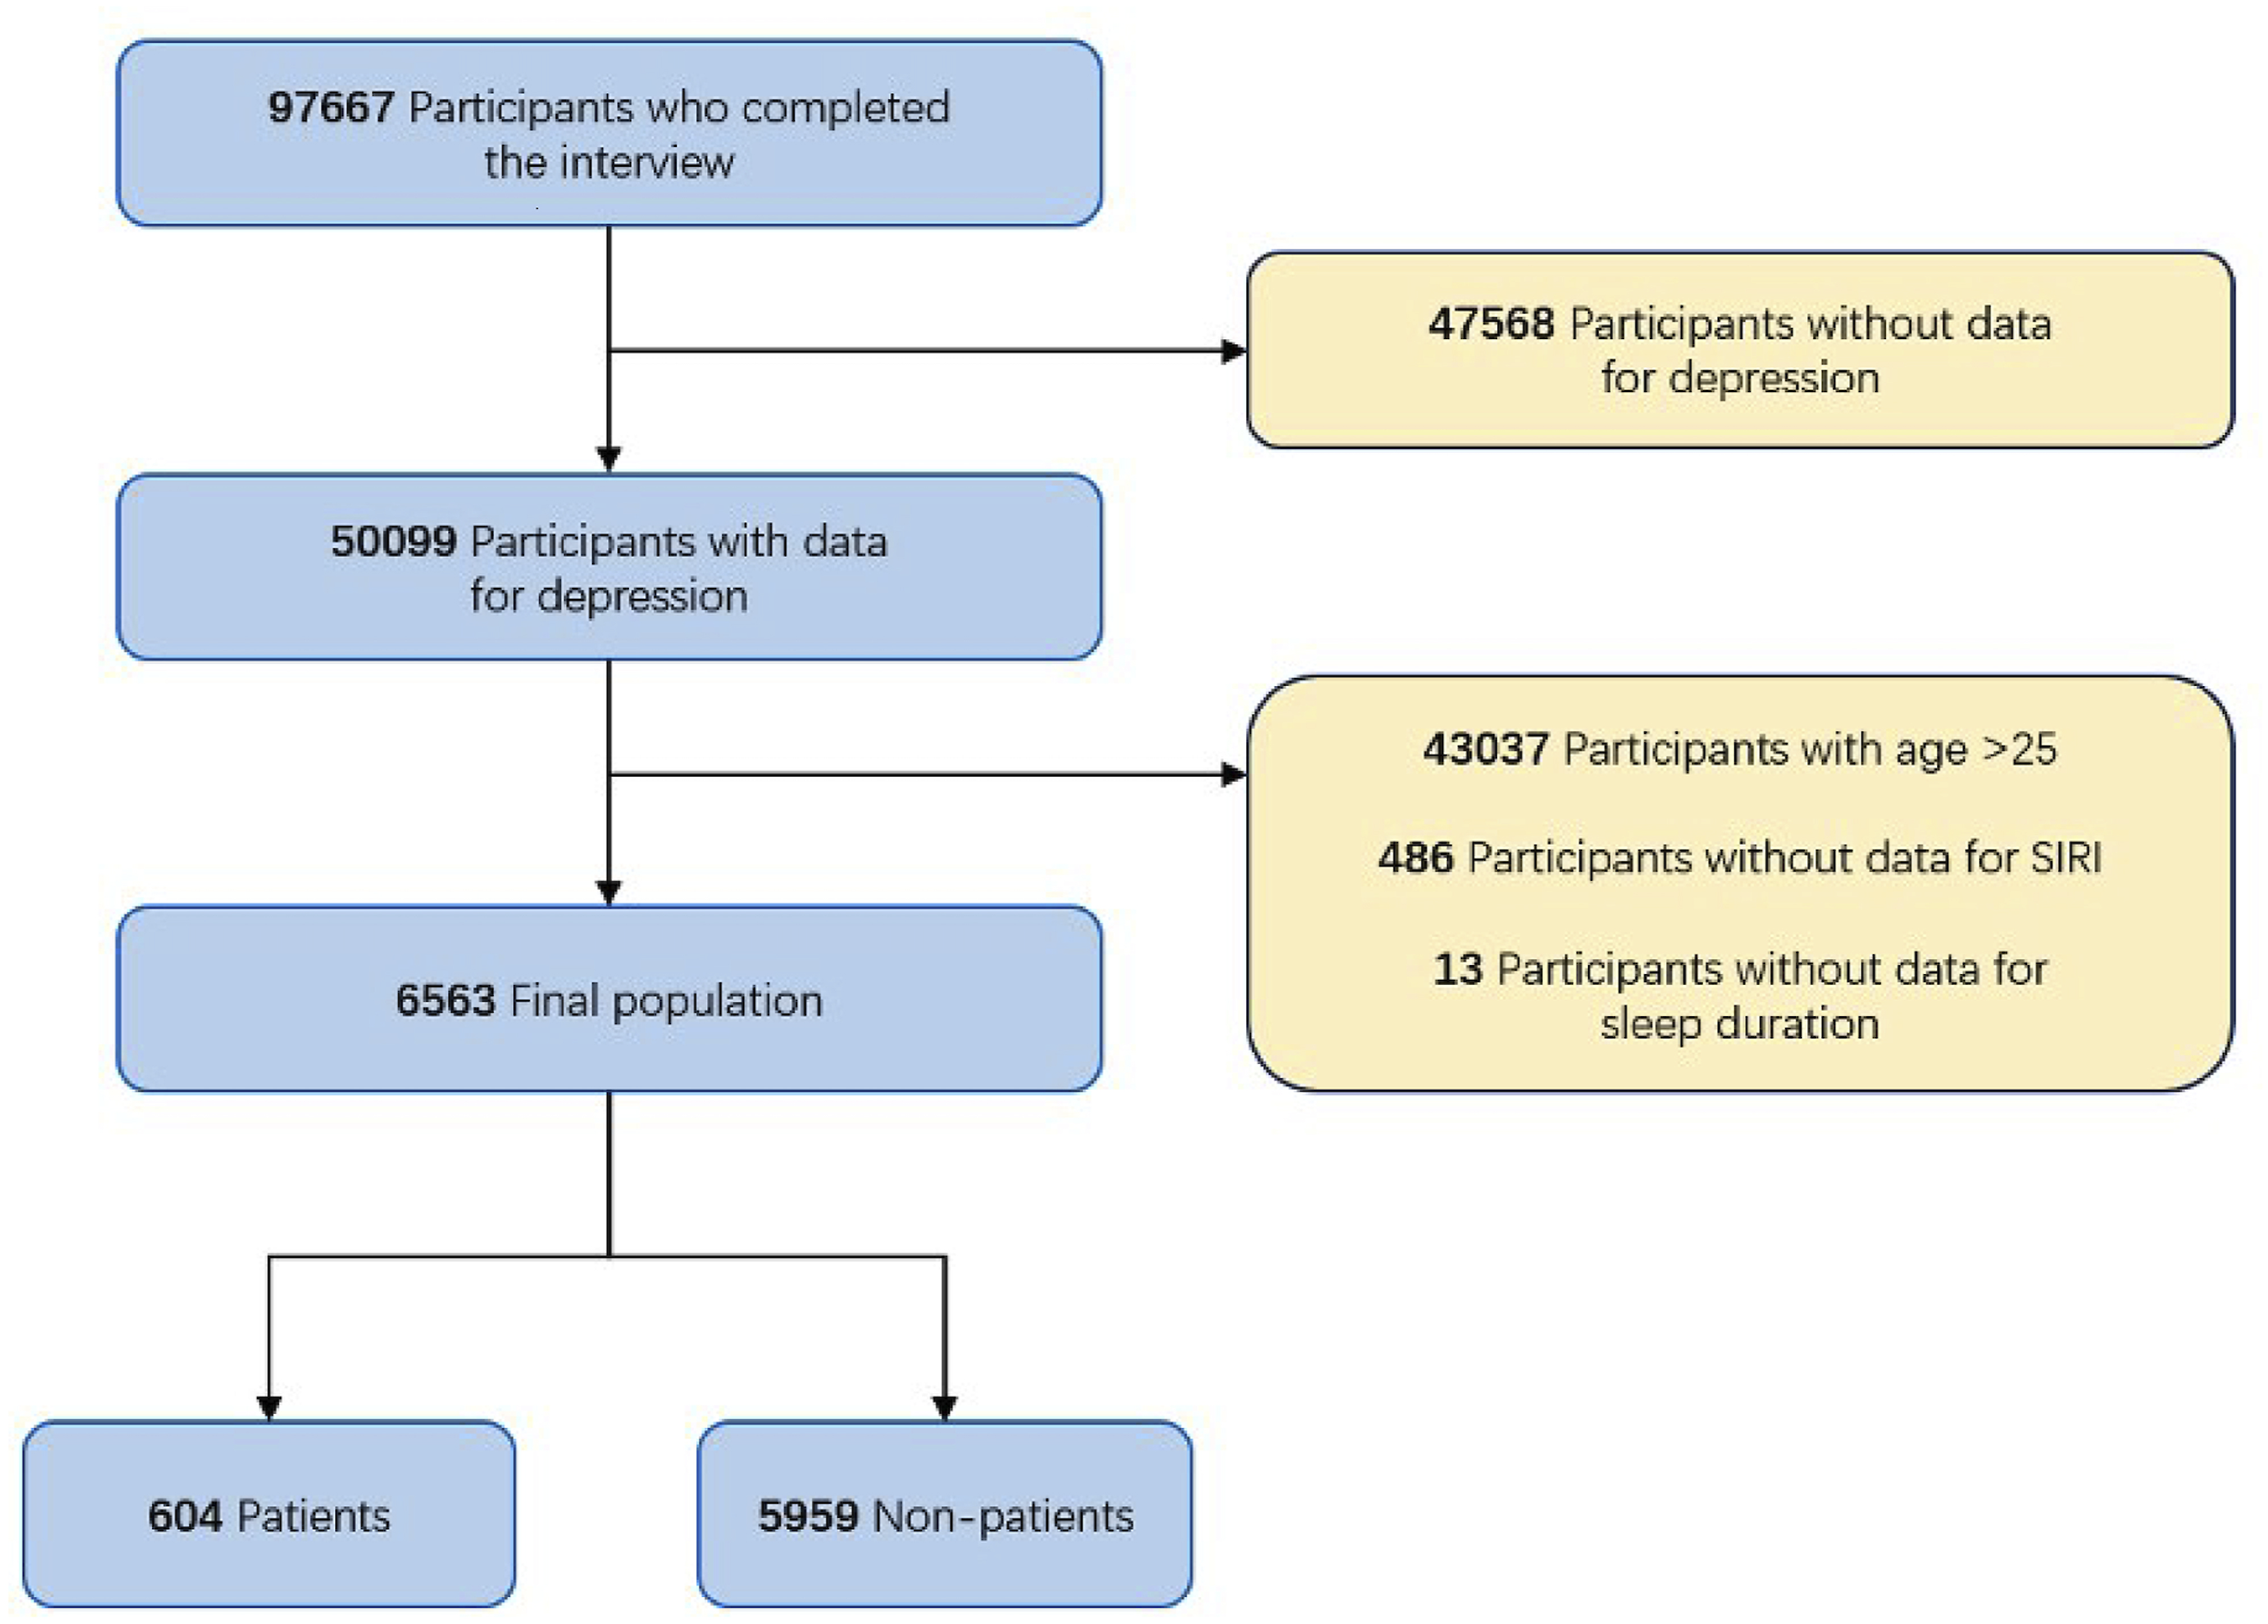
Association Between SIRI and Depressive Symptoms
Weighted Logistic Regression Analyses of the Association Between SIRI and Depressive Symptoms Among Emerging Adults
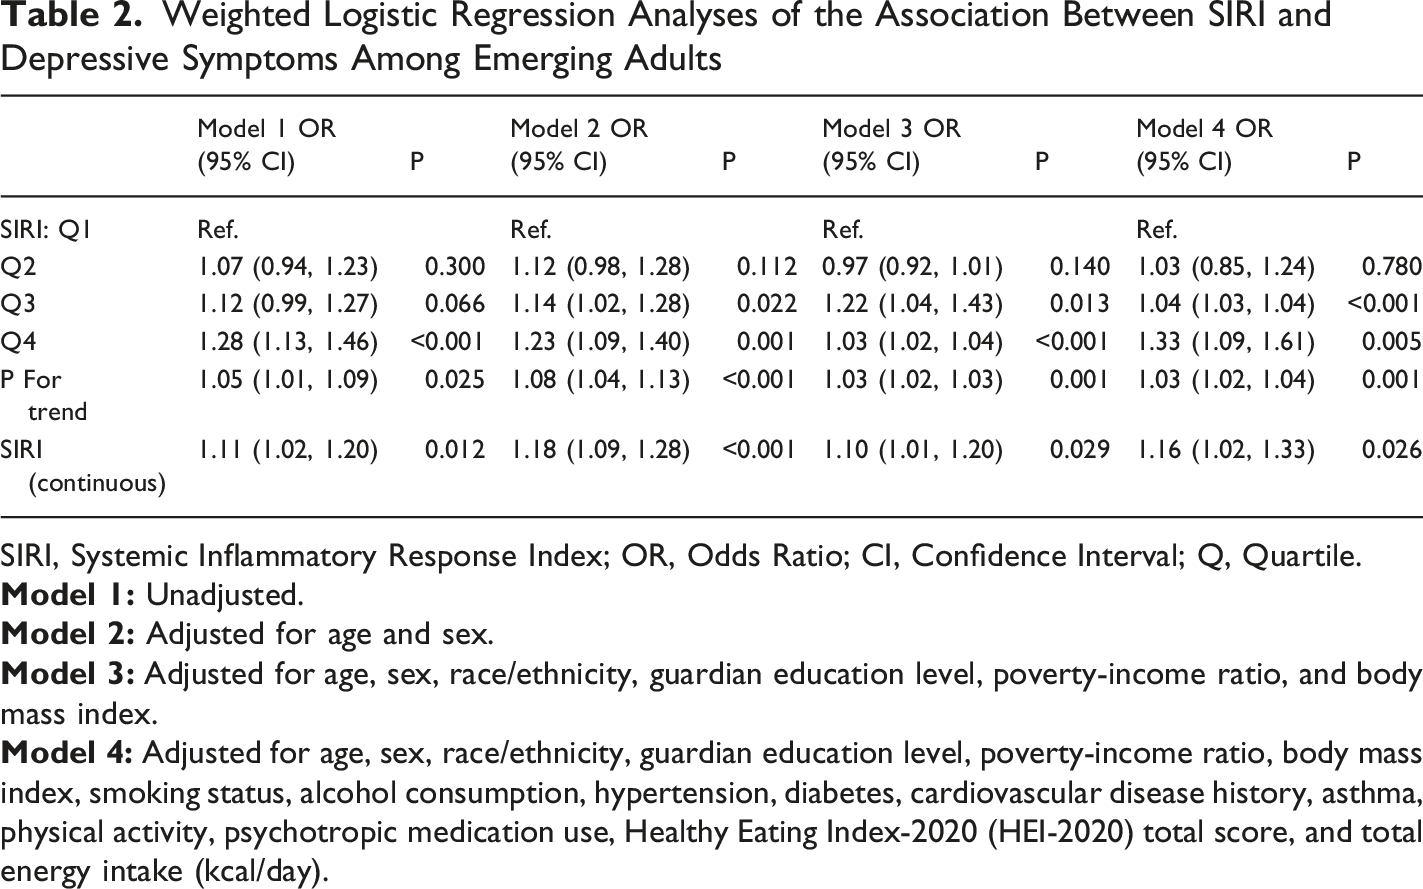
SIRI, Systemic Inflammatory Response Index; OR, Odds Ratio; CI, Confidence Interval; Q, Quartile.
When SIRI was examined categorically by quartiles, a dose-response relationship was evident. In Model 1, compared with the lowest quartile (Q1), participants in Q4 exhibited 28% higher odds of depressive symptoms (OR = 1.28, 95% CI: 1.13-1.46, P < 0.001), while Q3 showed a borderline significant association (OR = 1.12, 95% CI: 0.99-1.27, P = 0.066). After adjustment for age and sex in Model 2, associations for both Q3 (OR = 1.14, 95% CI: 1.02-1.28, P = 0.022) and Q4 (OR = 1.23, 95% CI: 1.09-1.40, P = 0.001) became statistically significant. In Model 3, the association for Q3 strengthened (OR = 1.22, 95% CI: 1.04-1.43, P = 0.013), and Q4 showed an OR of 1.03 (95% CI: 1.02-1.04, P < 0.001). In the fully adjusted Model 4, participants in Q4 demonstrated 33% higher odds of depressive symptoms compared to Q1 (OR = 1.33, 95% CI: 1.09-1.61, P = 0.005). The association for Q3 was also statistically significant (OR = 1.04, 95% CI: 1.03-1.04, P < 0.001), while Q2 showed no significant association (OR = 1.03, 95% CI: 0.85-1.24, P = 0.780). Tests for linear trend across SIRI quartiles indicated a statistically significant dose-response relationship in all models (Model 1: P = 0.025; Model 2: P < 0.001; Model 3: P = 0.001; Model 4: P = 0.001) (Table 2).
Nonlinear Relationship Assessment
The RCS curve suggested a generally positive association between SIRI and depressive symptom risk, with a relatively linear trend across the observed range of SIRI values. The statistical test for nonlinearity yielded a P-value of 0.066, indicating no significant departure from linearity (P for overall association = 0.005) (Figure 2). Restricted cubic spline curve for the association between SIRI and depressive symptoms. The curve demonstrates the relationship between systemic inflammatory response index (continuous variable) and odds of depressive symptoms among emerging adults, adjusted for age, sex, race/ethnicity, guardian education level, poverty-income ratio, body mass index, smoking status, alcohol consumption, hypertension, diabetes, cardiovascular disease history, asthma, physical activity, psychotropic medication use, HEI-2020 total score, and total energy intake. The shaded area represents the 95% confidence interval. P for overall association = 0.005; P for nonlinearity = 0.066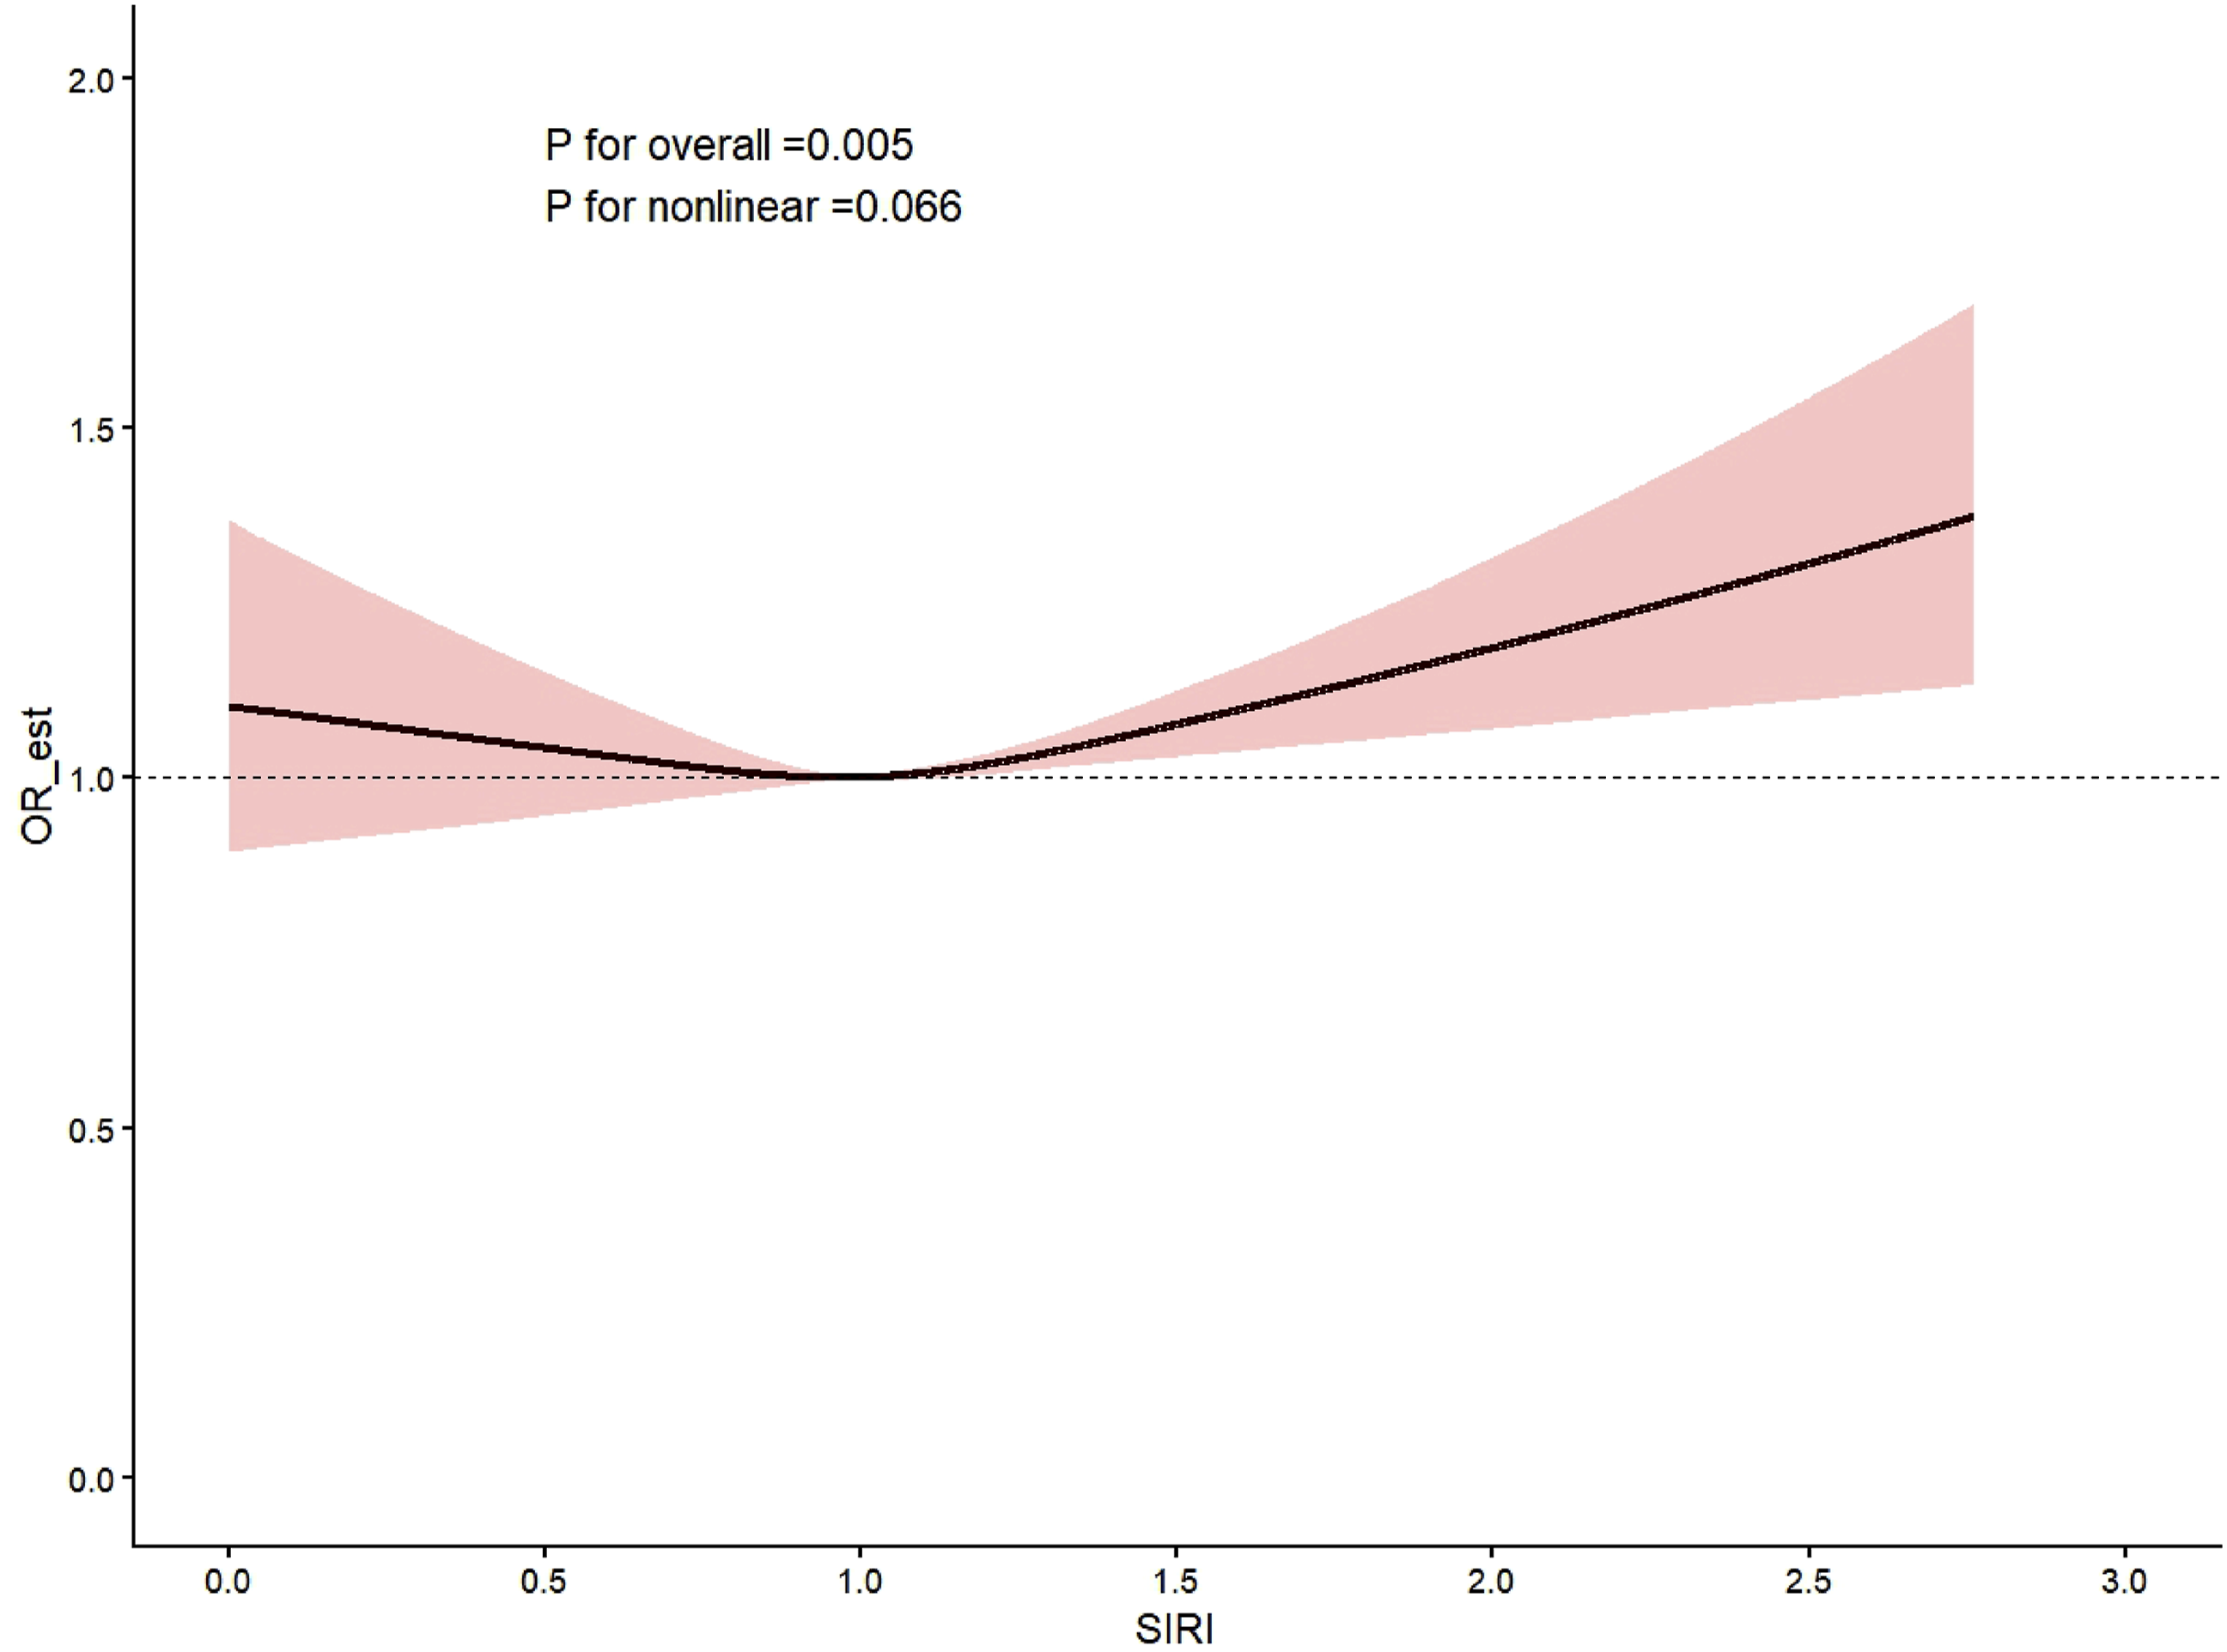
Subgroup and Interaction Analyses
Stratified analyses revealed that the SIRI–depressive symptoms association was not statistically significant in most individual subgroups, likely reflecting reduced statistical power after stratification and additional covariate adjustment. When stratified by sex, the odds ratios were 1.13 (95% CI: 0.84-1.51, P = 0.420) in males and 1.00 (95% CI: 0.76-1.31, P = 0.978) in females, with no significant interaction (P for interaction = 0.503) (Figure 3). Subgroup analyses of the association between SIRI and depressive symptoms. Forest plot displaying odds ratios and 95% confidence intervals for the association between systemic inflammatory response index (per unit increase) and depressive symptoms across predefined subgroups, including sex, race/ethnicity, poverty-income ratio, smoking status, and alcohol consumption. P-values for interaction are presented for each stratification variable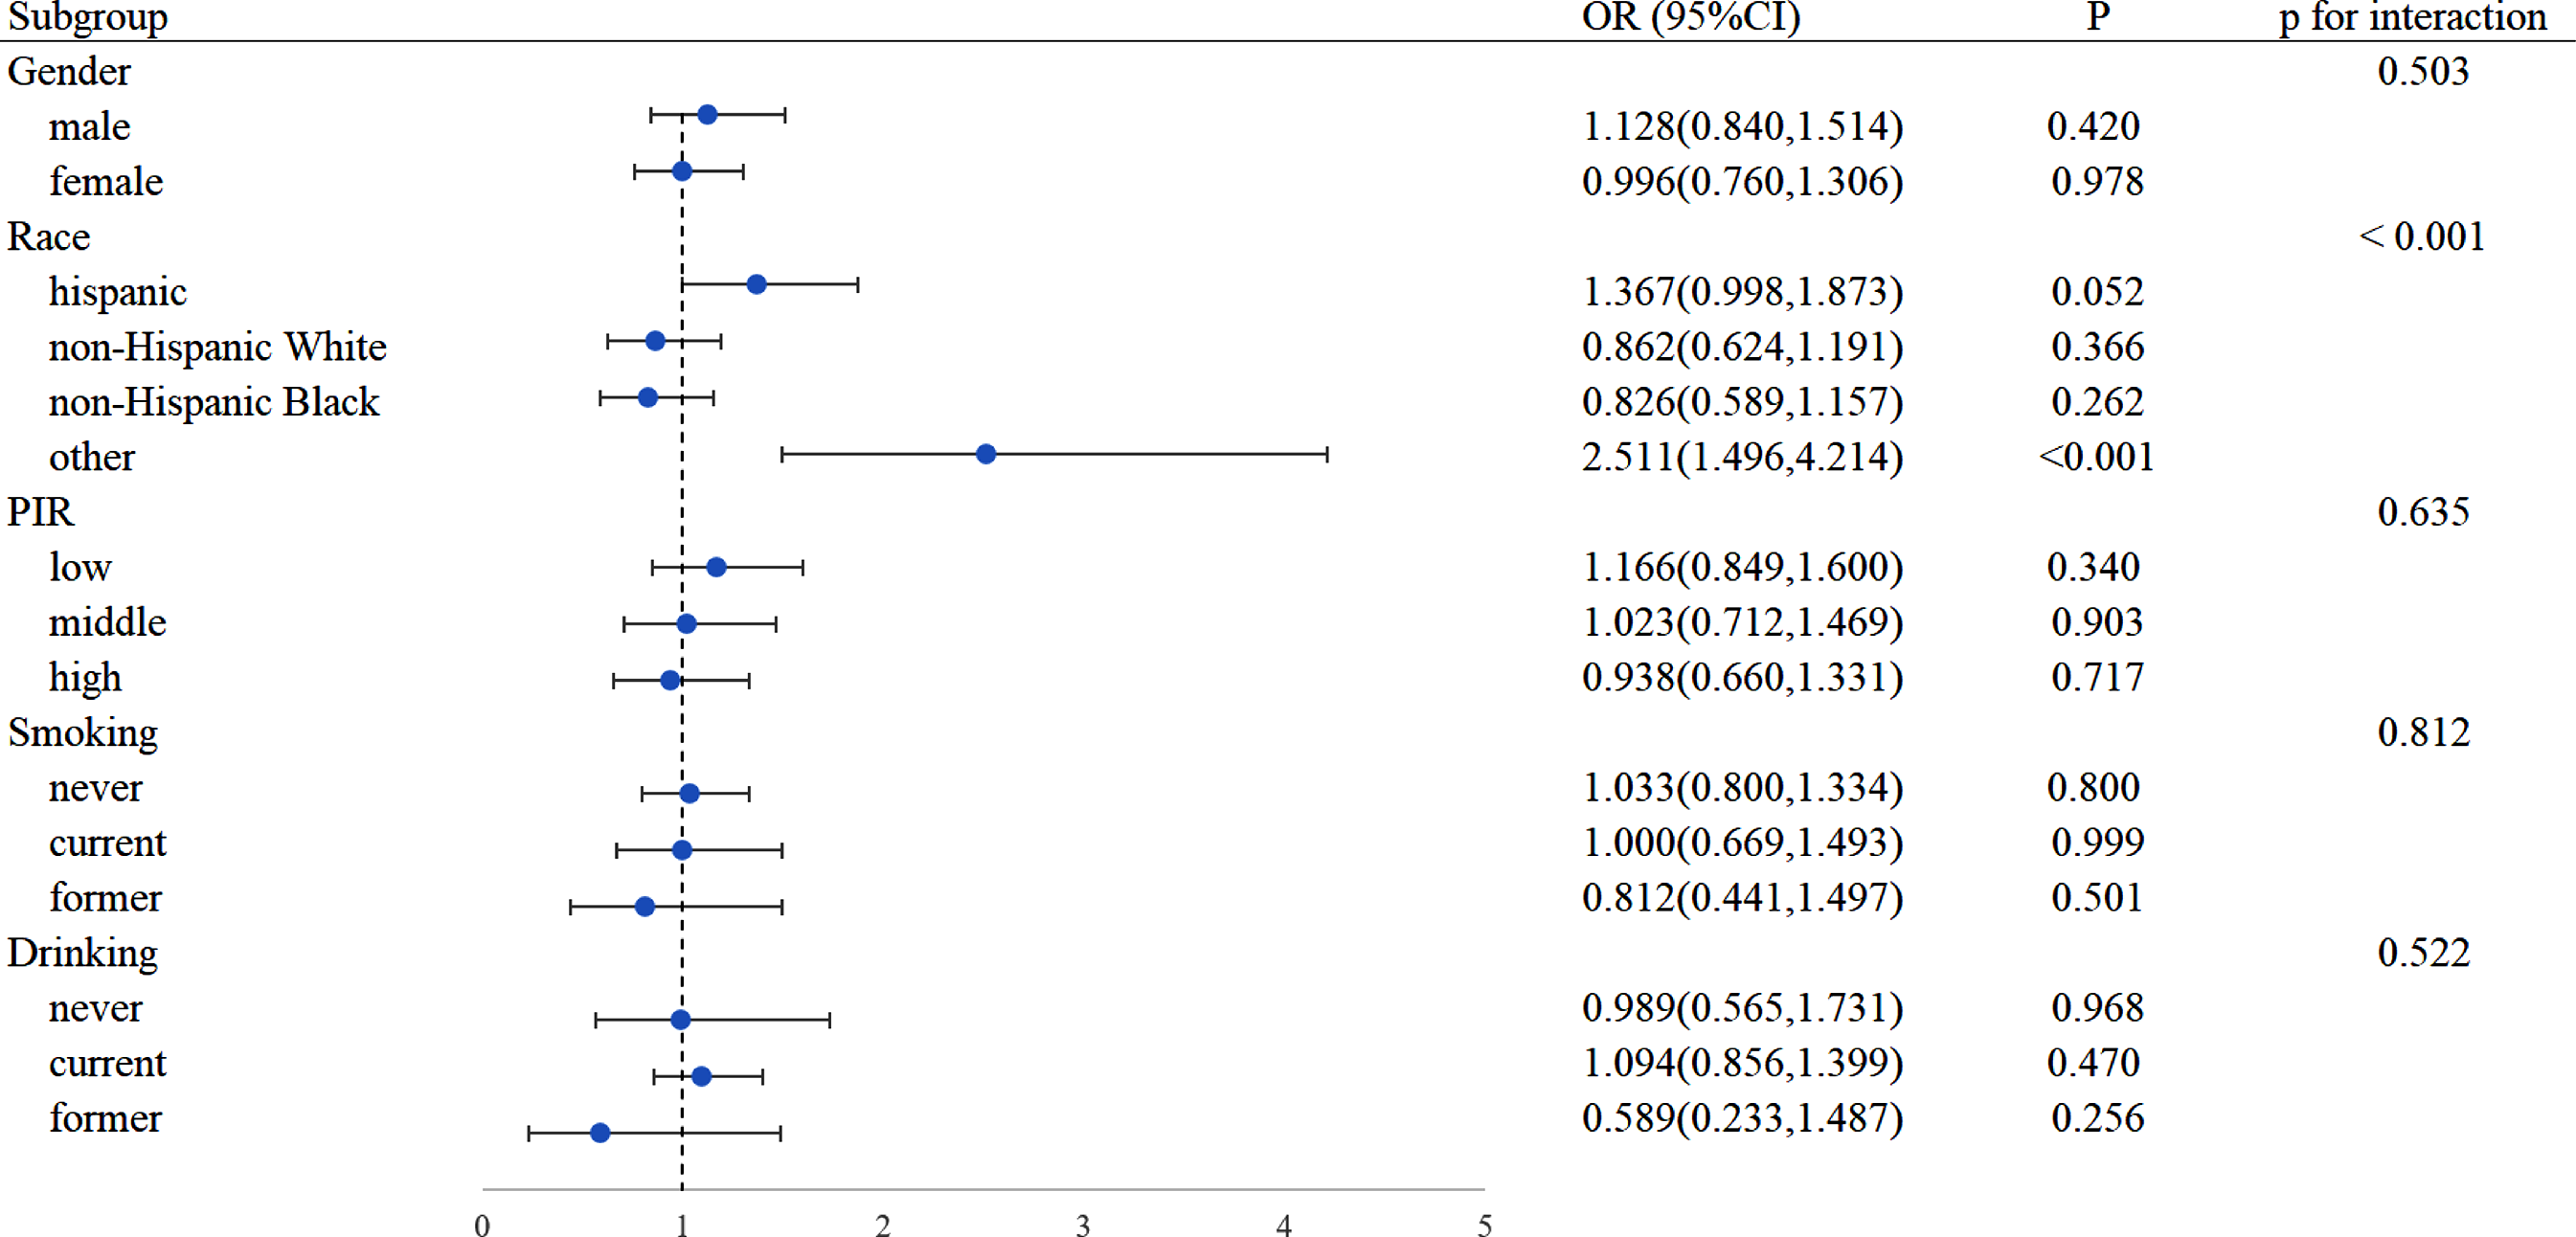
Racial/ethnic stratification revealed a significant interaction effect (P for interaction <0.001). The association was most pronounced in the Other race/ethnicity category (OR = 2.51, 95% CI: 1.50-4.21, P < 0.001), whereas Hispanic (OR = 1.37, 95% CI: 1.00-1.87, P = 0.052), Non-Hispanic White (OR = 0.86, 95% CI: 0.62-1.19, P = 0.366), and Non-Hispanic Black (OR = 0.83, 95% CI: 0.59-1.16, P = 0.262) subgroups did not show statistically significant associations. The heterogeneous “Other” category—which included Asian, American Indian/Alaska Native, Native Hawaiian/Other Pacific Islander, and multiracial individuals—should be interpreted with caution given its compositional diversity and relatively small sample size. Stratification by PIR categories demonstrated non-significant associations across low (OR = 1.17, 95% CI: 0.85-1.60, P = 0.340), middle (OR = 1.02, 95% CI: 0.71-1.47, P = 0.903), and high (OR = 0.94, 95% CI: 0.66-1.33, P = 0.717) income levels, without evidence of interaction (P for interaction = 0.635) (Figure 3).
Regarding health-related behaviors, the SIRI–depressive symptoms association was not statistically significant across smoking status categories: never smokers (OR = 1.03, 95% CI: 0.80-1.33, P = 0.800), current smokers (OR = 1.00, 95% CI: 0.67-1.49, P = 0.999), and former smokers (OR = 0.81, 95% CI: 0.44-1.50, P = 0.501), with no significant interaction (P for interaction = 0.812). Similarly, alcohol consumption status did not modify the association: never drinkers (OR = 0.99, 95% CI: 0.57-1.73, P = 0.968), current drinkers (OR = 1.09, 95% CI: 0.86-1.40, P = 0.470), and former drinkers (OR = 0.59, 95% CI: 0.23-1.49, P = 0.256), with no evidence of interaction (P for interaction = 0.522) (Figure 3).
Exploratory Mediation Analysis
The total effect of SIRI on depressive symptoms was statistically significant (β = 0.146, P < 0.001), indicating a positive overall association. The direct effect of SIRI on depressive symptoms, independent of sleep duration, remained robust (β = 0.155, P < 0.001). Notably, the indirect effect through sleep duration was negative and statistically significant (β = −0.009, P < 0.001). This negative indirect effect suggests a suppression phenomenon, wherein sleep duration may act as a suppressor variable rather than a traditional mediator. The proportion of the total effect accounted for by the indirect pathway was 6.2% (Figure 4). However, given the cross-sectional study design, the temporal ordering among SIRI, sleep duration, and depressive symptoms cannot be established; these findings therefore represent exploratory indirect associations that require confirmation through prospective longitudinal studies. Mediation analysis diagram. The diagram illustrates the indirect role of sleep duration in the relationship between systemic inflammatory response index and depressive symptoms. β coefficients represent the standardized regression coefficients; βTotal = total effect, βDirect = direct effect, βIndirect = indirect effect mediated through sleep duration, with the proportion mediated expressed as a percentage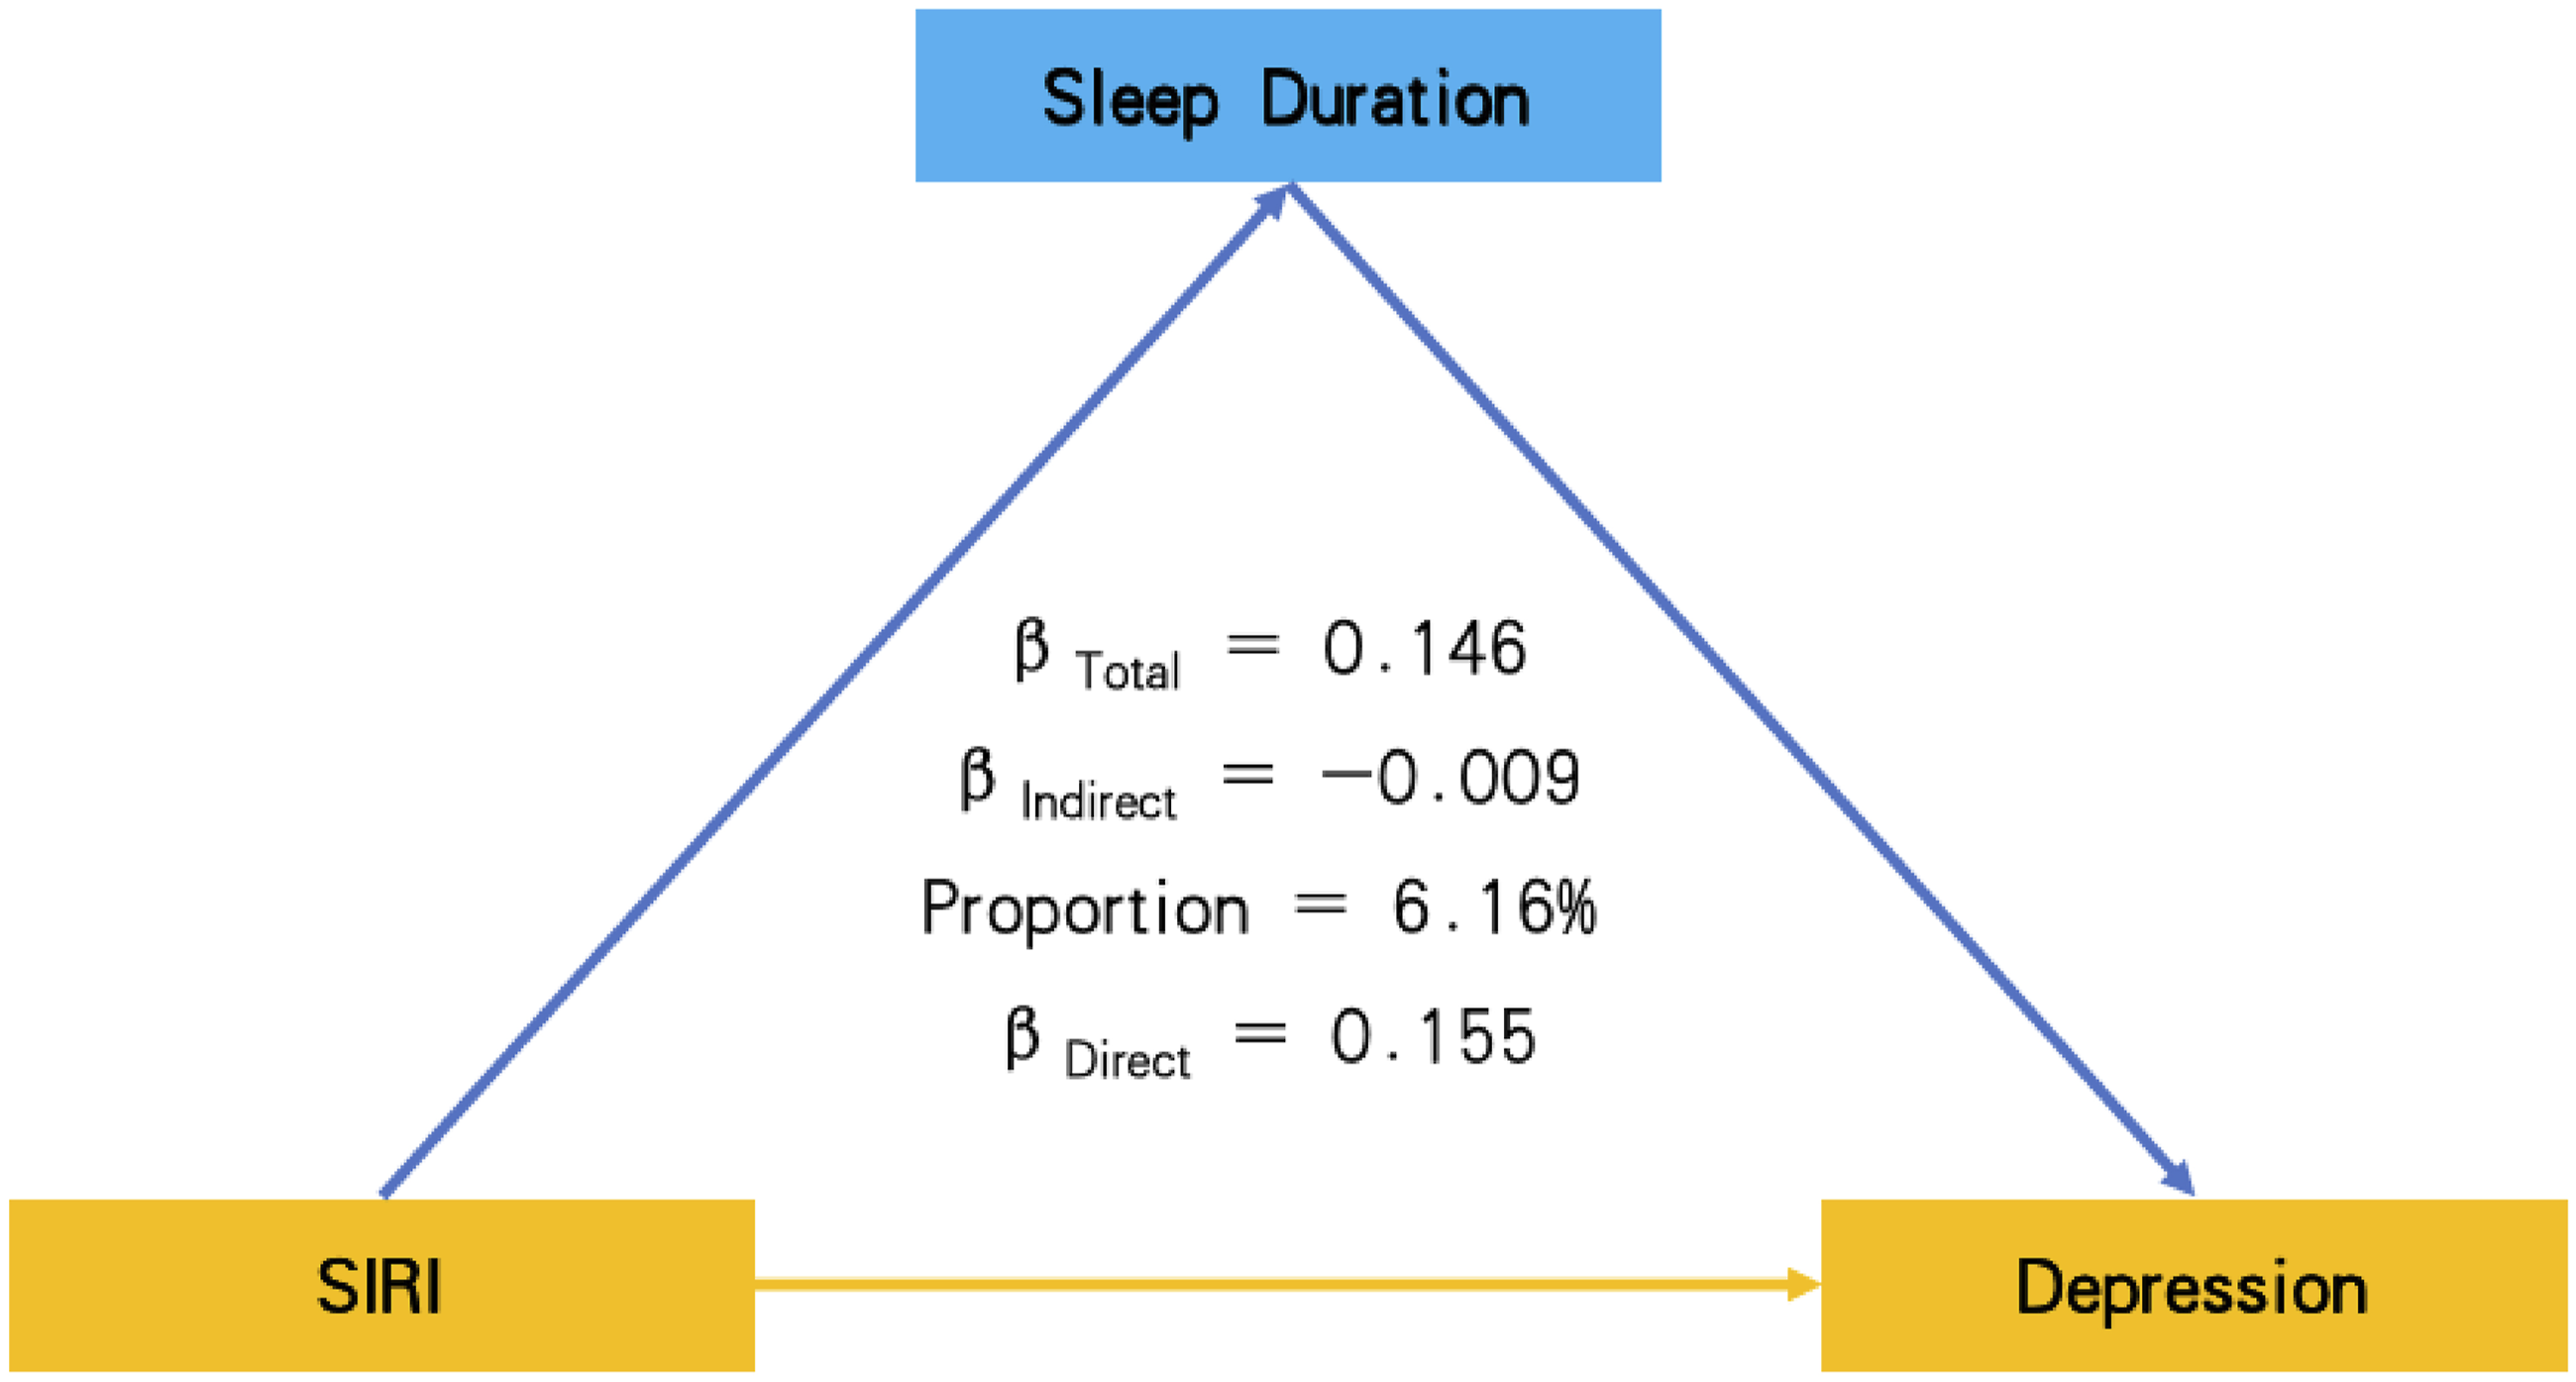
Sensitivity Analyses
Sensitivity Analysis Using PHQ-9 Cutoff ≥8 for Defining Depressive Symptoms
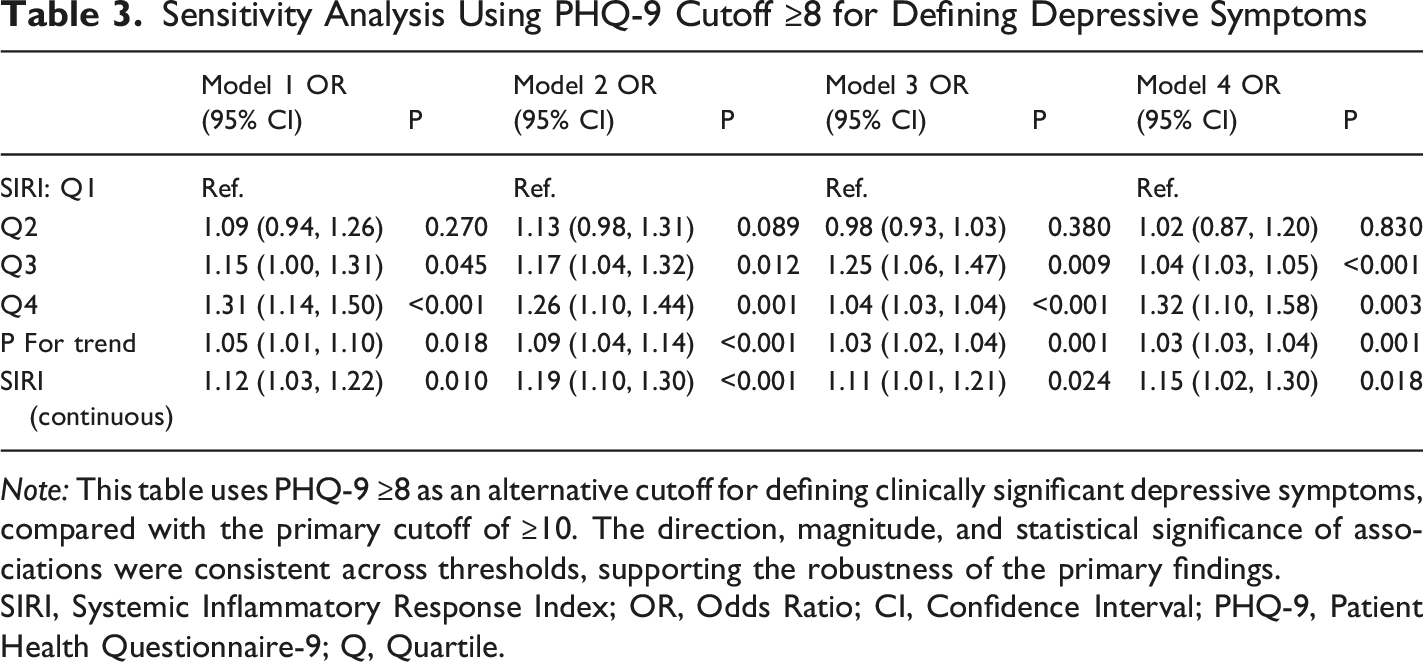
Note: This table uses PHQ-9 ≥8 as an alternative cutoff for defining clinically significant depressive symptoms, compared with the primary cutoff of ≥10. The direction, magnitude, and statistical significance of associations were consistent across thresholds, supporting the robustness of the primary findings.
SIRI, Systemic Inflammatory Response Index; OR, Odds Ratio; CI, Confidence Interval; PHQ-9, Patient Health Questionnaire-9; Q, Quartile.
Sensitivity Analysis Using PHQ-9 Cutoff ≥12 for Defining Depressive Symptoms
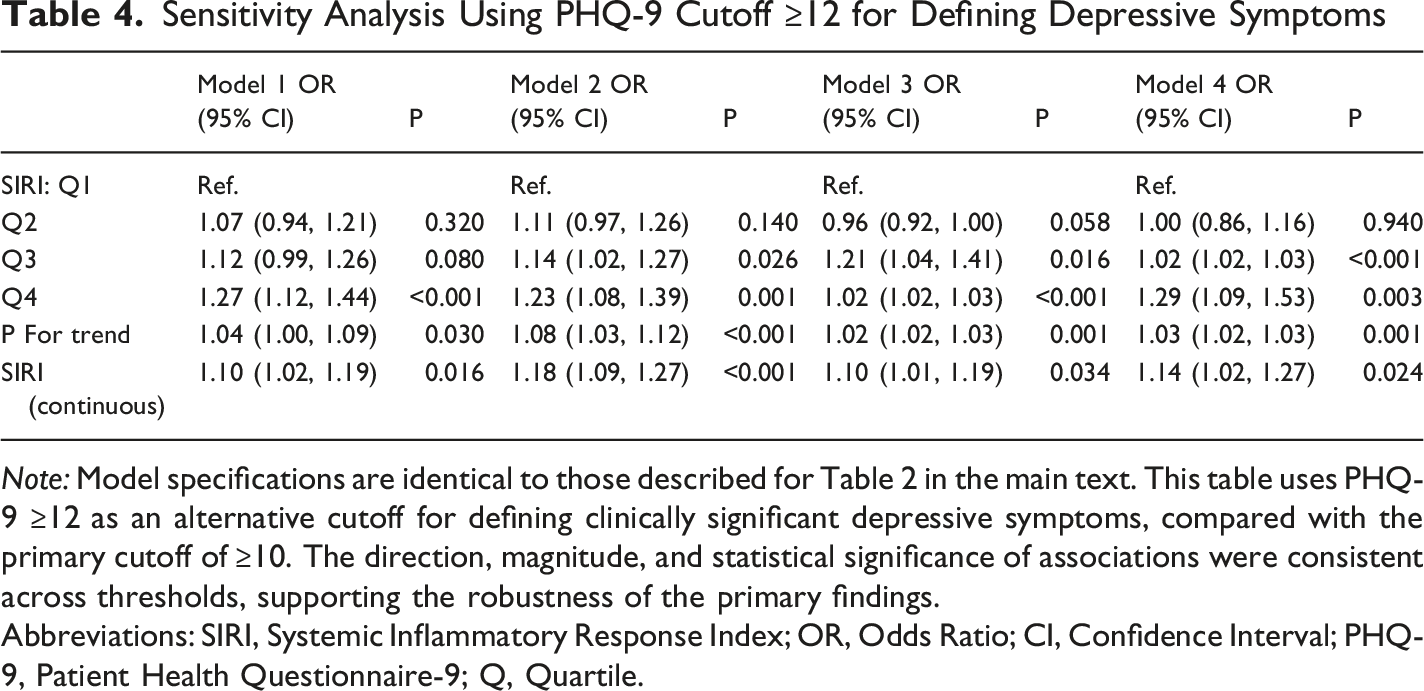
Note: Model specifications are identical to those described for Table 2 in the main text. This table uses PHQ-9 ≥12 as an alternative cutoff for defining clinically significant depressive symptoms, compared with the primary cutoff of ≥10. The direction, magnitude, and statistical significance of associations were consistent across thresholds, supporting the robustness of the primary findings.
Abbreviations: SIRI, Systemic Inflammatory Response Index; OR, Odds Ratio; CI, Confidence Interval; PHQ-9, Patient Health Questionnaire-9; Q, Quartile.
Associations Between Alternative Inflammatory Markers and Depressive Symptoms (PHQ-9 ≥10) in Fully Adjusted Models
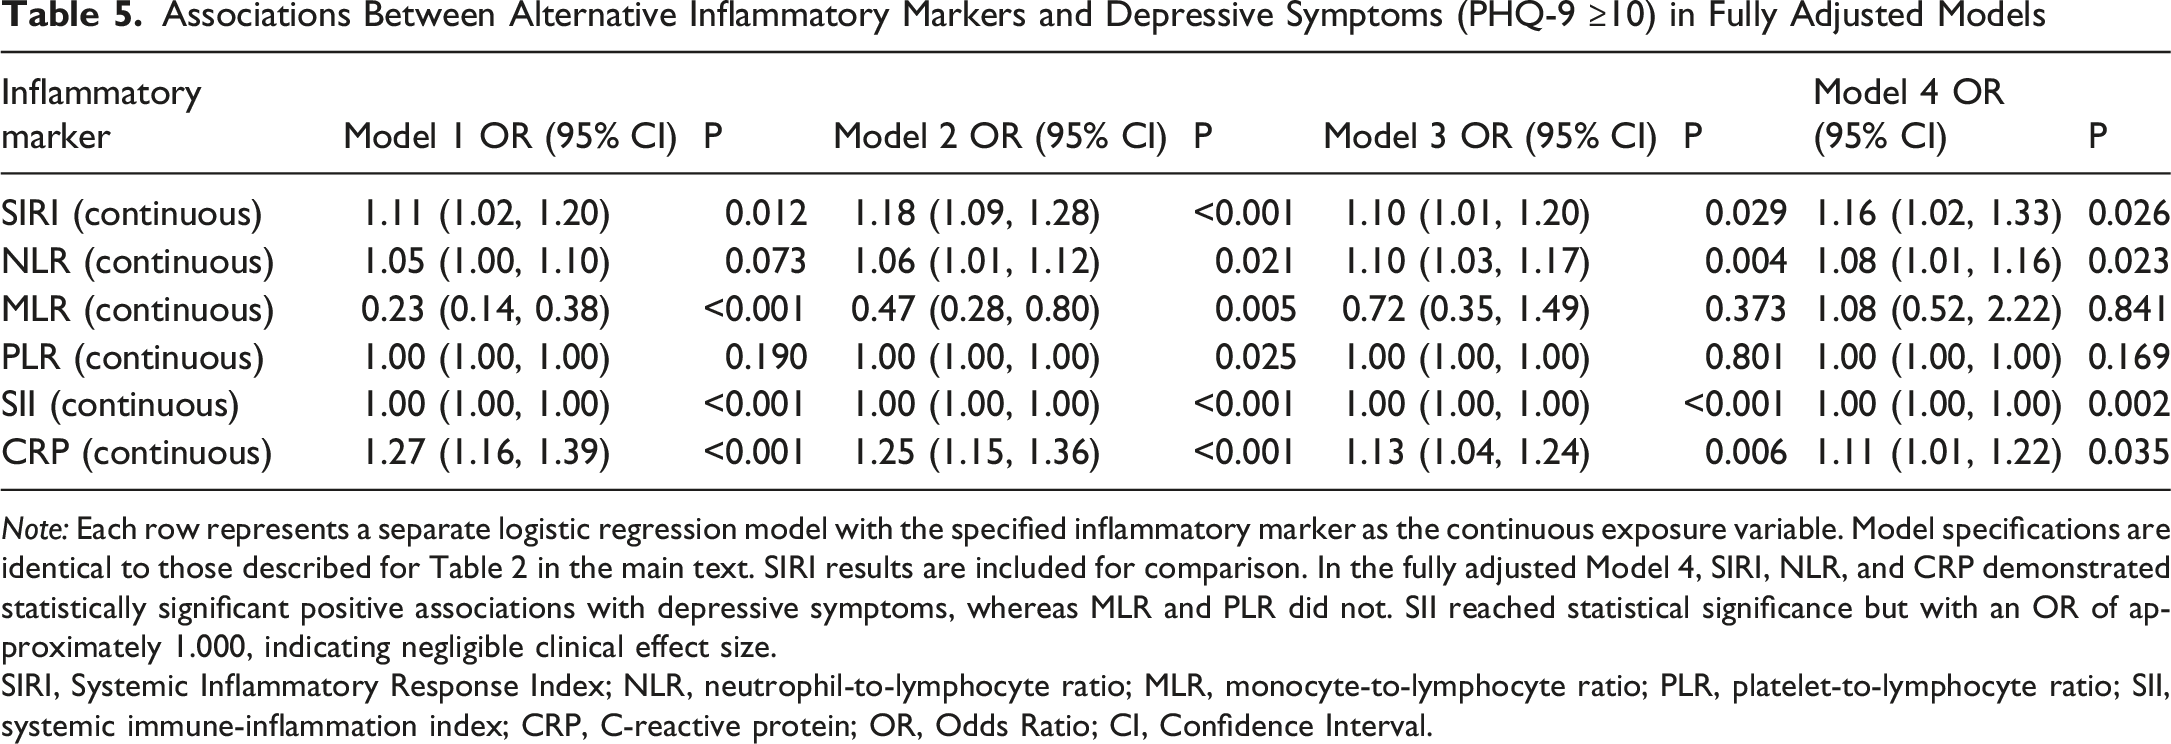
Note: Each row represents a separate logistic regression model with the specified inflammatory marker as the continuous exposure variable. Model specifications are identical to those described for Table 2 in the main text. SIRI results are included for comparison. In the fully adjusted Model 4, SIRI, NLR, and CRP demonstrated statistically significant positive associations with depressive symptoms, whereas MLR and PLR did not. SII reached statistical significance but with an OR of approximately 1.000, indicating negligible clinical effect size.
SIRI, Systemic Inflammatory Response Index; NLR, neutrophil-to-lymphocyte ratio; MLR, monocyte-to-lymphocyte ratio; PLR, platelet-to-lymphocyte ratio; SII, systemic immune-inflammation index; CRP, C-reactive protein; OR, Odds Ratio; CI, Confidence Interval.
Discussion
The present study examined the association between SIRI and depressive symptoms among emerging adults aged 18-25 years using a nationally representative sample from NHANES 2005-2023. After adjusting for an extensive set of potential confounders including chronic medical conditions, physical activity, psychotropic medication use, and dietary quality, elevated SIRI levels were significantly associated with increased odds of depressive symptoms. Specifically, participants in the highest SIRI quartile demonstrated a 33% increase in the odds of depressive symptoms compared to those in the lowest quartile. RCS analysis revealed no significant nonlinearity in this relationship. Exploratory mediation analysis identified a modest yet statistically significant negative indirect effect of sleep duration in the SIRI-depressive symptoms relationship, accounting for approximately 6.2% of the total effect. These findings suggest a complex interplay between systemic inflammation, sleep, and mental health in emerging adults.
The positive association between SIRI and depressive symptoms observed in the current study aligns with mounting evidence implicating systemic inflammation in the pathophysiology of depressive disorders.19,20 SIRI, calculated from neutrophil, monocyte, and lymphocyte counts, represents a composite inflammatory marker that may more comprehensively reflect systemic inflammatory status compared to single-cell measurements.10,21 Recent studies have demonstrated that SIRI predicts treatment response and clinical outcomes in patients with treatment-resistant bipolar depression, 22 and exhibits significant associations with major depressive disorder and suicide attempts. 11 The present findings extend this literature by establishing the relevance of SIRI in a large community-dwelling sample of emerging adults, a population facing unprecedented rates of mental health challenges.3,23 Importantly, our sensitivity analyses demonstrated that both NLR and CRP also showed significant associations with depressive symptoms in fully adjusted models, suggesting that the observed association reflects a broader inflammatory signal rather than an artifact specific to SIRI. The biological plausibility of the inflammation-depressive symptoms association is supported by well-established mechanisms linking peripheral inflammation to central nervous system dysfunction. Pro-inflammatory cytokines, including interleukin-1β (IL-1β), interleukin-6 (IL-6), and tumor necrosis factor-α (TNF-α), can cross the blood-brain barrier and activate neuroinflammatory cascades involving microglial activation and astrocyte dysfunction.8,24 These processes disrupt monoaminergic neurotransmission, impair neuroplasticity through reduced brain-derived neurotrophic factor (BDNF) expression, dysregulate the hypothalamic-pituitary-adrenal (HPA) axis, and promote glutamate-mediated excitotoxicity—all recognized contributors to depressive symptomatology.25,26 The differential representation of immune cell populations captured by SIRI may reflect a balance between pro-inflammatory (neutrophils and monocytes) and anti-inflammatory (lymphocytes) responses, providing insight into the net inflammatory burden experienced by individuals with depressive symptoms. 27
The exploratory mediation analysis revealed a negative indirect effect (β = −0.009) of sleep duration in the SIRI-depressive symptoms relationship, suggesting a suppression phenomenon rather than traditional mediation. This finding indicates that sleep duration partially counteracts, rather than amplifies, the direct inflammatory effect on depressive symptoms. Several interpretations warrant consideration. First, the bidirectional relationship between sleep and inflammation is well-documented. While inflammatory cytokines such as IL-1β and TNF-α promote sleep, particularly non-rapid eye movement (NREM) sleep, chronic inflammation may paradoxically alter sleep architecture without necessarily reducing total sleep duration.13,28 Emerging adults with elevated SIRI may experience compensatory increases in sleep duration as a homeostatic response to inflammatory burden, which could partially offset inflammation-induced depressive symptoms through restorative processes.29,30 However, the modest magnitude of this suppressive effect (6.2% of total effect) suggests that such compensation is incomplete and insufficient to fully counterbalance the direct pro-depressive effects of systemic inflammation. Second, the atypical subtype of depression, which is characterized by hypersomnia, increased appetite, and mood reactivity, has been specifically linked to elevated systemic inflammation and metabolic dysregulation. 31 Atypical depression is prevalent among younger adults and may disproportionately contribute to the observed negative indirect effect: individuals with inflammation-driven depressive symptoms of the atypical subtype may sleep longer as a core symptom feature, creating a statistical pathway through which higher SIRI is associated with longer sleep, which in turn is associated with reduced depressive symptom scores in other domains. Because the PHQ-9 cannot distinguish between depressive subtypes, this possibility could not be directly tested. Third, alternative statistical explanations should also be acknowledged, including measurement artifacts and potential collider bias introduced by conditioning on a variable (sleep duration) that may be independently influenced by both the exposure and the outcome. 32 The relationship between sleep duration and depressive symptoms is notably complex and potentially U-shaped, with both insufficient and excessive sleep associated with increased risk of depressive symptoms.12,33 Cross-sectional designs cannot disentangle whether longer sleep duration represents an adaptive response, a manifestation of depression itself, or a marker of poor sleep quality despite adequate quantity. Furthermore, self-reported sleep duration may not capture sleep quality, fragmentation, or circadian misalignment, factors that substantially influence both inflammatory profiles and mental health outcomes. 34
It is noteworthy that the prevalence of depressive symptoms did not differ significantly across SIRI quartiles in the unadjusted descriptive analysis (P = 0.117), whereas the multivariable regression models demonstrated a significant dose-response relationship. This pattern is consistent with confounding masking, wherein unadjusted comparisons may obscure true associations due to the opposing effects of unmeasured or unadjusted confounders. For example, Non-Hispanic Black participants, who comprised a substantially larger proportion of Q1 (41.8%) than Q4 (14.5%), showed a distinct depression-inflammation profile that may have attenuated the crude between-group differences. The emergence of the SIRI-depressive symptoms association after appropriate covariate adjustment is methodologically expected in observational epidemiological studies.
Stratified analyses, conducted after adjustment for the expanded covariate set, revealed that the SIRI-depressive symptoms association was not statistically significant in most individual subgroups. A significant interaction by race/ethnicity was observed (P for interaction < 0.001), with the strongest association in the “Other” category (OR = 2.51). Given that this heterogeneous category includes Asian, American Indian/Alaska Native, Native Hawaiian/Other Pacific Islander, and multiracial individuals, and the relatively small subgroup sample size, these findings should be interpreted with caution and require replication in studies with adequately powered racial/ethnic subgroup analyses. The absence of significant associations within other strata likely reflects reduced statistical power after stratification rather than a true absence of effect, as the direction of association remained positive in most subgroups and the overall interaction tests for sex, PIR, smoking, and alcohol consumption were non-significant.
The effect size observed in this study warrants careful contextualization. The fully adjusted OR of 1.16 per unit increase in SIRI represents a modest association at the individual level, and SIRI should not be considered a standalone screening tool for depression. However, at the population level, even small effect sizes can have meaningful public health implications when applied to highly prevalent conditions. The identification of SIRI as a readily obtainable blood-based marker associated with depressive symptoms in emerging adults suggests potential applications as a supplementary risk indicator in clinical settings. Given that routine complete blood counts are widely available in primary care and student health settings, SIRI could serve as an adjunctive signal to prompt further mental health inquiry when elevated values are incidentally detected, though it cannot replace standardized screening instruments such as the PHQ-9. For mental health professionals, these findings reinforce the growing recognition that systemic inflammation contributes to depressive symptomatology in young adults and may inform decisions about integrating anti-inflammatory lifestyle counseling, including sleep hygiene, regular physical activity, and dietary optimization, into comprehensive treatment plans.
Study Limitations
Several limitations warrant acknowledgment. First, the cross-sectional design precludes determination of temporal sequences or causal relationships between SIRI, sleep duration, and depressive symptoms. Depressive symptoms themselves may influence inflammatory markers and sleep patterns, creating potential reverse causation. The exploratory mediation analysis should therefore be interpreted as identifying indirect statistical associations rather than establishing causal pathways. Second, sleep duration was assessed via single-item self-report, which lacks the granularity of objective measures such as actigraphy or polysomnography and provides no information regarding sleep quality, architecture, or circadian alignment. 13 Third, SIRI calculations relied on single blood samples, which may be influenced by acute infections, medications, or diurnal variations in immune cell populations. Although sensitivity analyses using alternative inflammatory markers (NLR, CRP) yielded consistent results, SIRI and other CBC-derived indices do not capture the full spectrum of systemic inflammation assessed by direct cytokine measurements. Fourth, although the fully adjusted model controlled for an expanded set of confounders including chronic medical conditions, physical activity, psychotropic medication use, and dietary quality, unmeasured variables such as childhood trauma, illicit drug use (eg, marijuana, cocaine, and synthetic opioids such as fentanyl), family history of psychiatric disorders, and ongoing psychotherapy or psychosocial interventions may introduce residual confounding. The study spanned approximately 20 years (2005 to 2023), during which the availability of illicit substances, prescribing patterns for stimulants, benzodiazepines, and antidepressants, and social determinants of mental health have changed substantially; these secular trends were not modeled. Fifth, a large proportion of the initial sample (47,568 participants) was excluded due to missing PHQ-9 data. This missingness largely reflects the NHANES design, in which the PHQ-9 is administered only at the Mobile Examination Center (MEC) and not to all interviewed participants. Nevertheless, systematic differences between included and excluded individuals cannot be ruled out, potentially limiting the generalizability of the findings. Sixth, the PHQ-9 is a screening instrument for symptom severity rather than a diagnostic tool; the use of a ≥10 cutoff identifies probable depression but may include false positives and miss subthreshold cases. Sensitivity analyses using alternative cutoffs (≥8 and ≥12) produced consistent results, partially mitigating this concern. Finally, the sample comprised exclusively United States residents aged 18-25 years, potentially limiting generalizability to other populations or cultural contexts.
Conclusions
Among emerging adults aged 18-25 years, elevated SIRI levels were significantly associated with increased odds of depressive symptoms, with sleep duration playing a modest yet statistically significant suppressor role in this relationship. Sensitivity analyses using alternative PHQ-9 cutoffs and inflammatory markers supported the robustness of the primary findings. These findings suggest that systemic inflammation represents a potentially important biological correlate of depressive symptoms in young adults, while the complex interplay with sleep patterns warrants further investigation. From a clinical perspective, SIRI, which is readily calculable from routine complete blood count data, may serve as a supplementary indicator to prompt further mental health assessment in primary care and student health settings, though it should not replace standardized depression screening tools. For mental health professionals, these results support the integration of anti-inflammatory lifestyle interventions, including promotion of healthy sleep habits, physical activity, and dietary quality, as adjuncts to standard treatment approaches. Prospective longitudinal investigations incorporating objective sleep assessments and repeated inflammatory measurements are essential to establish temporal relationships, elucidate underlying mechanisms, and inform targeted prevention and treatment strategies for improving mental health outcomes in this vulnerable population.
Footnotes

Author Contributions
Yunyun Zheng and Yuting Zhang carried out the studies, participated in collecting data, and drafted the manuscript. Yingying Zhang and Chao Chen performed the statistical analysis and participated in its design. Wangtao Meng and Yingying Zhang participated in acquisition, analysis, or interpretation of data and draft the manuscript. All authors read and approved the final manuscript.
Funding
The authors received no financial support for the research, authorship, and/or publication of this article.
Declaration of Conflicting Interests
The authors declared no potential conflicts of interest with respect to the research, authorship, and/or publication of this article.
Data Availability Statement
All data generated or analysed during this study are included in this published article.