






Abstract
The stability hypothesis of Gottfredson and Hirschi’s general theory of crime has received limited support in the literature. However, recent research on the dimensions of self-control suggests varied developmental trends that may conflate the idea of stability. Using a sample of more than 300 individuals from the northeastern United States, this study examines the stability hypothesis across early adulthood and expands the current literature by considering the early childhood risk factors that may distinguish between longitudinal trajectories of self-control. Finally, a reduced, multidimensional version of the behavior problem index for measuring self-control is introduced. Results show evidence of relative stability in three dimensions of self-control, and that sex predicts trajectory group membership. Theoretical implications are discussed.
Gottfredson and Hirschi (1990) presented their general theory of crime, purported to explain all crimes, at all times, among all persons, and across all cultures. Crime, to Gottfredson and Hirschi, constitutes “acts of force or fraud undertaken in pursuit of self-interest” (p. 14). They argue that most crime is impulsive, requiring little skill or forethought, and provides little monetary gain to the offender or harm to his victim. Therefore, people who engage in crime should exhibit the traits of impulsivity, lack of long-term focus, disregard for the well-being of others, and affinity for simple tasks. Gottfredson and Hirschi predict that criminal offenders will also engage in analogous behaviors that are maladaptive and antisocial, such as smoking and unprotected sex, and will be more likely to divorce or be unemployed.
To Gottfredson and Hirschi, self-control is primarily a function of parental socialization. Parents who can recognize, monitor, and appropriately discipline their child’s misconduct early in life will raise children with adequate self-control. Children whose parents fail to do so will not develop appropriate behavioral restraint, resulting in low self-control. While prominence is given to parents for instilling self-control, alternative sources such as school and churches—those institutions taking the place of parents in their absence—are viewed as capable of facilitating the development of self-control (see Turner, Piquero, & Pratt, 2005).
Borrowing from the earlier work of Patterson (1982), Gottfredson and Hirschi argue that the socialization process takes place in childhood and, therefore, by adolescence self-control is essentially stable. In large part, self-control will be mostly impervious to change beyond childhood. This stability hypothesis of Gottfredson and Hirschi’s theory can be misconceived and should be clarified. The theorists do not argue for absolute stability (individuals can gain or in some cases lose self-control over time), but they do contend for relative stability. Gottfredson and Hirschi (1990) asserted that “people differ in the likelihood that they will commit crimes and that these differences appear early and remain stable over much of the life course” (p. 108). Those with the highest self-control will at all times have higher self-control than their peers and those with the lowest will always have lower self-control than the rest. As discussed below, the research on the stability hypothesis provides considerable support; however, evidence suggests that a sizable group of individuals do in fact make significant gains and losses in self-control relative to their peers across adolescence (e.g., see Hay & Forrest, 2006; Turner & Piquero, 2002).
Research on the Stability Hypothesis
Our understanding of self-control stability has matured alongside advancements in statistical techniques. Arneklev, Cochran, and Gainey (1998) were the first to empirically assess the viability of the stability hypothesis with a sample of college students at three universities. Focusing on individual differences, Arneklev and colleagues showed that most individuals varied only slightly on their self-control rating across the semester. Furthermore, results of a hierarchical linear modeling analysis indicated significant mean differences in self-control but no evidence of within-individual changes in self-control across the semester; taken as support for the stability hypothesis. 1
Subsequent endeavors have attempted to improve upon many of the weaknesses of this initial effort by comparing researcher-induced groupings of delinquent and non-delinquent youth on self-control across a limited time frame. These studies show a modest correlation across waves, regardless of group, but find that delinquent youth exhibit lower self-control relative to non-delinquents at all time periods (Turner & Piquero, 2002; Winfree, Taylor, He, & Esbensen, 2006; Yun & Walsh, 2011). The conclusions drawn from these analyses are limited by the inability to follow youth from early childhood and beyond their teenage years as well as by looking at distinct groups rather than within-individual patterns of change in self-control. Current assessments of self-control stability rely upon group-based trajectory modeling, which permits the parceling of unique subgroups of persons who follow a similar pattern of self-control over time vis-à-vis other subgroups of persons who follow different patterns. These endeavors tend to show less evidence of stability when compared with earlier studies (Burt, Sweeten, & Simons, 2014; Hay & Forrest, 2006; Higgins, Jennings, Tewksbury, & Gibson, 2009; Jennings, Higgins, Akers, Khey, & Dobrow, 2013; Jo & Zhang, 2012; Na & Paternoster, 2012; Ray, Jones, Loughran, & Jennings, 2013). Although absolute stability appears to be the norm across these studies, sizable groups of individuals have been shown to gain or lose self-control over time, relative to their stable counterparts.
An important advancement in this line of research comes from the understanding that the overall self-control concept contains multiple underlying constructs that likely follow unique developmental trajectories. For example, while impulsivity drops off dramatically across childhood risk-seeking behavior follows an adolescence-limited trajectory for many individuals (Burt et al., 2014; Steinberg et al., 2008). Likewise, while stability is the norm in aggressive and hyperactive behavior the research characterizes their development as a sharp decrease across childhood with a sizable minority of individuals exhibiting high levels of aggression and hyperactivity across the life course (Nagin & Tremblay, 1999; Piquero, Carriaga, Diamond, Kazemian, & Farrington, 2012; Tremblay et al., 1999). Continuing to document these distinct trajectories and assessing their causes is of utmost importance to understanding the developmental landscape of a key correlate for criminal behavior.
Much of the research on the determinants and stability of self-control, however, has not considered a wider range of potential determinants (aside from parental socialization) that have been identified across disciplines to also influence human development and behavior. In the next section, specific attention is turned toward the influence of various early childhood risk factors as potential determinants of self-control.
Early Childhood Risk Factors for Low Self-Control
Prenatal and Perinatal Complications Leading to Neurological Deficits
Prenatal complications have been shown to predict chronic criminal behavior (McGloin, Pratt, & Piquero, 2006; Raine, Brennan, & Mednick, 1994; Tibbetts & Piquero, 1999). Beaver and Wright (2005) tested the influence of birth complications, such as premature birth, respiration problems, and meconium aspiration syndrome (the ingestion of feces in utero), on the General Theory’s explanation of self-control development. They found that premature birth and anoxia (restriction of oxygen supply to the fetus) were predictive of composite reports (teacher and parent combined) of low self-control in kindergarten. The effects of these complications were also found in the parental reports of low self-control, while the influence of premature birth was not replicated in the teacher reports. The remaining birth complications had varying effects based upon reporting source. In a recent analysis, Ratchford and Beaver (2009) assessed the influence that birth complications and low birth weight have on an individual’s self-control. They failed to find an effect of these factors on low self-control, although, these results are in need of replication. With regard to the dimensions of self-control, Huijbregts, Sequin, Zoccolillo, Bolvin, and Tremblay (2007) showed prenatal maternal smoking (which has been implicated in delinquent behavior: Gibson, Piquero, & Tibbetts, 2000; McGloin et al., 2006; Pratt, McGloin, & Fearn, 2006) to be predictive of high physical aggression and the dimensions of hyperactivity and impulsivity in childhood. Likewise, minor physical abnormalities at birth have been linked to attention problems, aggression, and impulsivity at age 3 and age 7 (Waldrop, Bell, McLaughlin, & Halverson, 1978).
As noted earlier, Gottfredson and Hirschi largely do not explicate a role for biological processes to influence the development of self-control. However, emerging evidence substantiates the role of neurological deficits in leading to an individual’s lower self-control. Research in cognitive neuroscience has shown that self-control processes are guided by the prefrontal cortex and constitute “executive functions” allowing for purposeful, planned, and goal-oriented behavior (Miller & Cohen, 2001; Posner & Rothbart, 2007). Damage to this area has been linked to disinhibitory behavior (Blumer & Benson, 1975; Damasio, Grabowski, Frank, Galaburda, & Damasio, 1994), as well as attention regulation and planning problems (Barceló & Knight, 2002; Shallice & Burgess, 1991). Furthermore, these deficits have been shown to stem from prenatal health problems, toxin exposure, and delivery complications (Arseneault, Tremblay, Boulerice, & Saucier, 2002; Barkley, 1997; Coles et al., 1997; Grandjean et al., 1997) and have been linked to antisocial behavior in adolescence and adulthood (Arseneault et al., 2002; Cauffman, Steinberg, & Piquero, 2005; Moffitt, Lynam, & Silva, 1994; Raine et al., 1994, 1997).
In regard to Gottfredson and Hirschi’s conceptualization of low self-control specifically, a handful of empirical tests have assessed the influence of neurological deficits on self-control. Beaver and colleagues (2007) used measures of fine and gross motor skills to indicate neurological deficits in the prefrontal cortex and showed that having more deficits in these tasks predicted low self-control in kindergarten independent of parental and neighborhood effects. Ratchford and Beaver (2009) replicated these findings (using verbal test scores as an indicator of neuropsychological deficits) in a sample of youth followed over adolescence and young adulthood. Furthermore, they indicated that birth complications and low birth weight might work indirectly through neuropsychological deficits to influence self-control development. Their findings provide evidence that what Gottfredson and Hirschi assume to be a strictly social process may be better explained in reality as impairments in higher order cognitive functioning.
Poor Early Childhood Social Conditions
The immediate social environment represents Gottfredson and Hirschi’s traditional view of self-control development. In support of their theory, evidence has shown that parenting practices have an influence on low self-control (Cecil, Barker, Jaffee, & Viding, 2012; Pratt, Turner, & Piquero, 2004). Parental punishment (such as spanking and being told they are not loved) has been shown to have a positive effect on low self-control (Ratchford & Beaver, 2009). Meanwhile, Huijbregts and colleagues (2007) also found that a hostile reactive parenting style predicted high levels of aggression, hyperactivity, and impulsivity in childhood. At the same time, evidence suggests that maternal self-control may predict both her child’s self-control and her choice of parenting practices (Nofziger, 2008), and that the parenting effect overall is weak when controlling for genetic effects (Harris, 1998; Wright & Beaver, 2005; Wright, Beaver, DeLisi, & Vaughn, 2008) and prenatal complications (Beaver & Wright, 2005).
Beyond the household, neighborhood disadvantage has been shown to predict levels of self-control independent of neuropsychological deficits and parental socialization (Beaver et al., 2007; Pratt et al., 2004; cf. Gibson, Sullivan, Jones, & Piquero, 2010). The findings on early childhood social and neurological risk factors have strongly supported their relationship to self-control (Turner, Livecchi, Beaver, & Booth, 2011); however, analyses have yet to explore their relationship to developmental trajectories of self-control. Importantly, these early biological and social risk factors seem to interact to produce negative outcomes. Pre- and perinatal risk factors that affect cognitive development coupled with poor social conditions have been found to increase the likelihood of antisocial behavior (Arseneault et al., 2002; Raine et al., 1994; Tibbetts & Piquero, 1999).
Current Study
In sum, growing evidence suggests that tracking stability in self-control masks the various developmental trends of the concept’s underlying constructs. Furthermore, previous presentations of these trajectories have rarely assessed the influence that various risk factors may have on these developmental paths. The present analysis represents an attempt to assess the underlying dimensions of self-control present in the behavior problem index (BPI), analyze stability in early adulthood self-control dimensions, and isolate the influence of childhood risk factors on early adulthood self-control trajectories.
The present study uses group-based trajectory analysis to address two specific research questions concerning the stability of self-control.
In doing so, it presents a revised multidimensional measure of the BPI for measuring self-control.
Method
Data
To answer these questions, data for the present study were extracted from the last three waves of the Simmons Longitudinal Study (SLS; Reinherz, 2009). The SLS is a community-based sample of youth entering kindergarten in a single school district in the northeastern United States. The communities served by this school district were predominantly Caucasian, working-class households. Wave 1 was collected in 1977 just prior to the youth entering their kindergarten year at 5 years of age and Wave 2 was completed at the end of the youth’s kindergarten year. In third grade, when the youth averaged 9 years of age, Wave 3 of data collection took place. Waves 4 and 5 were collected when the youth were in high school: at 15 and 18 years of age on average. Waves 6 and 7 followed youths into adulthood, measuring a variety of life events and aspirations, psychosocial functioning and problem behavior at ages 21 and 26.
The original SLS sample included 777 youth entering kindergarten in 1977. Most attrition occurred at Wave 3 when approximately one third of youth transferred to private schools. Of the remaining 519 youth in Wave 3, 403 were followed in subsequent waves. Analysis conducted by the SLS research team suggested that the post-attrition sample remained representative of the community from which it was drawn and did not vary in any substantive way from non-participants on factors predictive of life outcomes (the original purpose of the study; Reinherz, 2009). For inclusion in the present analyses, youth must have had complete self-control data on five of six waves (as per Hay & Forrest, 2006). In the end, this allowed for the analysis of 349 respondents from 18 to 26 years of age. Table 1 compares the analysis sample with the 54 excluded cases on key covariates and shows that there were no significant differences between retained and excluded observations.
Comparison of Final Sample to Excluded Cases

Note. SES = socioeconomic status.
n = 349.
n = 54.
Measures
Self-Control
In this study, self-control is measured through behavioral indicators as Gottfredson and Hirschi have expressed preference for behavioral over attitudinal measures of their concept (Hirschi & Gottfredson, 1993). In this study, youth reports of self-control are used in Waves 5, 6, and 7 (when respondents were 18, 21, and 26 years of age). The indicators of self-control are measured via the BPI, which were derived from the lengthy Child Behavior Checklist (Achenbach, 1978; Peterson & Zill, 1986) and has been used in previous literature to measure self-control (Hay & Forrest, 2006; Turner & Piquero, 2002).
In the present study, the BPI was subjected to an exploratory factor analysis to assess the dimensionality of the indicators present. Analysis of eigenvalues, residuals, and factor loadings suggested preference for five factors from the 19 indicators used in past research. Three items (“often confused or in a fog,” “nervous/tense,” and “overly fearful/anxious”) loaded heavily on a single factor. Although included in previous analyses as a measure of self-control, these three items were excluded from the present endeavor as they appeared to more accurately measure anxiety than self-control. Likewise, questions regarding the destruction of one’s own and others’ property and rule violations were omitted due to concerns that these measure outcomes of self-control rather than the phenomenon itself. Three final items measuring obsessive thoughts, lying/cheating, and not feeling guilty for misbehavior failed to strongly load on any given factor and bear little resemblance to Gottfredson and Hirschi’s concept of self-control (the latter perhaps more reflective of psychopathy than self-control).
Factor scores were estimated at each wave to allow individual indicators that more strongly influenced the measure of self-control to weigh more heavily on an individual’s value. Three factors remained with each item listed in Table 2 clearly loading on one factor score. 2 Furthermore, the same factors with largely similar factor loadings were realized across all three waves of data. These factors are named for the dimensions they appear to represent: impulsivity, aggression, and interpersonal difficulties. These measures and factor loadings by wave are presented in Table 2.
Eigenvalues for Indicators of Self-Control at Each Wave

Note. Eigenvalues for each factor were above the standard 1.00 cutoff, and residuals analysis suggested the presence of multiple factors rather than one single factor.
Prenatal and Perinatal Problems
The secondary aim of this study was to assess the impact of early childhood risk factors on trajectory membership. The first of such risk factors is birth complications. Following Raine et al. (1994), the present analyses use indicators of pregnancy and delivery complications outlined by Baker and Mednick (1984) as important in long-term life outcomes. Specifically, the prenatal health index contained within the SLS will be used as a predictor of self-control trajectory membership. The specific items for the index can be found in Table 3, including items such as excessive bleeding during pregnancy, difficult delivery, and other pregnancy complications. The prenatal health index is a summated scale with a theoretical maximum value of 6. 3 In addition, an indicator measuring low birth weight (weighing less than 5.5 pounds at birth—shown to have significant consequences for early onset offending; Tibbetts & Piquero, 1999) will be assessed for influence on trajectory membership.
Prenatal, Perinatal, and Early Childhood Risk Factors

Note. SES = socioeconomic status.
Poor Early Childhood Social Conditions
This study will also assess the importance of early childhood social conditions in predicting trajectory group membership. Namely, family socioeconomic status (SES), school SES, and single-parent status will be included in these models. Family SES and school SES are measured on a 5-point scale where higher values indicate lower SES. SES is measured by the Hollingshead index of parental education and occupation. This two-factor index combines information on the highest level of education attained and the level of skill involved in an individual’s job to arrive at his or her SES (Hollingshead & Redlich, 1958). Single-parent status is a dichotomous variable taking a value of 1 if the mother or father is not present in the youth’s home. Individuals raised in a single-parent home have been shown to be at increased risk of maladjustment, including delinquency (Amato & Keith, 1991; McLanahan & Sandefur, 1994; Stouthamer-Loeber & Loeber, 1986). Finally, sex of the respondent will be included in the analyses (0 = female, 1 = male) along with parental report of self-control at age 15 (also using the BPI).
Analytical Plan
Question 1: Stability in Self-Control
Group-based trajectory modeling, specifically growth mixture modeling 4 (which allows for both between- and within-group variation; see Muthén & Muthén, 2000), will be used to assess the number of distinct trajectories of the dimensions of self-control present in the data. Group-based trajectory modeling represents an improvement over the delineation of prospectively defined groups (as used in Arneklev et al., 1998; Turner & Piquero, 2002) as it uses statistical procedures to determine groups, thus permitting the identification of distinct groups following unique trajectories of a specific behavior. It also allows for the discovery of unpredicted groups and provides a method for calculating the probability of group membership (Nagin, 2005). While generally considered an improvement in modeling developmental pathways, decisions on the number of groups to include are still relatively subjective (although, fit statistics are available to guide this process). Furthermore, in many applications (including the current one) the trajectories are based on latent constructs and “groups should not be thought of as literally distinct entities” (Nagin, 2010, p. 59).
First, growth mixture models will be estimated with only one group, and fit statistics (Baysian Information Criterion [BIC], entropy, posterior probabilities, visualization plots, and class proportions) will be assessed. From there, a two-group model will be estimated and fit statistics compared with the one-group model for improvement. This process will continue until the addition of groups results in weaker models as indicated holistically by comparison of fit statistics across the models. The end result will be three final models (impulsivity, aggression, and interpersonal difficulties) with the number of varying trajectories best indicated by the data.
The trajectories modeled here occur during a period of the life course when Gottfredson and Hirschi argue that relative stability in self-control should be present. As such, one would expect rank ordering in these dimensions to be realized in the data. For example, as there should be “little to no movement from high self-control to low self-control” (Gottfredson & Hirschi, 1990, p. 107) the group highest in self-control at one wave should be the group highest in self-control at every other wave of data. If this is not the case, this is evidence against the assumption of relative stability in self-control.
Question 2: Influence of Early Childhood Risk Factors
From here, the prenatal and early childhood risk factors 5 presented in Table 3 will be included in a logistic regression model predicting membership in one group over another. As the analyses will reveal, a large group exhibiting relatively few issues (i.e., high, stable self-control) across all three dimensions was present; therefore, a variable was created to capture those individuals who were classified into all three high, stable trajectory groups. This was a dichotomous variable where 1 = high, stable self-control and 0 = all others. Given prior evidence that these risk factors are associated with self-control deficits, one would expect these variables to be predictive of membership into the reference category (i.e., a significant odds ratio below 1) over the high self-control group.
Results
Question 1: Stability of Self-Control
Tables 4 through 6 report the statistics associated with models estimating trajectories of self-control. 6 To determine the appropriate number of groups represented in the data for each dimension, BIC, entropy, class proportions, and posterior probabilities are taken into consideration. The best model shows a reduction in BIC without a sizable drop in entropy value, class proportions for all classes containing a meaningful number of individuals, and posterior probabilities remaining above the .70 cutoff as suggested by Nagin (2005).
Growth Mixture Model: Impulsivity

Note: BIC = Baysian Information Criterion.
Growth Mixture Model: Aggression

Note: BIC = Baysian Information Criterion.
Growth Mixture Model: Interpersonal Issues

Note: BIC = Baysian Information Criterion.
In these data, a two-group impulsivity model and three-group aggression and interpersonal problems models were deemed the best fit. It is important to note that individuals are placed into the group that best reflects their observed trajectories (i.e., for which they have the highest posterior probability of membership). Therefore, the estimated trajectory line will not constitute a perfect fit for all or even most individuals but constitutes the average trajectory for a group of individuals exhibiting a similar trend over time.
The relative (rank order) stability espoused by Gottfredson and Hirschi was largely present in these early adulthood data. 7 Impulsivity (see Figure 1) was represented by two groups: one with low, stable impulsivity from the age of 18 to 26 and another group with higher levels of impulsivity. The high impulsivity group, 24% of the sample, was characterized by a roughly 1 standard deviation rise and fall in impulsivity from age 18 to 26. Overall, it appeared that one group, representing a quarter of youth in these data, exhibited relatively high impulsivity in early adulthood than another, larger group who at each time point reported little, if any impulsivity.
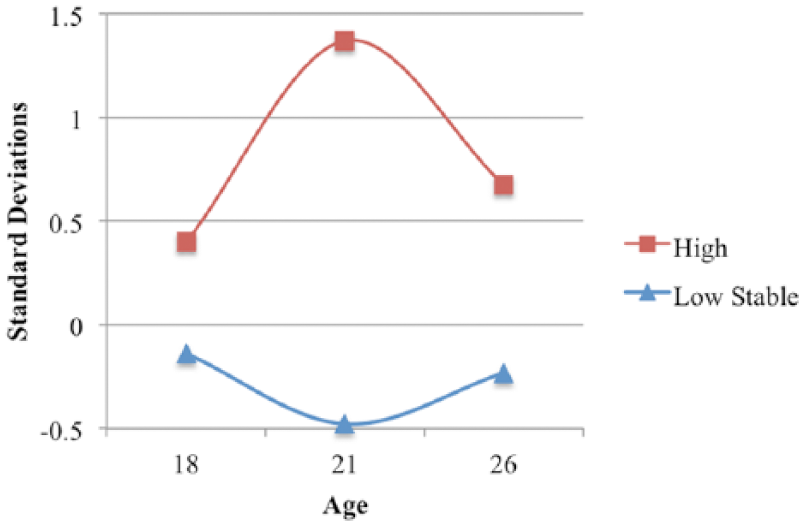
Trajectories of Impulsivity
A three-group model best characterized the aggression dimension (see Figure 2). One group (76% of the sample) was reflective of the low impulsivity group, in that their aggression was, overall, lower compared with their counterparts across waves. Their trajectory was characterized by stable, low aggression that reduced slightly to the age of 26. This trajectory profile aligns well with the predictions of Gottfredson and Hirschi who expect that “socialization continues to occur throughout life,” thus resulting in incremental gains in self-control over time (p. 107). The other two groups were characterized by increases in aggression across early adulthood at varying rates. Six percent of the sample was characterized by a trajectory of sharply increasing aggression, while around 18% of the sample was estimated to follow a steadier, low grade increase in aggression over time.

Trajectories of Aggression
Finally, the three-group model best fit the data on interpersonal difficulties (see Figure 3). As was the case for impulsivity and aggression, a large proportion (82%) of individuals were characterized to have little, if any interpersonal difficulties—at all times estimated to have a low, stable trajectory on this dimension. Two other groups fell in rank order, reporting an increase in interpersonal difficulties at age 21 that diminishes by age 26. Three percent of the sample showed relatively high interpersonal difficulties (at age 21, beyond 3 standard deviations above the mean) than the rest of the sample, while about 14% of individuals exhibited slightly elevated difficulties with interpersonal relations across time.
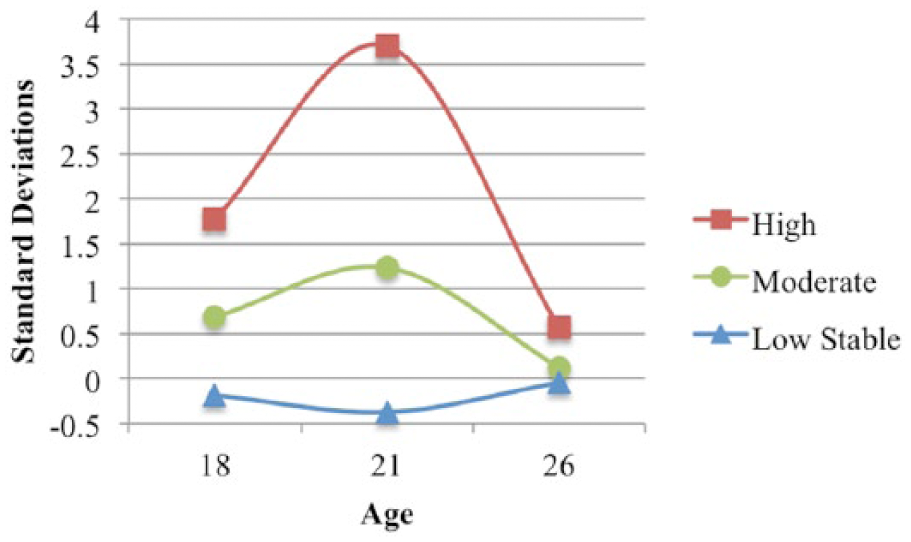
Trajectories of Interpersonal Difficulties
Question 2: Influence of Early Childhood Risk Factors
For these analyses, a binary variable was created to capture those individuals who exhibited high self-control across all three dimensions (i.e., were characterized by low, stable levels of impulsivity, aggression, and interpersonal difficulties; 1 = high, stable self-control, 0 = all others). Fifty-three percent of the sample fell into this high, stable self-control category. Logistic regression was used to predict membership into the high self-control group. As seen in Table 7, only one risk factor predicted high self-control group membership. Prenatal health problems, low birth weight, single-parent household, family and neighborhood SES failed to distinguish the high, stable self-control group. Sex, however, significantly predicted high self-control membership. Females were 2 times as likely to be characterized by high self-control across all dimensions than were males (p < .01). A prior measure of high self-control taken from parents at Wave 4 was not significantly related to high self-control here, indicating either instability or (more likely) a lack of congruence between parental and respondent reports of the construct.
Logistic Regression of High Self-Control on Early Childhood Risk Factors

Note. CI = confidence interval; SES = socioeconomic status.
All variables were standardized prior to inclusion in the model.
Self-control at age 15 measured by parent report.
p < .05. **p < .01.
Discussion
This study investigated Gottfredson and Hirschi’s (1990) stability hypothesis across early adulthood using a reduced, multidimensional version of the BPI culled from longitudinal data on a sizable sample of individuals in the Northeast. Furthermore, given the presence of varying trajectory profiles for three dimensions of self-control, analyses of the predictors of trajectory group membership were conducted. In all, the stability hypothesis received considerable support. More than half of the sample exhibited absolute stability in each of the dimensions of self-control—at all times reporting relatively less issues than their counterparts in the areas of impulsivity, aggression, and interpersonal relations. Relative stability was also largely present in the remaining trajectories; although marked gains and/or losses in all three dimensions were modeled in these data. It appears that while a large number of individuals may establish strong self-control early in life and maintain it into adulthood, for many, self-control is a dynamic characteristic susceptible to influence (both positively and negatively) across early adulthood.
These results fall in line with past stability research in uncovering varying trajectory profiles based upon the dimensions of self-control. Subjecting the BPI to factor analysis uncovered a number of underlying dimensions that both align with the self-control concept (impulsivity, aggression, interpersonal difficulties) and others that should possibly be excluded when using the BPI as a measure of self-control in future endeavors (such as anxiety and non-criminal deviance). These findings will need to be replicated with a larger dataset to further explore the multidimensionality of the BPI. Validating evidence for the use of the reduced BPI as a measure of self-control was found in a post hoc analysis of maladaptive behavior at age 26 (see Table 8). Consistent with theoretical expectations, those individuals who were characterized as having high, stable self-control in early adulthood across all three dimensions of self-control reported significantly less lifetime drug use, alcohol problems, and arrest than did the rest of the sample.
Comparison of Groups on Maladaptive Behaviors (Wave 7)

n = 186.
n = 163.
**p < .01.
Sex was shown to be a robust predictor of self-control stability with males being significantly less likely to be characterized by high, stable self-control in early adulthood. This finding falls in line with the theoretical understanding of gender and self-control supported by numerous cross-sectional/short-term studies (e.g., Hay & Forrest, 2006; Pratt et al., 2004; Wright & Beaver, 2005). They may run counter to recent longitudinal findings, however, that do not show marked gender differences in developmental trajectories (Jo & Bouffard, 2014; Ray et al., 2013). Many of the early childhood risk factors uncovered in the literature were not significant predictors of self-control stability in these data. It is important to note, however, that many of the other risk factors (viz., prenatal issues and low birth weight) were quite rare occurrences in this dataset, which may account for their lack of influence here. This limitation, along with others discussed next, should be addressed in future research.
Limitations
These conclusions must be tempered due to the presence of some data constraints. First, these data come from a few hundred (mostly Caucasian) youth in a single school district in the Northeast United States. This data collection was not intended to achieve national representativeness nor should the findings presented here be necessarily considered as such. The generalizability of these results beyond this sample is therefore limited and in need of replication. Furthermore, the attrition at Wave 3 may have influenced the representativeness of this sample, as a sizable proportion of youth were transferred to private school at this time. Arguably, these more affluent youth may have had higher, more stable self-control that could have influenced the trajectories presented here. These findings must be considered in light of this possibility.
In addition, these data are limited by the inability to account for heritability. Emerging evidence on the importance of genetic factors in the expression of self-control discussed above suggests that a substantial portion of the development of self-control may be due to heritable traits. Including such measures in the models predicting group membership would greatly improve the explanatory power of these analyses. Finally, in a similar vein, direct measures of parental socialization were unfortunately not available in the data. Given the theoretical importance of this concept, it would be ideal for parental socialization to be included in predicting trajectory group membership with other datasets containing these measures.
Conclusion
Gottfredson and Hirschi’s concept of self-control has been shown to largely overlap with personality traits such as conscientiousness and agreeableness (Ahadi & Rothbart, 1994; O’Gorman & Baxter, 2002; Tobin, Graziano, & Vanman, 2000), which (along with numerous personality traits) can exhibit changes well into adulthood (although consistency in personality strengthens with age; Roberts & DelVecchio, 2000). 8 It follows that this phenomenon likely exhibits a fair amount of elasticity for some individuals well into the life course. An important caveat for future research will be to investigate which events across the life course influence these changes in self-control.
The finding that a sizable proportion of individuals are characterized by instability in early adulthood could be explained by expectations in personality psychology that time periods of novel experiences illicit the most change (Glenn, 1980; Tyler & Schuller, 1991). Clearly, the age range included here—from the end of high school, across college, and the first few years in the workforce—is ripe with fresh experiences that may lead to changes in self-control however permanent or temporary. Changes in marital, employment, and substance use status have been suggested as potential catalysts to the sorts of developmental pathways exhibited here (Hay & Forrest, 2006). Early life factors did not seem to shape the stability of self-control in adulthood, yet it remains possible that the significance of sex on self-control might manifest in these later life events. Future analyses should use growth curve modeling, for example, to consult the host of life events that may serve to bolster or diminish self-control across the life course.
Finally, the multidimensional self-control measure presented here may serve as a guide for future stability inquiries as it used objective criteria to parcel out those indicators that are strongly related to—or outcomes of—Gottfredson and Hirschi’s self-control. The reduced number of indicators provided in the present measures may better reflect the concept than the entirety of the BPI used in previous analyses—an assertion worthy of future inquiry.