
Abstract
A series of aromatic polyimide–phosphoric anhydride composite membranes loaded with fumed silica (FS) nanoparticles were prepared from polyamic acid (PAA). First, the influence of the percentage loading of phosphoric anhydride (PA) on the proton conductivity of polyimide (PI) membranes was studied. The PA-PI film containing 45% of PA showed proton conductivity of 1.31 × 10⁻⁴ S/cm at 80°C, whereas the conductivity of neat PI films was 1.80 × 10⁻⁶ S/cm at room temperature. Next, the effects of the FS nanoparticles on the proton conductivity, the mechanical and thermal properties of the formulated PA-PI membranes were studied. Forty-five percent of the PA-PI membrane loaded with 1% FS (45% PA-PI/1% FS) showed an enhanced conductivity of 2.78 × 10⁻⁴ S/cm at 80°C when compared to the neat 45% PA-PI membrane. The tensile strength of the 45% PA-PI/1% FS nanocomposite membrane was comparable to the Nafion proton conductive membranes. The thermal analysis of 45% PA-PI/1% FS nanocomposite membranes showed that these membranes were thermally stable and suitable for high-temperature applications.
Introduction
Polymer electrolyte membranes have been extensively studied because of their potential applications in solid state batteries, electrochromic windows, sensors, robotics, fuel cells, and electric vehicles. 1 –5 Nafion, a perfluorinated polymer electrolyte membrane, is a well-known polymer electrolyte membrane with excellent chemical stability and high proton conductivity. 3,4,6 –13 However, several factors such as high cost, poor performance at elevated temperature (>80°C), water dependency and high methanol crossover hinder the use of Nafion membranes for these applications. 7,14 –21 To overcome these drawbacks, many researchers combined organic and inorganic components to develop membranes that are flexible, durable and more thermally stable. 8,22 –24 Inorganic materials such as silica, mesoporous zirconium phosphate (MZP), and mesoporous titanium phosphate (MTP) have been investigated as fillers for Nafion membrane to improve the barrier properties of direct methanol fuel cells (DMFCs). 9,10,2,4,5,23 The filler-modified membranes gave an improvement of about 10% to 45% in degradation temperature and 7% to 30% in glass transition temperature compared to the neat Nafion membrane. Rodriguez et al. reported a decrease in the methanol crossover from 7.48 × 10⁻⁶cm2/s for pure Nafion to 2.86 × 10⁻⁶ cm2/s for 10% SiO2/Nafion membranes. 8 Fan et al. reported that polyethyleneoxide (PEO)-based polymer electrolyte with modified SiO2 has a significant increase in proton conductivity and mechanical strength. 25 However, the thermal properties of SiO2-modified membranes were degraded due to the flexibility of the amorphous phase. Previously, Sun et al. also reported a significant improvement in conductivity due to the addition of ferroelectric nanoparticles BaTiO3 to a PEO and lithium salt–based electrolyte membrane. 26 The addition of ferroelectric nanoparticles facilitated the salt dissociation into charge carrier particles which, in turn, enhanced the conductivity. Nanocomposite proton exchange membranes based on polyvinylidene fluoride (PVDF) and nano-Al2O3 showed a good proton conductivity (10−2 S/cm) and promote acid absorption by filler materials. 27,28
Fumed silica (FS) is a filler of special interest because of its chain-forming tendencies that form 3-D branched aggregates with high surface area that can be tailored to various functionalities. 6,29 FS is an exceptionally pure form of silicon dioxide and can be made by reacting silicon tetrachloride in an oxyhydrogen flame. 29 Due to the feasibility of the surface functionalization of FS, it became attractive filler for membranes among researchers. Gomes et al. 9 prepared a membrane using activated sulfonated FS and achieved higher proton conductivity (0.045 S/cm at 100% RH) at 100°C compared to lower conductivity of the plain electrolyte membrane (0.018 S/cm). 9
Further studies reported that the addition of FS to PEO 30 or to monomer (methyl methacrylate)–based polymeric gel electrolytes 31 or to 2-hydroxyethyl methacrylate (HEMA)-based electrolyte membrane 6 improved both the conductivity and the thermal properties of proton-conducting polymer membranes. Chen et al. investigated the effect of different types of FS dispersion in gelled electrolytes. 29 His research team studied the dispersion of FS gel associated with aging time, stirring rate, temperature and the effect of particle size on the performance of valve-regulated lead-acid batteries. They found that 90 min of aging time was required to disperse the A200 (surface area: 213.9 m2/g) FS, whereas HL200 silica (surface area: 168.6 m2/g) needed only 15 min to disperse. Because of the higher surface area, the A200 agglomerated quickly and took longer time to disperse.
In this study, a high proton conductive polymer membrane based on phosphoric anhydride (PA)- and polyimide(PI)-filled with untreated FS was formulated. The effects of FS loadings on the proton conductivity, thermal stability and mechanical properties were studied. The main rationale for conducting this study was to strike a balance between improving proton conductivity and maintaining the mechanical and thermal properties.
Experimental
Materials and membrane preparation
PI-based nanostructure membranes were prepared from poly (amic acid) with PA (P2O5) and FS. Poly (amic acid) (PAA, MW 110,000) was provided by Industrial Summit Technology Corporation (Parlin, NJ, USA) in the form of viscous yellow solution containing 84%–85% N-methyl-2-pyrrolidone (NMP) and 15%–16% PAA of pyromellitic dianhydride (PMDA)-co-4, 4-oxydianiline (ODA) (see Figure 1). PA (P2O5) was obtained from Sigma Aldrich (St. Louis, MO, USA) in a form of white powder and stored in a dry environment before usage. NMP (anhydrous, 99.5%) solvent was supplied by Sigma Aldrich. The untreated FS (primary particles 10–15 nm and aggregate length of 0.2–0.3 µm with 200 m2/g surface area) was obtained from Cabot Corporation (Boston, MA, USA). All of the above materials were used as received.
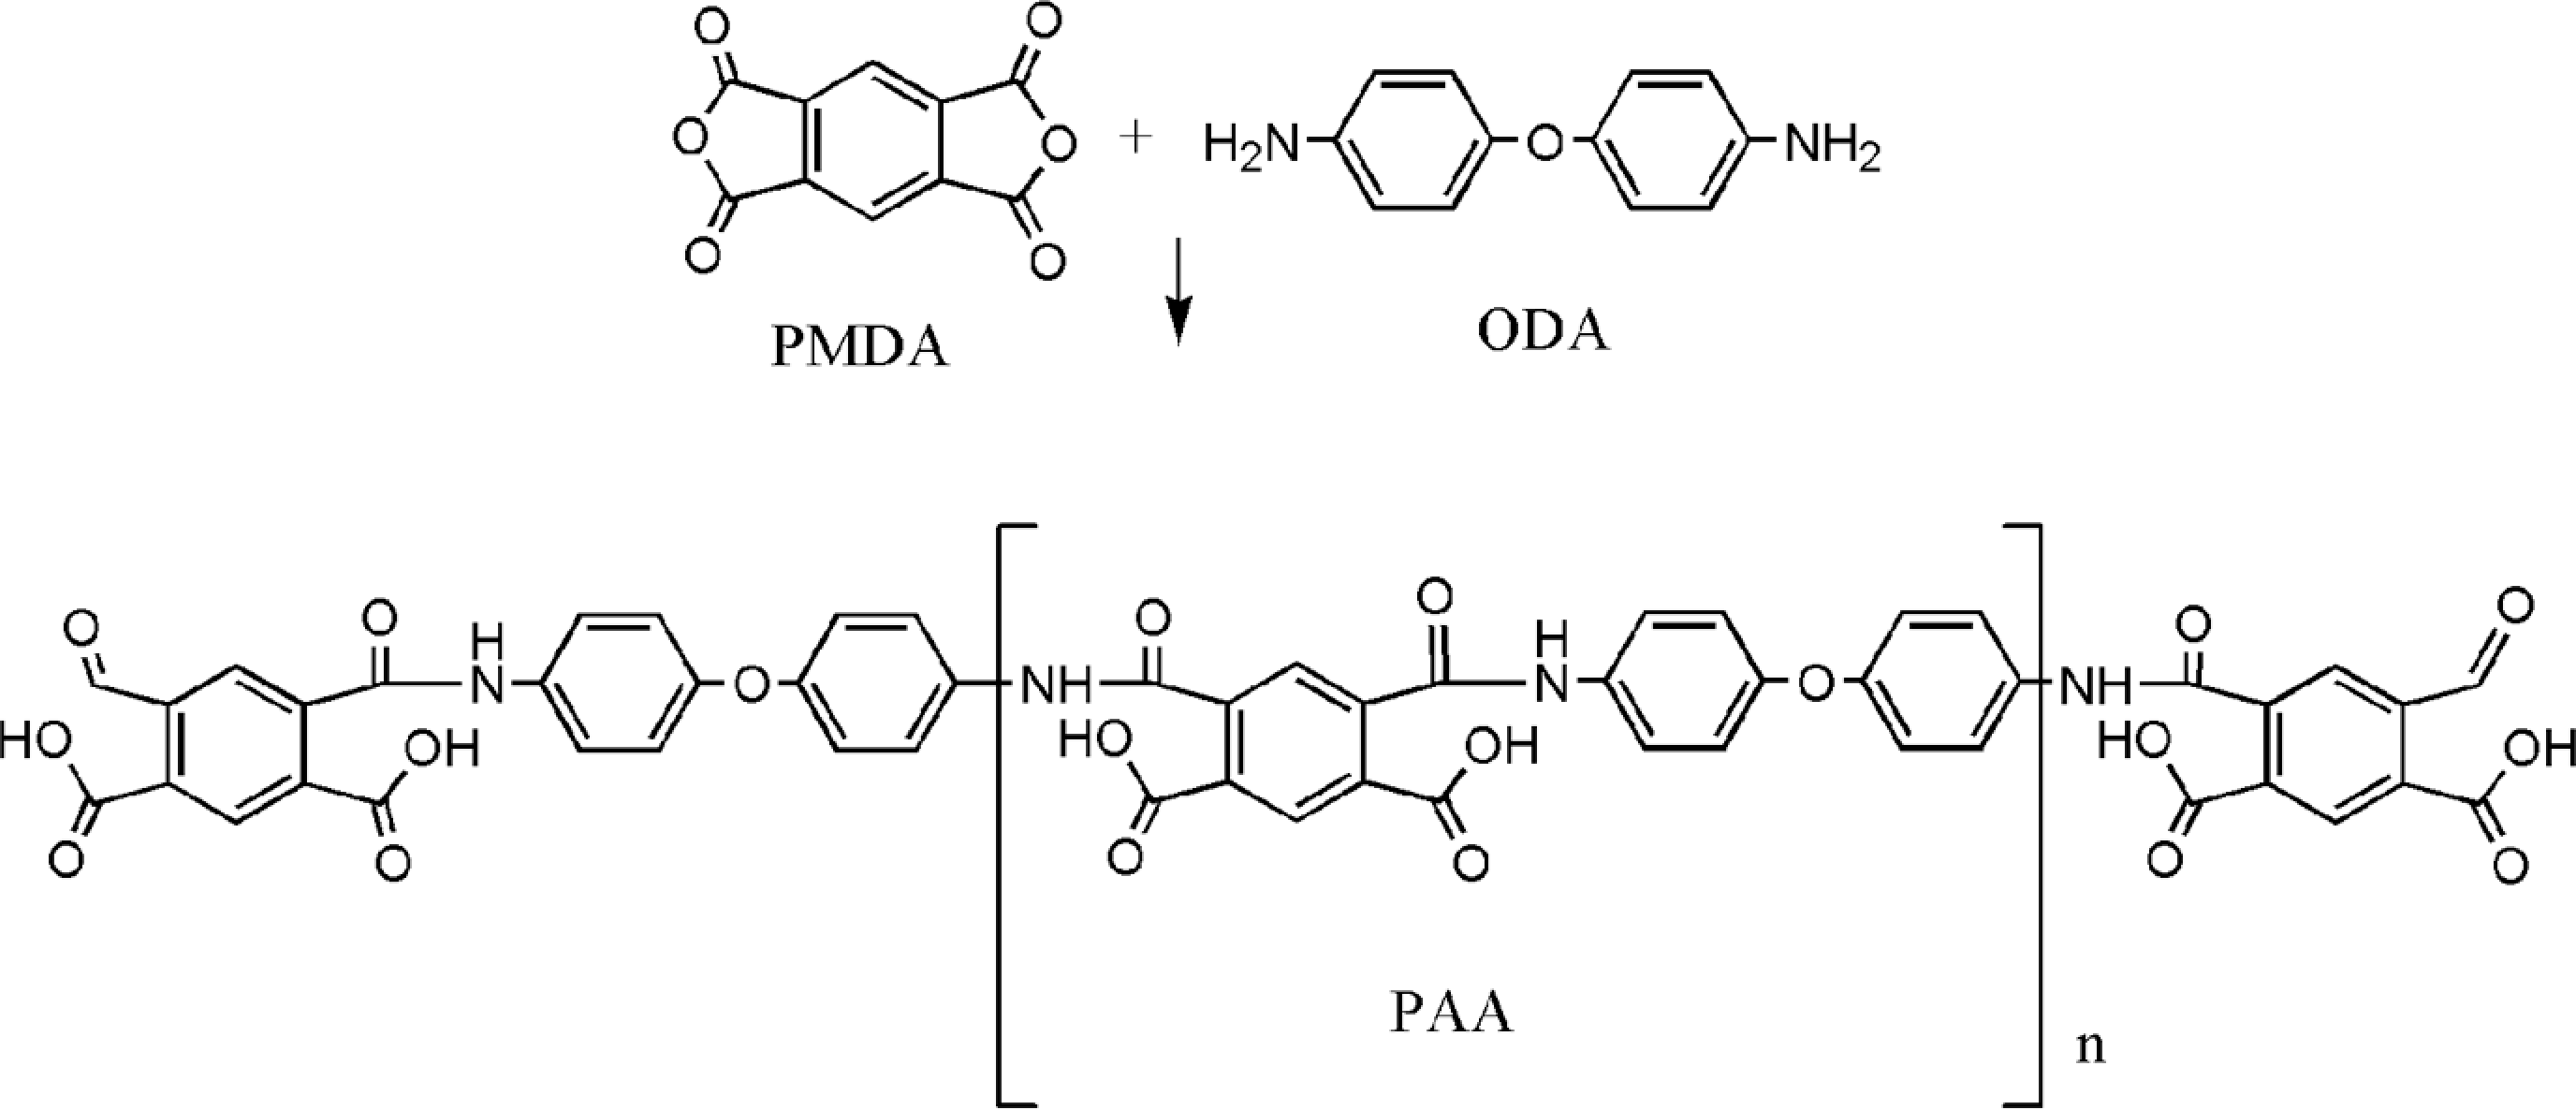
Reaction scheme for preparing poly (amic acid).
The P2O5 solution was prepared by mixing P2O5 powder in NMP (1:10 P205/NMNP weight/weight (w/w)) using a magnetic stirrer for 1 h at 50°C. The nanoreinforced composite membranes were prepared by initially mixing the appropriate amount of FS with P2O5 solution for 2 h using a magnetic stirrer. The P2O5/FS mixture was then added to PAA precursor solution and mixed using a high-speed mixer for 30 sec at 2,400 rpm. To ensure good dispersion, the high-speed mixing step was repeated 6 times for a total of 3 min. Subsequently, the mixture was spun coated onto a 6-inch-diameter glass plate to ensure a uniform thickness and then cured in mechanical convection oven at 250°C using multiple ramp rate steps and holding time. The final thicknesses of the membranes after cooling to room temperature were about 25 µm.
Proton conductivity test
The proton conductivity measurements were performed using a PARSTAT 2273 (Power Suite Software) impedance analyzer in a potentiostatic mode at a frequency range of 10 Hz to 1.5 MHz. Completely dried samples were cut into small square pieces and inserted between two copper electrodes. The electrode surface area was 2.51 cm2. The resistance value was measured at the high frequency intercept of the impedance with the real axis. If the high-frequency points did not cross the real axis, the points were extrapolated to cross the real axis. For temperature-dependence proton conductivity measurements, an environmental chamber with 350 W heater was used. The membrane temperature was measured using a thermocouple attached to the surface of the membrane. The proton conductivity of a completely dry membrane was calculated using the following equation,

where α is the proton conductivity of the membrane (S/cm), R is the measured resistance of the membranes (Ω), t is the thickness of the membranes (cm), and A is the cross-sectional area (cm2) perpendicular to the current flow.
Fourier transform infrared study
Infrared spectra of neat PA-PI and PA-PI/FS nanocomposite membranes were recorded on Thermo Scientific Nicolet 6700 Fourier transform infrared (FT-IR) spectrometer (West Palm Beach, FL, USA) with Smart Orbit diamond attenuated total reflectance (ATR) accessory. IR spectra were obtained at a resolution of 4.0/cm over a 400 to 4,000/cm wave number range and 32 scans.
Mechanical testing
Tensile tests were performed on neat, PA-PI and PA-PI/FS nanocomposite membranes using an electromechanical material testing system with a 44.5 N load cell. Three samples from each membrane were cut into dog bones according to ISO 527-2-5A.Thickness for each sample was measured with a thin membrane thickness gauge (Time Trade TT 260). The average value for the three mechanically tested samples in each category was taken as the ultimate strength. All samples were tested at a crosshead speed of 2.54 mm/min and at room temperature.
Thermal analysis
Thermal characterization of neat and nanocomposite membranes was performed using a Q1000 differential scanning calorimeter (DSC; TA Instruments Inc, New Castle, DE, USA). The glass transition temperatures were determined using a dynamic procedure with heat/cool/heat cycle. Cured samples of 10 mg were heated from room temperature to 450°C at a heating rate of 10°C/min to remove residual solvent and thermal history. The samples were then cooled back to room temperature. In the final heating cycle, the samples were heated to 450°C in the modulated DSC (MDSC) mode at a heating rate of 3°C/min and amplitude of ±0.50°C every 60 s. The glass transition temperature data was collected from MDSC.
Thermal gravimetric analysis (TGA) was also performed using a TA Instruments TGA Q500 (New Castle, DE, USA). Measurements were run under air atmosphere, using a scan rate of 20°C/min.
Results and discussion
Proton conductivity measurement at room temperature
The proton conductivity measurements as a function of P2O5 concentration of the PA-PI membranes, at room temperature, are shown in Figure 2. The graph shows that the proton conductivity of the PA-PI membranes rises as the amount of P2O5 content increases. This is most likely due to the availability of more protons for conductivity at higher concentration of P2O5. The proton conductivity of the neat membranes was approximately 10−6 S/cm, while the PA-PI membranes showed a conductivity of 10−5 S/cm. The room temperature for proton conductivity of PA-PI membranes was higher than the anhydrous proton conducting electrolyte based on poly(ethylene glycol) (PEG) monomethyle ether. 32 The PEG electrolyte has, however, similar conductivity at 80°C, 10−5 S/cm.
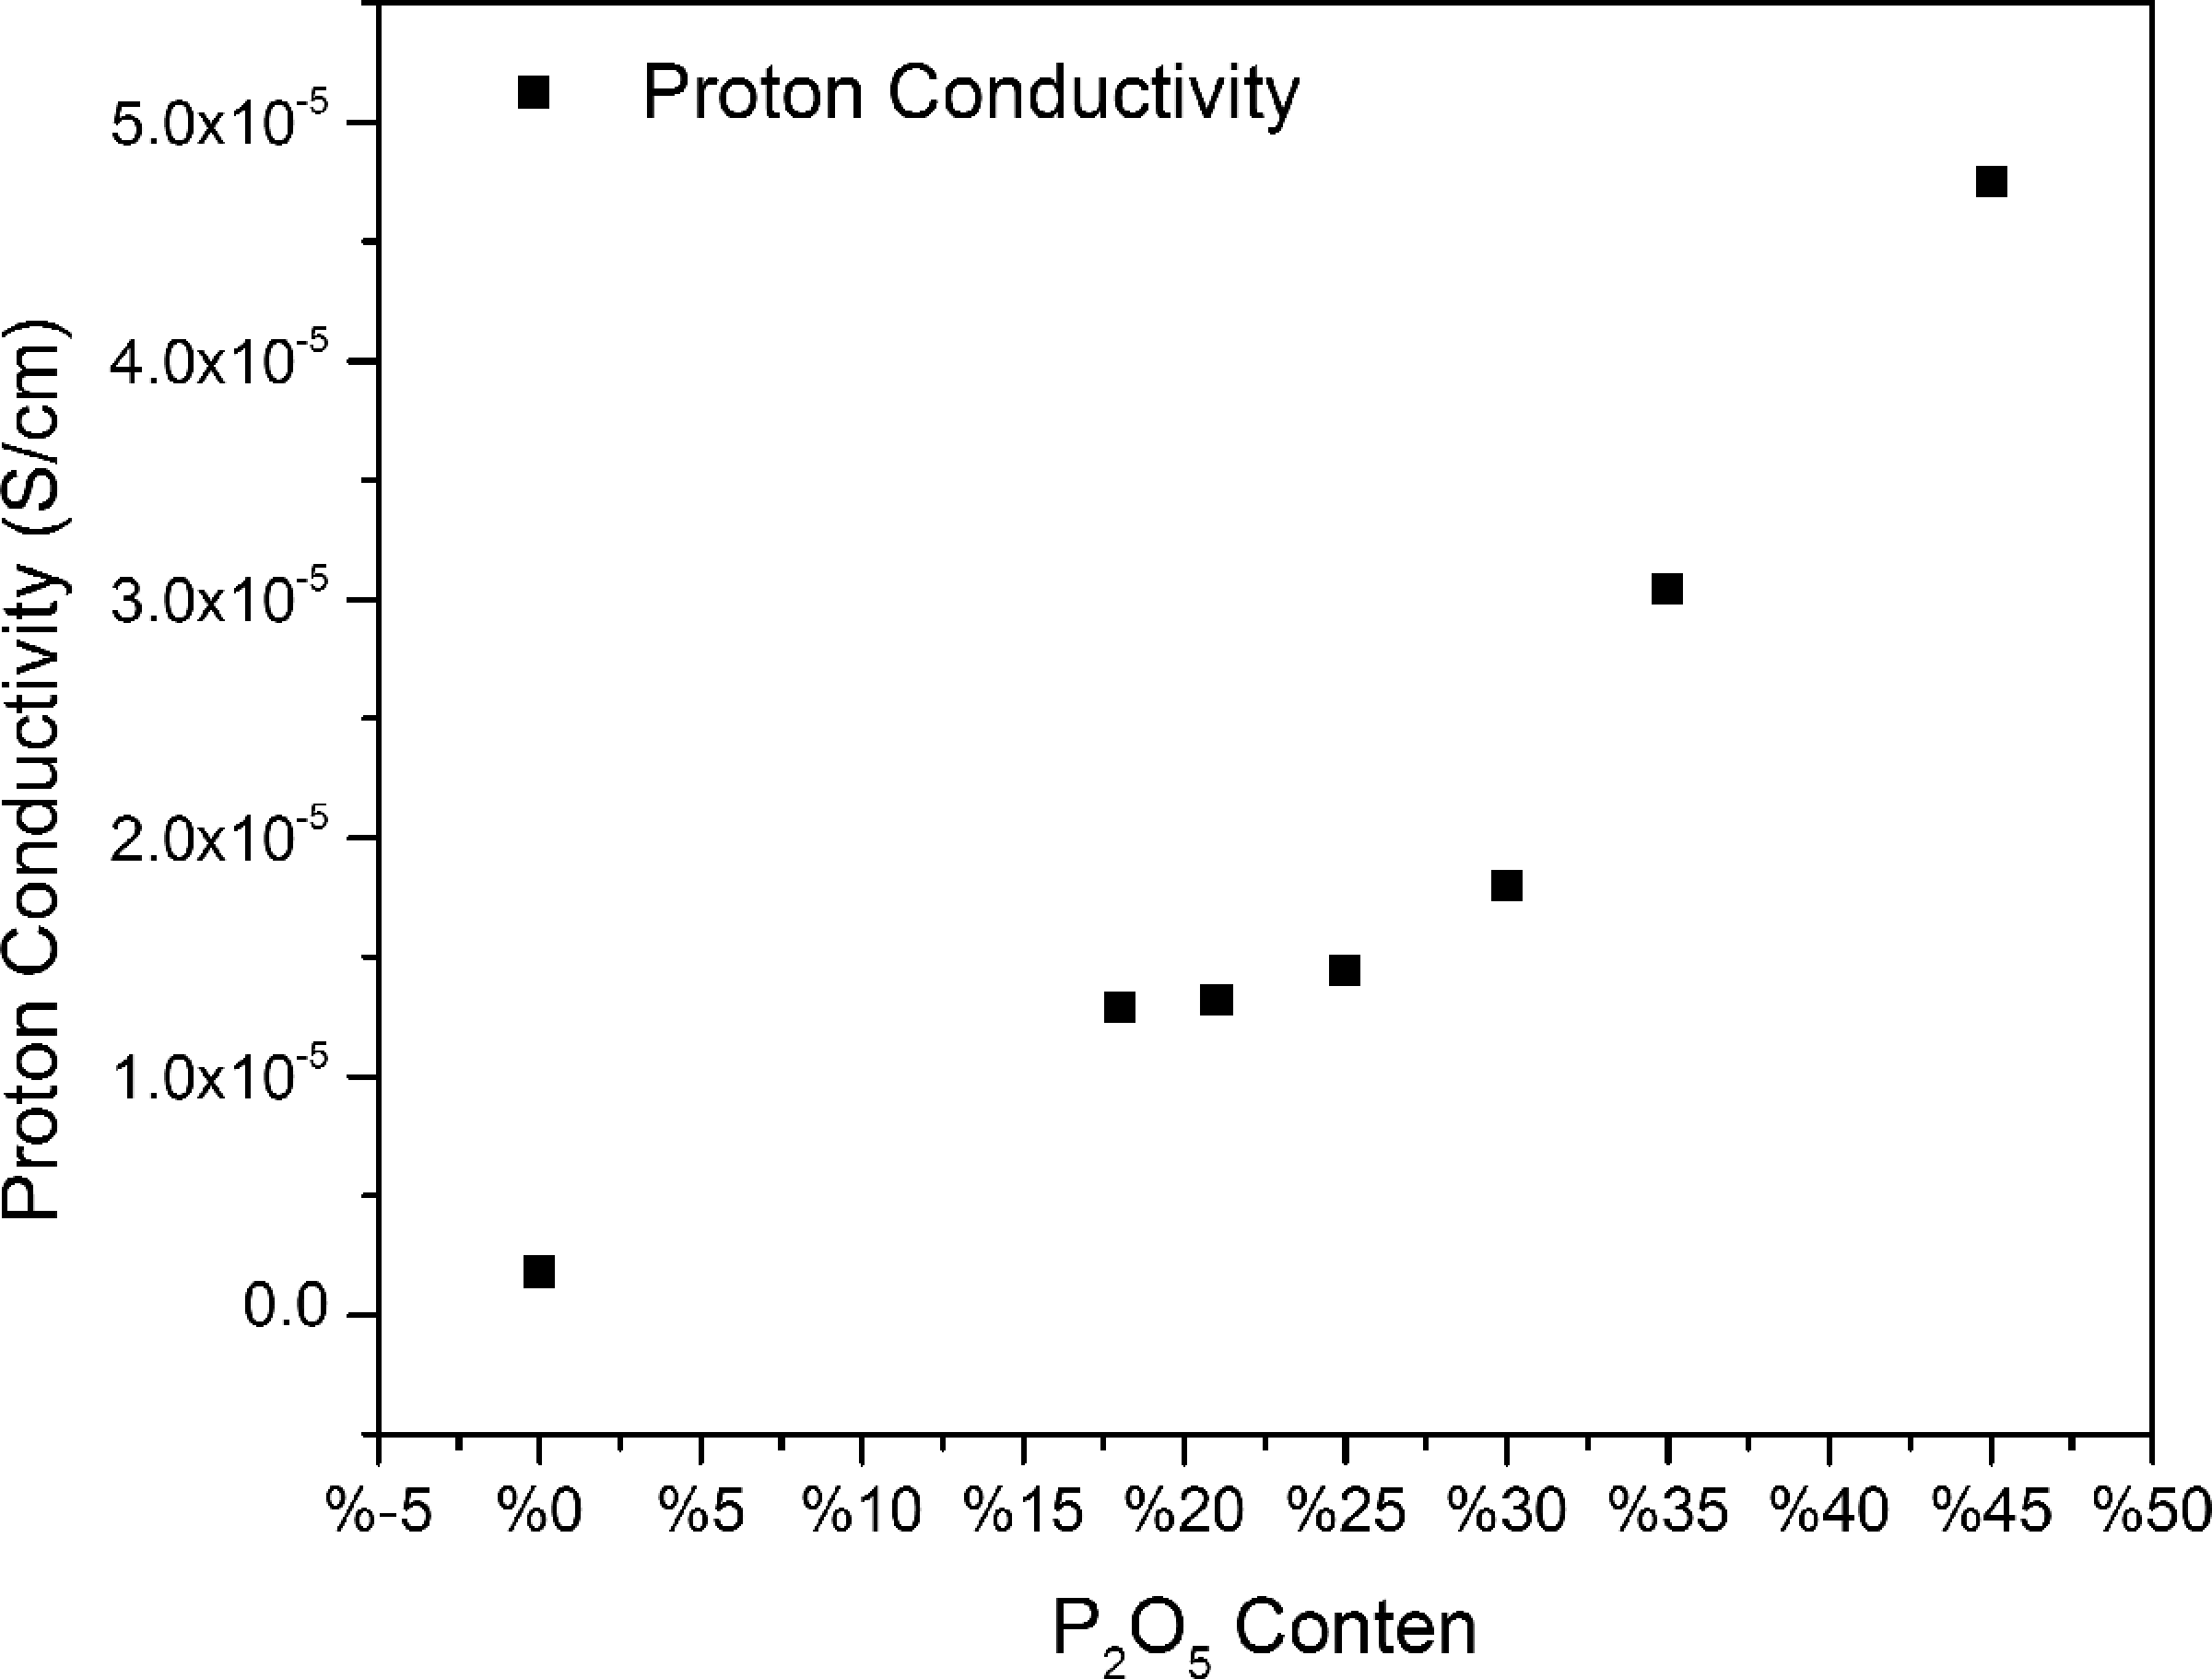
Proton conductivity of PA-PI membranes as a function of P2O5 content. PA-PI: phosphoric anhydride–polyimide.
Effect of FS nanoparticles on the proton conductivity
To study the effect of FS nanoparticles on the proton conductivity of PA-PI membranes, untreated FS were infused into 30%, 35% and 45% PA-PI membranes at three different loadings (1%, 2% and 3%).The proton conductivity measurements of the PA-PI membranes with FS are shown in Figure 3. The addition of FS at 1% loading showed the proton conductivity improvement compared to neat PA-PI membrane. The proton conductivity of 45% PA-PI membrane with 1% FS (45% PA-PI/1% FS) was 1.2 × 10⁻⁴ S/cm at room temperature which is at least two order of magnitude higher than the comb polymer membrane reported in the literature. 33 The membrane proton conductivity at room temperature is similar to that of the Nafion polymer. The conductivity of Nafion is constant with temperature, only showing a slight increase from room temperature to 80°C. 15 It is assumed that the enhanced proton conductivity in our study was due to the ability of FS to form a three-dimensional network by hydrogen bonding between the surface hydroxyl groups. It is believed that hydrogen bonding is responsible for the formation of three-dimensional gel in P2O5/NMP solution. This interaction was shown to result in a uniform distribution of silica nanoparticles in P2O5/NMP solution leading to the formation of a uniform, microscopic, gel structure. 31 The FS structured membranes contained more P2O5 than the neat PA-PI membranes. Higher loading of FS (2% and 3%) in the membranes showed no improvement in the proton conductivity relative to the neat PA-PI. It is believed that higher loading of FS trapped more P2O5 and limited the free movement of protons.
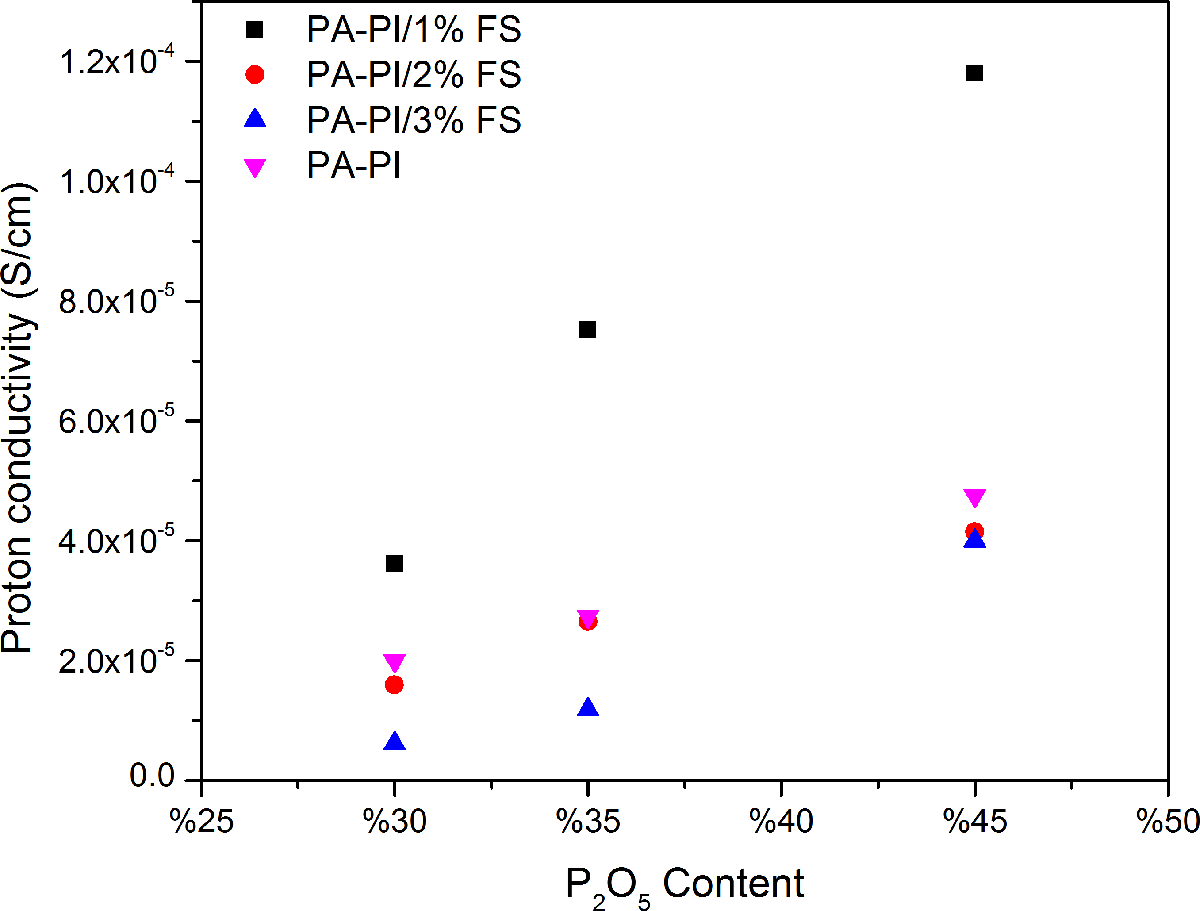
Proton conductivity of PA-PI membranes with fumed silica loadings. PA-PI: phosphoric anhydride–polyimide.
The Nyquist plot for the 30%, 35% and 45% PA-PI with 1% FS is shown in Figure 4. The results show that the membrane resistance (real axis value of Z) decreases as P2O5 content increases. The membrane resistance was calculated from the high-frequency intercept of the semicircle in the graph. The membrane containing 30% PA-PI with 1% FS showed a resistance of 20 Ω, while the resistance was only 11 Ω for the 35% and around 8 Ω for the 45% PA-PI with 1% FS. The three membranes also exhibit a straight line at the low-frequency region. These straight line spectra indicate that polarization took place through the membrane due to the diffusion processes. 34 The proton kinetic mass transfer was increased in the PA-PI-nanostructured membranes indicating a fast proton transfer behavior resulting from the availability of more protons. 35
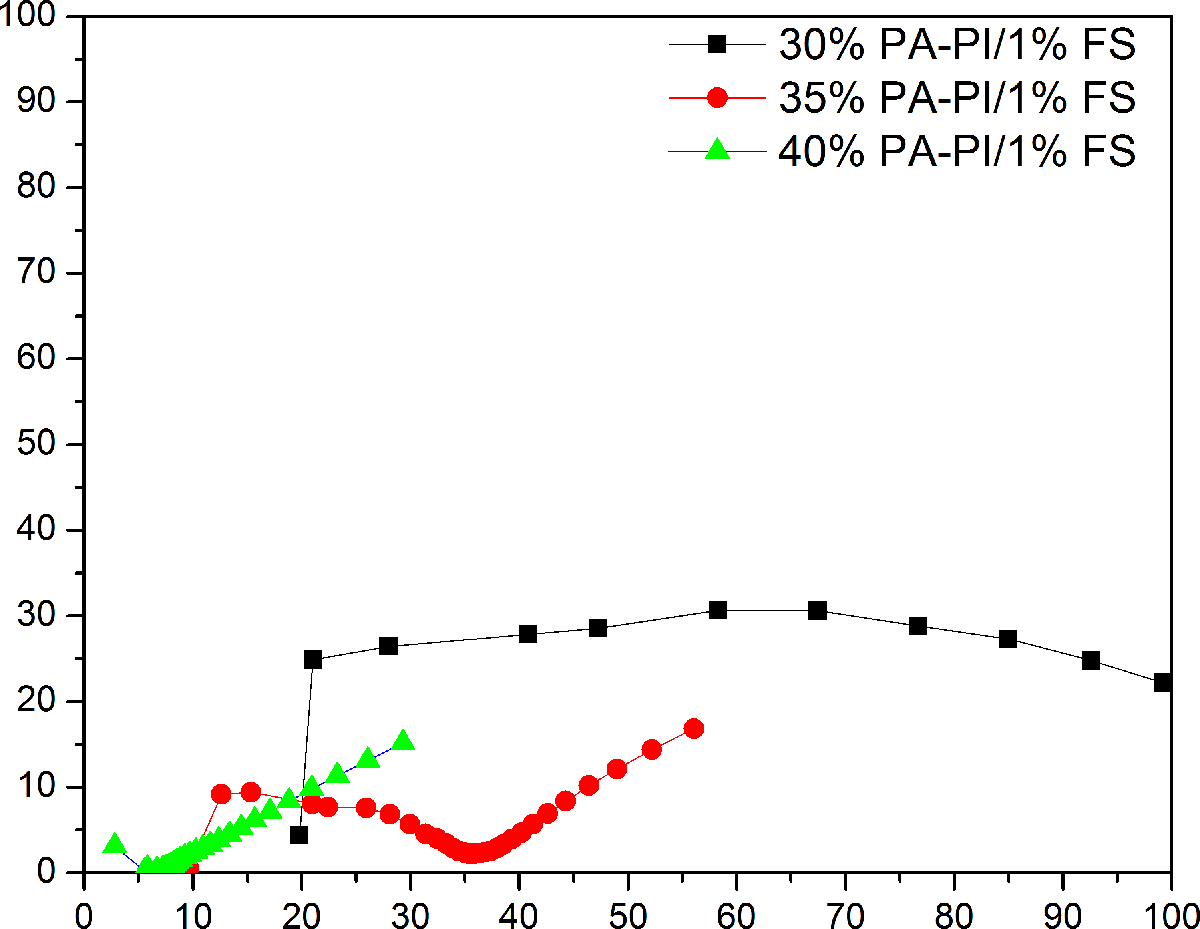
Nyquist plot for PA-PI membranes with 1% fumed silica. PA-PI: phosphoric anhydride–polyimide.
Effect of temperature on the proton conductivity
The temperature dependence of the proton conductivity of the 45% PA-PI membranes and the 45% PA-PI/1% FS nanocomposite membranes was studied and the results are shown in Figure 5. Those two samples were chosen from their prospective systems since they showed the best enhancement in proton conductivity. In both membranes, the proton conductivity increased as the temperature increased. The maximum proton conductivity of 2.78 × 10⁻⁴ S/cm was achieved when the FS loading of PA-PI membranes was 1% at 80°C. Similar increase in conductivity was reported by Casciola et al. when they tested Nafion films at elevated temperature of up to 120°C.
15
Their study also showed a decay of conductivity values if the films were held at or above 120°C for extended period, even if the films were cooled to room temperature. The proton conductivity of 45% PA-PI membrane increased by about an order of one magnitude when temperature was raised from 25°C (10−5 S/cm) to 80°C (10−4 S/cm). This is attributed to the activation of more molecules and linking them to the proton conduction system at higher temperature. Arrhenius and Vogel-Tamman-Fulcher equations were applied to PA-PI membrane system to explain the proton transport mechanism.
36
–39
The temperature curves of the PA-PI membranes exhibited the Arrhenius behavior
36
described by equation (2).

Where R is the Boltzmann constant per molecule and T is the temperature of polymer membrane, σo is the proton conductivity at infinite temperature and Ea is the activation energy. The proton activation energy (Ea ) of 45% PA-PI membrane and 1% 45% PA-PI/1% FS nanocomposite membranes were 14.05 and 13.50 KJ/mol, respectively. These values were calculated from Figure 5 using equation (2). This narrow difference in proton activation energy shows that the addition of FS has no effect on the activation energy. In addition, the proton conductivity of 45% PA-PI membrane was 0.017 S/cm and that of 45% PA-PI/1% FS nanocomposite membranes was 0.028 S/cm at infinite temperature.
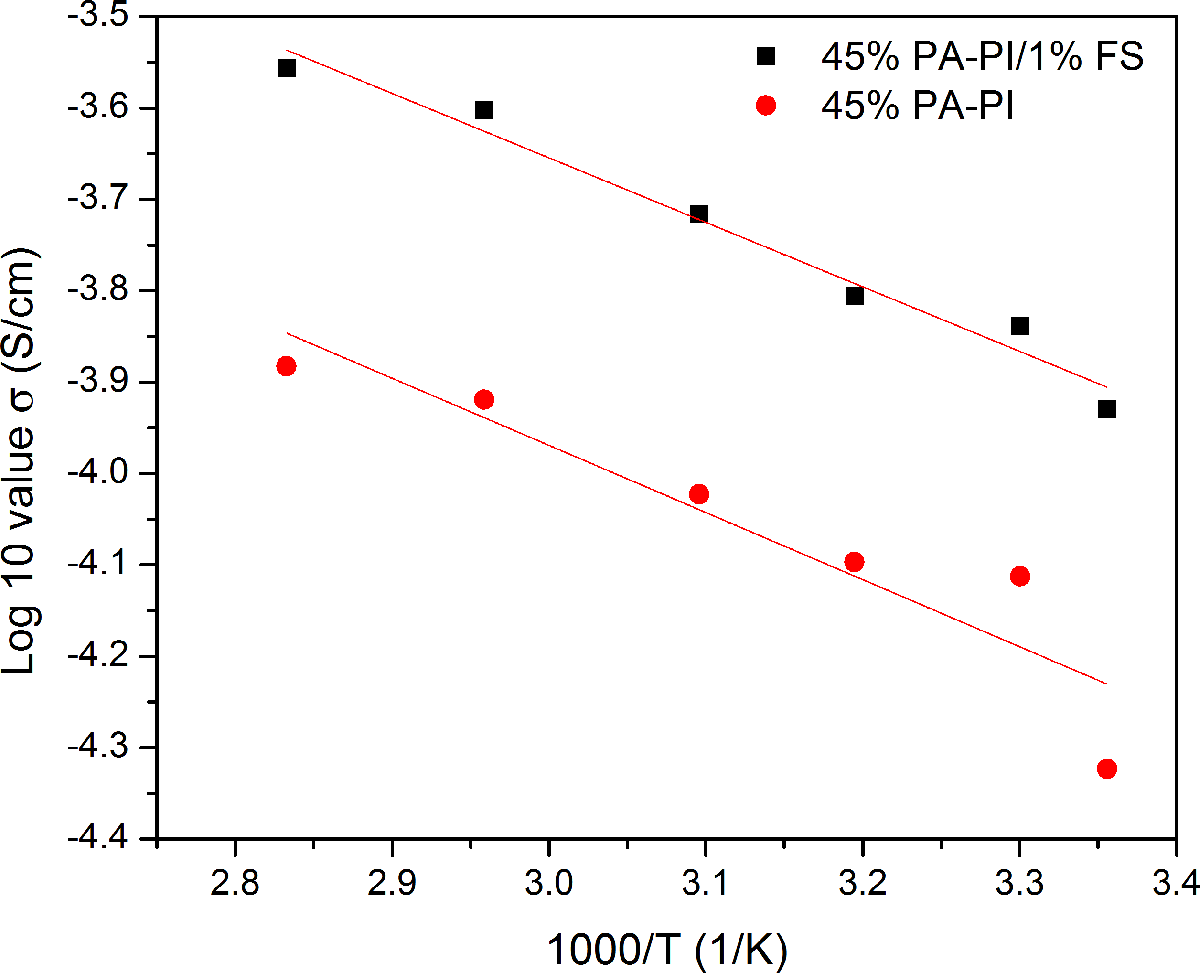
Effect of temperature on proton conductivity of 45% PA-PI and 45% PA-PI with 1% fumed silica.
The FT-IR spectra of the neat PI, PA-PI, and PA-PI nanocomposite membranes with 1% FS are shown in Figure 6. The spectrum of PI membrane showed a few characteristic peaks of PI polymers. The peak at 1,775/cm was assigned to symmetric stretching of C=O, 1,714/cm to asymmetric stretching of C=O and 1,370/cm to C–N–C stretching of the imides. The peaks at 1,500/cm were from the C–C stretching of benzene ring of ODA. 24 The C=O stretching of PAA absorption bands at 1,640/cm was almost negligible indicating complete imidization reaction of PAA to PI. The PI membrane has identical infrared spectrum to the PI film cured under similar conditions. 24 The characteristic peaks of FS usually show at around 1,094/cm for Si-O-Si and at 805/cm of for Si-OH absorption band. 22 The disappearance of the Si-OH absorption band at 805/cm and the reduced intensity at 1,094/cm indicate some secondary interaction between the FS and PA when they were added to the polymer. The peak at 987/cm was likely due to the symmetric stretching of P-O on PA. 37 This peak also exhibited a broadening when PA was added to the PI polymer. The broadening of the peak largely indicates some structural changes in the environment surrounding the P-O on PA. It can be presumed that phosphoric acid forms as a result of the reaction between water (formed during the condensation reaction of poly(amic acid) to PI) and P2O5; however, the pH dependence of the spectrum of phosphoric acid makes a certain determination difficult. 40 Absorptions at 1,160, 1,074, 940 and 870/cm might be assigned to H2PO4 at a pH of 4.8; however, those absorptions are not limited to this assignment. From these results, the proton source for the PA-PI system is more likely the phosphoric acid.
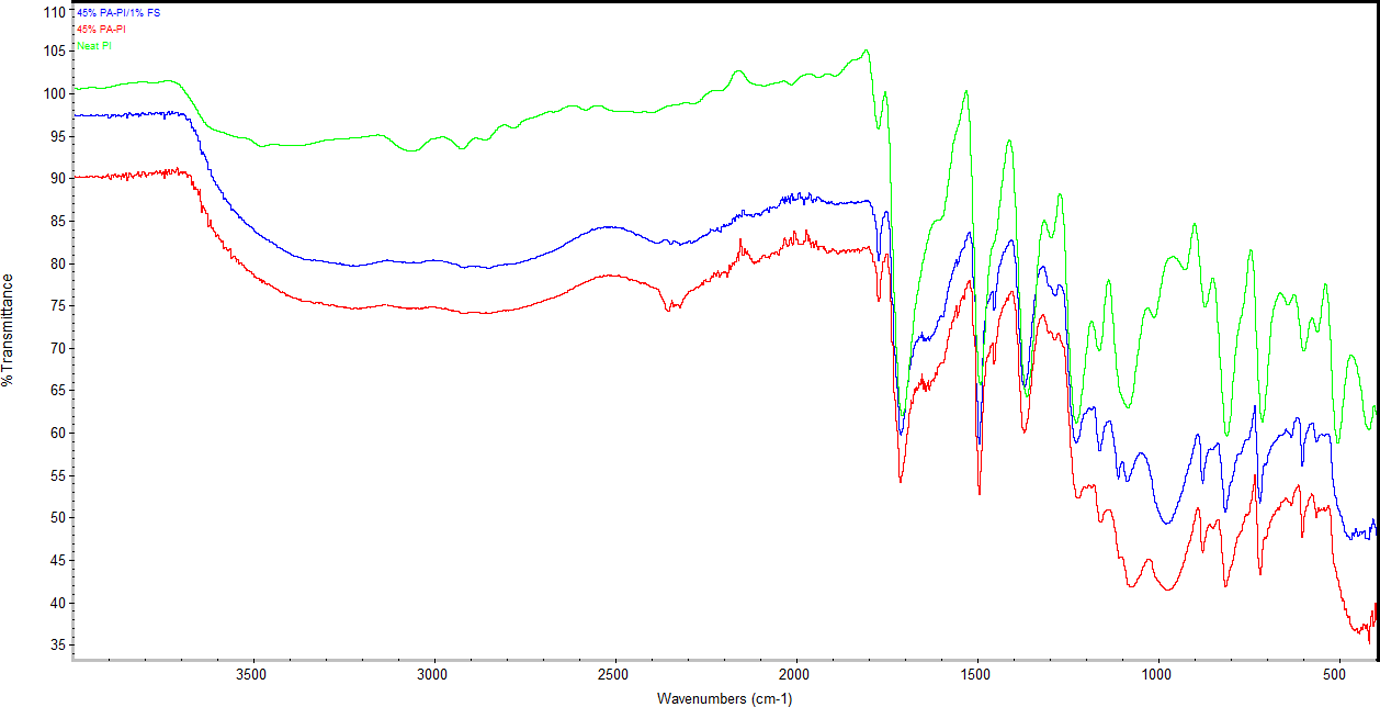
FT-IR spectra of the neat PI, PA-PI and PA-PI nanocomposite membranes with 2% fumed silica (neat PI (top), 45%PA-PI (bottom) and 45% PA-PI/1% FS (middle). FT-IR: Fourier transform infrared; PI: polyimide; PA: phosphoric anhydride; FS: fumed silica.
Mechanical behavior
The stress–strain values of PA-PI and PA-PI/FS nanocomposite membranes are presented in Table 1. The PA-PI and nanocomposite membranes showed a reduction in both the yield stress and strain compared to the neat PI membranes. Higher loading of FS in the nanocomposite membranes showed a similar reduction in strength and strain. 41 This reduction was likely due to the infusion of large amounts of PA in the polymer matrix which affects the ability of the polymer to withstand the applied load. The strength of the membrane with the highest proton conductivity (45% PA-PI with 1% FS) was significantly reduced to 21 MPa and 5% elongation at break; this value, however, was comparable to the Nafion membranes’ strength of 21 MPa tested under similar experimental conditions.
Stress–strain data for modified and nanostrucrured membranes and Nafion membranes.
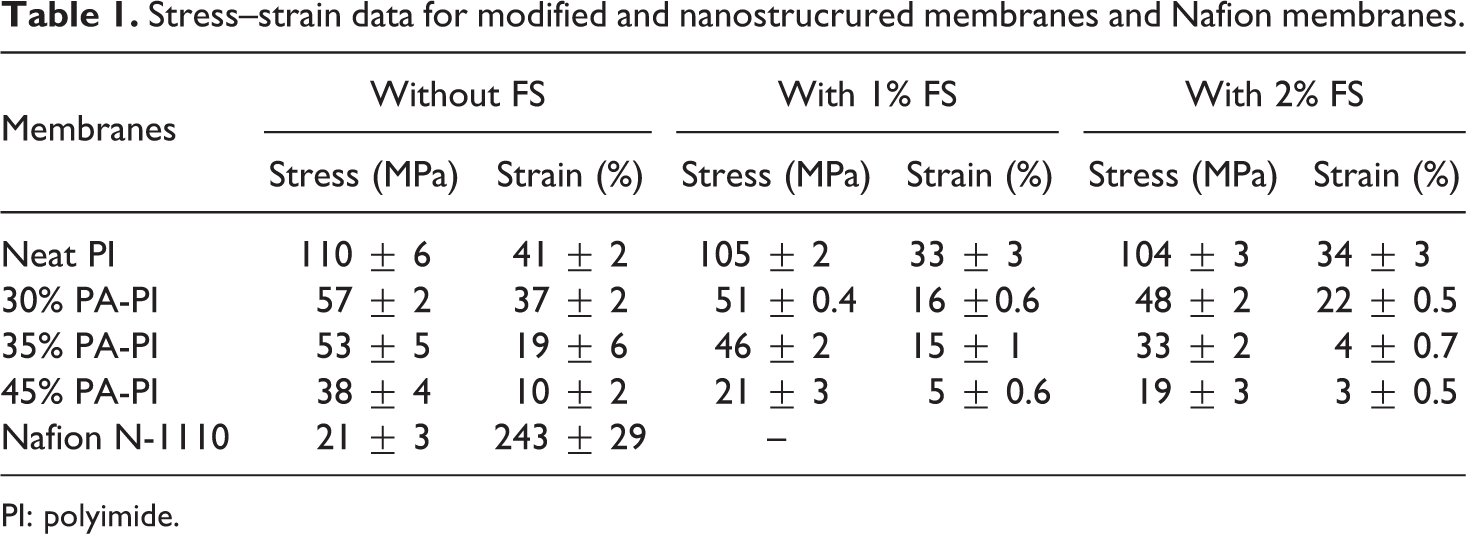
PI: polyimide.
Thermal analysis
TGA micrograph of the neat PI, the 45% PA-PI, and the 45% PA-PI/1% FS membranes are shown in Figure 7. The TGA micrograph can be divided into four regions. 42 Weight loss occurred below 200°C especially for PA-PI/FS and PA-PI (approximately 15%). This loss could be due to the associated solvent released as hydrogen bonds were separated, and/or due to the escape of water formed during the conversion of PAA to PI and its retention by phosphor anhydride. The NMP solvent for PAA pre-polymer is capable of strong polymer–solvent interaction presumably due to hydrogen bonding. There was also a possible interaction between the solvent, FS and phosphorus anhydride during the mixing of these fillers in the NMP. The first DSC heat cycle showed a transition at 136°C (only one representative curve shown in Figure 8 for the first cycle of 35%PA-PI/1%FS) which disappeared in the second heat cycle after cooling to room temperature. This transition was probably due to solvent–polymer–fillers interaction. The region above 200°C showed only a small weight loss. This section represents the region in which the PI and PI nanocomposites were thermally stable. The slight weight loss in this region could be due to the removal of the residual amounts of water and solvent and/or decomposition of low-molecular-weight polymers. 42 The onset of sample degradation temperature was above 600°C for all systems. The maximum decomposition rate for all the samples was around 660°C. The decomposition continued at slower rates until the polymers were completely disintegrated at ∼800°C. The residue of the neat PI was negligible and it was less than 17% in case of 45% PA-PI/1% FS and around 8% for 45% PA-PI samples due to the presence of the inorganic fillers.
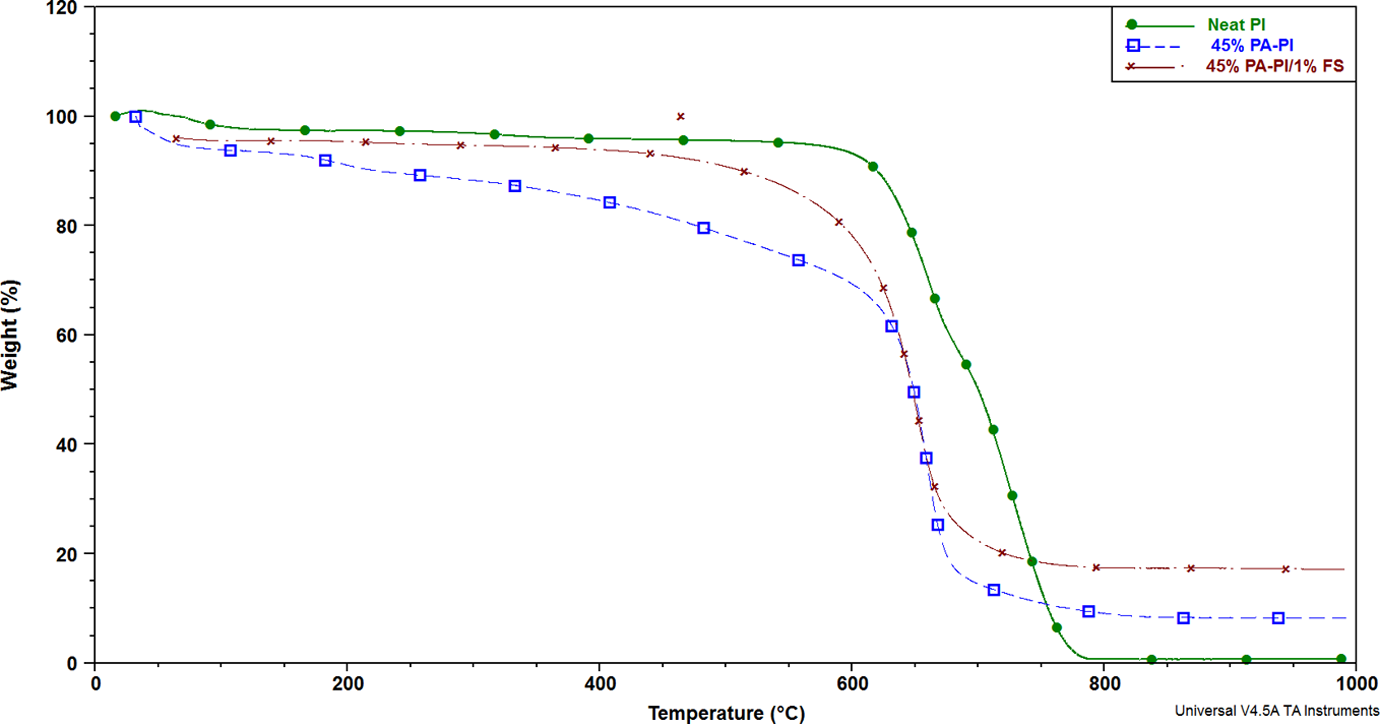
TGA scans of the neat PI, PA-PI, and PA-PI nanocomposite membranes with 1% fumed silica. TGA: Thermal gravimetric analysis; PI: polyimide; PA: phosphoric anhydride.
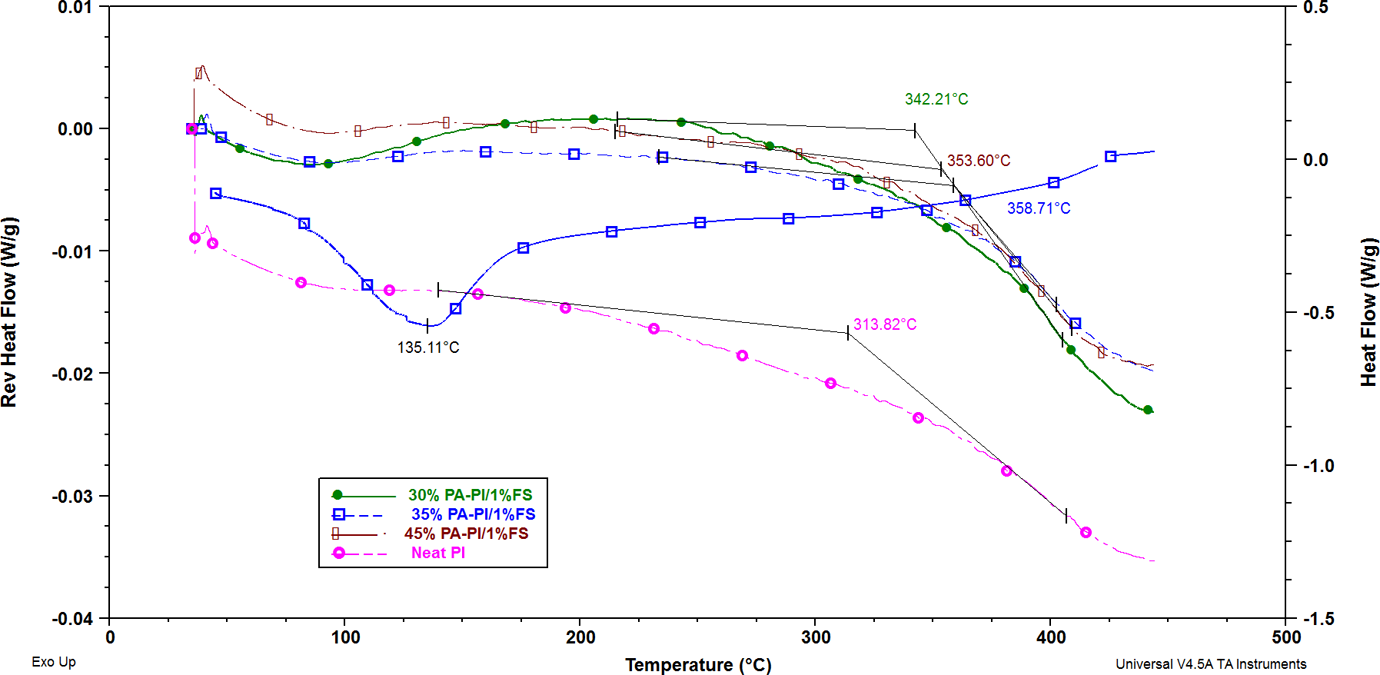
DSC second thermal scans of the neat PI, PA-PI, and PA-PI/FS nanocomposite membranes and first thermal scan for 35% PA-PI/1% FS. DSC: differential scanning calorimeter; PI: polyimide; PA: phosphoric anhydride; FS: fumed silica.
The glass transition temperature, Tg , of the neat PI, the 45% PA-PI and the 1% FS/PA-PI samples was measured using MDSC as shown in Figure 8. The results showed that the Tg for both the PA-PI and the PA-PI/1%FS nanocomposites were observed at higher temperatures compared to the pure PI. The higher Tg values recorded for the 45% PA-PI/1% FS nanocomposites can be explained on the basis of varying amounts of free volume available in different samples. 43 This phenomenon can be explained by the decrease in the free volume of polymer due to the addition of FS nanoparticles, which will restrict the mobility of the polymer chains and hence require more energy to activate the segmental motion of the chains. Consequently, samples containing FS showed a higher Tg due to these requirements. 44
Conclusions
The loading effects of FS nanoparticles, at different P2O5 concentrations, on proton conductivity at higher temperature were studied. Based on the finding of this study, it is evident that the prepared membrane samples containing PA-PI and FS exhibit significant improvement in proton conductivity and enhanced thermal stability that are suitable for high-temperature applications. A 45% PA-PI membrane with 1% FS loading showed the highest proton conductivity of 2.78 × 10⁻⁴ S/cm at 80°C. The strength of the 1% FS/PA-PI was comparable to Nafion membranes (21 MPa). Thermal analysis revealed that the Tg of the 45% PA-PI/1% FS was higher than that of the neat PI membrane. Based on proton conductivity and thermomechanical analysis, the 45% PA-PI with 1% FS loading seems to have the optimal membrane properties.
Footnotes
Acknowledgements
Dr. Adriane Ludwick, Adjunct Professor of Mechanical Engineering at Tuskegee University is gratefully thanked. Dr. Lazbourne Allie and Mr. Jim Muller, of Johnson Research & Development are also acknowledged for their comments and feedback.
Funding
The authors like to acknowledge Johnson Research and Development Company Inc/ US Army SMDC for their financial support.