
Abstract
In this work, the effect of four factors including the nanoclay (NC) content, polyamide 6 (PA-6) content, compatibilizer type, and amount, as material variables on barrier properties of different high-density polyethylene (HDPE)/PA-6/clay nanocomposites, was described. Response surface method was used as a tool for experimental design. Different PA-6/clay nanocomposites were prepared by melt mixing of PA-6 at different clay loadings using a corotating twin-screw extruder. Subsequently, different PA-6/NC compounds containing different amounts of clay were melt mixed with HDPE to produce blow-molded containers under fixed processing conditions. In order to model the permeability, a neural network modelling approach in combination with a modified version of differential evolution was employed. The differential evolution modifications included, among others, a local search procedure based on backpropagation. The best models determined had a mean squared error in the testing phase of less than 0.1 and an average relative error lower than 12.2%, the difference between experimental results and predictions being within an acceptable range. This indicates that the methodology used was able to efficiently model the considered process.
Introduction
In packaging and container industries, using plastic materials (with good barrier properties) has many advantages over metal and glass. 1 Most pure polymers are not proper candidates for packaging applications; for instance, although high-density polyethylene (HDPE), the most widely used resin in the application of gasoline tanks, exhibits excellent barrier properties against moisture, it has poor barrier properties for hydrocarbons. On the other hand, polyamide 6 (PA-6) has high permeation resistance against oxygen and hydrocarbons but poor barrier properties in the presence of moisture. As a result, blends of polyolefins with polyamides are particularly attractive to produce new materials with desired properties, because it is theoretically possible to combine the excellent moisture barrier properties of the former with the exceptional oxygen permeation resistance of the latter.
There are several ways to improve the permeability resistance of polymers against solvent and gases. Among them, co-extrusion or lamination process is a production method that delivers high degree of impermeability for materials used in packaging applications. To avoid the difficulties associated with this process, improvement in barrier properties through the formation of a laminar morphology was introduced. Other successful method to reduce polymeric materials’ permeability is represented by the addition of inorganic nanoparticles. Among different nanoparticles, nanoclay (NC) has gained special interest 2 –5 mainly because of its particular characteristics.
Considering all of the above, nanocomposites based on blends of polyolefins with polyamides are particularly attractive. The key to enhance the properties of a ternary polymer–polymer–NC hybrid nanocomposites such as HDPE/PA-6/NC is proper morphology development between the two polymers and the delamination and dispersion of NC in the polymer matrix. Researchers have shown that NC dispersion and phase morphology of polyolefin/PA-6/NC hybrid nanocomposites are rather complicated and dependent on many factors such as system composition, mixing history, flow field, shear rate, temperature, type and amount of compatibilizer, matrices polarity, rheological and interfacial properties, molecular weight, hydrophobicity, and reactive groups; NC mineral type and aspect ratio, structure and number of alkyl ammonium compound used to modify NC platelets, and adhesion at filler–matrix interface. 6 –10 Considering that numerous studies have been carried out on PA-6 nanocomposites and, on the other hand, fewer efforts have been devoted to HDPE-PA-6-NC hybrid nanocomposites, 11 –14 this article is focused on the latter, the effect of vital parameters on the permeability of the HDPE/PA-6/NC nanocomposites being studied.
The properties of HDPE/PA-6/NC depend on morphology development between the two polymers and dispersion of NC in the polymer matrix. Regarding the importance of the improvement in material barrier properties, the analysis of adding different materials to HDPE is worthwhile, as different materials with various useful properties can be obtained. The characterization and property identification of these blends were scarcely performed 11,15 and therefore, in this study, the effect of vital formulation parameter (including NC and PA-6 content incorporated with compatibilizer content and type) on the barrier properties of the HDPE/PA-6/NC nanocomposites was investigated.
The planning of the experiments was performed by using a design of experiment (DOE) approach. Literature provides numerous studies where DOE (simple or in combination with other approaches) was efficiently used for chemical engineering problems, 16 –18 its performance being the main motivation for choosing for the current study. Among several methods of DOE, Box–Behnken method was employed to explore the effects of four key formulation parameters on the permeability of melt-blended nanocomposites. It is important to consider individual as well as simultaneous effects of the studied parameters on the permeability. The Box–Behnken design considers interactions between the parameters that cannot be assumed in three 3-level factors of Taguchi method.
In addition, in order to model the process, artificial neural networks (ANNs) were used in combination with a hybrid differential evolution (DE) algorithm. ANNs are inspired from the neuroscience knowledge, being simplified mathematical structures that try to mimic the way in which the brain works. They have good characteristics and, due to their capability of universal approximator, are suitable for modelling high nonlinear relations. 19 Their structure can vary and therefore, they can be more representative than the empirical models. Also, ANNs do not require inner knowledge about the studied system. 20 These properties make them good alternatives, especially when the development of phenomenological or regression models is problematic, impractical, or too complex. 21 Consequently, ANNs are widely used (in simple variants or combined with other approaches) to model different types of systems, in the chemical engineering area being applied for a multitude of problems. 22 –30 On what concerns the polymerization process, various aspects were modeled and optimized with ANNs. 31 –36 Although multiple types of ANNs were developed, the majority of publications are based on the feed-forward neural network and especially on feed forward multilayer perceptron (MLP) neural networks.
The novelty of this work consists in the application of DOE and of a hybrid DE–ANN technique to plan the experiments and to model the barrier properties of different HDPE/PA-6/clay nanocomposites. To the authors’ knowledge, polymer-processing aspects were not considered yet by other researchers, this representing the main motivation of the current study. The application of artificial intelligence techniques for process optimization can result in good models, which in their turn, can provide a great depth of knowledge about the influence of parameters, as well as predict the permeability via statistical comprehensive curves.
Methods and materials
Experimental
Materials
For the continuous phase, HDPE (5209) supplied by Sabic was chosen. It is a blow molding grade polymer with density of 0.952 g/cm3 and melt flow index of 0.9 g/min (190°C, 21.6 kg). The PA-6 used in this work was B5 from BASF (Germany). The nanofiller was Nanofil®9, with stearyl benzyl dimethyl ammonium cation, by Southern Clay Products (Houston, Texas, USA) with good adhesion to PA-6. Since HDPE and PA-6 are incompatible, different compatibilizers (Fusabond EMB100D, Lotader AX8840, and Orevac18302 N from DuPont (Wilmington, Delaware, USA), Atofina (France), and Arkema (France) companies, respectively) were used to improve the interfacial adhesion between polyethylene and PA-6 phase.
Sample preparation
Through an extensive evaluation of the affecting parameters, 4,37 it was decided to study four design parameters (NC content, PA-6 content, compatibilizer content, and compatibilizer type) at three levels. Employing the Box–Benhenken method, the most appropriate approach is a 27-trial set points. Based on these results, the Minitab software (version 16) was used for designing the experiments. Table 1 shows the different levels of variable parameters used in this study, which are obtained after initial screening runs. The details of different runs are shown in Table 2, where the run numbers are considered as sample codes prepared according to the conditions reported.
Levels of variable parameters.
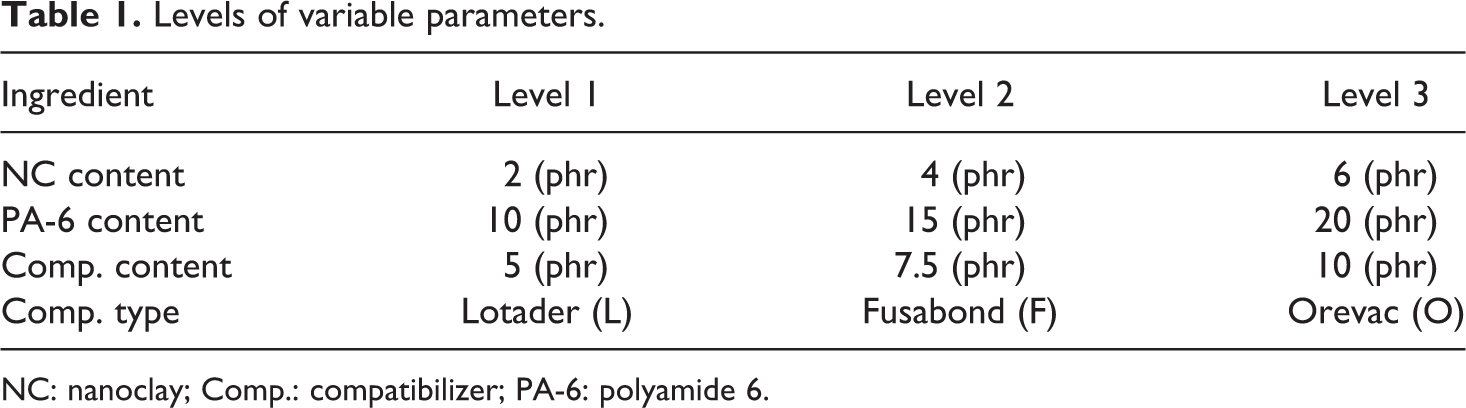
NC: nanoclay; Comp.: compatibilizer; PA-6: polyamide 6.
Formulations design according to the Box–Benhenken method.

Comp.: compatibilizer; PA: polyamide; NC: nanoclay.
All materials containing PA-6 were dried in an oven at 90°C for a minimum of 16 h. PA-6/NC nanocomposites with given NC loadings were prepared by first tumble-blending PA-6 pellets and NC powder at dry conditions followed by melt mixing using a ZSK corotating twin-screw extruder (L/D = 40, D = 25 mm) manufactured by Coperion (Germany), at screw speed of 600 r/min, feeding rate of 7 (r/min), and melt temperature of 235°C. The employed screw design includes two high-mixing zones using kneading elements to enhance the dispersive and distributive mixing in the system and the extruder was equipped with a circular die.
After dehumidifying the prepared pellets, different bottles were produced using an industrial blow molding machine with a screw diameter of 50 mm (L/D = 30; D = 60 mm) at die temperature of 235°C. The formulations design according to the response surface method is shown in Table 1.
Characterization
The barrier properties of the blow-molded HDPE/PA-6/NC bottles were determined by measuring the weight loss (WL) of the toluene-filled bottles based on ASTM D2684. The bottles were initially filled with 500 g of the toluene. The steady state WL of toluene was determined after placing the filled bottles inside a temperature-controlled oven at 50°C for 21 days. Presumably, steady-state permeation rates are required in order to compare barrier properties of various samples. Therefore, the steady state permeation rates were used to evaluate the barrier properties of all samples used in this study. The toluene permeation rate of each of the samples was estimated based on the average permeation rate of five samples.
There are many ways to express permeability. Among them the WL of each bottle measured every day is monitored. Another way to express the permeability (P) is that the measured solvent WL can also be multiplied by the ratio of the “thickness to the surface” of the bottle.
Modelling procedure
General aspects
In order to model the considered process and to obtain relevant and useful predictions, a procedure combining ANNs with a powerful evolutionary algorithm (EA) is applied. The motivation for employing a mix of algorithms and not a simple ANN modelling approach is based on: (i) although easy to use, ANNs are difficult to set-up; (ii) the rules used for selecting a good topology are somewhat contradictory and do not work in all the cases; and (iii) the performance of the ANN is highly dependent on the topology and the training procedure. One of the approaches used to overcome these problems or to diminish their effect is to use an EA to evolve the network, in this context, evolution being another form of adaptation. 38 It’s advantages are as follows: (i) several features can be encoded and evolved simultaneously, (ii) the performance criterion is much more flexible than an error function, and (iii) evolution can be combined with other learning algorithms. 39 Also, the evolutive process has the ability of escaping local minima and is capable to adapt to the changing environment. 40
Evolution was introduced in the ANNs at different levels: (i) connection weights (an alternative to the classical training procedures), (ii) architecture (the topology is adapted without human intervention), (iii) learning rules (learning to learn), and (iv) node behavior (type and characteristics of the activation functions specific to each neuron). 41 The algorithm employed in this work evolves simultaneously three aspects: weights, architecture, and node behavior. It is called SADE-NN-2 42 and it is based on a DE, an EA inspired from the Darwinian principle of evolution.
The motivation for choosing a DE-based approach in detriment of other EAs consists in: (i) high performance, (ii) reduced number of parameters (and therefore requires little parameter tuning), (iii) low complexity, (iv) easiness of implementation, and (v) applicable to a wide range of problems. 43 –45
Like every EA, DE starts with a pool of potential solutions that are evolved through mutation, crossover, and selection until a stop criteria is reached. Mutation is the step in which, to a base vector a scaled differential term is added, requiring at least three individuals. 46 The simplest form of mutation is described in equation (1).

where, ω i is the ith element from the mutated population, α is the base vector, β is the differential term, and F is the scaling factor (which is one of the control parameters of DE).
After mutation, the next step consists in combining elements from the mutated and initial population. This is called crossover and DE has two types of crossovers: binomial (equation 2) and exponential.
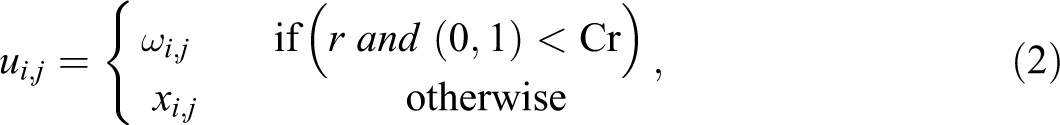
where, ui is the trial vector (resulting after the crossover operation) and xi is the ith individual from the current population. Cr represents the crossover probability and is one of the DE control parameters.
The final step, selection, represents the mechanism in which the next generation is selected. 43 The DE classic version uses a “one-to-one” criteria in which the trial vectors and the current individuals compete for survival.
The algorithm used to optimize the ANN models is based on the DE algorithm, but compared to the classical version it has a series of improvements designed to raise its efficiency and to generate better-suited solution. The entire combination is called SADE-NN-2 and was developed initially for monitoring and controlling a pharmaceutical freeze-drying process. 42 Because the methodology was effective and provided good results, in this work, it was applied to model the influence of different parameters on WL and P.
SADE-NN-2
SADE-NN-2 is a powerful algorithm designed to be flexible and efficient, being successfully applied for different chemical engineering problems. 20 –22 Its success lies in: (i) a simple combination between DE and ANNs and (ii) performance improvements added to DE.
The combination DE–ANN is realized using a simple direct encoding in which the parameters of the ANNs are coded (using real-value numbers) into structures (vectors) easily understood by the optimization procedure. The DE has the role of modifying the selected parameters based on the fitness value computed using the predictions of the corresponding ANN.
On what concerns the improvements added to DE, these include: (i) use of opposition-based principle for initialization, (ii) introduction of a self-adaptive procedure to automatically select the best control parameters, (iii) use of a simple principle for improving mutation, and (iv) introduction of backpropagation (BK) as a local search procedure.
The self-adaptive procedure is based on a simple principle, in which the control parameters (F and Cr) are adapted using the same rules employed for the other parameters of the individuals. The motivation for the use of an automatic procedure for determining the control parameters lies in the fact that the control parameters are problem dependent and their identification through manual procedures is time consuming, difficult, and not always provides the best results.
In the case of mutation, the SADE-NN-2 variant used in this work employs a DE/Rand/2/ approach (the base vector is randomly selected, and there are two differential terms participation to the mutation phase). The principle employed in this phase consists in arranging the individuals selected for mutation in the order of their fitness, the base vector being the best among them.
The third element of improvement consisted in the introduction of BK for improving the individuals. As the procedure is a computational resource consumer, especially when applied for a multitude of individuals, the idea is to use this algorithm only once per generation, for the best solution found so far. The simplified schema of the SADE-NN-2 algorithm is presented in Figure 1.
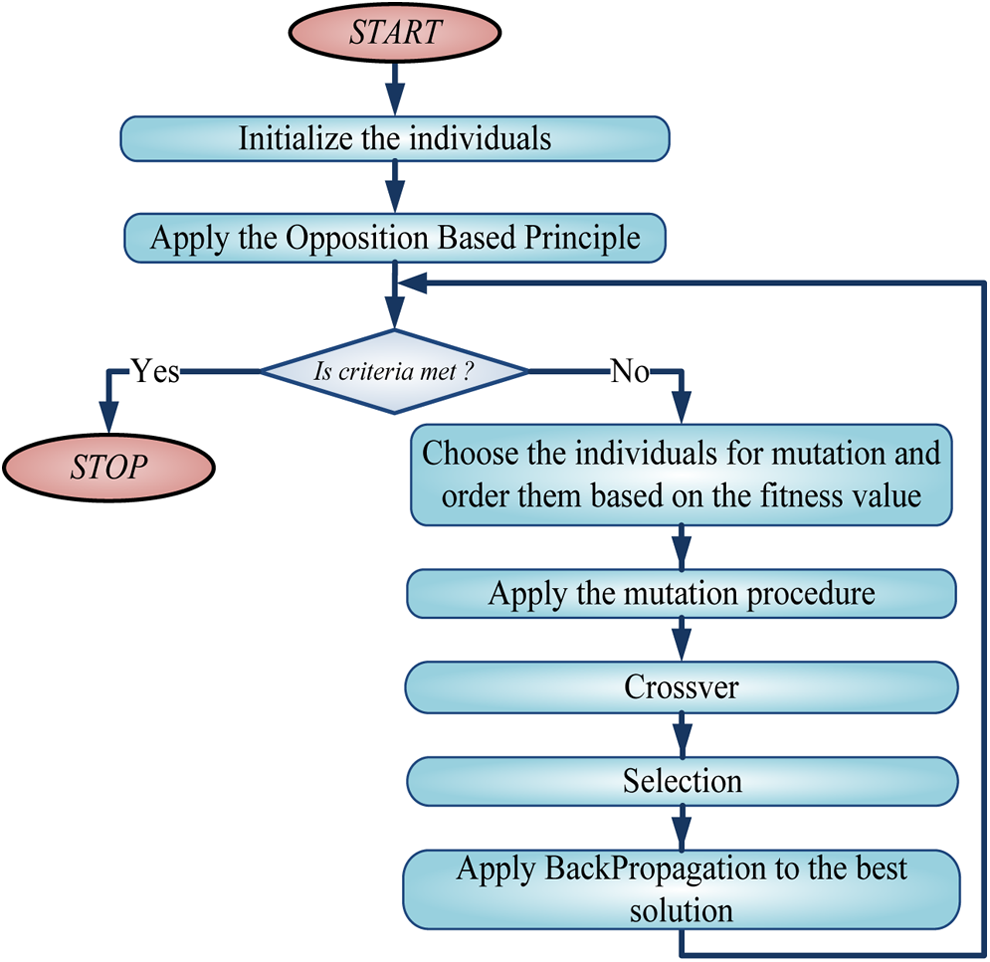
Simplified schema of SADE-NN-2.
Results and discussion
Use of nanocomposites with well-dispersed clay layers can provide good gas and solvent permeation resistance. The objective of this study was using NC to enhance the barrier properties of HDPE/PA-6/NC nanocomposite samples. The experimental results revealed that the nanocomposite samples have lower permeability compared to pure polymer and the barrier properties of the nanocomposites strongly depends on the morphology. Such improvement of the barrier property is being attributed to an optimal orientation of the clay layers during processing.
According to the results, NC can significantly reduce the permeability in the nanocomposites and further prohibit the diffusing molecules from entering into and permeating through the amorphous region of the nanocomposites. The molecules of diffusing material ought to pull apart the clay layers and pass the amorphous regions of PA-6/NC nanocomposites, thus reducing the permeability of the gasoline tubes.
After the experimental data (according to the variation of parameter data from Table 2) were gathered, a normalization procedure was applied in order to reduce all the process data into the [−1,1] interval, assigning the same absolute value to the corresponding relative variation.47 The approach used to perform this action is based on the min–max procedure (equation (3)) and the scope is to improve the performance of the ANN identification. Therefore, all the performance indexes (unless otherwise specified) are computed using the normalized data.

where, x represents the current value, Min() is the minimum of the raw values and Max() is the maximum of the raw values.
In order to assess the performance of the methodology and to identify the best model for the considered process, a series of ten simulations were performed. The results of these simulations are presented in Table 3 where topology was limited (based on the author’s experience) to 15 neurons in the hidden layer, and the search was performed only for one hidden layer. The topology presented in Table 3 is denoted inp:hidd:out where inp represents the number of inputs (corresponding the process parameters), hidd represents the number of neurons in the hidden layer, and out represents the output of the model that is determined based on the inputs. In Table 3, MSE represents the mean squared error computed for the training and testing data, respectively. The fitness function is inversely proportional to the MSE in the training phase and the higher its value, the better the ANN model. The rows colored with gray in Table 3 indicate the best models determined for the two process parameters.
Simulation results.
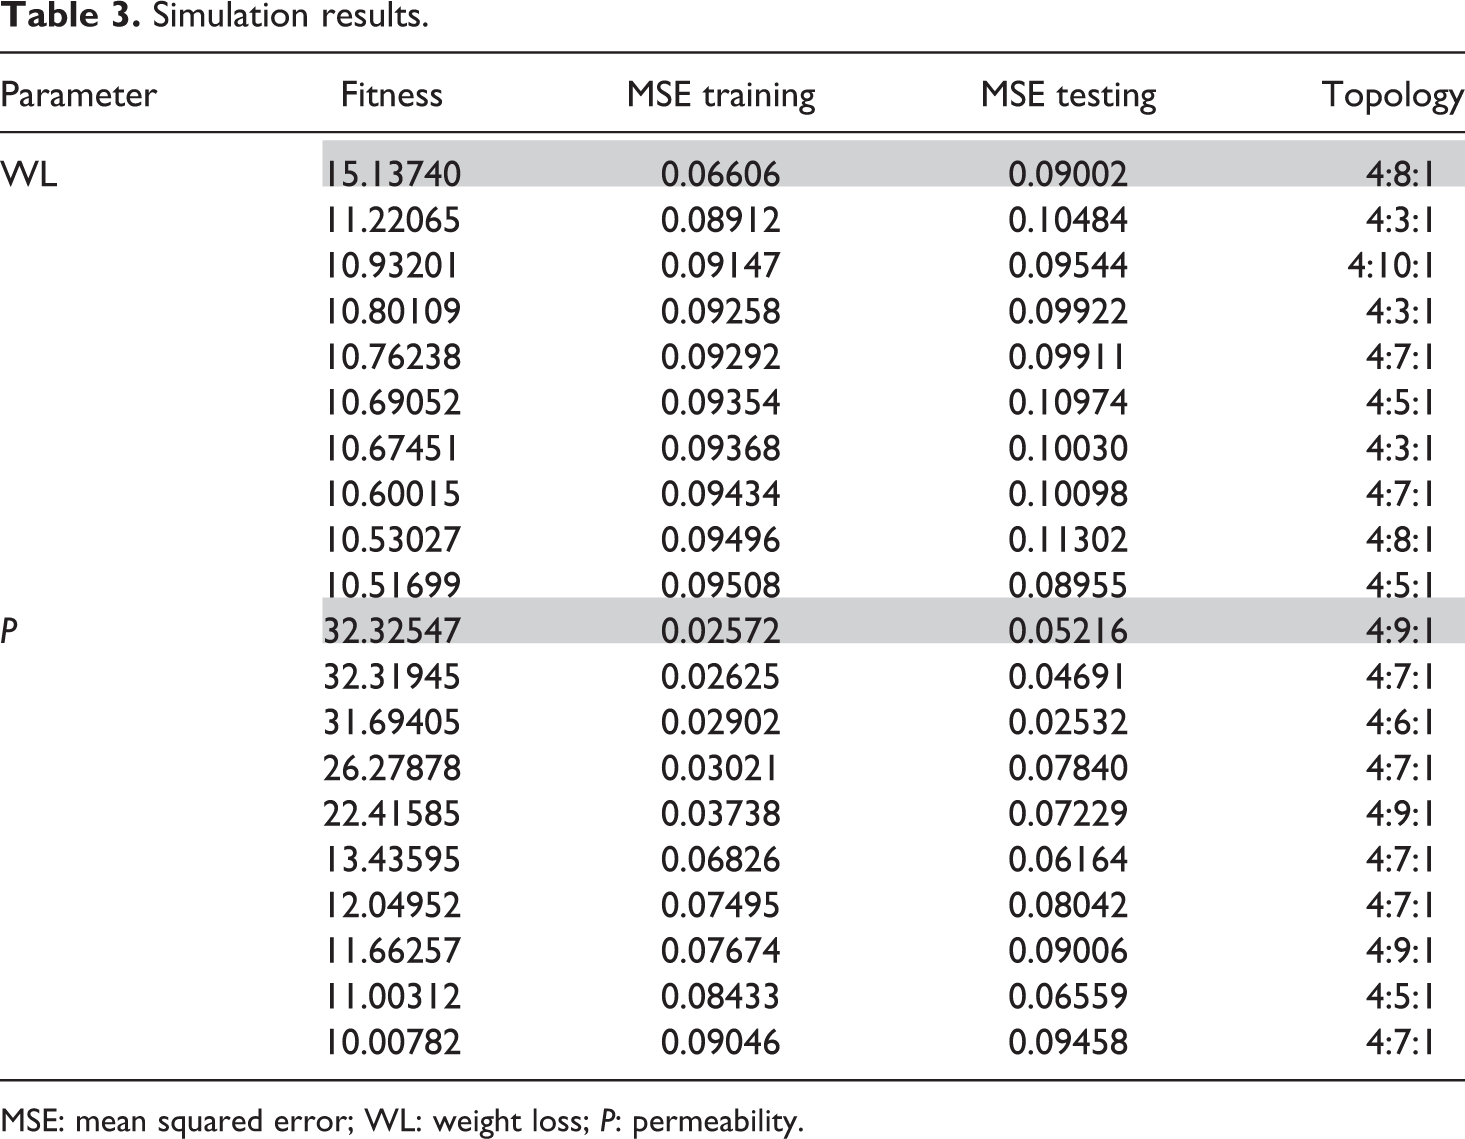
MSE: mean squared error; WL: weight loss; P: permeability.
The best ANN model for the first permeability parameter is 4:8:1, with a MSE in the testing phase of 0.09. On the other hand, the best ANN model for the second permeability parameter is 4:9:1, with a MSE in the testing phase of 0.05. The comparison between the experimental data and the predictions of the ANN models is presented in Figure 2 (for WL) and in Figure 3 (for P).
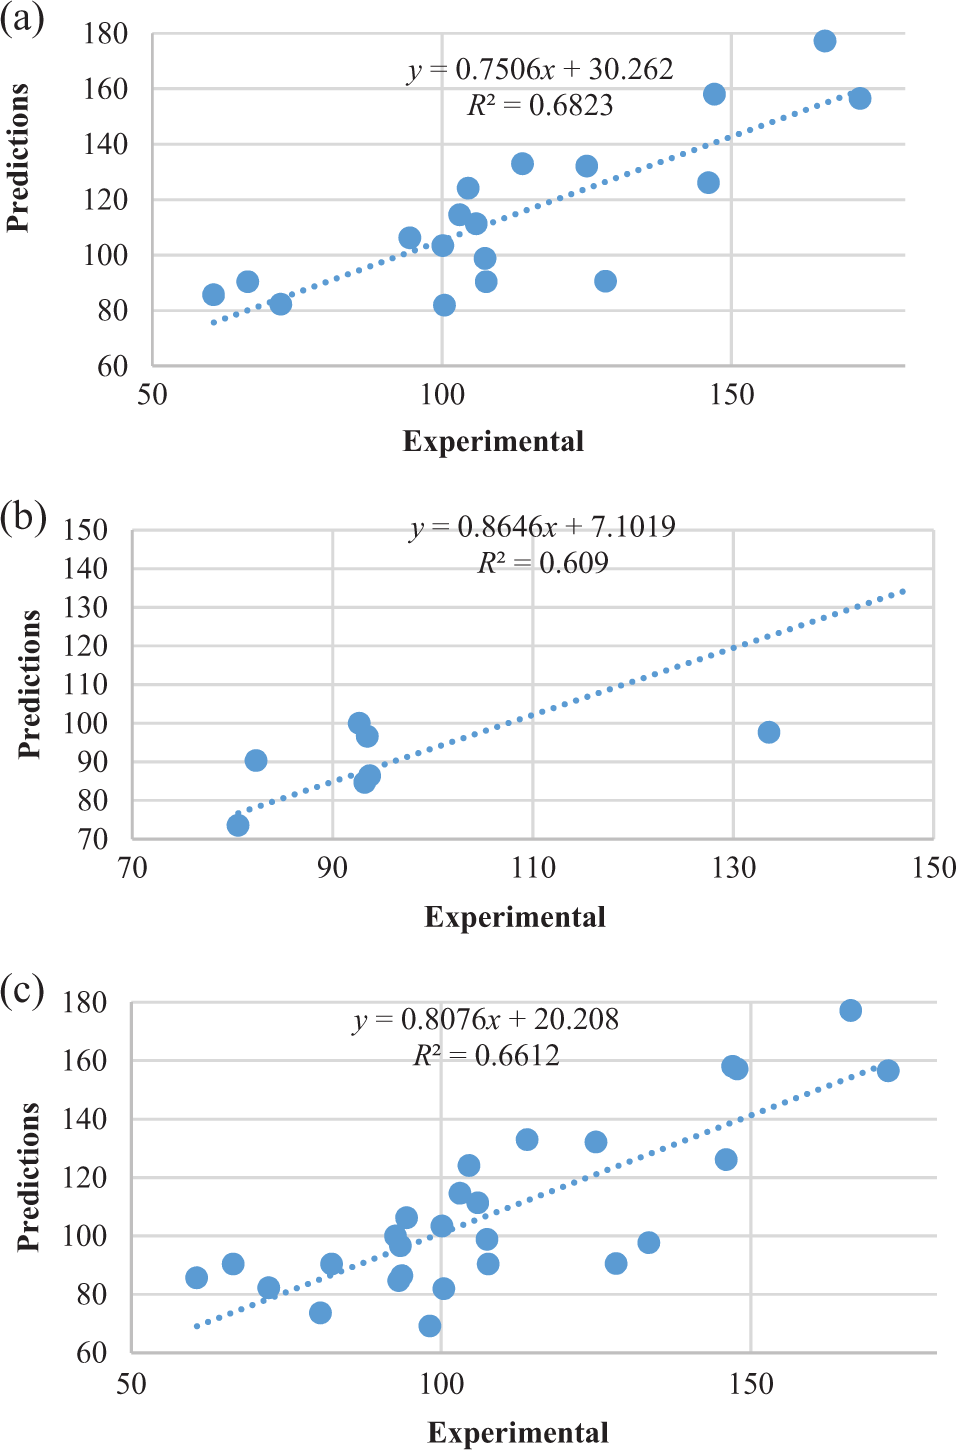
Experimental vs. predictions for WL: (a) testing data, (b) training data, and (c) entire dataset. WL: weight loss.
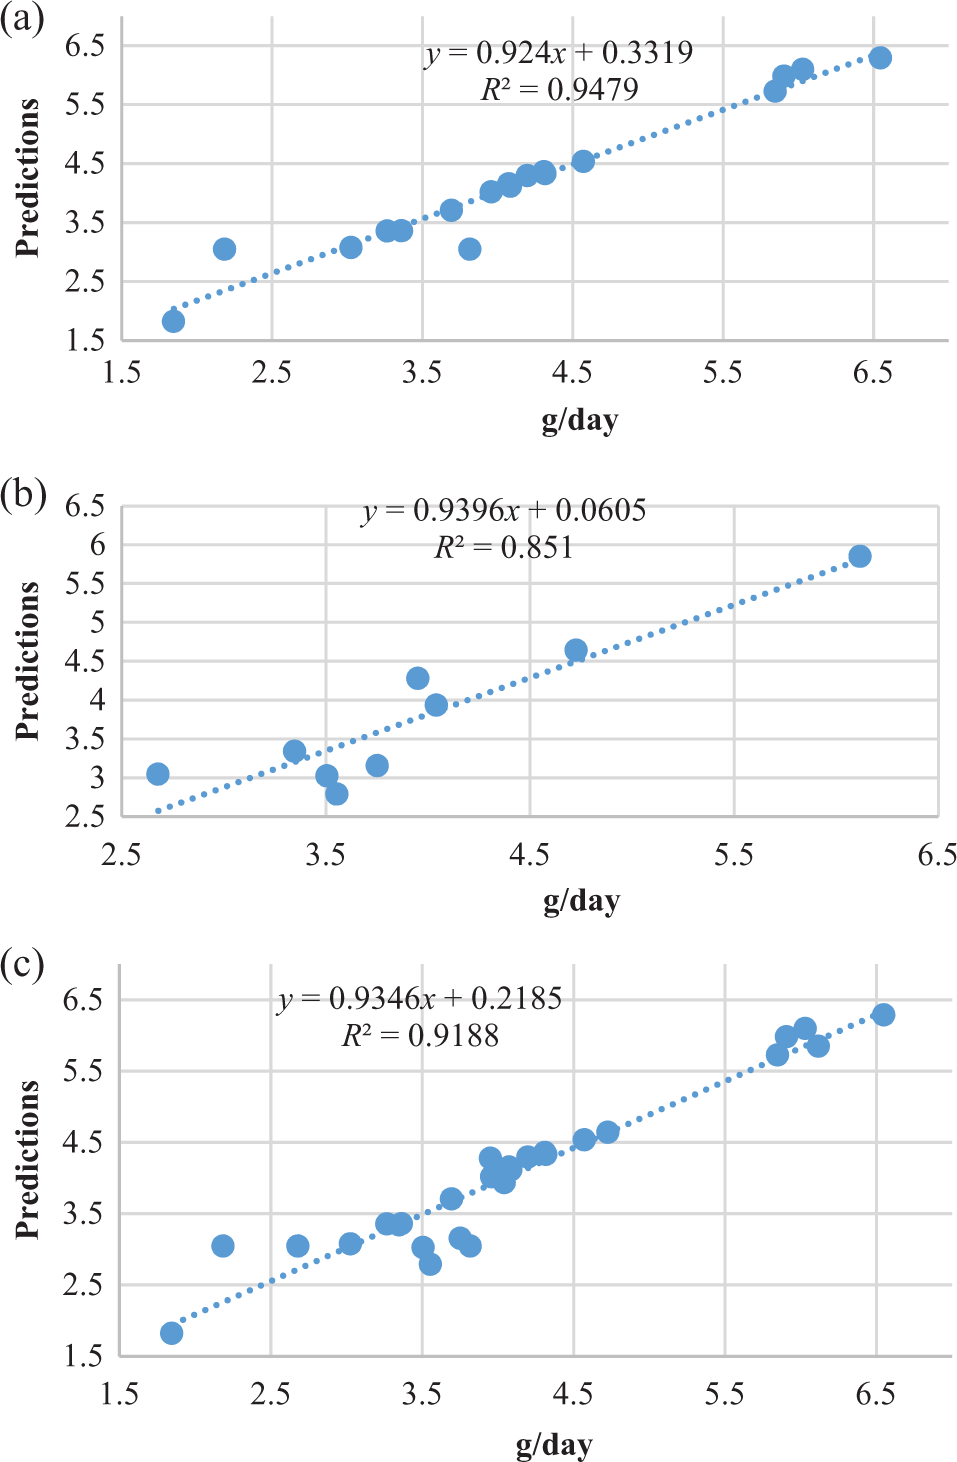
Experimental vs. predictions for P: (a) testing data, (b) training data, and (c) entire dataset. P: permeability.
By comparing the two models (errors from Table 3 and correlations from Figures 2 and 3), it is observed that for P, the model has a higher performance than for WL. This difference in performance indicates that there is a big difference between different measures of the same characteristics, WL measure being more difficult to model by the ANN approach.
In order to assess the performance of the two models determined with the DE-based methodology, a widely available tool represented by the Regression approach from DataAnalysis module of the Excel 2013 was used to create a regression model for the two parameters of the process. The coefficients of the determined regression models are presented in Table 4.
Coefficients of the regression models determined for WL and P.
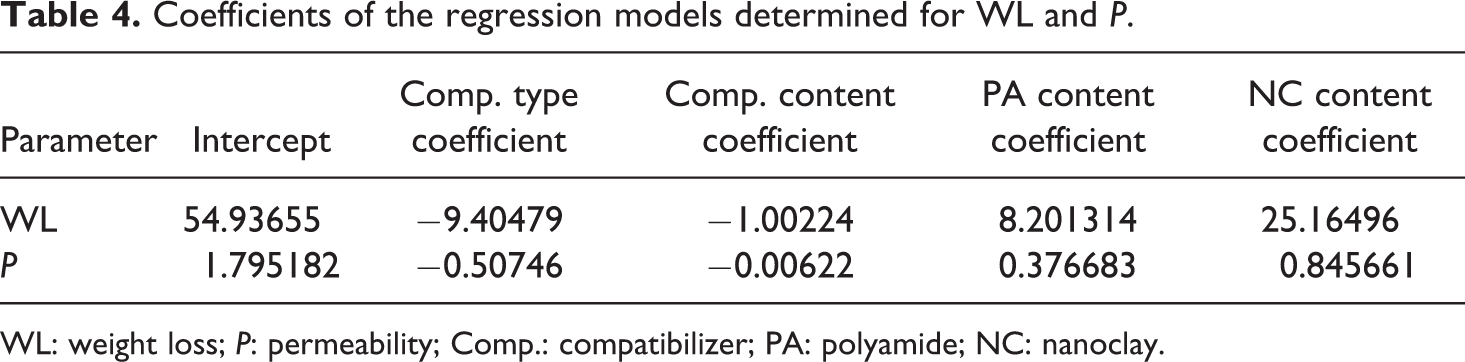
WL: weight loss; P: permeability; Comp.: compatibilizer; PA: polyamide; NC: nanoclay.
For each parameter, for each model (DE based and regression) the average absolute relative error (AARE) was computed. In case of WL, for the testing data, AARE had a value of 12.14% (ANNs) and 20.89% (regression), while in case of P, AARE was 9.12% (ANNs) and 26.97% (regression). As it can be observed, the best models determined are represented by the ANNs, the regression approach not being able to efficiently capture the relations between the considered process parameters.
Along with these results, the models determined are able to predict new values of WL and P for parameters that were not experimentally tested. In this manner, the researcher can have a better understanding of the influence of process characteristics on permeability and the necessity of a high number of experiments is reduced. However, in order to have good predictions, the model with the best performance must be chosen. For the considered study, the ANN optimized with DE provided the best results (as indicated by the AARE errors), which points out that although more laborious than regression, the ANN models are better suited to the considered process.
Conclusions
In this work, the influence of different material parameters (compatibilizer type, NC content, percent of compatibilizer in the sample, and the PA-6 content) on the barrier properties of HDPE/PA-6/NC nanocomposites were experimentally and numerically investigated. The experiments were planned using a DOE approach represented by Box–Benhenken, the combinations generated covering a 27 possible combination between the selected parameters.
In order to model the considered process, a neural network approach was employed. The optimal topology and internal parameters of the neural models was determined by DE, which acted as an optimizer, the predictive capabilities of the ANN being improved. The simulation results pointed out that the ANN models determined by the DE-based methodology efficiently captured the relations between the considered parameters, the best model for WL having an average relative error of 12.14% and 9.12% for P. In order to test if the classical approaches provide better results that the proprietary approach, a classical regression approach was applied on the same experimental data used for ANN determination. The predictive capacity of the regression models determined was worse than of the ANNs (with an average relative error of 20.89% for WL model and 26.97% for P model). These results proved the superiority of the ANN approach, which, although more complex and more difficult to use than the simple regression, provides better results.
Footnotes
Declaration of conflicting interests
The author(s) declared no potential conflicts of interest with respect to the research, authorship, and/or publication of this article.
Funding
The author(s) disclosed receipt of the following financial support for the research, authorship, and/or publication of this article: This work was partially supported by the “Partnership in priority areas – PN-II” program, financed by ANCS, CNDI – UEFISCDI, project PN-II-PT-PCCA-2011-3.2-0732, No. 23/2012.