





Abstract
In this study, series of blends were prepared by blending unextracted polyamide-6 (PA6) and thermoplastic ester elastomer (TPEE) in certain ratios. The morphologies, thermal behaviors, and mechanical properties of blends have been investigated. Scanning electron microscope results revealed that the morphology of blends was improved significantly when the content of TPEE is less than 50 wt%. Tensile fracture surface images confirmed reactive compatibilization and stress-induced crystallization in blends. The effect of unextracted PA6 content on the elasticity and tensile strength of blends was also studied, and higher elongation rate at break and breaking strength could be achieved when the content of TPEE is ≥50 wt%. The most interesting finding in this study is that the glass transition temperature for rubber phase of blends shifts to lower temperature and decreases with the increase of unextracted PA6 content at certain ratios range.
Keywords
Introduction
Thermoplastic elastomers (TPEs) 1 –10 are block copolymers prepared by chemical reactions or physical blending. They generally have two phases, where one part is rubber (soft phase) and another part is plastic (hard phase), which is an essential feature of all TPEs. The hard section provides good plasticity to the material, and the soft section endows the material with outstanding elasticity. This kind of material is of significant commercial interest due to its excellent elastomeric behavior at the service temperature, and it can be melt-processed at elevated temperatures.
The most important approach to obtain TPEs is using chemical reaction. 11 –13 However, the expensive price and poor thermal stability of most synthesized TPEs restrict their application extending. Another approach involves melt blending elastomeric materials with cheaper rigid plastics could improve the thermal performances and reduce the price, but most polymer blends consist of thermodynamically immiscible components and the resulted multi-phase morphology has a considerable influence on the mechanical properties of blends. To increase the compatibility of components and improve their performance, crosslinking agents and compatilizers are used widely in preparing TPEs’ blends. 14 –28
An attractive approach is to use chemical reactivity of component polymers to improve the morphology and performances of blends. 17–18 As one of the important modifiers, polyamide-6 (PA6) was used to enhance the mechanical performance of TPEs in the previous studies. The amino/carboxyl end-groups of PA6 and its linear oligomers can react with the active end-groups of TPEs during extruding and molding process, the new formed chemical bonds between PA6 and TPEs can enhance the miscibility and mechanical properties without additional compatibilizer. 19 –23,29
As an important member of the TPE family, thermoplastic ester elastomers (TPEEs) 30 –36 can be processed into end-products at elevated temperature, and their mechanical performance can be modified through blending 36–37 with rubbers, resins, TPEs, and so on. However, like some other TPEs, the high price of TPEEs restricts their application to an extent. One possible way is to blend TPEE with other cheaper materials in a suitable ratio range without significantly decreasing the mechanical properties. The reactive PA6 is a potential material for blending with TPEE to form new blends with good performances.
Thus, in this study, we are interested in investigating the blends prepared by PA6 with 10 wt% extractables (the so-called unextracted PA6 and henceforth denoted by UPA6) and TPEEs consisting of poly(tetrahydrofuran terephthalate) hard segment and poly(tetramethylene glycol) soft segment. In this article, the morphology and mechanical performance of blends prepared by mentioned TPEEs and UPA6 have been studied carefully. Some interesting experimental results and phenomena have been observed and analyzed.
Experimental
Materials
TPEEs with brand name of HP35 (Iv = 0.79 dl g−1) and HP47 (Iv = 0.74 dl g−1) were received from Sinotex Investment & Development Co., Ltd. (Wuxi, China) UPA6 (round chips, η r = 2.22, extractables=11.2 wt%) were presented by Ningbo Shunlong Polyamide Co., Ltd. (Ningbo, China).
Preparation of blends
TPEEs and UPA6 were mixed on mass ratio (UPA6:TPEE) of 1:4, 3:7, 2:3, 1:1, 3:2, 7:3, and 2:1 in advance and dried in vacuum oven at 100°C for at least 12 h. These mixtures were then extruded by co-rotating twin screw extruder (TSE-18A, D = 18 mm, L/D = 36) equipped with vacuum suction and cut into regular chips. In due course of extruding each batch mixture, a piece of 5–10-cm long strip was selected for scanning electron microscope (SEM) analysis. Chips were then dried in vacuum oven at 100°C for 12 h for the following molding processing.
Scanning electron microscope
The fracture surface morphology of the blends was observed under an SEM (JSM-5600LV, Japan). The samples prepared in extruding process and molding process were coated with gold to prevent charging on the surface. SEM was operated at 15 kV.
Strain–stress
Chips were made into dumbbell-shaped specimens by using Arburg-H manual injection molding machine. Strain–stress properties were determined by WDW3020 electric universal testing machine at room temperature and the crosshead speed was varied from 20 mm min−1 to 40 mm min−1.
Dynamical mechanical analysis
Chips were added to the Arburg-H manual injection molding machine to make dynamical mechanical analysis (DMA) test samples. The torsion behavior was studied at a frequency of 1 Hz, a strain of 0.1%, and a heating rate of 3°C min−1 using a Myrenne ATM3 torsion pendulum. The glass transition temperature (T g) was given by the peak value of tan δ curve.
Differential scanning calorimetry
Differential scanning calorimetry (DSC) spectra were recorded on a PerkinElmer DSC7 apparatus (USA), equipped with a PE7700 computer. The scans were run with samples ranging from 5 mg to 10 mg from 30°C to 240°C with a heating rate of 10°C min−1 under nitrogen protection.
Results and discussion
Morphology
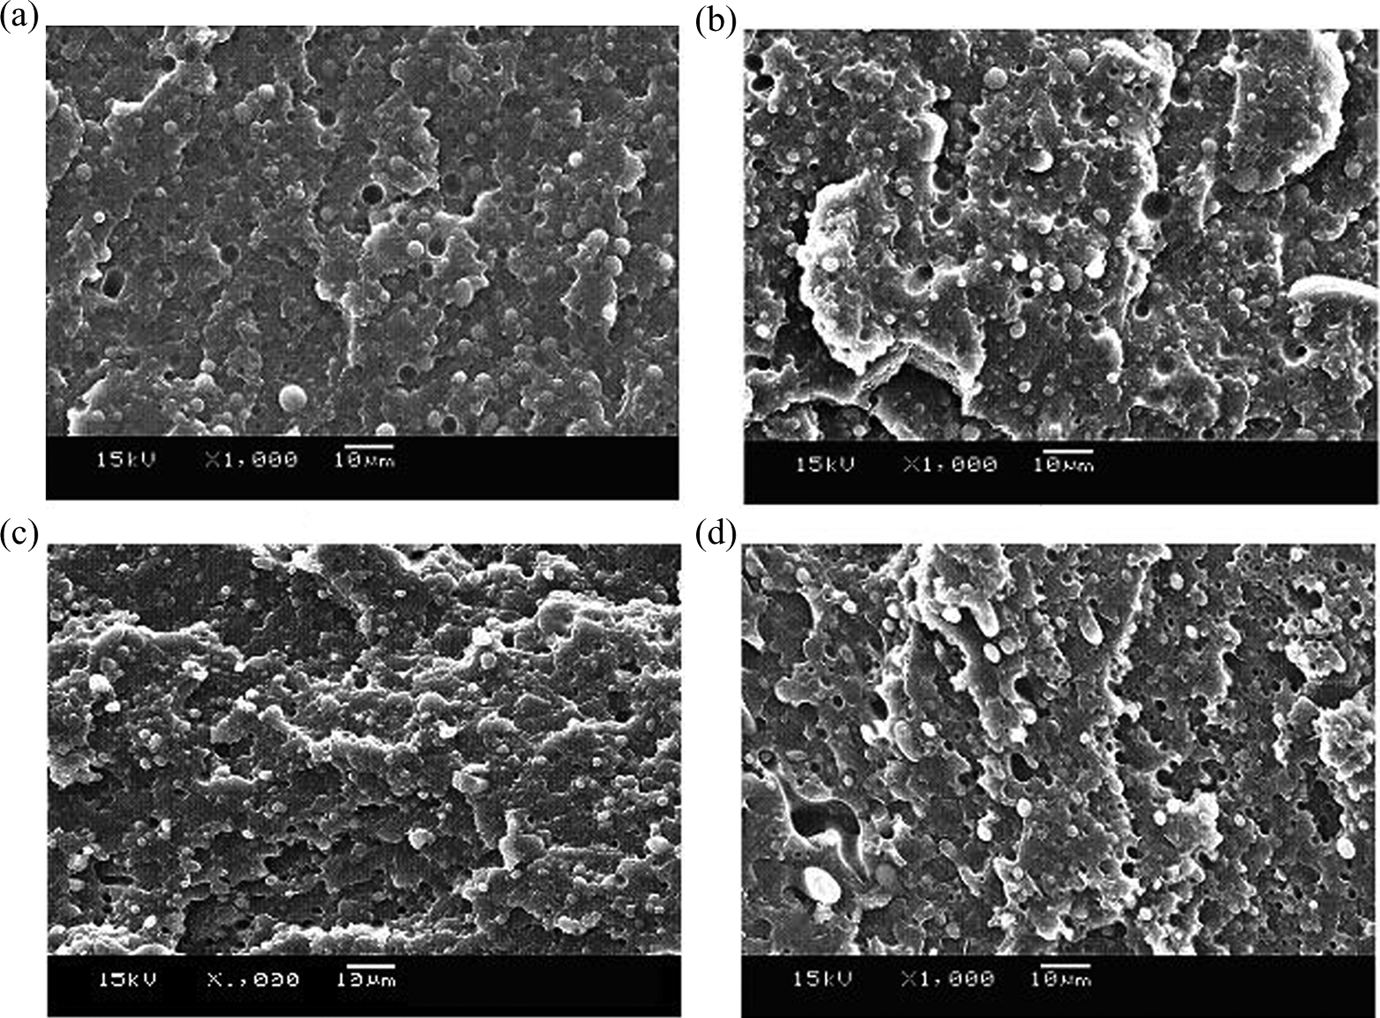
Figure 1 shows the morphology of blends after extruding. UPA6 disperses in HP35 evenly when the content of UPA6 is <50 wt% and the regular and round UPA6 particles tightly embedded in rubber phase (Figure 1(a) and (b)). However, when the content of UPA6 is over 50 wt%, UPA6 particles dominate the fracture surface, the size, and amount of UPA6 particles increase obviously as shown in Figure 1(c) and (d); in the meantime, many holes can be observed due to the dripping of particles. Figure 1(c) presents the worst morphology when UPA6 mixes with HP35 at ratio of 1:1, globular particles which are proved to be TPEE afterwards disperse on surface of the matrix loosely.

SEM images of fracture surface for UPA6/HP35 blends after extruding: (a) 20% UPA6/80% HP35, (b) 40% UPA6/60% HP35, (c) 50% UPA6/50% HP35, and (d) 60% UPA6/40% HP35. SEM: scanning electron microscope; UPA6: unextracted PA6.
The morphology of blends was improved by molding at temperature of 220–230°C, especially when the mixing ratio of UPA6 and HP35 is ≥1.
As shown in Figure 2, the number of particles covering the matrix decreases a lot; in the meantime, the holes also reduce after compression. Over ratio range, particles are tightly embedded in rubber phase while the shape and size change obviously after compression. When UPA6 content is <50 wt%, the dispersed particles still remain round, and there is very little change in their size and shape, this might be due to the high crystallinity and hardness of UPA6 which make it more difficult to deform during compressing process (Figure 2(a) and (b)). However, when the content of UPA6 increases to more than 50 wt%, the matrix is dominated by UPA6 as the continuous phase and soft globular HP35 particles disperse in the matrix are prone to deform after compression and make the particles change from round to oval. Okada et al. 38 reported that the phase inversion composition was about 50 wt% and the rubber phase were elongated in both perpendicular and parallel directions in his study, which is consistent with our results.
SEM images of fracture surface for UPA6/HP35 blends after molding: (a) 20% UPA6/80% HP35, (b) 40% UPA6/60% HP35, (c) 50% UPA6/50% HP35, and (d) 60% UPA6/40% HP35. SEM: scanning electron microscope; UPA6: unextracted PA6.
To better observe the change of particles, the corresponding area of Figure 1(c) and (d) and Figure 2(c) and (d) was magnified to 5000 times, as shown in Figure 3. During the brittle fracture treatment, the blends before compression are easy to produce cracks (see the black circle in Figure 3(a) and (b)) under the external force and result in the dispersed particles more easily to drip. The compression could compensate for the limits; after being compressed in molding process, the interface between particles and matrix looks more perfect (appearing as the black box in Figure 3(c) and (d)).
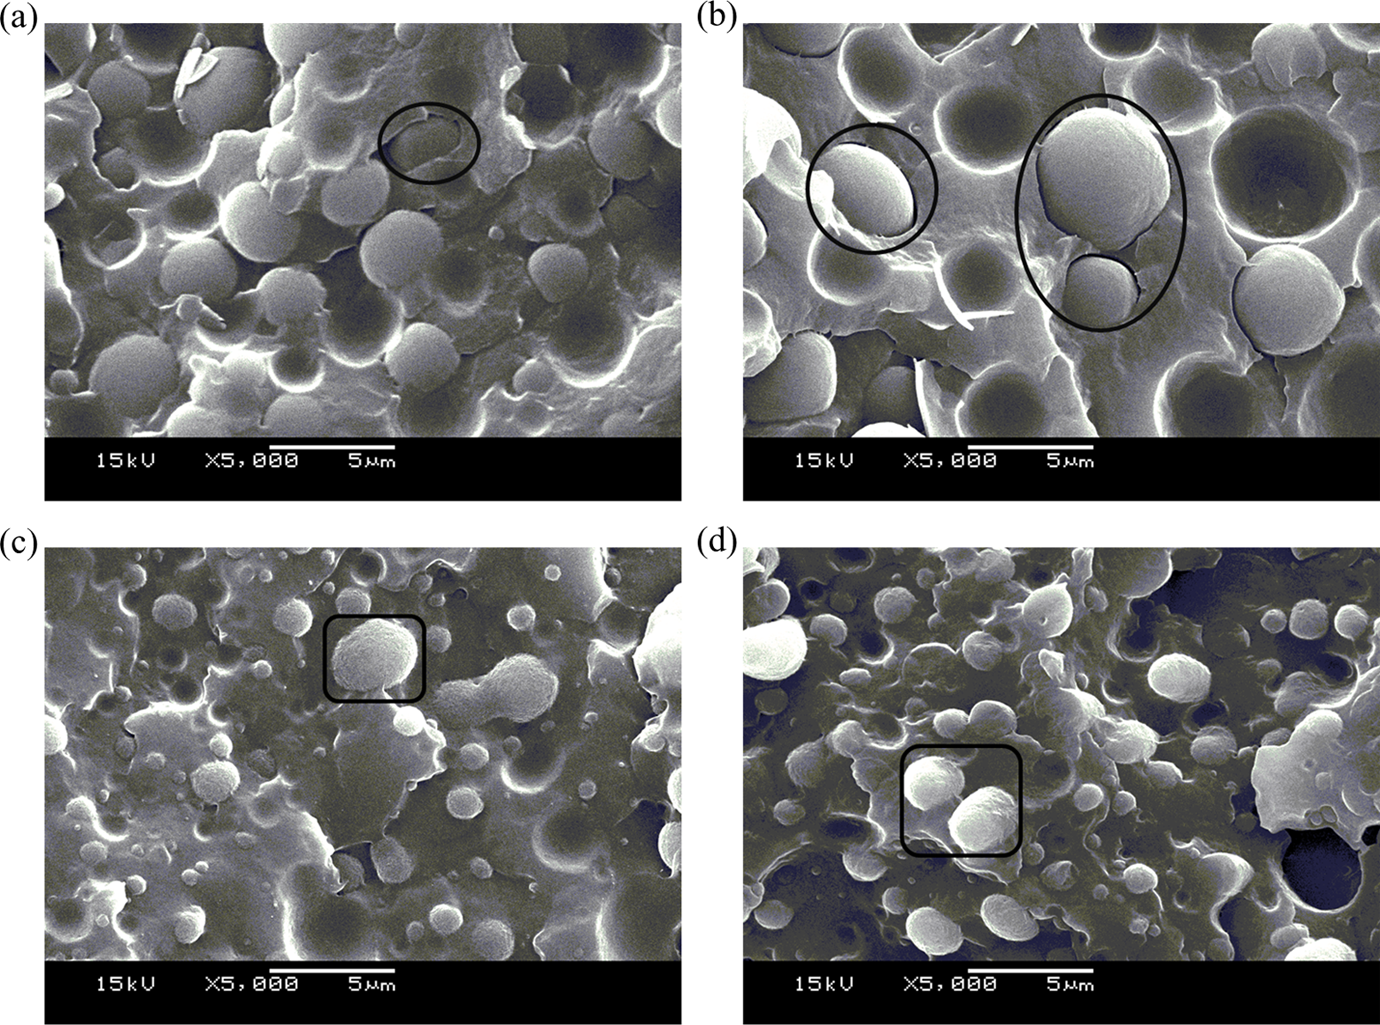
SEM images of fracture surface for UPA6/HP35 blends with magnification of ×5000: (a) 50% UPA6/50% HP35 after extruding, (b) 60% UPA6/40% HP35 after extruding, (c) 50% UPA6/50% HP35 after molding, and (d) 60% UPA6/40% HP35 after molding. SEM: scanning electron microscope; UPA6: unextracted PA6.
Further survey on the reactive compatibilization has been executed in this study. SEM images of tensile fracture surface were analyzed and shown in Figure 4. Figure 4(a) presents the morphology of blends consist of 20% UPA6 and 80% HP35, it is clear to see that the rubber matric were gnarled under tensile stress, and making the stromal lamellae more interdependent integrity. Surprisingly, the rubber matric was stretched to long ribbons when UPA6 content reaches 40% (Figure 4(b)) and good coherence between the round PA6 particles and TPEE was achieved. Through enlarging the pictures, we found the PA6 particles could resist the tensile deform effectively and all particles were clutched by stretched strips and maintain original ball shape. Undoubtedly, the superior reactive compatibility of UPA6 and TPEE endows the blends good mechanical properties and the following tensile test also proved the elongation rate at break of blends consist of 40% UPA6(550%) is slightly less than that consist of 20% UPA6(572%); however, the breaking stress of the latter (22.7 MPa) is significant superior to the former (17 MPa). As for blends with 50% UPA6, particles loosely disperse on the fracture surface of tensile test as shown in Figure 4(c), which is highly like that of original specimen. Figure 4(d) indicated the morphology of blends prepared by 40% HP35 and 60% UPA6, some white components aggregate on the upper of caked matric. It is clear to see that the components are actually regular flakes stacked somewhere of the matric at magnification of 5000 times (Figure 4(f)). These flakes are β crystals of cyclic dimmer formed due to stress-induced crystallization, which was confirmed by several detailed analytic methods, for example, high performance liquid chromatography (HPLC), X-ray diffraction (XRD), and so on. This case also proves that the extractables in UPA6 could easily slide in the matric under an applied force.
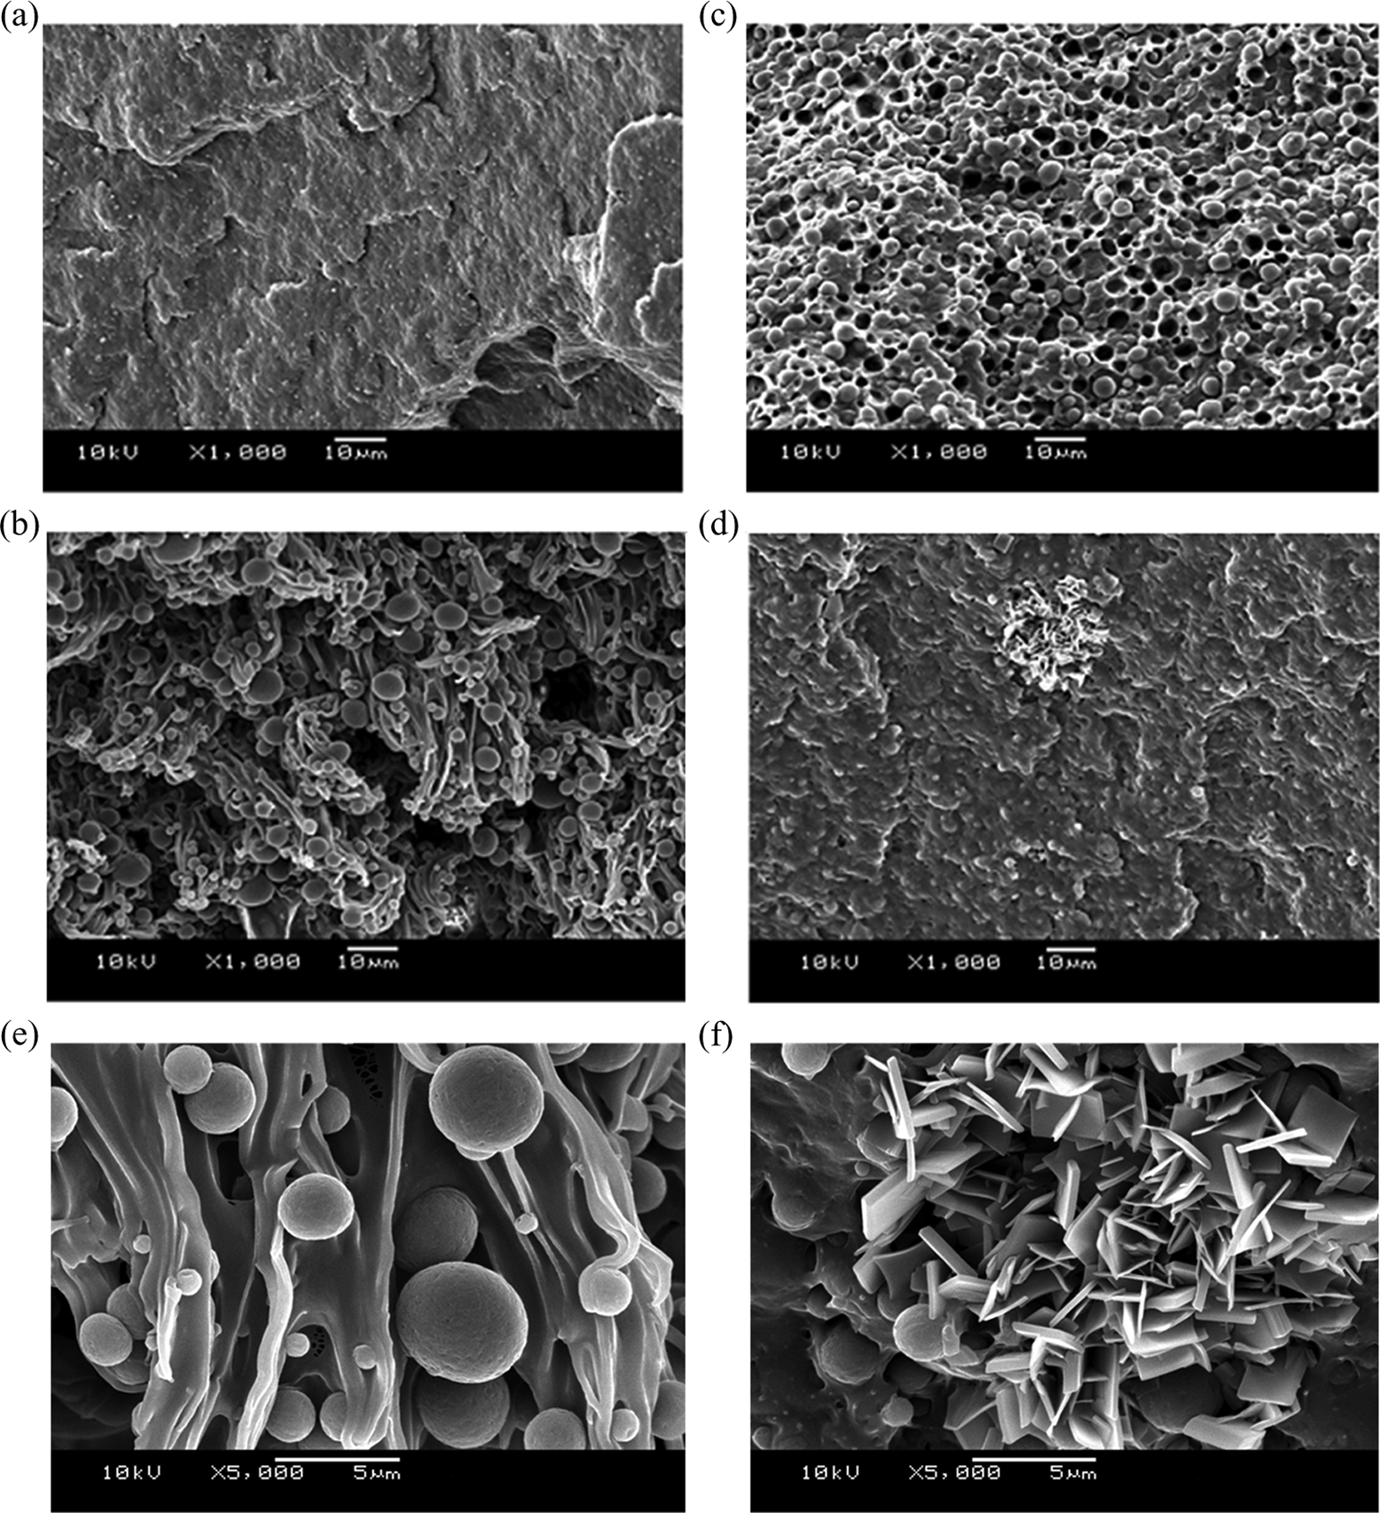
SEM images of tensile fracture surface for UPA6/HP35 blends: (a) 20% UPA6/80% HP35, ×1000; (b) 40% UPA6/60% HP35, ×1000; (c) 50% UPA6/50% HP35, ×1000; (d) 60% UPA6/40% HP35, ×1000. (e) 40% UPA6/60% HP35, ×5000; and (f) 60% UPA6/40% HP35, ×5000. SEM: scanning electron microscope; UPA6: unextracted PA6.
Thermal behavior
The thermal behavior of blends prepared by UPA6 and HP35 was investigated by DSC and the results are shown in Figure 5. When the content of UPA6 is ≥50 wt%, two adjacent melting peaks were observed at about 218°C and 223°C, which may be attributed to the breaking of the different crystal cells in UPA6. Particularly, we noticed that the melting point for HP35 disappears when UPA6 content reaches 70 wt%. In the range of 50–60 wt%, there are three melting peaks shown in DSC curve, the one with peak value of about 193°C stands for the melting point of HP35. However, when the content of UPA6 decreases to less than 50 wt%, there are only one melting peak for PA6 has been observed; in the meantime, the peak value and its intensity decrease as UPA6 content decreases. The peak assigned to the melt point of HP35 appears when the content of UPA6 is ≤60 wt%, the appearance of HP35 melting peak could also be an evidence for the phase inversion.
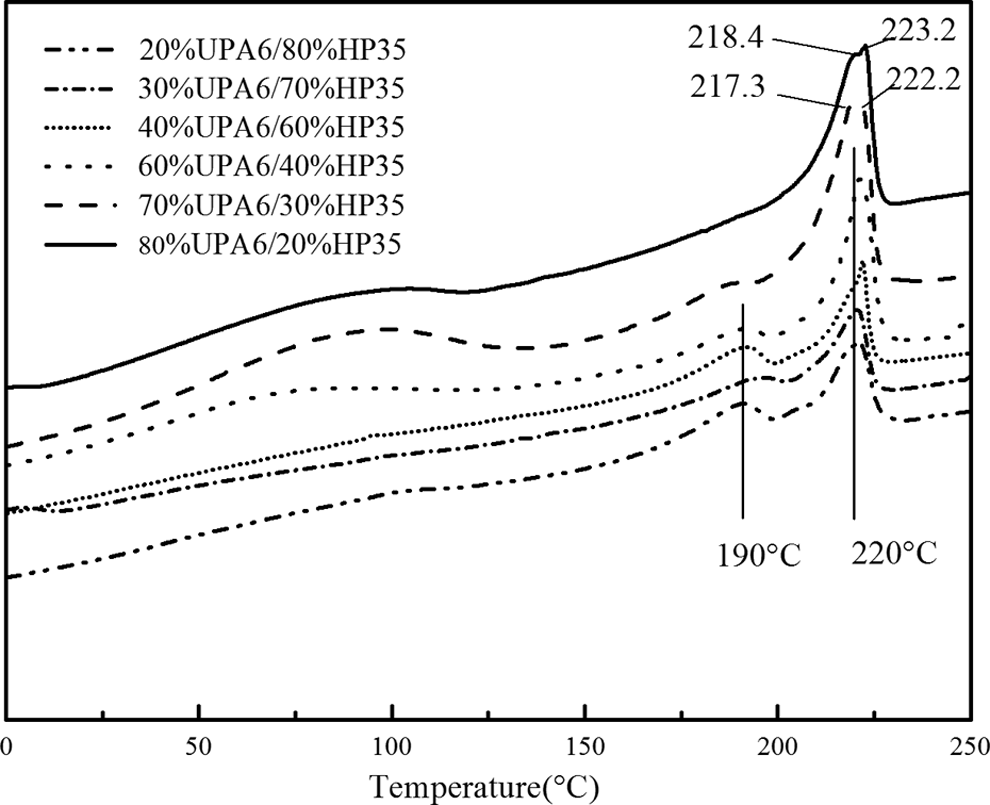
DSC curve for blends of HP35 and UPA6 at heating rate of 10°C·min−1. DSC: differential scanning calorimetry; UPA6: unextracted PA6.
Mechanical properties
Tensile deformation behavior
The elongation rate at break, yield stress, and breaking strength of blends are shown in Figure 6; the data of the bar chart were obtained at crosshead rate of 30 mm min−1.

The strain-stress characteristics of UPA6/TPEE blends. UPA6: unextracted PA6; TPEE: thermoplastic ester elastomer.
It is significantly noticed that two blends consisting of 20 wt%, 40 wt%, and 80 wt% UPA6 show better elasticity than others. Especially, when the content of UPA6 in blends is <50 wt%, the elongation rate at break of blends is equivalent to TPEE, while the yield stress and breaking strength are a little higher and endow the blends superior mechanical properties. However, the blends consist of 50 wt% UPA6 and 50 wt% TPEEs, with very poor elasticity, and their elongation rate at break is the poorest. The previous papers 20,24,39 –41 focused on the fracture surface of blends shown that with the increase of compatibility of the blends, the mechanical properties will be enhanced. Obviously, this case can also prove that the compatibility between PA6 and TPEE was improved by adding proper content of UPA6.
Dynamic mechanical analysis
Some studies provide that blends with high content of soft components have lower glass transition temperature for rubber phase and well documented. 31–32,42–43 However, the results of this study differ slightly from the previous reports. Figure 7 shows the tan δ curve of HP35 and HP47, and the T g of HP35 and HP47 is −19.4°C and −5.3°C, respectively, given by the maximum peak of tan δ curve.
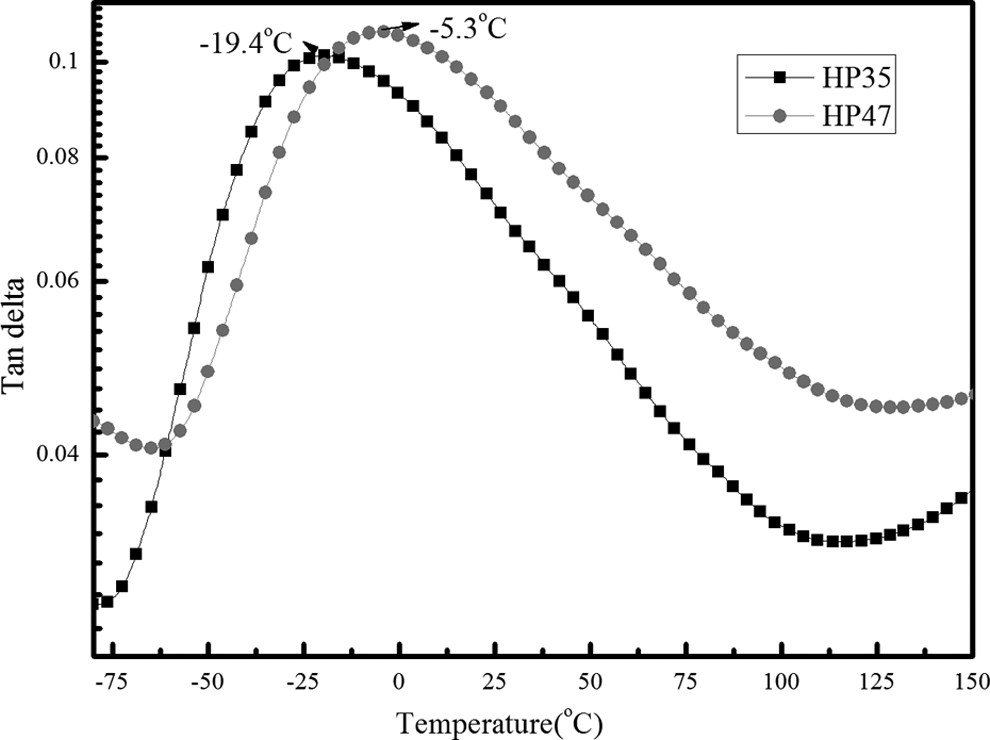
The tan delta curve of HP35 and HP47.
In this study, the effect of UPA6 content on the storage modulus of the blends was investigated as shown in Figures 8 and 9. For all blends, the storage modulus curves present obvious declination when temperature is lower than the glass transition temperature of rubber phase. Moreover, when the content of UPA6 is <50 wt%, the flat rubber platform can be observed. The onset temperature of rubber platform is about 70°C for UPA6/HP35 blends, but this value for UPA6/HP47 blends is over 100°C.

The storage modulus curve for UPA6/HP35 blends. UPA6: unextracted PA6.

The storage modulus curve for UPA6/HP47 blends. UPA6: unextracted PA6.
Figures 10 and 11 indicate that in the tan δ curves of blends, there are two peaks for all blends prepared by HP35 and UPA6 (Figure 10). The one below zero is related to the rubber phase (here it denotes as T g1) and another one is contributed by plastic phase (here it denotes as T g2). However, T g 1 disappears as shown in Figure 11 for blends prepared by HP47 and UPA6. Here, a group of blends consist of 30 wt% UPA6 and 70 wt% TPEE was added to help us to obtain more information. In the range of 20–40 wt%, the value of T g1 decreases as UPA6 content increasing and thus a reversal shift of T g1 was formed; however, when the content of UPA6 is ≥50 wt%, the peak of T g1 increases with the increase of UPA6 content. The peak values of T g2s of plastic phase range from 30°C to 42°C and are far lower than that of PA6 reported.

The tan delta curve for UPA6/HP35 blends. UPA6: unextracted PA6.

The tan delta curve for UPA6/HP47 blends. UPA6: unextracted PA6.
The similar result was also observed when we studied the blends of UPA6/HP47 (Figure 11). The T g1s of these blends are lower than −6°C when the content of UPA6 is <40 wt%, which is a little lower than the T g of HP47. The T g2s of all blends are higher than 37°C but still lower than that of pure PA6. The difference is that all blends prepared by UPA6 and HP35 have a lower glass transition temperature for rubber phase, while for blends of UPA6/HP47, the T g1s cannot be observed when the content of UPA6 is ≥60 wt%.
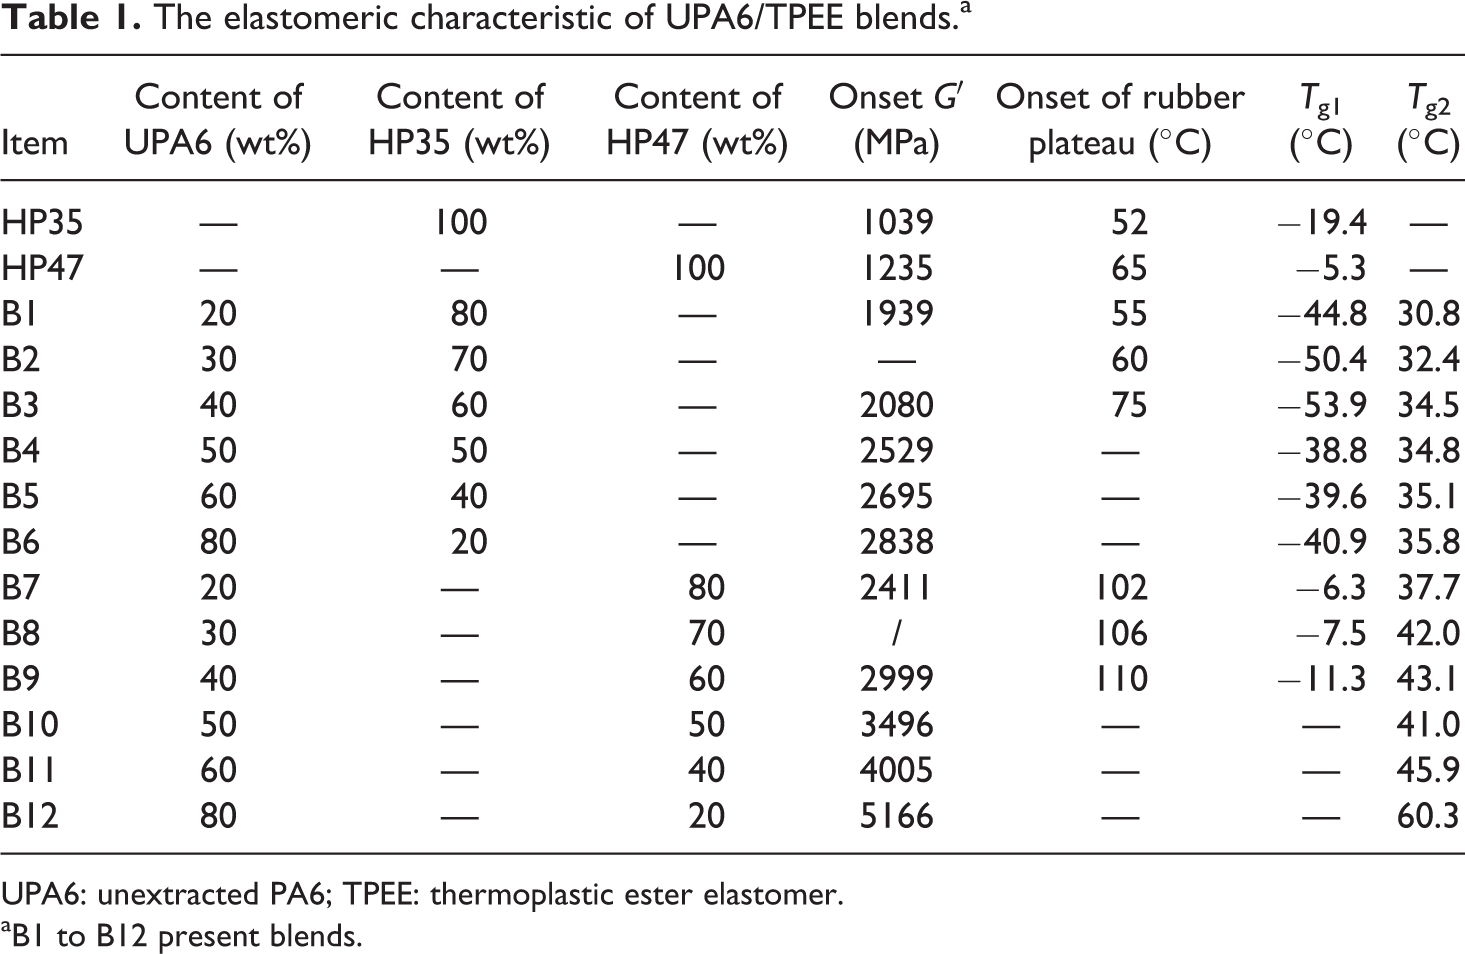
The values of T g 1s, T g2s, onset storage modulus, onset temperature of rubber platform, and shore hardness for all blends are concluded in Table 1.
The elastomeric characteristic of UPA6/TPEE blends.a
UPA6: unextracted PA6; TPEE: thermoplastic ester elastomer.
aB1 to B12 present blends.
The data shown in Table 1 indicate that the storage modulus and shore hardness of all blends increase with the increase of UPA6 content. For all blends prepared by UPA6 and HP35, their T g1s decrease from −44.8°C to −53.9°C as the content of UPA6 varies from 20 wt% to 40 wt%. However, the T g1 increases to −38.8°C dramatically when UPA6 content reaches 50 wt%, then the T g1s of blends decreased again with the increase of UPA6 content but not significant. The T g2s of blends increased as UPA6 content increasing over range ratio. Furthermore, for blends prepared by UPA6 and HP47, a similar change of T g1s has been observed when the content of UPA6 is <50 wt%, whereas T g1s disappear completely when the content of UPA6 was ≥50 wt%.
Considering the reversal shift of glass transition temperature for rubber phase, we suspect that the extractables, especially the caprolactam in UPA6, play a very important role as lubricant which makes the rigid chains easier to slide at lower temperature. With the caprolactam content in rubber matric increases, the chains of PA6 tend to slide at lower temperature and thus leading to the dramatic reversal shift of T g1. However, when UPA6 content reaches a critical point, in this study, that is, 50 wt% for UPA6, hard phase takes over the matric and rubber particles embed in matric tightly, thus the function of caprolactam has been weakened.
By studying the changes of morphology, elongation rate at break, and glass transition temperature, we found when the glass transition temperature for rubber phase shifts inverse, the ideal elongation rate at break and morphology of blends could be obtained and the mechanical properties are enhanced with the improvement of blends compatibility.
Conclusion
In this study, we studied the melting behavior, morphology, and mechanical properties of blends prepared by UPA6 and TPEEs on different mass ratios. Some interesting results have been found: (a) the DSC curves present two adjacent melting peaks when UPA6 content ≥50 wt% and show three melting peaks when the blending ratio of UPA6 and HP35 reaches 1. (b) The morphology of blends changes obviously after stretching, and the UPA6 particles were clutched by matric strips when the content of TPEE is 40 wt%, which could be a proof of reactive compatibilization. When the content of UPA6 increases to 60%, flake crystals of cyclic dimmer were formed due to stress-induced crystallization. (c) Elongation rate at break of blends is very close to that of pure HP35 or HP47. Their yield stress and tensile strength are improved when the content of UPA6 in blends is <50 wt%. (d) The change of T g1s for rubber phase is dramatic, when the content of UPA6 is <40 wt%, and the T g1s of blends are far lower than that of HP35 and a little lower than that of HP47. Furthermore, the T g1s decrease with the increase in the content of UPA6 over range 20–40 wt%. (e) DMA and DSC results indicate the phase inversion occurred when the blending ratio is 1. UPA6 dominates the matrix and shows the characteristics of plastic when the content of UPA6 is ≥50 wt%, and when UPA6 content is <50 wt%, HP35 takes over the matrix and endows the blends more elasticity.
Footnotes
Declaration of Conflicting Interests
The author(s) declared no potential conflicts of interest with respect to the research, authorship, and/or publication of this article.
Funding
The author(s) disclosed receipt of the following financial support for the research, authorship, and/or publication of this article: This project was financially supported by the National Key research Program of China (grant no. 2016YFB0302702), Scientific Research Foundation of Hunan Provincial Education Department (grant no. 17A126), and Hunan Engineering Laboratory for Preparation Technology of Polyvinyl Alcohol Fiber Material, Huaihua University (grant no. HGY201612).