
Abstract
This study aims to investigate the influence of welding parameters in hot plate welding (HPW) process of polycarbonate (PC)/acrylonitrile-butadiene-styrene (ABS) blends using Taguchi method. Three welding parameters, namely the plate temperature, heating time, and welding displacement, were optimized in terms of joint strength using the results of tensile tests. Taguchi experimental design method is implemented as a statistical design of experiment technique so as to set the optimum welding parameters and determine the optimal levels. For HPW of the specimens, the combination of process parameters based on three levels of L9 orthogonal array was utilized. The signal to noise ratio and the analysis of variance were employed to find the optimum levels and to indicate the impact of the welding parameters on joint strength after tensile tests of the welded joints were carried out. It was shown that it might achieve the improved joint strength using 290 °C of plate temperature, 1.25 mm of welding displacement, and 25 s of heating time. For the optimized parameters, it was verified that the most effective factor on joint strength is plate temperature and second effective factor is welding displacement and heating time only slightly influenced on joint strength. After the optimum levels of process parameters are set, in order to demonstrate the effectiveness of Taguchi method, a confirmation run is also performed. An improvement by about 70% from initial welding parameters was observed, and joint efficiency has increased from 22.5% to 38.2% regarding base material properties.
Introduction
Thermoplastic polymers are outstanding candidate for replacing conventional metallic materials due to their properties of weight saving, thermal insulation, flexibility, good fatigue resistance, and high fracture toughness. 1 Polycarbonate (PC), one of the precious commercial polymers with long linear chains of phenol and carbonic acid, is widely used in computer monitors and printers. PC has good electrical properties, flame resistance, transparency, colorability, good dimensional, and thermal stability. PC also demonstrates high hardness and high toughness properties. On the other hand, high melt viscosity and poor solvent resistance are some deficiencies of PC. 2,3 In addition, acrylonitrile-butadiene-styrene (ABS; belongs to amorphous engineering thermoplastics) is commonly used in automotive industry, electrical and electronic equipment owing to their high-impact strength, good processability, low notch insensitivity, and low cost. However, ABS also exhibits unfavorable properties such as low thermal stability, poor chemical, and flame resistance. 2,4
Polymer blending is an ideal method to produce new superior products with required properties. 5 Among the commonly used polymer blends, PC/ABS composite blend has gathered wide acceptance in many engineering fields such as automotive and defense industry, computer equipment, mobile phones, and electrical apparatus. 6,7 As mentioned earlier, combination of the favorable properties of each polymer contributes to the formation of new desired products. Thereby, the properties of good dimensional stability, stress cracking resistance, high heat, and impact resistance are obtained. 8
Nowadays, joining of thermoplastic composites is increasingly coming into prominence and it is an important secondary process in the fabrication of most structures replacing many metallic materials to obtain promising assemblies.
Several applicable joining processes such as mechanical fastening, adhesive bonding, and fusion bonding have been developed on the purpose of providing good mechanical performance and reducing part cost. 9
However, mechanical fastening has negative effects such as stress concentrations, corrosion problems, and damage of reinforcement materials. Similarly, adhesive bonding may result in unfavorable problems of bonding adhesive materials to thermoplastics. Fusion bonding methods have received significant attention for joining thermoplastic composites as they can considerably remove these undesired effects. One widely used fusion bonding technique is hot plate welding (HPW), in which the surfaces to be joined are brought to the “melting temperature” by direct contact with a heated metallic tool. HPW, which presents several advantages, is widely used in automotive parts, fuel tanks, and fuel pipes. 10
Several studies were carried out with regard to the morphology and mechanical behavior of PC/ABS blends over the last decade. For example, Khan et al. 11 investigated the rheological and mechanical properties of the PC/ABS blends so as to develop alloys comprising as much recycled plastics as manufacturable. Wang et al. 12 evaluated the flame-retardant effect of the various flame retardants and fibers in the short glass fiber-reinforced PC/ABS composites. The mechanical behavior of PC/ABS blends was also studied experimentally during monotonic and cyclic loading by Wang et al. 13 Wegrzyn et al. 14 reported the quality of morphology and mechanical behavior of PC/ABS-multiwalled carbon nanotube (MWCNT) nanocomposites with different volume fractions of carbon nanotubes manufactured at different injection velocities. Bärwinkel et al. 15 carried out an investigation the morphology formation during compounding and injection molding of PC/ABS blends containing 60 wt% PC and 40 wt% ABS. There is very limited literature available on the HPW of PC/ABS blends.
Therefore, there is a need for more effort to understand the mechanical behavior of polymer blend joints obtained by HPW. The present study is focused on the effect of welding parameters in HPW of PC/ABS blends. The process parameters for HPW are the plate temperature, heating time, welding displacement, welding time, welding force, and material type. The mechanical performance of a HPW is mainly dependent on the process parameters as plate temperature, heating time, welding displacement, and welding time. 16 –18 The mechanical performance of a joint can be expressed as in the terms of joint strength or joint efficiency. The joint efficiency is a numerical value, which represents a percentage, expressed as the ratio of the strength of a riveted, welded, or brazed joint to the strength of the base material.
Three welding parameters, namely the plate temperature, heating time, and welding displacement, were optimized in terms of joint strength through the results of tensile tests. Taguchi experimental design method was implemented so as to set the optimum welding parameters and determine the optimal levels. The signal to noise (S/N) ratio and the analysis of variance (ANOVA) techniques were employed to evaluate the effects of welding parameters on the joint strength.
Experimental
Taguchi experimental design method
Basically, classical experimental design methods are too complex, not easy to use and not always reach the desired objectives. A large number of experiments have to be carried out when the number of welding parameters increases. In order to investigate the joint efficiency of HPW process parameters, most researchers follow the conventional experimental procedures, that is, varying one parameter at a time while keeping the other parameters constant. The Taguchi method has been found to be a simple and robust technique for optimizing the welding parameters. Taguchi method of design of experiments has been widely applied to optimize the quality and reliability of materials and manufacturing through the optimization of the input process parameters without increasing the experiment time and cost. 19 He proposed that engineering optimization of a process or product should be carried out in a three-step approach, that is, system design, parameter design, and tolerance design. 20 Basically, classical parameter design (experimental design) was developed originally by Fisher 21 is complex and not easy to use. Especially, a large number of experiments have to be carried out when the number of process parameters increases. 22
The Taguchi experimental design method which uses a special design of orthogonal arrays (OAs) to study the entire parameter space with only a small number of experiments offers advantages over the classical experimental design methods. Taguchi method reduces the variation of the response variable in economical way and points the best way to find out the optimum process conditions during experimental studies, it is an important tool for improving the productivity and it can be applied to any process. 23,24
A loss function is then defined to calculate the deviation between the experimental value and the desired value.
Taguchi recommends the use of the loss function, and the value of this loss function is further transformed into S/N ratio.
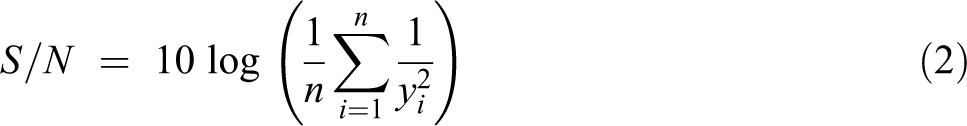
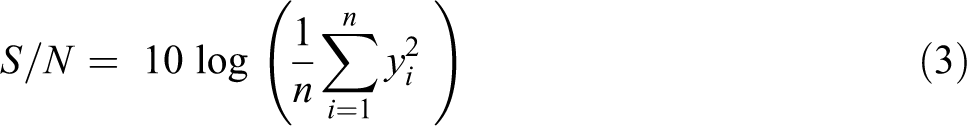
Usually, three categories of the performance characteristics are defined in the analysis of the S/N ratio: the lower is the better, the larger is the better, and the nominal is the best:
Nominal is the best:
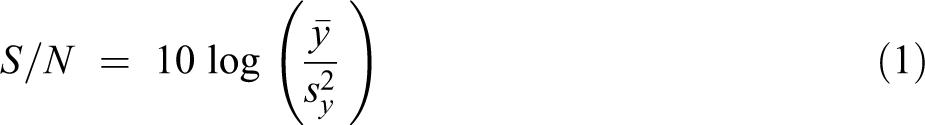
Larger is the better:
Lower is the better:
where
Notice that these S/N ratios are expressed on a decibel scale. Equation (1) would be used if the objective is to reduce variability around a specific target, equation (2) if the system is optimized when the response is as large as possible, and equation (3) if the system is optimized when the response is as small as possible.
The S/N ratio for each level of process parameters is computed based on the S/N analysis function. Regardless of the category of the performance characteristic, the larger S/N ratio corresponds to the better performance characteristic. Therefore, the optimal level of the process parameters is the level of larger S/N ratio. 22,25
The goal of this research was to produce maximum joint strength in HPW process. Higher joint strength values represent better or improved joint strength. Therefore, a larger-the-better performance characteristic was implemented and introduced in this study. Furthermore, a statistical ANOVA is performed to investigate which parameters are statistically significant. With the S/N ratio and ANOVA analysis, the optimal combination of the process parameters can be predicted. Finally, a confirmation experiment is conducted to verify the optimal process parameters obtained from the parameter design. In this study, the welding parameter design by the Taguchi method is adopted to obtain optimal joint strength in HPW.
HPW setup and process
HPW is one of the widely used welding techniques making it highly reliable. HPW, also known as heated tool welding, mirror, platen, butt, or butt fusion welding, is a widely used technique for joining injection molded components or extruded profiles. The process uses a heated metal plate, known as the hot tool, hot plate, or heating platen, to heat and melt the interface surfaces of the thermoplastic parts. 22
In general, welding can be performed in either of two ways. They are welding by pressure and welding by displacement. 18
The first is carried out by controlling the pressure. In the second one, the process is carried out under motion and position control by keeping the pressure constant. The welding setup used in this study is designed according to motion and position control principle. The HPW setup basically consists of three main units. These are the heating plate assembly, pneumatic motion assembly, and the control unit. The heating plate assembly is designed to heat up the surfaces independently. Two of the three pistons in the pneumatic motion assembly are used for moving the specimens close to hot plates, moving those outward after being heated, and moving the specimens toward each other for welding. The third piston in the pneumatic motion assembly enables the hot plate assembly to be moved vertically. In the control unit, motions of the pistons, positioners, heaters, temperatures, plate heating times, welding times, and waiting times are controlled automatically. Figure 1 shows the HPW setup and its operation schematically. 22
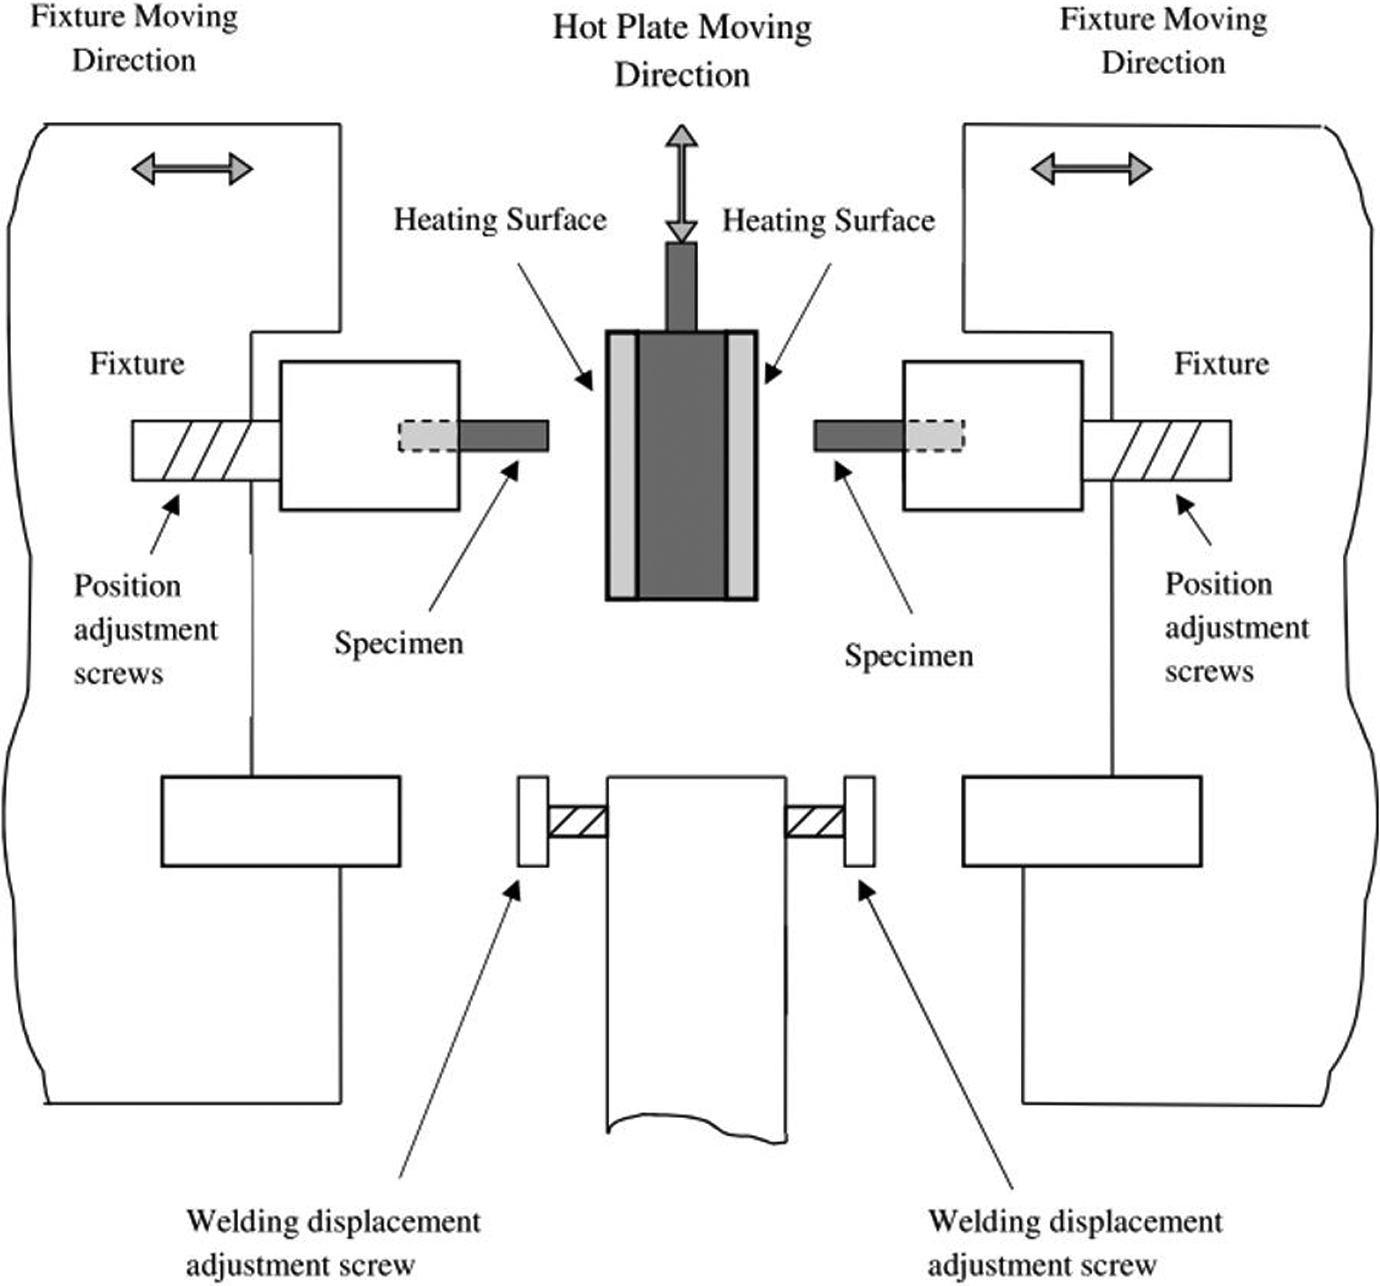
Schematic diagram of HPW setup. HPW: hot plate welding.
The process is carried out by contacting the faying sections with the heating surfaces on the hot plate assembly.
The hot plates can have relatively complex geometries to allow the welding of complex interface. However, in many applications, such as in automotive headlamps and rear lights, doubly curved joint interfaces require complex tools that allow the hot surfaces to match the contours of the joint interface. Applicability to complex geometries is one of the major advantages of this process. 26,27
The hot plates are often coated with a nonstick material (often PTFE, product name: Teflon) to act as a release agent. Teflon-coated surfaces of hot plates are maintained at a preset plate temperature. The specimens to be welded are placed to fixtures running axially. The contact of the weld specimens with the heating surfaces of the hot plate assembly is positioned by 0.01 mm accuracy using position adjustment screws. In the initial phase (matching phase), pressure is applied to promote squeeze flow of the faying surface to assure that the faying surface is well defined and all part irregularities are removed. Welding process is initiated by contacting the specimens with the hot plates and welding surfaces are heated by conduction. After a preselected heating time, interfaces are sufficiently melted or softened; the pressure is removed by mechanical stops, so that a relatively thick melt layer is developed. The outflow in the melting phase is controlled by means of stops, and the thickness of the molten film is controlled by the heating time (I and II). The specimens are separated from the hot plates by pulling out the horizontally moving pistons. At the same time, the hot plate assembly is quickly displaced away from the specimens
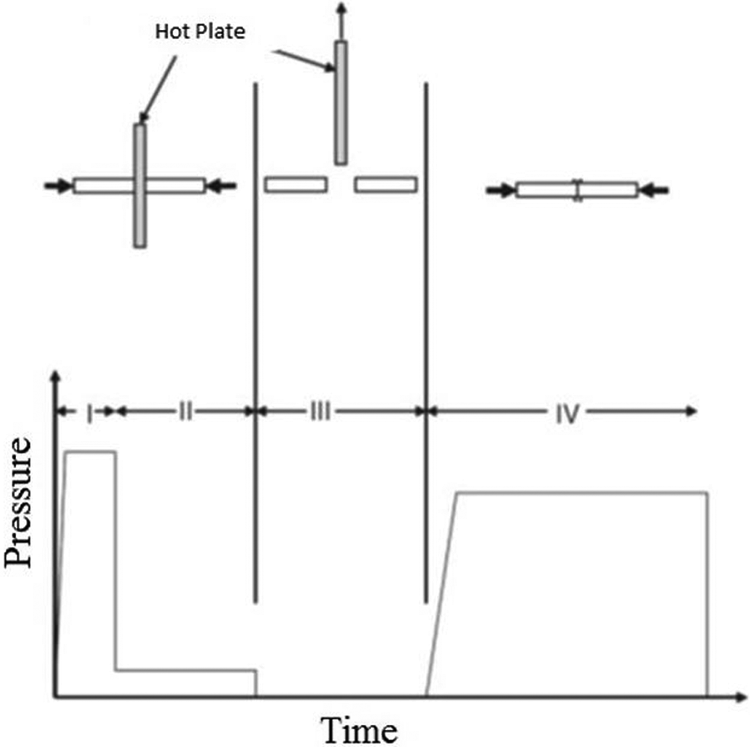
Pressure–time diagram for HPW process steps. HPW: hot plate welding.
HPW process parameters and their levels
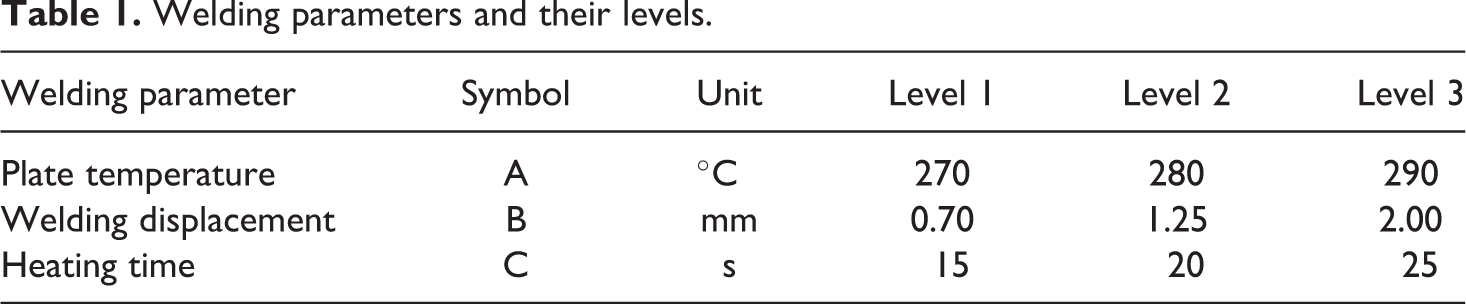
As understood from the process steps mentioned below, the process parameters for HPW are the plate temperature, heating time, welding displacement, welding time, welding force, and material type. In this study, three welding parameters and three levels for each were selected in accordance with the data obtained from the preliminary experimental results. 16,28 The value of the welding process parameter at the different levels is listed in Table 1.
Welding parameters and their levels.
Experimental design for HPW
Selection of Taguchi’s OA
After selection of process parameters and their levels, a particular OA as a matrix for conducting experiments should be chosen depending on the number of factors and their level (Table 1). L9 (34) OA with four columns and nine rows was used for this experimentation. Each welding process parameter is assigned to a column, and nine welding process parameter combinations are available. Since the L9 OA has four columns, each welding parameter is assigned to a column, and the last column is left empty for the error in the experimental studies. The orthogonality is not lost by letting one column of the array empty. Therefore, only nine experiments are required to study the entire welding process. 22,25 But for this study, four repetitions of each experiment condition for nine combinations were planned, and totally 36 couple of specimens were hot plate welded to get the following advantages.
Experimental design matrix
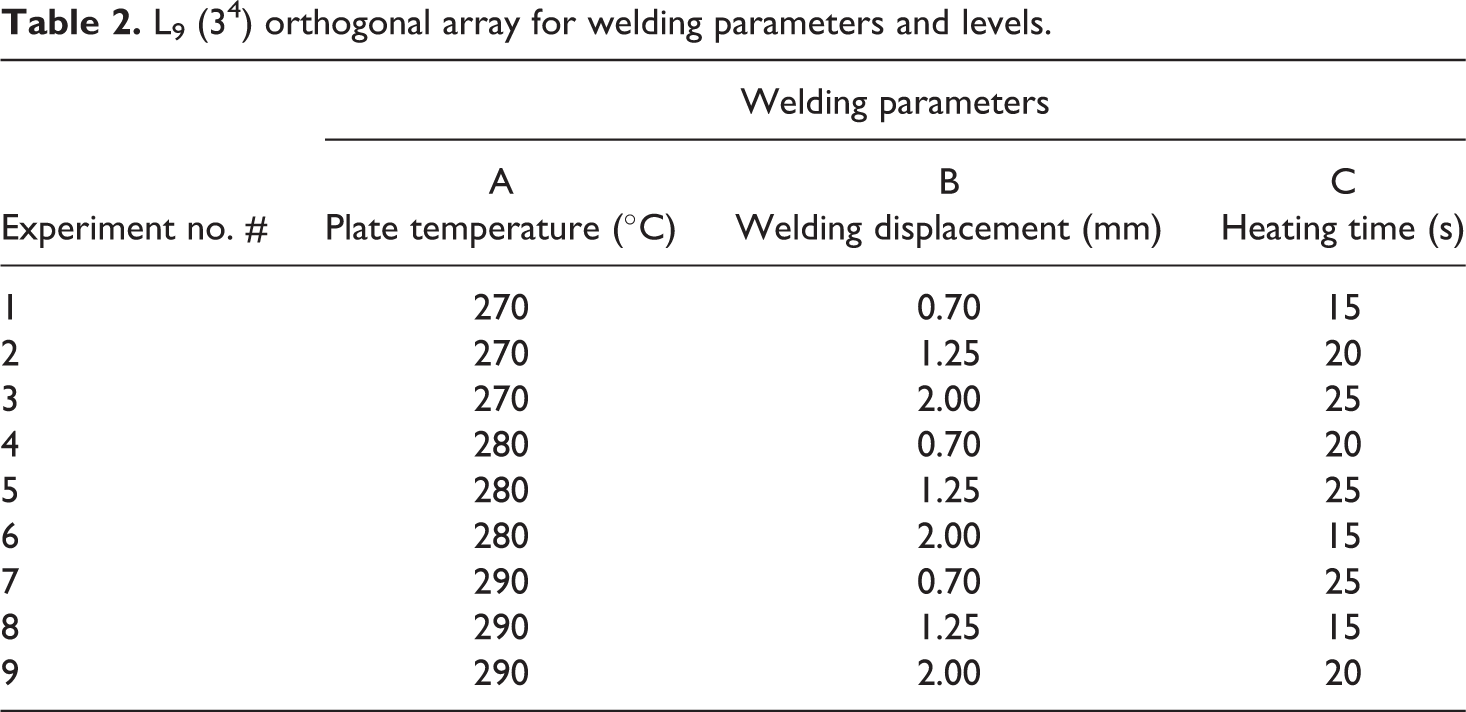
The experimental design matrix involving controllable factors (process parameters) and their levels in L9 OA is presented in Table 2. In order to determine the effects of process parameters, by utilizing the S/N ratio and ANOVA for the optimization process, experiments were performed according to the experimental design principles.
L9 (34) orthogonal array for welding parameters and levels.
Material and manufacturing of specimens
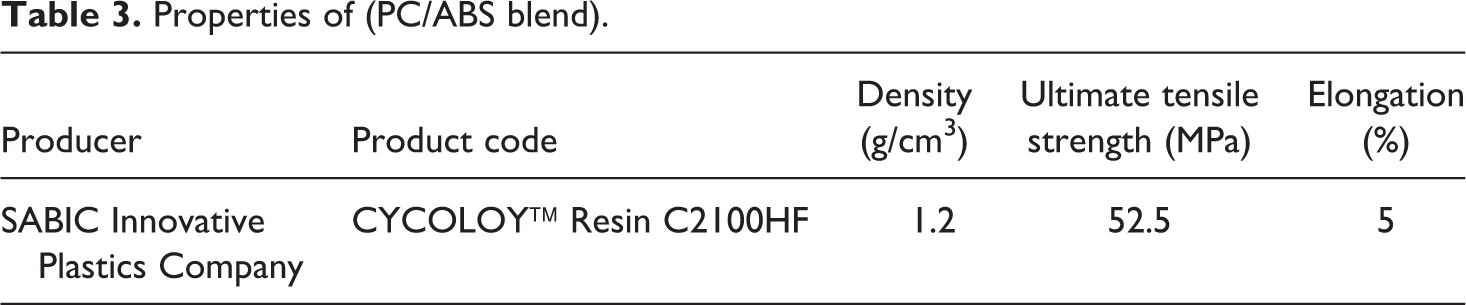
The experimental studies were performed using PC/ABS commercial blend Cycoloy C2100 HF having a mass density of 1.2 g/cm3 was supplied by SABIC, Turkey.
The properties of PC/ABS blend (base material) were shown in Table 3. Before the injection process, the materials are kept at 80°C for 3 h in drying unit so as to provide a proper dryness level of about 0.2%. The base material tensile test (Figure 3) and welding (Figure 4) specimens were manufactured on Dr Boy 50T injection molding machine with screw diameter of 38 mm according to EN ISO 294. 29 The cross section of the tensile specimens was Ao = 3.2 × 10 = 32 mm2. The dimension of the welding specimens is 4 × 25 × 100 mm. Plastic injection production parameters 30 for samples were given in Table 4.
Properties of (PC/ABS blend).
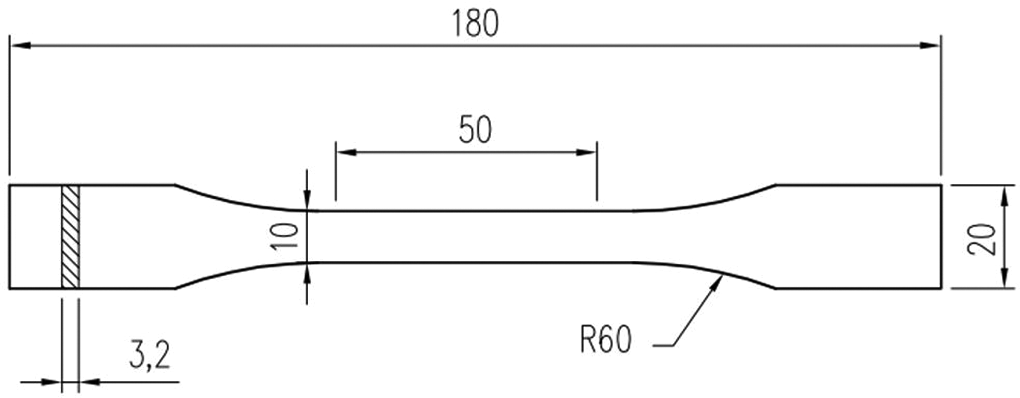
Tensile specimen geometry for base material.
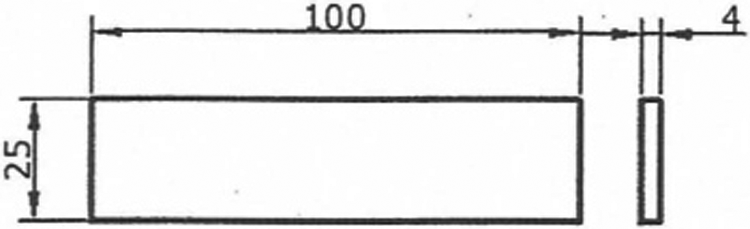
Geometry of welding specimens produced by plastic injection molding.
Production parameters in plastic injection.
Tensile tests
To find ultimate tensile strength (UTS; MPa) of base material and joint strengths of weld specimens, the tensile tests were performed at room temperature (23 ± 1°C) with a crosshead speed of 1 mm/min in accordance with EN ISO 527 31 under displacement control conditions with a universal servo hydraulic tensile testing machine Shimadzu AG-X (100 kN). The engineering stress–strain curves were simultaneously recorded up to fracture using an extensometer with an initial gauge length of Lo = 50 mm. The average of UTS of five test specimens for base material was found as 52.5 MPa (Table 3).
To ensure the reliability of the tensile test results of weld specimens and eliminate the influences of noise factors, four repetitions for weld specimens were tested for nine experimental conditions in Table 2. Figure 5 shows the appearance of the tensile test specimen to find joint strength after welding process.
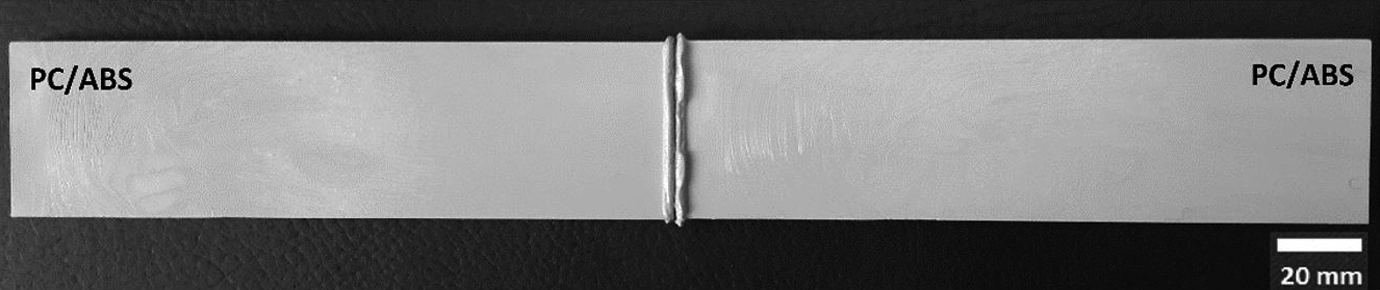
Appearance of hot plated welded joint.
Results and discussion
S/N ratio
The strengths of the welded joints in the experiments designed for PC/ABS blends are depicted in Table 5. For Taguchi method, S/N ratio was used. Analyzing the tensile test results, joint efficiencies are placed in the next column. The last column of Table 5 was assigned for the calculated S/N ratios for the designed experiments. 32
Experimental results for joint strength, joint efficiency, and calculated S/N ratio.
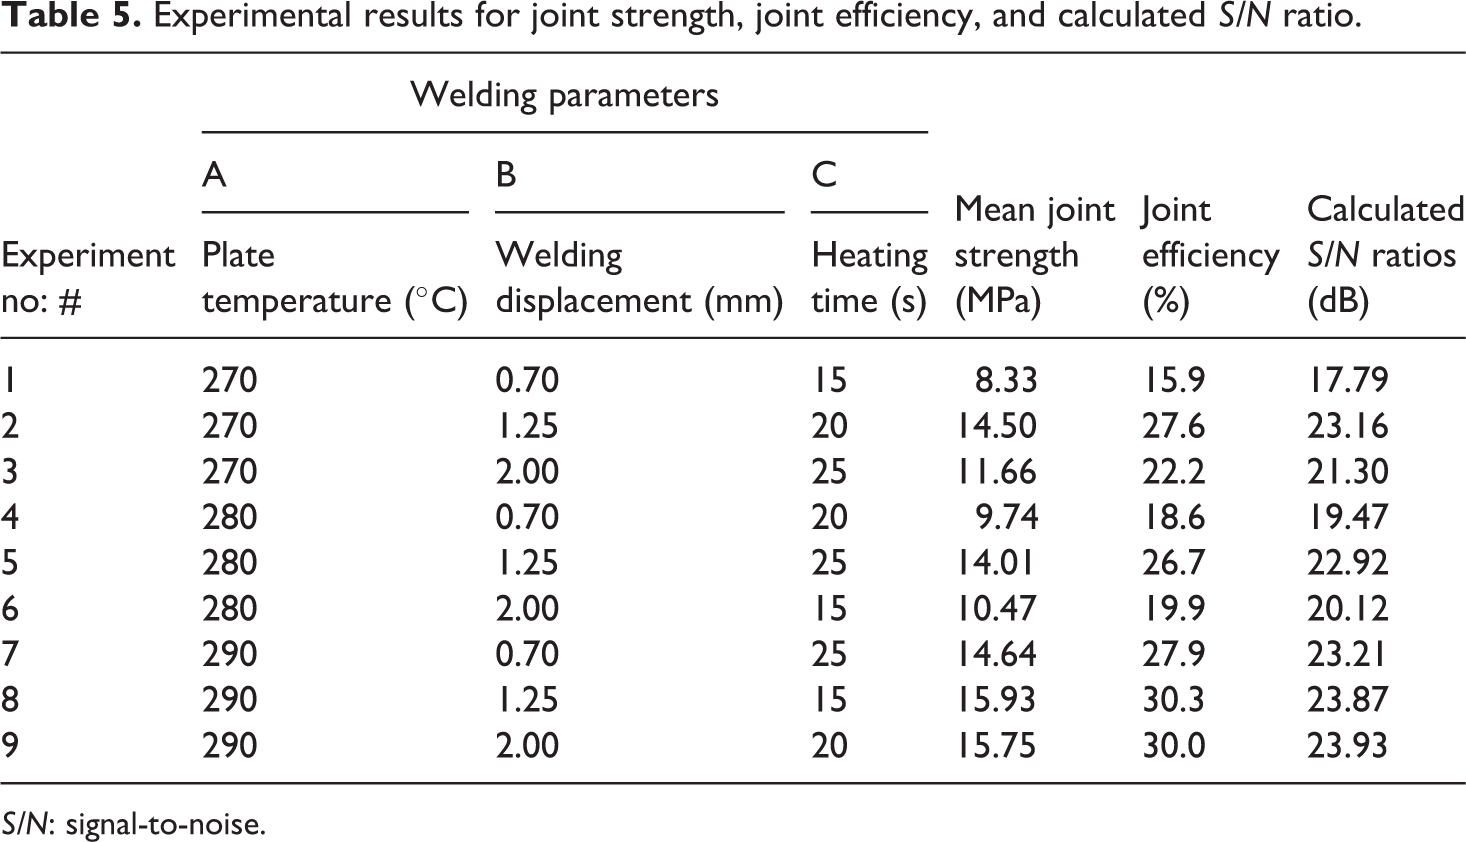
S/N: signal-to-noise.
In the Taguchi experimental design method, the term “signal” represents the desirable value (mean) for the output characteristic and the term “noise” represents the undesirable value (standard deviation, SD) for the output characteristic. S/N ratio 33,34 can be defined as the ratio of the average values (M) to the square of the deviations (SD) statistically as in equation (1). Taguchi method uses S/N ratio to measure performance characteristic deviating from the desired value. S/N ratio is computed by equation (4):

where MSD 35 is the mean-square deviation for the output characteristic in process. In the HPW process, since maximum weld strength of joint is desired, the MSD for “the larger is better” performance characteristic can be expressed in equation (5) which is derived from equation (2):
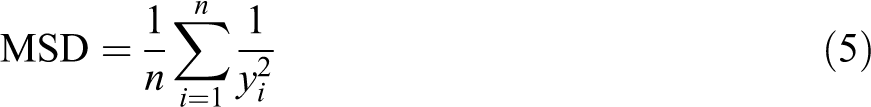
Table 5 shows joint strength values for PC/ABS blends and the S/N ratios calculated by equations (4) and (5) for these values. These values were computed using statistical analysis software Minitab v.17.
Response tables and main effects plots
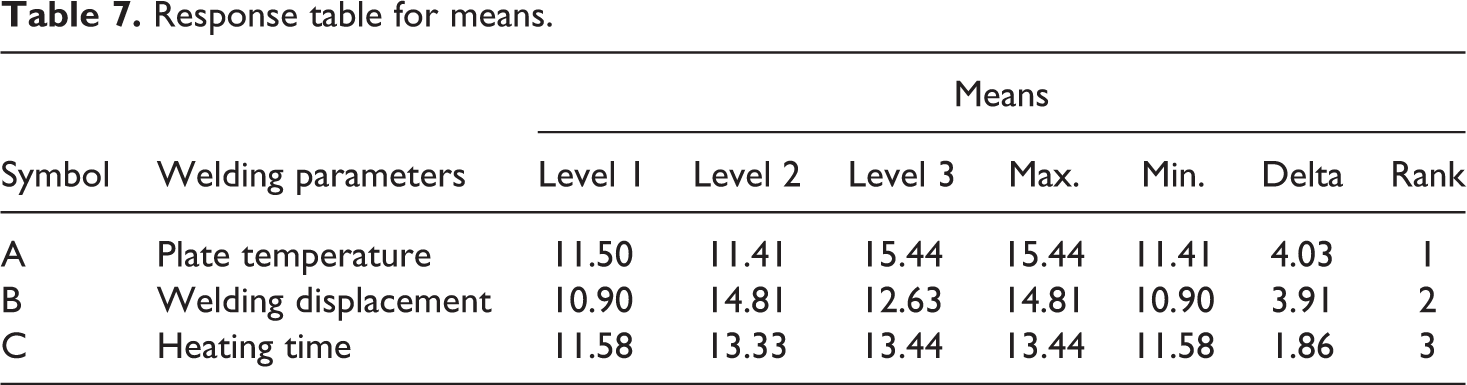
In Table 5, nine different welding parameter combinations were used. The effect of each welding parameter on the joint strength cannot be clearly understood from the result of Table 5. Since the experimental design is orthogonal, it is then possible to separate out the effect of each welding parameter at different levels. For example, the mean S/N ratio for the plate temperature at levels 1, 2, and 3 can be calculated by averaging the S/N ratios for the experiments 1–3, 4–6, and 7–9, respectively. The mean S/N ratio for each level of the other welding parameters can be computed in the similar manner. As a result of the analysis performed by Minitab v.17, the S/N ratio for each level of the welding parameters is summarized and called as the S/N response table for joint strength (Table 6) and main effects graph for joint strength—S/N ratios is plotted (Figure 6). Similarly, response table (Table 7) and main effects graph (Figure 7) for mean joint strength values are summarized and plotted. 32
Response table for S/N ratios (larger is better).
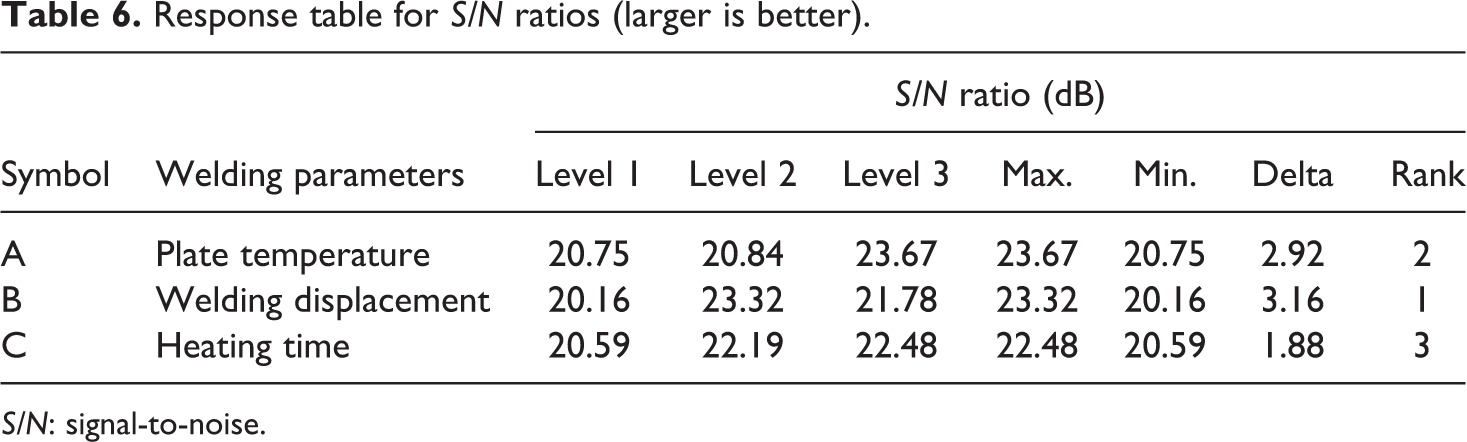
S/N: signal-to-noise.
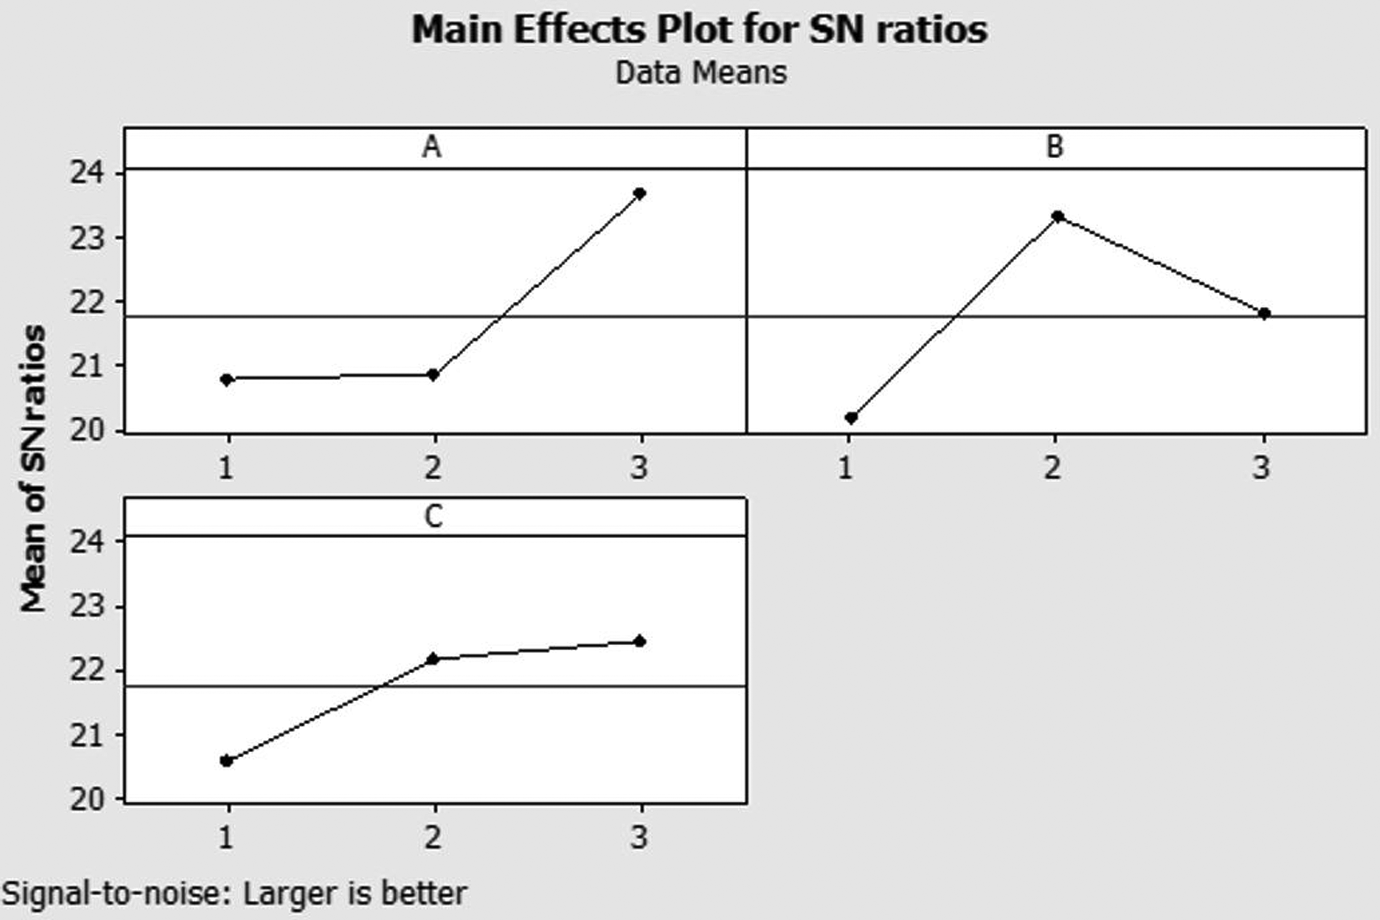
Main effects plot for joint strength—S/N ratios. S/N: signal-to-noise.
Response table for means.
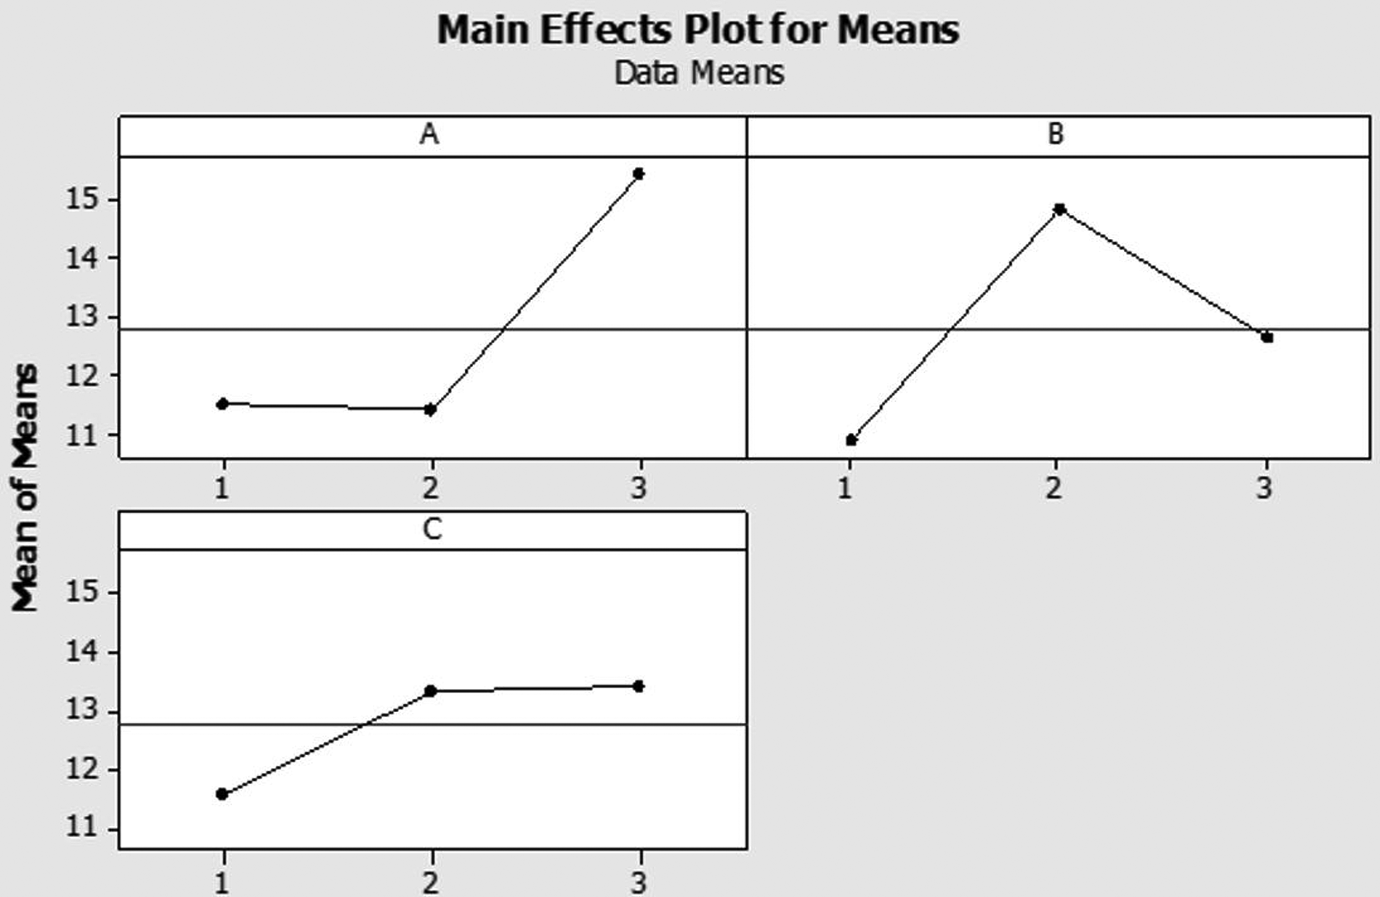
Main effects plot for joint strength—means.
Another way to indicate the effect of processing parameters on the joint strength of welded samples is the statistical analysis of the experimental data that is conducted in two phases: The first phase was concerned with the ANOVA. The second phase (F-test analysis) was concerned with the correlations of input parameters and properties of HPW. 22
In the first phase, the ANOVA method measures the effect of input variables (processing/operating parameters of HPW process) on response variable (joint strength) through the relationship between these two families of variables. The aim is to determine which welding parameters significantly affect the quality feature or the performance characteristic statistically by calculation of percentage ratios of affecting parameters through the decomposition of variances.
Analysis of variance
ANOVA result table for joint strength
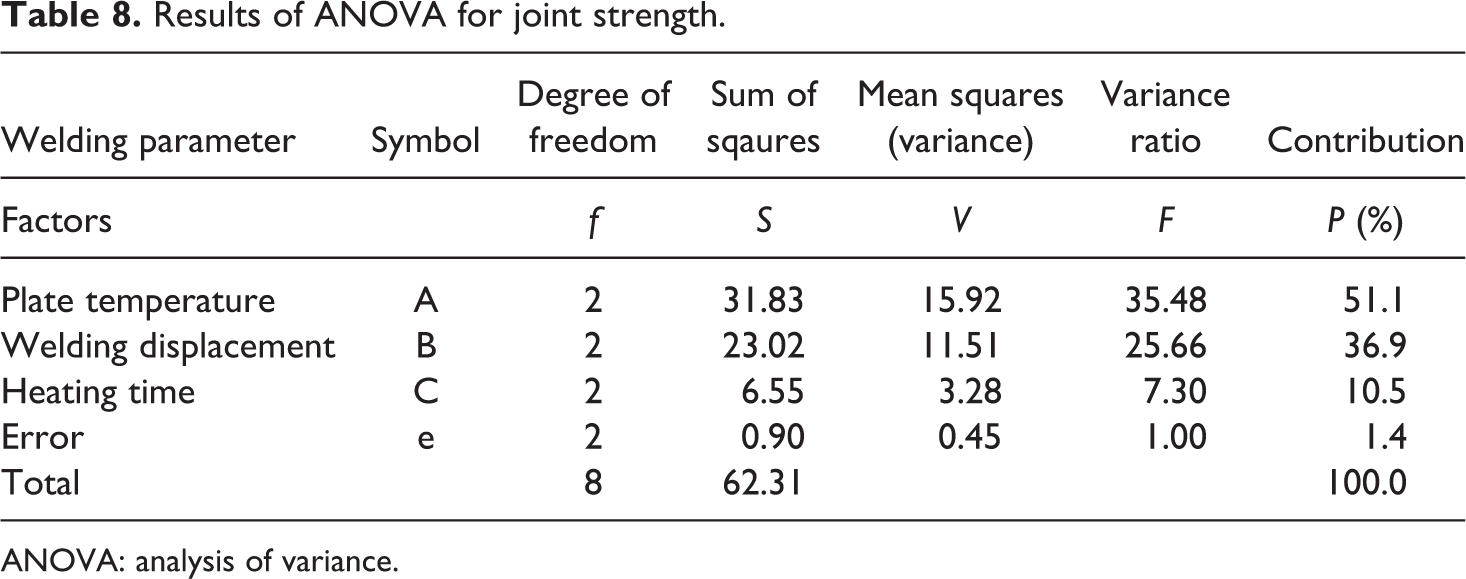
In this analysis, plate temperature, welding displacement, and heating time are process input variables, and joint strength represents output variable (Table 8). The results of ANOVA for joint strength of means were calculated and evaluated using the Minitab 17 software. Table 8 tabulates the Minitab output of ANOVA results for joint strength.
Results of ANOVA for joint strength.
ANOVA: analysis of variance.
Fisher test
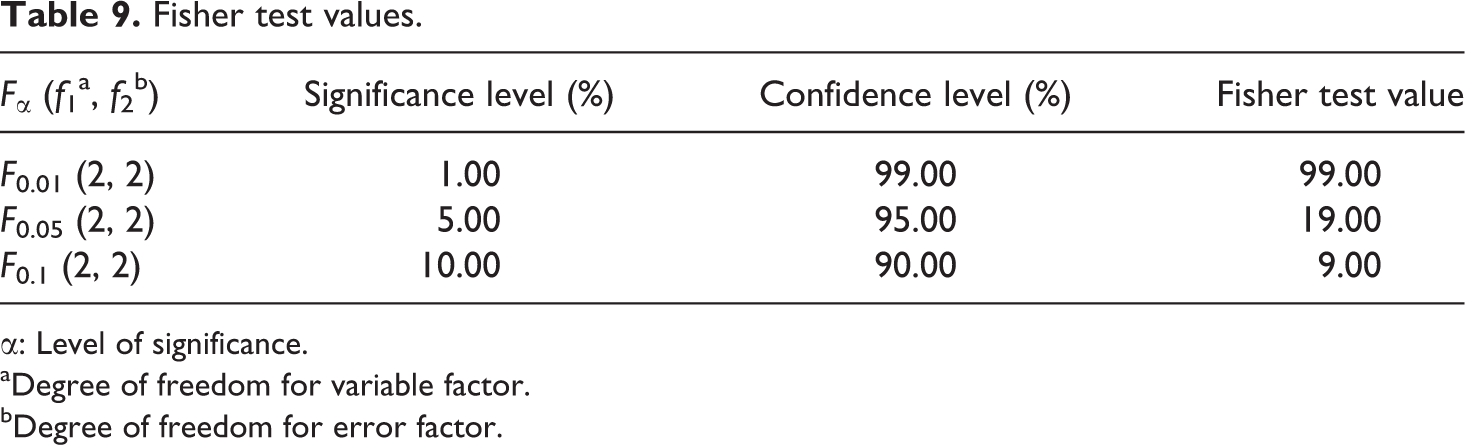
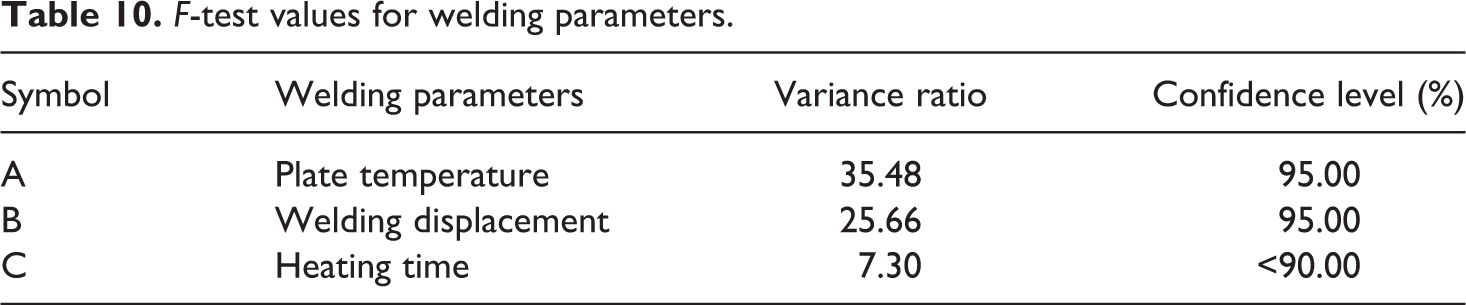
As a second phase of the statistical analysis, the Fisher test 19 is used to assess the degree of significance of parameters. Larger F value displays that the variation of the welding parameters produces a big change on the effectiveness. The results of ANOVA reveal that the evaluated welding parameters are significant factors affecting joint strength. After the variance ratios (F) in Table 9 and Fisher’s test significance levels in Table 9 are evaluated together, Fisher’s test significance levels of factors affecting HPW process of PC/ABS blends can be summarized in Table 10. Because F value (35.48) for the plate temperature in HPW process is greater than F 0.05 (2, 2) which is theoretically calculated by Fisher test value for this parameter, confidence level is greater than 95% as seen from Table 10. Likewise F values for welding displacement are greater than F 0.05 (2, 2), then confidence level for factors, plate temperature, and welding displacement are greater than 95.0% and one of the factors, heating time, is less than 90%. The plate temperature was also found to be most effective (dominant factor) in increasing joint strength.
Fisher test values.
α: Level of significance.
aDegree of freedom for variable factor.
bDegree of freedom for error factor.
F-test values for welding parameters.
Rate of contributions of factors to joint strength
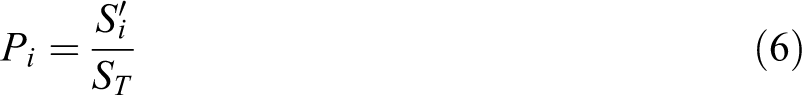
The percentage of contribution (Pi ) is the part of the total variation observed in the experiment attributed to each significant factor. It is a function of the sum of squares for each significant item and it is the ratio of sum of squares (S′) to the total of sum of squares ST . It indicates the relative power of a factor to reduce the variation (equation (6)):
If the welding parameter levels are controlled precisely, the total variation could be reduced by the amount indicated by the percentage of contribution. In this study, for the PC/ABS blends, the plate temperature was a highly important factor and played an extreme role in impressing the UTS and for the joint efficiency of the welding. The effect of each control factor upon the welding process can be observed in Table 8.
Only 1.4% of the variance was induced by experimental errors. It proves that the experimental design was very successful. The percentage of the contribution of the plate temperature, welding displacement, and heating time is shown in Figure 8. The most important factor that influences the HPW process was the plate temperature with 51.1% contribution rate. The total contribution rate of the HPW parameters was 98.6%.
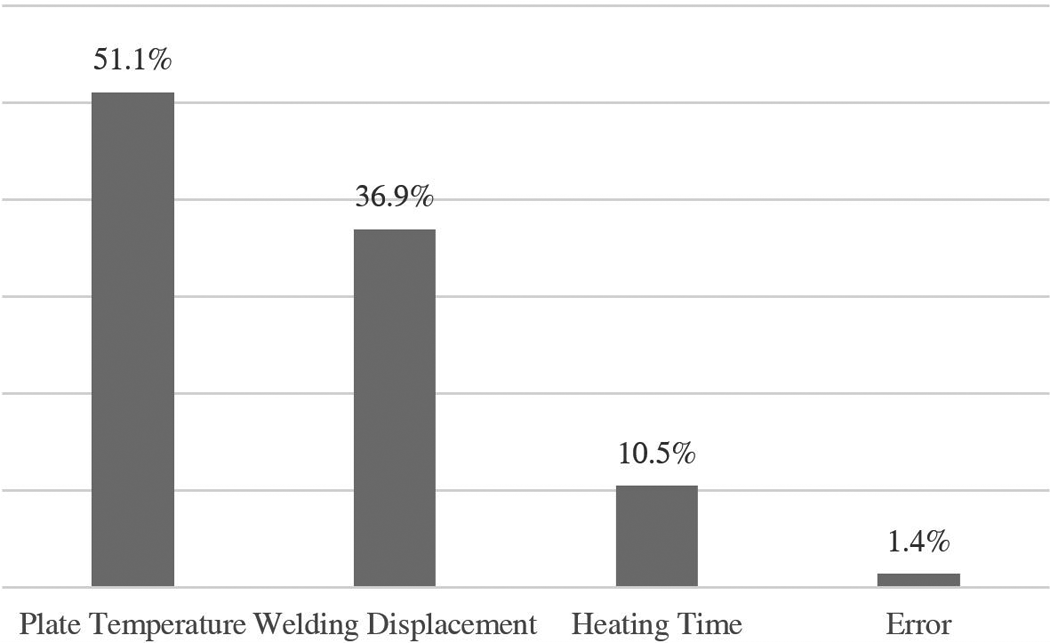
Rate of the contribution for welding parameters.
Optimal joint strength
Prediction of optimum HPW parameters
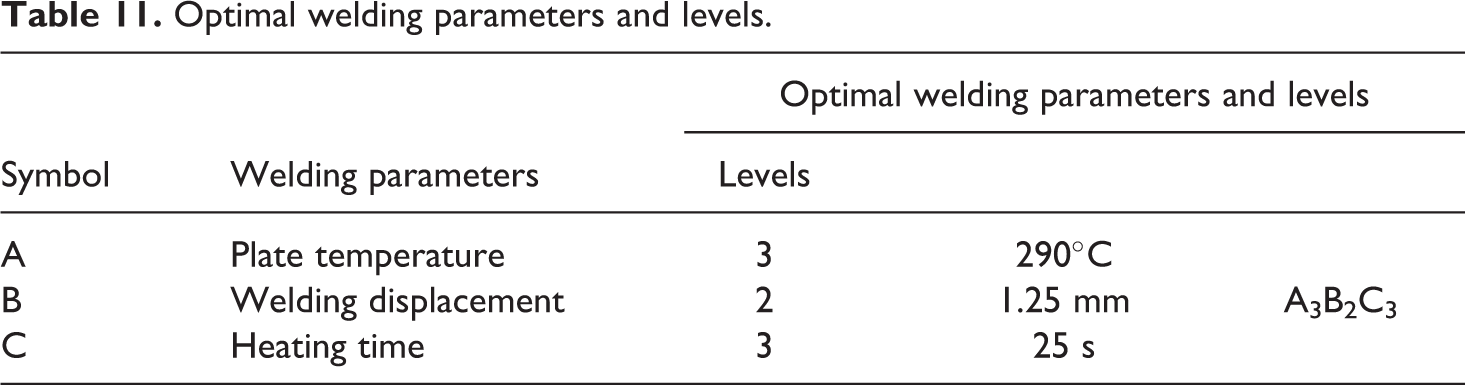
Based on the results of tensile tests for PC/ABS blends weld specimens, and according to S/N ratio response table (Table 6) and main effects plot (Figure 6), optimum welding parameters are found as A3B2C3. Optimum welding parameters and levels are given in Table 11. For joint efficiency of HPW process for PC/ABS blends, if plate temperature (A), welding displacement (B), and heating time (C) are set to levels 3, 2, and 3, respectively, optimal joint strength will be reached based on Taguchi method (Table 11).
Optimal welding parameters and levels.
Optimal joint strength and joint efficiency
Since optimal welding parameters for joint strength is A3B2C3, optimal joint strength (JSopt.) is calculated by equation (7) 20,35 :

where Tm is the average of mean of joint strength values in Table 5:
The joint efficiency corresponding to joint strength of 18.13 MPa regarding UTS of the base material properties is 34.5%. S/N ratio for optimum joint strength JSopt. is calculated by equation (2) derived from equations (4) and (5). 20,35
If yi is substituted by JSopt. in equation (4), equation (4) can be written as equation (8) below:
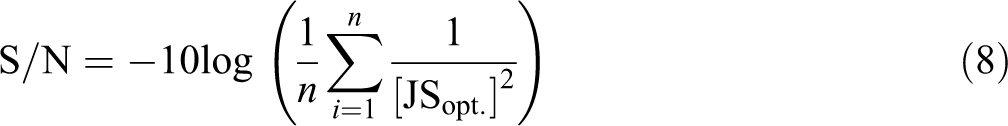
S/N ratio is calculated as 25.17 dB. The calculated JSopt and S/N ratios are given in Table 13.
Confirmation of experiments and results
The final step after determining the optimum welding parameters is the confirmation of the improvement in the joint strength using optimal welding parameters. The aim of confirmation experiments is to validate the conclusions drawn during the analysis. In order to verify the developed models, confirmation experiments should be conducted. In this study, the confirmation experiments were carried out using the optimum levels for tensile strength. The results of confirmation experiments are shown in Table 13.
Prediction of initial HPW parameters
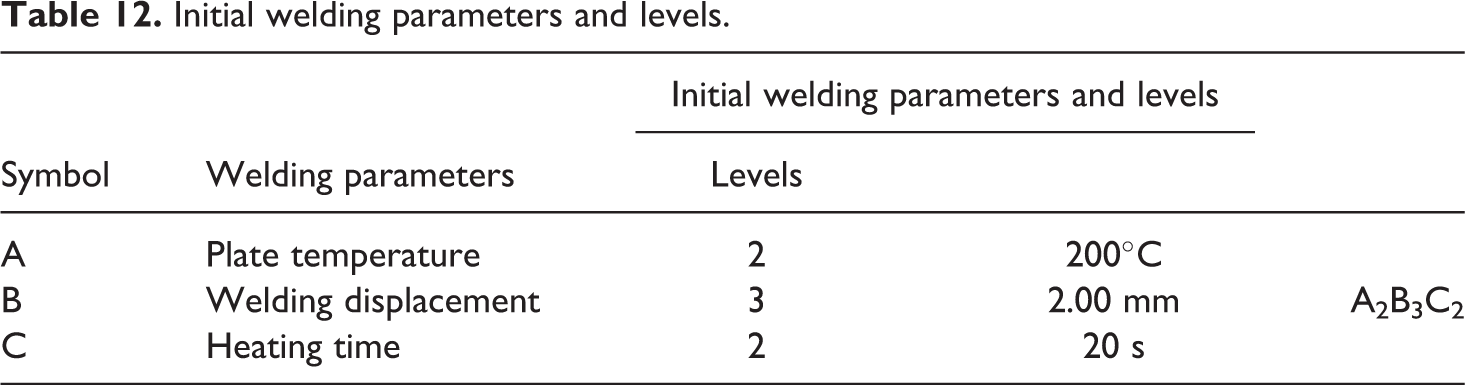
The main effects plot for joint strength for S/N ratios which is used for optimal welding parameters is also utilized to determine the initial welding parameters. The initial welding parameter levels are found as A2B3C2 which represent the levels closest to the average levels in Figure 6 and the corresponding levels are also shown in Table 12.
Initial welding parameters and levels.
Initial joint strength and joint efficiency
Since initial welding parameters for joint strength is A2B3C2, initial joint strength (JS i ) calculated by equation (9) resembling equation (7) 20,35 :

where Tm is the average of mean of joint strength values in Table 5:


The joint efficiency corresponding to joint strength of 11.81 MPa regarding UTS of the base material properties is 22.5%. S/N ratio for initial joint strength JSi is calculated by the equation (2) resembling equation (8) and found as 21.44 dB. The initial joint strength and S/N ratio are tabulated in Table 13.
Results of confirmation experiments.
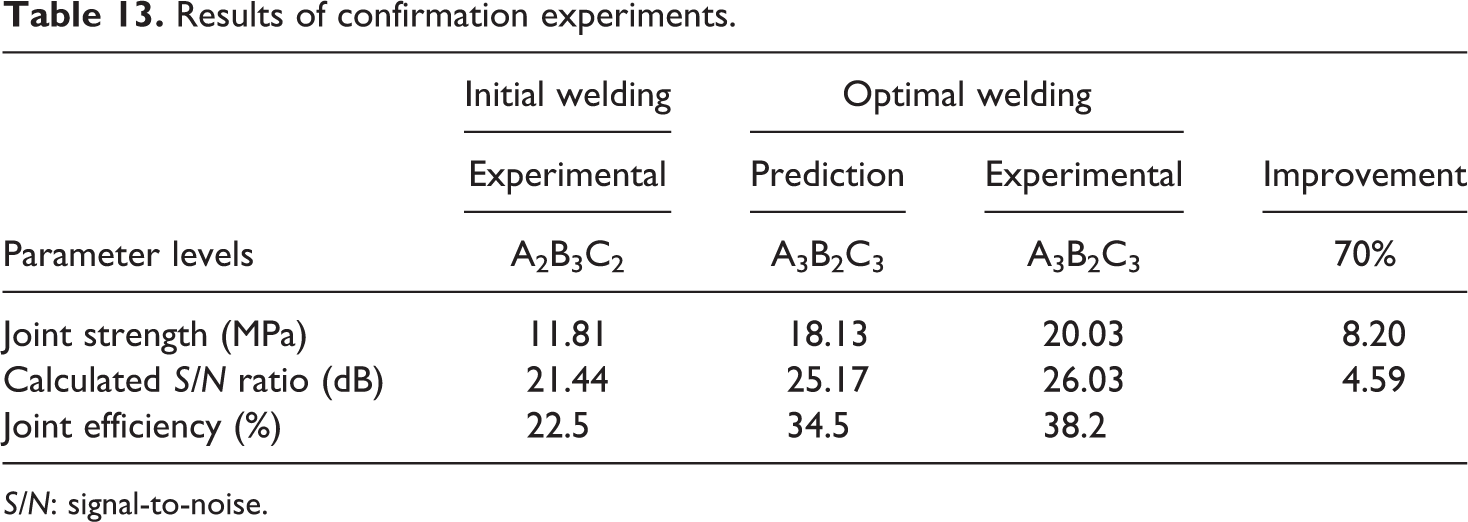
S/N: signal-to-noise.
Results of confirmation experiments
After setting the optimal welding parameters to maintain the reliability of confirmation experiments, HPW process is repeated with three specimens, and average tensile test results of three weld specimen (20.03 MPa) are shown in Table 13. The predicted value of joint strength is in a reasonable agreement with experimental value.
The confirmation experiments show that the joint strength gain is about 70%. The S/N ratio is improved by 4.59 dB and the joint strength is increased 8.20 MPa from the initial welding parameters to the optimal welding parameters (Table 13).
Conclusion
This study has performed an application of the parameter design of Taguchi method and optimization method to find the optimum levels of welding parameters used in hot plate welded PC/ABS blend specimens. As put on display in this study, the Taguchi method provides a systematic and efficient methodology for the optimization of the welding PC/ABS blends. Through the use of this method, number of experiments and time required to investigate the effectiveness of the welding parameters are decreased, and experimental efficiency has been accomplished in the study. The OA of L9, the S/N ratio, and ANOVA were unified. The ANOVA approach unveiled the contribution of each parameter in joint strength.
Depending on the experimental results of this study, following conclusions can be deduced. After decomposition by ANOVA, it is clear that plate temperature is most influent parameter with a value of 51.1% on joint strength and this was succeeded by welding displacement of 36.9%, heating time of 10.5%, respectively. The optimum welding parameters for the hot plate joint strength are plate temperature of 290°C, welding displacement of 1.25 mm, and heating time of 25 s. The joint strength of the optimum combination of parameters was found to be 18.13 MPa. The confirmation runs show that the S/N ratio is improved by 4.59 dB and the joint strength is increased to 20.03 MPa from the initial to the optimal welding parameters, which also means the joint strength gain is about 70%. The results from the confirmation runs verify the effectiveness of the Taguchi robust design methodology in the HPW process optimization. The optimization has improved the joint efficiency from 22.5% to 38.2%.
This study represents how to use Taguchi parameter design for optimizing HPW performance. The further studies could consider simulations and mathematical modeling and HPW process in order to approve the experimental results for PC/ABS blend. Also, future studies could examine HPW of dissimilar polymers.
Footnotes
Acknowledgement
The authors are deeply grateful for the technological and informational support of Department of Mechanical Engineering of Dokuz Eylul University and Department of Polymer Technology of Ege University, Izmir, Turkey.
Declaration of Conflicting Interests
The author(s) declared no potential conflicts of interest with respect to the research, authorship, and/or publication of this article.
Funding
The author(s) received no financial support for the research, authorship, and/or publication of this article.