
Abstract
Poly
Keywords
Introduction
Biocomposites are considered as environmental friendly materials. It is an alternating material to decrease the environmental pollution. They are being employed for a wide range of applications from commodity materials to engineering applications.1–3 There are many biocomposite systems used for food packaging materials due to its cost-effectiveness, maintains of food safety, and minimize its environmental impacts.4,5 A packaging material requires high mechanical properties, antimicrobial activities, and gas barrier properties.6,7 Antibacterial polymeric materials can be used in biomedical, textiles, and coating applications effectively.8,9 Silver (Ag) nanoparticles is one of the antibacterial nano fillers used in many polymeric matrixes. It shows high antibacterial properties along with high thermal stability. 10 Tripathi et al. had prepared poly(vinyl alcohol)/silver nanocomposite films, which showed excellent antibacterial activity against Salmonella typhimurium. 11 Brito et al. brought to light the low-density polyethylene (PE)/Ag composite film for food packaging applications. 12 Tiimob et al. found antimicrobial properties of the co-polyester polymer composites containing silver-eggshell particles as filler. 13
Photocatalytic application of metal oxides is widely studied, it produces active free radicals in presence of UV or visible light. They are nontoxic, biocompatible, low cost, easily available, and inert. Photocatalytic materials decompose organic dyes in different mechanisms based on their chemical nature, where the reliable mechanisms are electrons and holes generated from photocatalyst or active free radicals by UV–visible light which are responsible for catalytic decomposition reactions.14,15 The presence of transition metals enhances the charge transfer and increases the photochemical degradation process. Rauf et al. revealed transition metals dopped TiO2 photocatalytic materials for the removal of organic dyes in wastewater. 16
Poly(ethylene-co-vinyl acetate) [EVA] is a random copolymer of ethylene and vinyl acetate. It is a thermoplastic elastomer. It is one of the extensively used materials in food packaging application in the form of films, and foams. The diverse properties of EVA depend upon its vinyl acetate (VA) content, which extends the application from plastics to elastomeric products. The presence of VA functional group in its structure gives polarity to the polymer that reflects in its solubility, adhesion, permeability and filler reinforcement properties. The crystallinity of EVA is inversely proportional to the percentage of VA content in the polymer molecule.17,18
EVA has promising properties such as toughness, appreciable strength, low heat seal temperature and good low-temperature properties. It does not contain plasticizers and other volatile substances. It has low toxicity and odor. Vinyl content in the polymer allows the homogeneous distribution of the filler. This filler imparts the properties such as antibacterial and dye degradation. Thermoplastic EVA is one of the commodities of polymer matrix used for packaging application. There are extensive research being carried out on the EVA based polymer composites for various applications. The sample prepared for the current work have bifunctional properties which are antibacterial and dye degradation. The enhancement of both the functional properties by incorporation of a single filler differs this work from other conventional EVA based composites.
Scallop shell powder is natural benign filler for different polymer matrices. The CaCO3 which is present in the scallop shell shows lower density and a larger surface area than the mineral calcium carbonate. 19 Because of these characteristics, it can be used as fillers in the polymers, and also to make composites. It increases the mechanical properties of the polymers. Among the various seashells, the scallop shell powder is considered a recovered waste and provides a useful raw material. Therefore it is regarded as commercial waste. Seashell undergoes thermal decomposition to form calcium oxide (CaO). This CaO powder consists of small particles, which shows antimicrobial properties. It is an adsorbent for toxic gases, bactericides, and a photocatalyst for the elimination of dye from waste water.20,21 Though different photocatalytic material had been reported, composite material based on EVA with silver scallop shell powder has not been recognized. Scallop shells are abundant, eco-friendly, and economic material. They are easily available from shell waste. It is the major component in the Ag-CS filler used for the current work. It provides antibacterial and photo degradation properties to this system.
The objectives of the present work is to synthesis of antibacterial and photocatalytic Ag-CS filler with which composites with thermoplastic EVA is prepared. The structural, morphological, thermal, mechanical, sorption, and hydrophilic properties were employed to characterize the composite films. The photocatalytic degradation study was conducted on methylene blue (MB) dye in aqueous solution. The antimicrobial activity of the films was tested against Staphylococcus aureus (S. aureus) and Escherichia coli (E. coli) bacteria.
Experimental
Materials
The scallop shell (Pectinidae) waste was collected from a snail farm at Kozhikode, Kerala, India. Methylene blue (MB) dye was purchased from Merck, Darmstadt, Germany. Sodium hydroxide, hydrochloric acid, acetone, silver nitrate was purchased from Fisher chemicals, Bombay, India. Poly(ethylene-co-vinyl acetate) with18% vinyl acetate content and melt flow index of 2 g/10 min, are supplied by National Organic Chemical Industries Limited, Mumbai, India.
Preparation of silver-calcined scallop shell (Ag-CS)
Calcined scallop shell powder (CS) was prepared by sol–gel method. The scallop shell powder was washed in a stream of water, dried and pulverized using a mortar. 10 g of scallop shell powder was dissolved in 250 mL dilute HCl (HCl: H2O = 1:9). The dissolution continued till the effervescence was over. 250 mL 2M of NaOH solution was added dropwise into the solution with vigorous stirring. The stirring was continued for 60 min and allowed for settling 180 min. The suspension thus obtained is centrifuged at 3000 rpm for 5 min to obtain Ca(OH)2 gel, which was washed twice with distilled water and calcined at 900°C in a muffle furnace for 2 h. Ag-CS was prepared by refluxing 1 g of CS with 0.075 molar concentrations of 20 mL AgNO3 solution at 100°C for 2 h. The residue was collected by the centrifugation. The residue was further washed with acetone to remove impurities and followed by calcination at 500°C for 3 h.
Preparation of EVA/silver-calcined scallop shell powder composites (EVA/Ag-CS)
EVA/Ag-CS composite films were prepared by wet phase inversion method. The formulation of different composite films is given in Table 1. Twenty gram of EVA polymer was dissolved in 25 mL tetrahydrofuran (THF) at 50°C. To prevent excessive solvent vaporization, a reflux stream was used. In the solution, different weights of Ag-CS were added along with stirring. Stirring was continued for 4 h. This suspension was transferred into a petri dish and cast to films of uniform thicknesses. The petri dish was immersed in an ice-cold water and kept for 12 h. The obtained films were dried in a vacuum oven for 24 h.
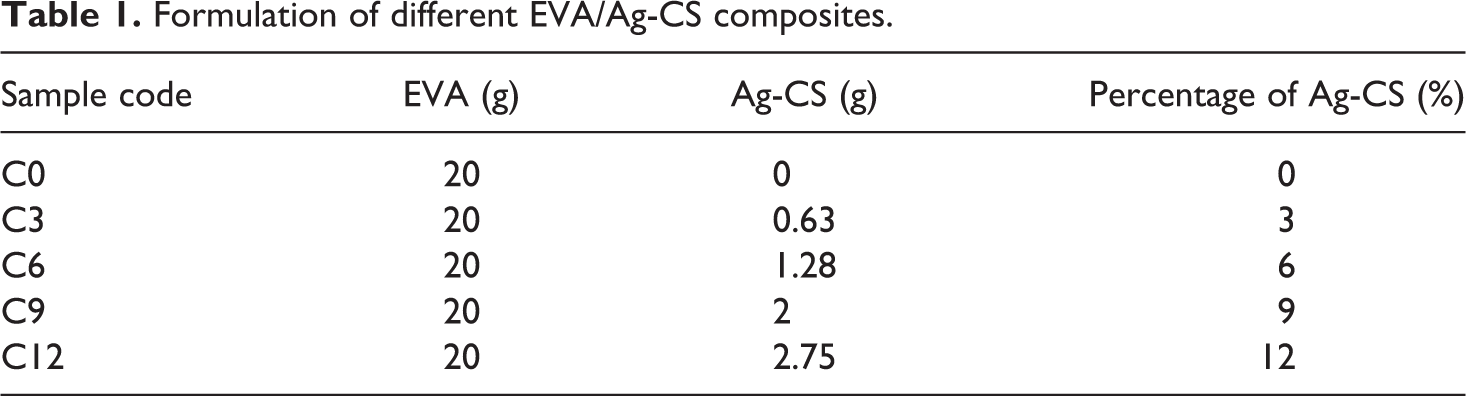
Formulation of different EVA/Ag-CS composites.
Characterization of samples
The prepared samples were characterized by various techniques. The functional groups characteristics were analyzed by Fourier transform infrared (FTIR) spectroscopy. FTIR spectra of the samples was taken from 4000 cm−1 to 400 cm−1 using JASCO FTIR-4700 spectrometer. The crystalline structure of samples was analyzed by Rigaku Miniflex-600 X-ray diffractometer. The X-ray diffraction patterns were scanned from 2θ values between 5° to 90°. The thermal stability of the samples was studied from TA-Q50 thermogravimetric analyzer in the range of 50–700°C. The phase transition of the samples was identified using a differential scanning calorimetric (TA-Q20). Both the thermal property tests were done at N2 atmosphere with the purge flow of 5°C/min. The photo degradation studies were performed in a Shimadzu UV–vis 2600 spectrometer. The tensile properties of composite films were evaluated by a universal testing machine (UTM, Shimadzu AG-X plus) with a crosshead speed of 5 mm/min. The morphology was observed by field emission scanning electron microscope (FE-SEM Hitachi-SU6600) with 10 kV accelerating voltage. The cross section of samples was analyzed by SEM-EDX (JSM-6390LA, EX-2300, JEOL, Tokyo, Japan). The analysis performed at 20 kv voltage.
Water sorption test
The water absorption test was performed according to the ASTM D750-95 standard procedure. 22 Prior to the test, each specimen was dried in a vacuum desiccators for 24 h and weighed immediately using an electrical balance to get initial weight (w1). Then the samples were immersed in 20 mL distilled water in a vessel and kept at room temperature. Each sample was removed from the water, wiped with tissue paper to remove the excess of water from the surface, dried, and weighed within the 30 s (w2). Water absorption is determined by weighing each sample at a regular time interval. The sorption study was done for 45 days until the equilibrium swelling was obtained. Percentage of water absorbed by the samples has been calculated using Eq. (1).

Contact angle measurement
The wettability of the EVA/Ag-CS composite film samples was studied by means of contact angle measurement using a goniometer (Digidrop, GBX). The measurement was taken with de-ionized ultra-filtered water, on samples, at room temperature. The volume of the water droplet was kept constant at 20 µL in all cases using a microsyringe. The contact angle was measured within 30–45 s. The measurements were repeated six times with different parts of each film to calculate the average value of the contact angle.
Antibacterial test
The antimicrobial property of the EVA/Ag-CS composite films was tested against standard Gram-positive (S. aureus—MTCC 3160) and Gram-negative (E. coli—MTCC 2842) bacteria by agar-disc diffusion method. 23 Nutrient agar medium is prepared by mixing 5 g of peptone, 5 g of NaCl, 20 g of agar, and 2 g of yeast extract in 1 L distilled water. The pH was adjusted to 7.0 and the nutrient was sterilized in an autoclave at 130°C for 40 min. This nutrient agar media is transferred into sterilized petri dishes in a laminar airflow unit. After solidification of the media, the pre cultured bacteria were swabbed across the petri dishes. To this, 500 µg of samples were added and incubated at 37°C for 24 h. The diameter of the inhibition zone (mm) was measured.
Photocatalytic activity
The photocatalytic performance of the EVA/Ag-CS composite film was evaluated by the degradation of methylene blue (MB) dye aqueous solution of 3.2–19.2 ppm at pH of 6. 24 The reaction suspension was prepared by adding 0.03 g of various samples into 30 mL dye solutions separately and stirred in dark about 30 min with a magnetic stirrer. Visible light irradiation for this experiment was obtained using a projection lamp of 250 W (Philips Lighting India Ltd., Kolkata, India) in a photocatalytic chamber. The prepared suspension was kept under irradiation with continuous stirring at room temperature. During the irradiation, about 5 mL of the dye was removed at regular intervals of time (10 min) and immediately centrifuged to remove the residue. The absorbance of the methylene blue aqueous solution was measured after regular intervals at 664 nm using the UV–Visible spectrophotometer. The degradation efficiency was calculated as in Eq. (2).

where A0 and A are absorbance initially and after 60 min, respectively.
Results and discussion
FTIR analysis
Fourier transform infrared (FTIR) spectra of EVA, EVA/Ag-CS, Ag-CS, and CS are shown in Figure 1(a). The FTIR spectrum of CS has characteristic peaks at 3648, 1408, 872, 720, 465 cm−1. In which the band at 1408, 872, and 720 cm−1 are related to CO3 2 − and C–O in CaCO3, formed by the carbonation of CaO and Ca(OH)2. The wide and strong band at 465 cm−1 is due to the vibration of the Ca–O bond in the sample. The CS shows a strong band at 3648 cm−1 corresponding to the O–H bond of adsorbed water molecule.25,26 The incorporation of silver particles in CS leads to an increase in the intensity of all peaks except the hydroxyl peak at 3648 cm−1. It is due to the reduced amount of moisture in the Ag-CS sample. The incorporation of Ag particle reduced the active sites for trapping the moisture. It indicates the interaction of Ag in CS. Similarly, the incorporation of silver particles in CS leads to a small shift in the peaks to lower wave numbers. The bands at 1408, 872, 720, and 465 cm−1 in CS are shifted to 1401, 864, 712, and 451 cm−1 respectively. It confirms the interaction of silver particles with different reaction sites of CS.27–29 In the case of EVA, the peak at ethylene group are present at 2916, 2850, 1459, 1365, and 712 cm−1, while the typical absorption bands of vinyl acetate group in pure EVA appear at 1727, 1234, and 1017 cm−1. A newly observed peak at 451 cm−1 in EVA/Ag-CS shows the presence of CaO bond. The incorporation of Ag-CS in the EVA matrix leads to an increase in the intensity of peaks of vinyl acetate in EVA/Ag-CS composite film. The carbonyl (C=O stretching) peak at 1727 cm−1 and C–O–C stretching) peak at 1017 cm−1 of EVA/Ag-CS is increased than pristine EVA. The Ag-CS sample contain Ag, CaO, Ca(OH)2, and a little amount of CaCO3. The CaCO3 also contain the C=O, and C–O–C stretching vibrations. These vibrations resulted the increase of ester peaks in the EVA/Ag-CS composite sample. This is due to the formation of composite film and the dispersion of silver particles and CS in EVA/Ag-CS. It indicates the dispersion of Ag-CS with different reaction sites of EVA.30–32
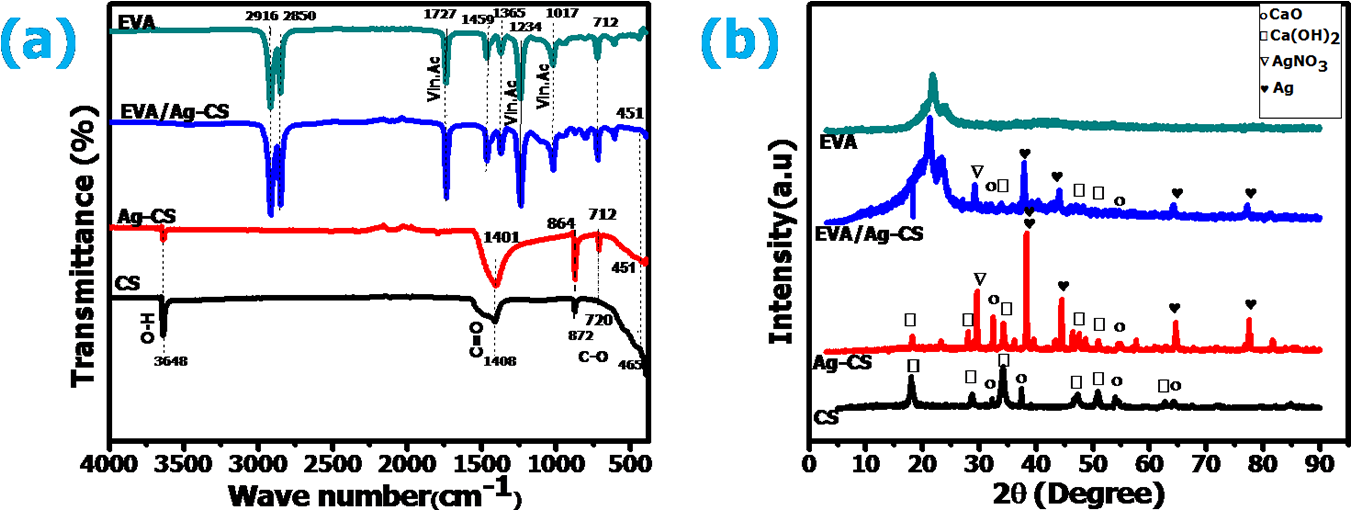
Characterization of pristine EVA, EV/Ag-CS, Ag-CS, and CS: (a) FTIR spectra and (b) XRD spectra.
XRD analysis
X-ray diffraction (XRD) pattern of EVA, EVA/Ag-CS, Ag-CS, and CS are shown in Figure 1(b). The XRD spectra of CS shows sharp peaks at 32°, 37°, 54°, and 64° corresponded to (111), (200), (220), and (311) planes respectively indicating the FCC structure of CaO. It attributed to standard data of CaO (JCPDS file 00-77-2376). Besides these, there are some peaks at 18.08°, 28.78°, 34.14°, 47.33°, 50.97°, and 62.65° also appeared. These might be due to the presence of hexagonal forms of Ca(OH)2 which is formed by absorption of moisture from the air (JCPDS file 01-087-0673). These CS peaks also were observed in EVA/Ag-CS film and Ag-CS composite that showed the interaction of CS in these composites.33–35 X-ray diffraction pattern of Ag was observed at 38.15°, 44.10°, 64.16°, and 77.17° which corresponds to the (111), (200), (220), and (311) planes, respectively. These peaks are good agreeing with the standard JCPDS data of the silver with FCC crystal lattice structure (JCPDS NO: 87-0720). In addition to these, there is a peak observed at 29° due to unreduced AgNO3 peaks. All of these peaks which are also observed in EVA/Ag-CS and Ag-CS. It confirms the presence of Ag particles that are successfully mixed into these composites.36,37 XRD of EVA shows two sharp peaks aligning with crystalline (ethylene group) and amorphous regions (vinyl acetate group). The intense peak at 21.70° (110 planes) correspond to crystalline regions and a weak peak at 23.06° (200 planes) is accepted to amorphous regions. 38 In EVA/Ag-CS these peaks become narrow and sharp indicating the crystalline nature of the composite film which support the interaction of Ag-CS and EVA film.
Thermal properties
Figure 2 shows TGA and DTG curves of CS, Ag-CS, EVA/Ag-CS and EVA. The thermogram of CS show three step weight losses at 345°C, 460°C, and 660°C. The first stage is attributed to the vaporization of physically adsorbed water. The second stage is the decomposition of Ca(OH)2 to CaO and the third stage degradation is decomposition of CaCO3 to give CaO. 39 During handling of sample, the presence of Ca(OH)2 and CaCO3 are seen due to the absorbance of moisture and CO2, respectively. Onset TGA of CS and Ag-CS were found to be 345°C and 360°C, respectively. It is noted that the incorporation of Ag in CS increases its thermal stability.40,41 The thermogravimetric analysis (TGA) of EVA shows two degradation stages. The first degradation process starts at a range of 315–376°C which corresponds to the removal of the acetate groups. The second step corresponds to the degradation of the polyethylene chain backbone of the copolymer and starts around 404–505°C.42,43 It was observed that the incorporation of Ag-CS in EVA lead to significant improvement in the thermal stability of EVA samples. The sample EVA showed onset temperature of 315°C. Whereas the sample C6 has onset temperature of 330°C. It was observed that sample C6 shows highest thermal stability than that of other system. This is due to the homogeneous distribution of Ag-CS filler in EVA matrix.
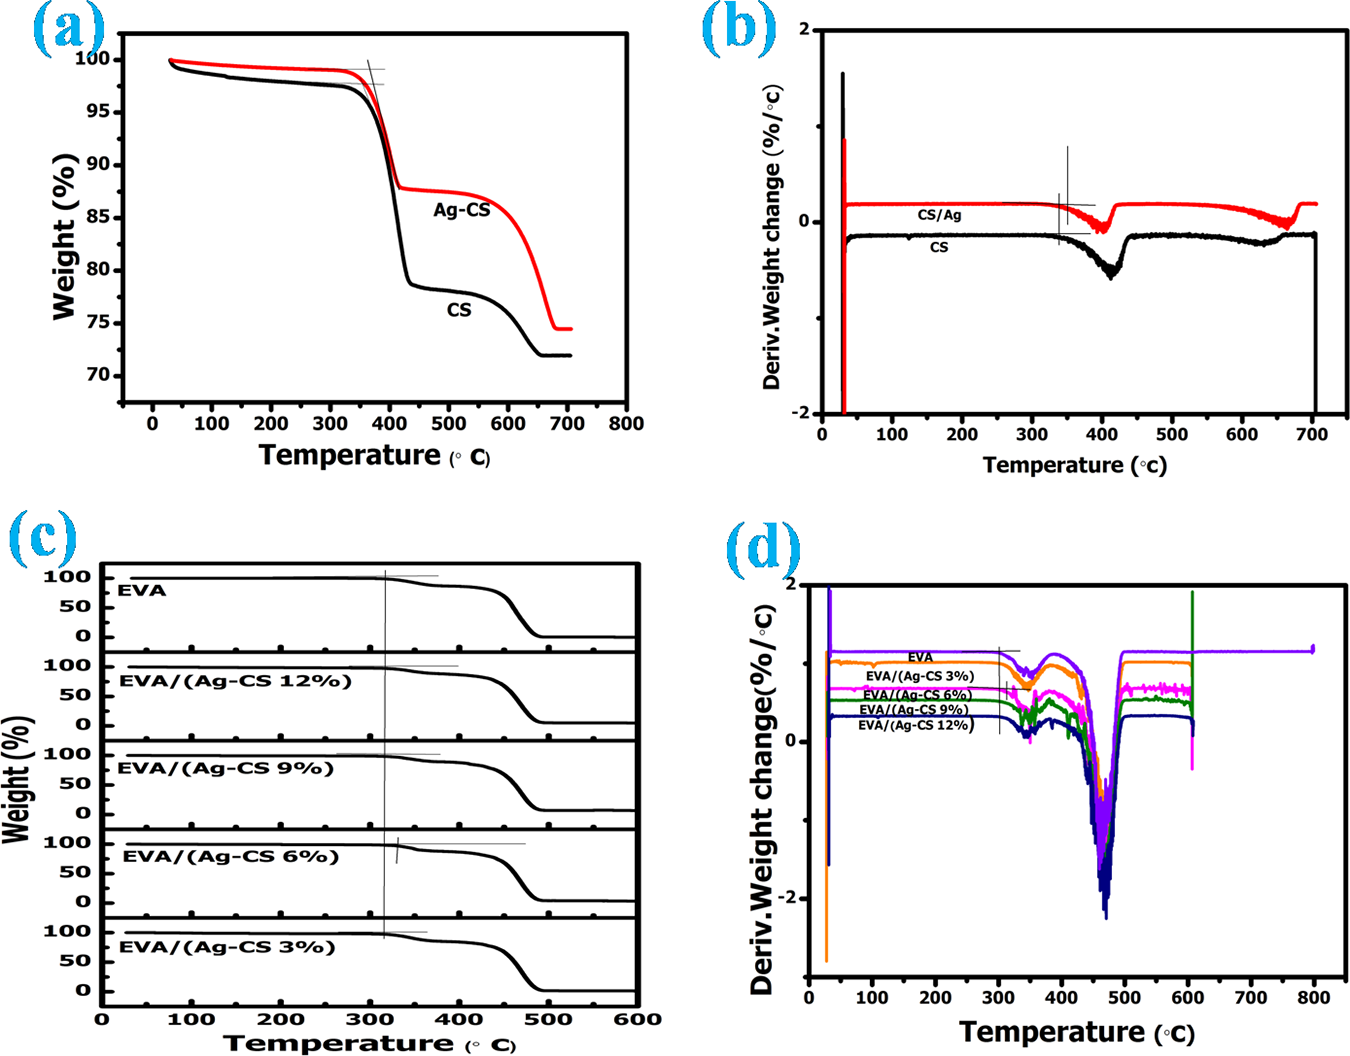
(a) TGA and (b) DTG curve of sample CS and Ag-CS and (c) TGA and (d) DTG curve of EVA and different EVA/Ag-CS composite samples.
Water absorption
The effect of Ag-CS filler in EVA on percentage of absorbed water is shown in Figure 3. It is seen that the percentage of absorbed water increased with an increase in Ag-CS filler loading. It is due to the hydrophilic nature of Ag-CS filler. 44 EVA/Ag-CS composite film with higher Ag-CS filler loading shows more water absorption.
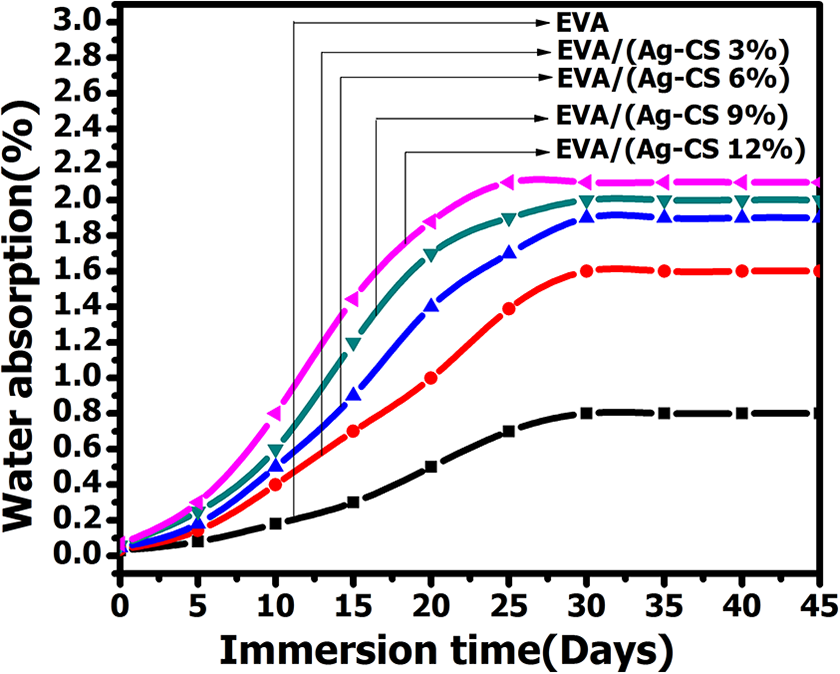
Equilibrium water sorption of EVA and EVA/Ag-CS composites.
Water contact angle
The wettability of different EVA/Ag-CS composite films is determined by contact angle measurement. The water contact angle of different EVA/Ag-CS films are illustrated in Figure 4. The water contact angle of EVA has decreased from 83.3 to 72.3 with the addition of 6% Ag-CS filler. It shows that maximum dispersion of filler 6% Ag-CS in EVA matrix. This is attributed to the hydrophilicity of the prepared sample. 45 Further loading there is no significant change was observed. It is due to the aggregation of Ag-CS filler in the EVA matrix.
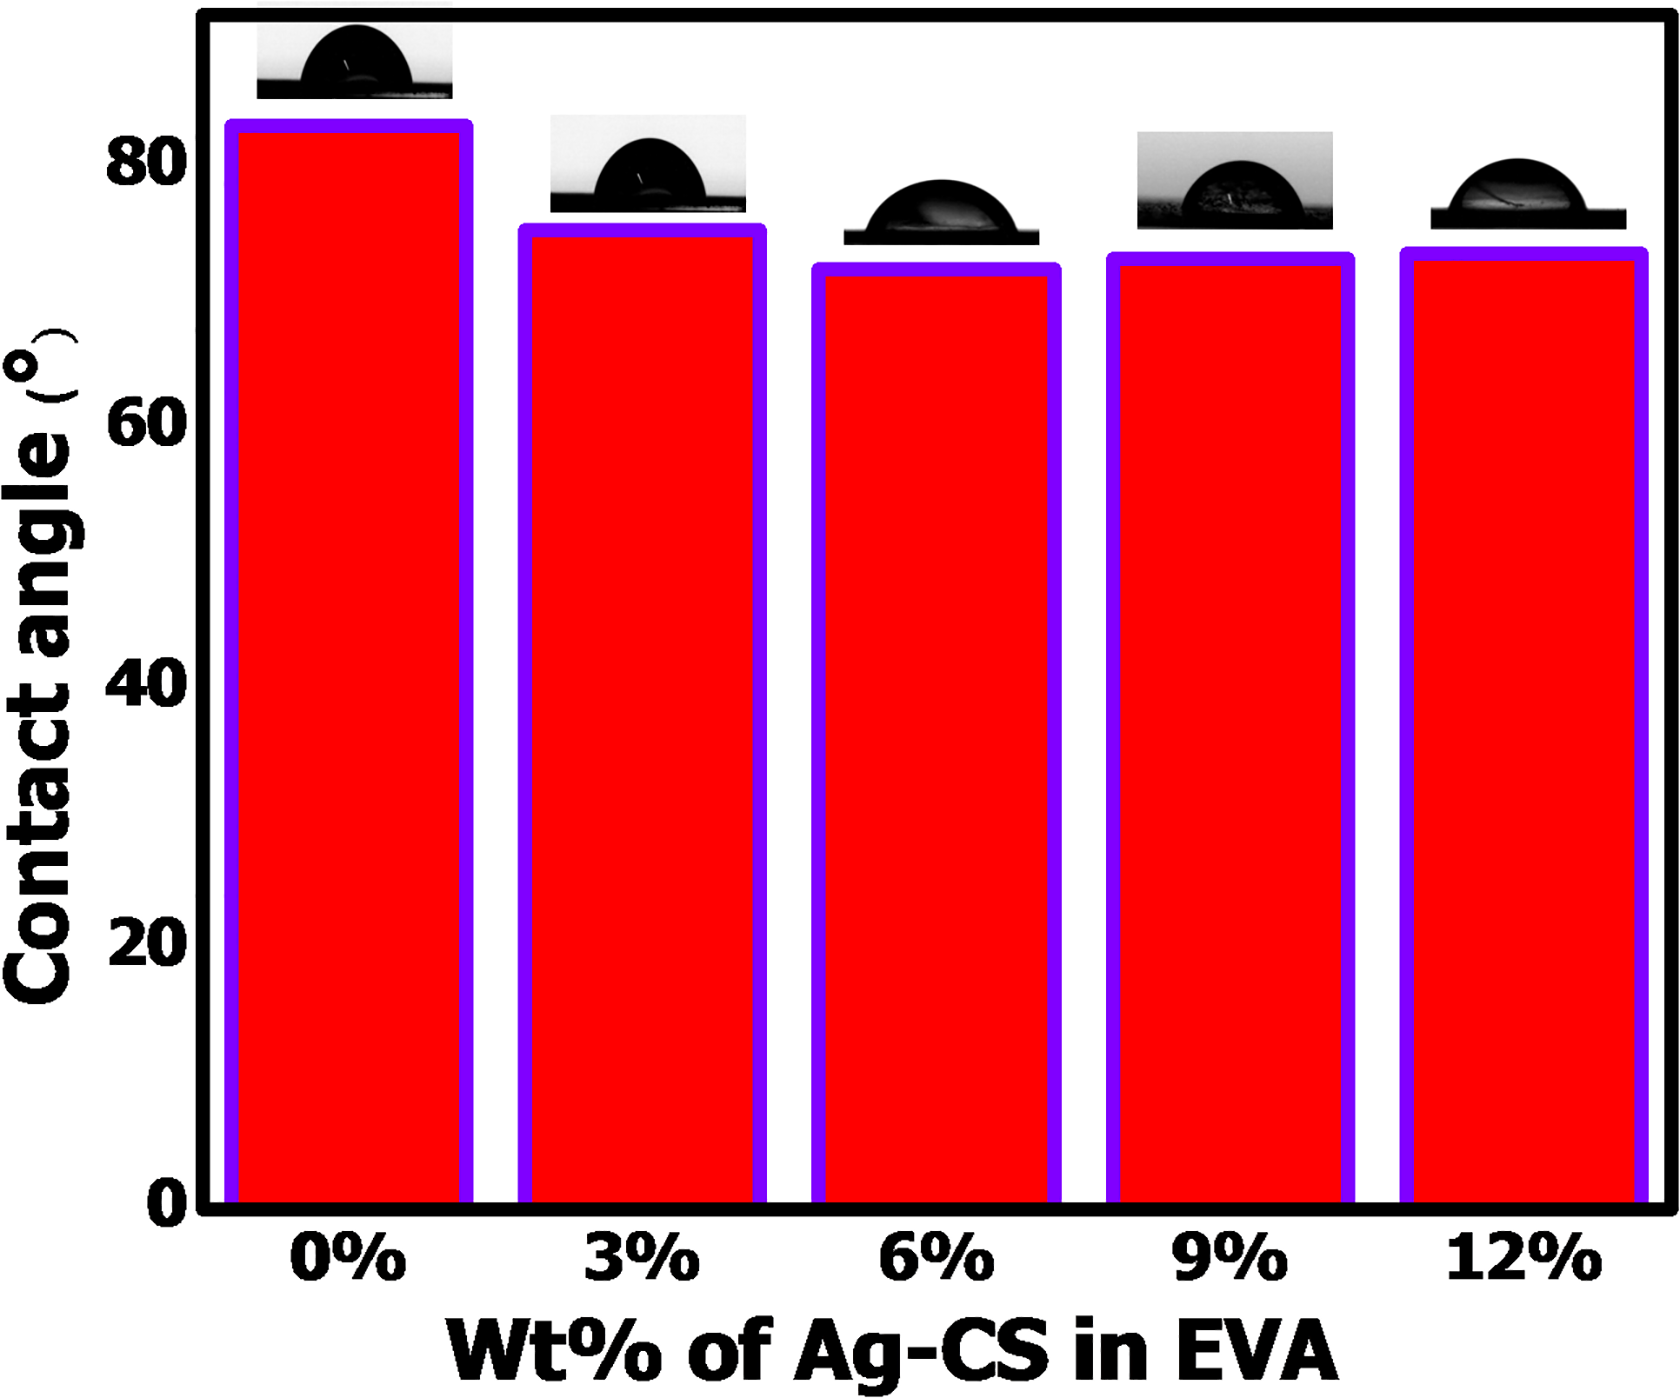
Effect of Ag-CS on the water contact angle of EVA/Ag-CS composites.
Morphology
FE-SEM images of scallop shell powder, prepared CS sample and Ag-CS sample are shown in Figure 5(a) to (c), respectively. Scallop shells possess similar to schistose structure, which is an aggregates of different layers. The CS particles exhibited as characteristic spherical structures ranging from 100–200 nm diameter. Ag-CS exhibited as white and dark morphology is due to the interaction between Ag and CS. From the distribution curve of Ag-CS particle (Figure 5(d)). The average particle size was found to be 203 nm.
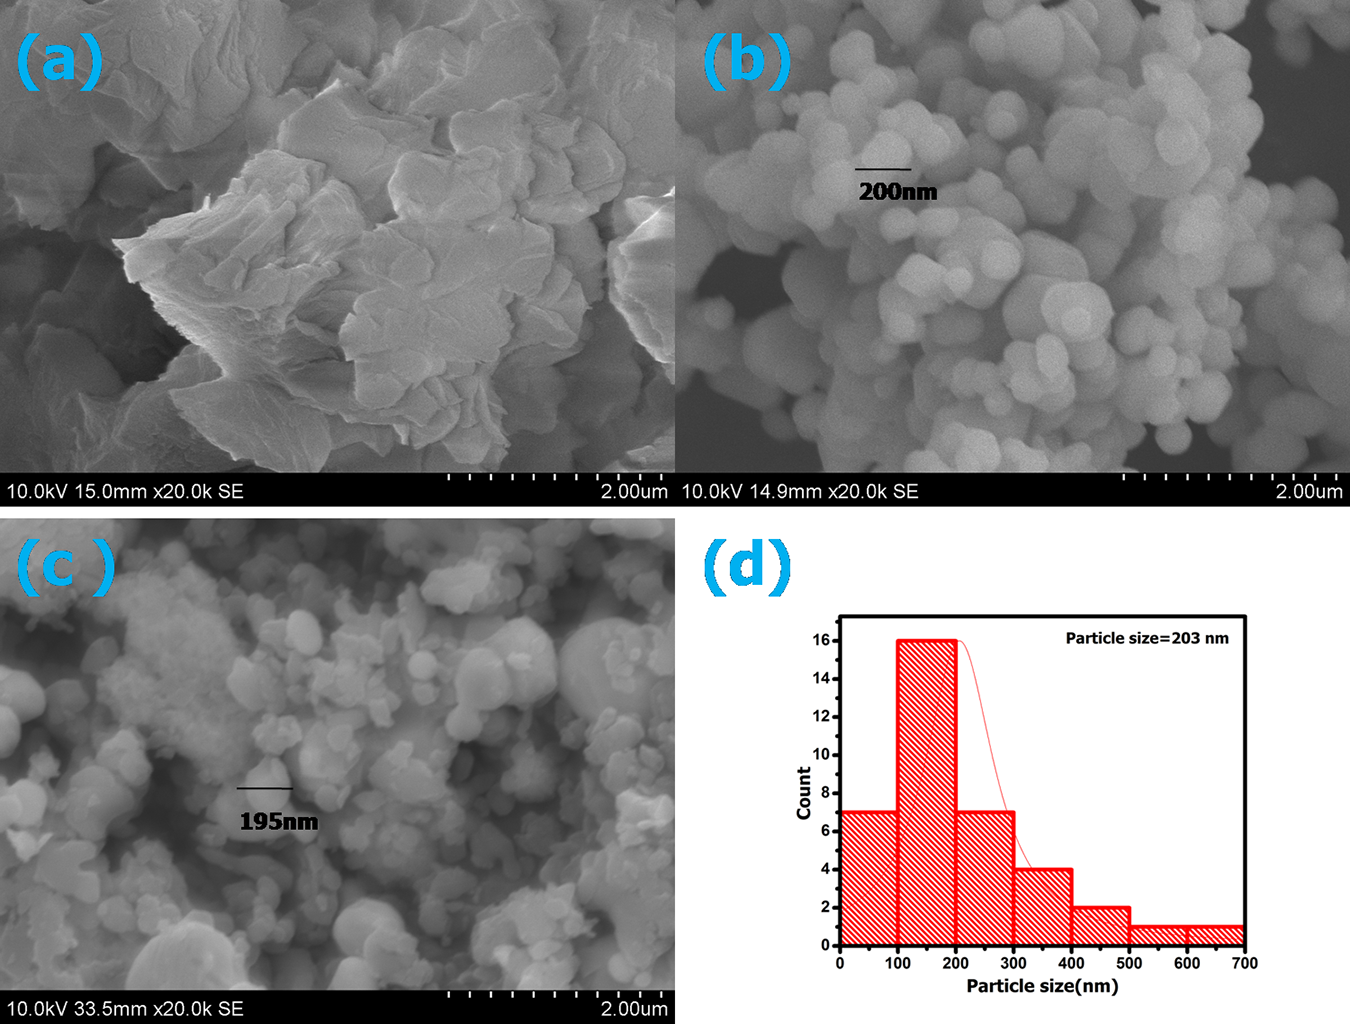
SEM images of (a) scallop shell powder, (b) CS particle, (c) Ag-CS sample, and (d) size distribution curve of particles in Ag-CS.
Figure 6 shows the distribution of Ag-CS particle in EVA copolymer matrix. The overall analysis confirms the presence of Ag-CS successfully added to the EVA matrix. The Ag-CS filler appears as the spherical white spot with approximately 100–200 nm. Figure 6(a) shows an EVA sample while in Figure 6(b), Ag-CS particles are found widely distributed in the EVA matrix. In Figure 6(c), Ag-CS particles appeared as homogeneous dispersion and were scattered as white spots on the samples. This indicate a strong interaction between Ag-CS and EVA matrix. In Figure 6(d), Ag-CS fillers are seen on the periphery than in the bulk of the samples. This is due to the aggregation of fillers with a large diameter. Figure 6(e) shows greater self agglomeration of filler Ag-CS, due to its excessive amount. Hence fillers are concentrated sidewise. From these images, it can be concluded that most of the fillers had been dispersed completely in Figure 6(c) and showed better adhesion between EVA and Ag-CS fillers. So this sample (C6) optimized for all characterization studies.
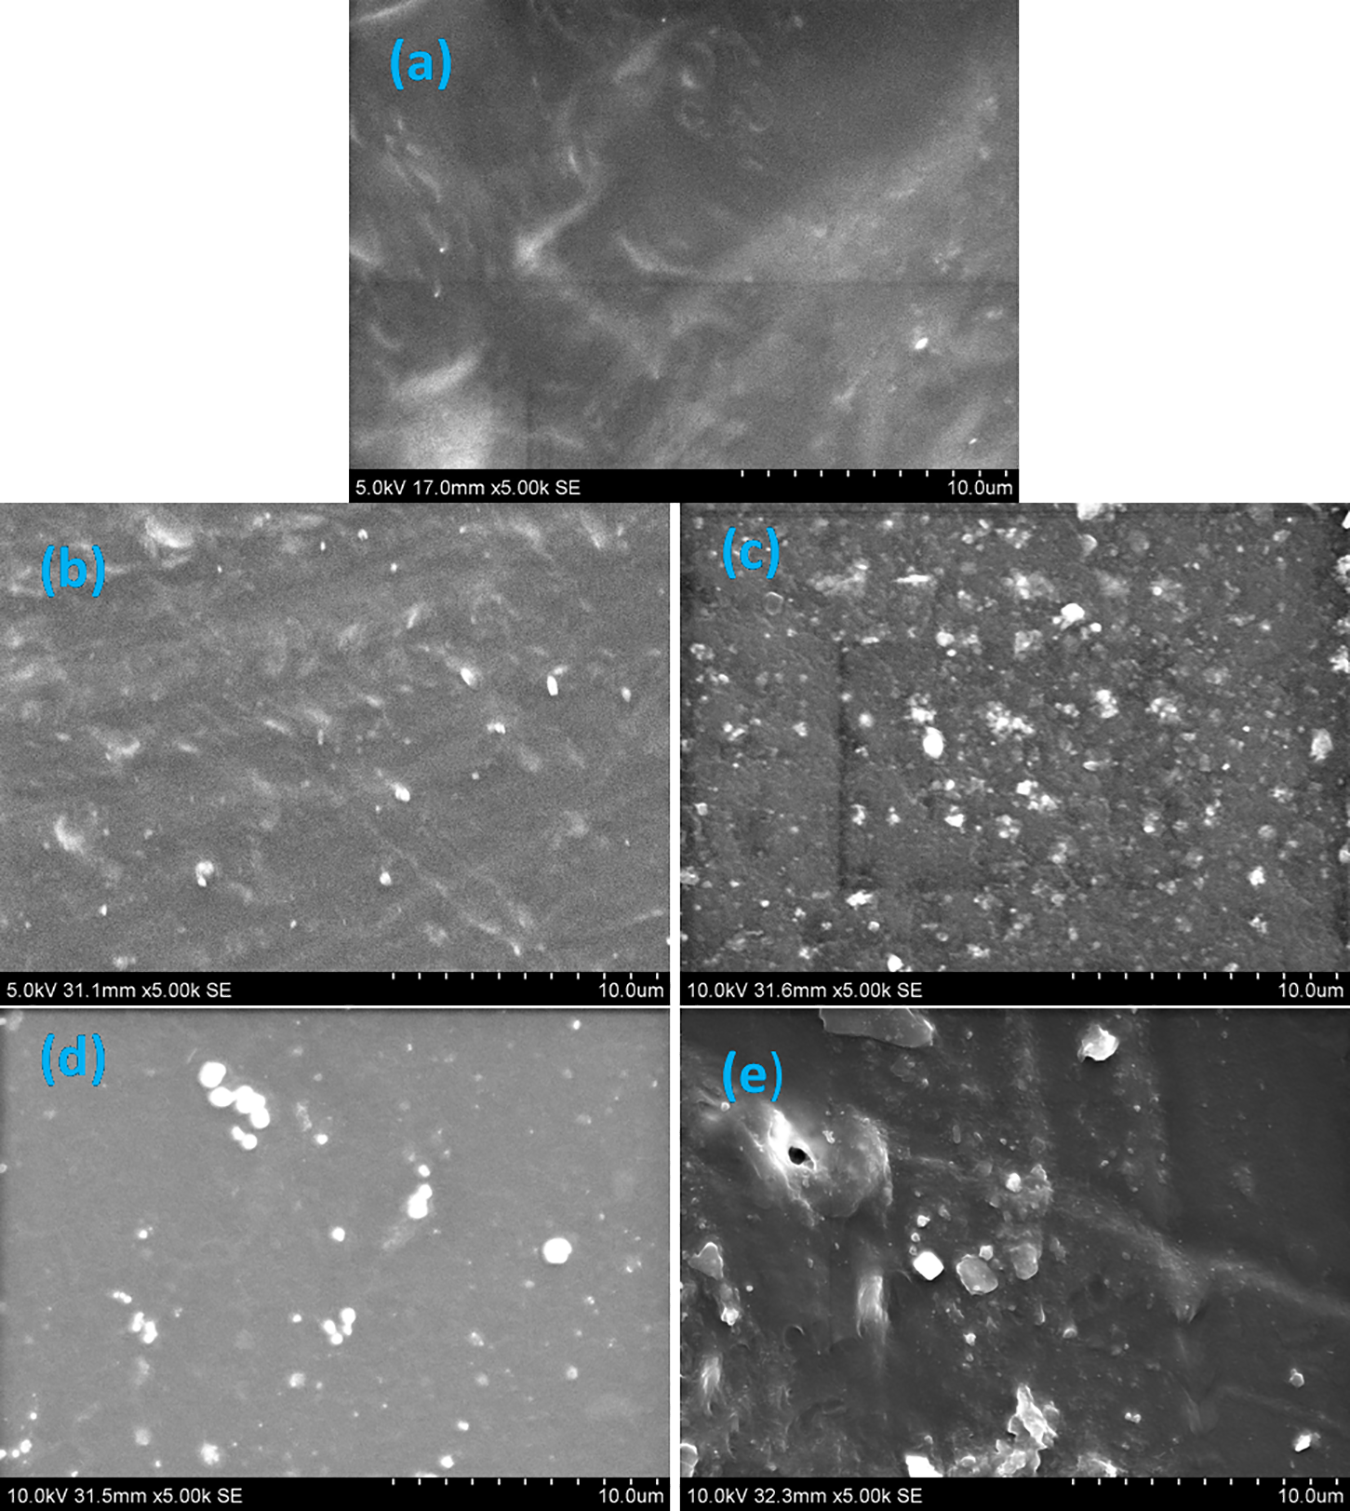
SEM images of different EVA/Ag-CS samples (a) pristine EVA (C0), (b) C3, (c) C6, (d) C9, and (e) C12.
EDX analysis
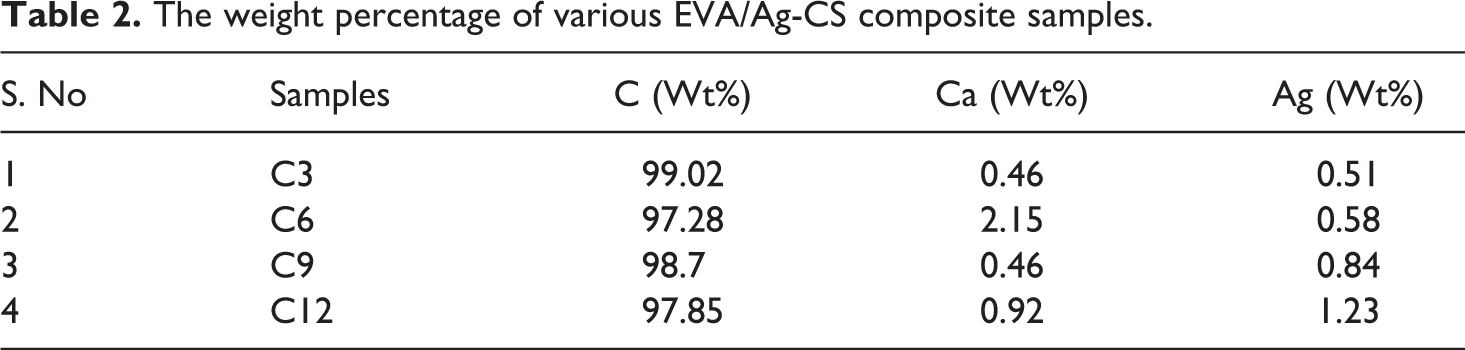
The constituents and relative abundance of the elements in the cross section of different EVA/Ag-CS composite samples were obtained from the Energy Dispersive X-ray (EDX) analysis as seen in Table 2. The obtained images of different samples are shown in Figure 7. The percentage relative composition of elements such as carbon (C), calcium (Ca), and silver (Ag) are observed from the EDX analysis of the cross section of each EVA/Ag-CS composite samples (Table 2). Figure 7(a) showed the EDX spectrum of sample C3. It is observed that, it contain carbon (C) of 99.02%, calcium (Ca) of 0.46%, and silver of (Ag) 0.51%. In sample C6 [Figure 7(b)], there is an increase in the amount of Ca and Ag to 2.15% and 0.58%, respectively. Similarly, the amount of Ag was increased in respect to its filler addition. It indicates that the filler is distributed homogeneously in the polymer matrix.
The weight percentage of various EVA/Ag-CS composite samples.
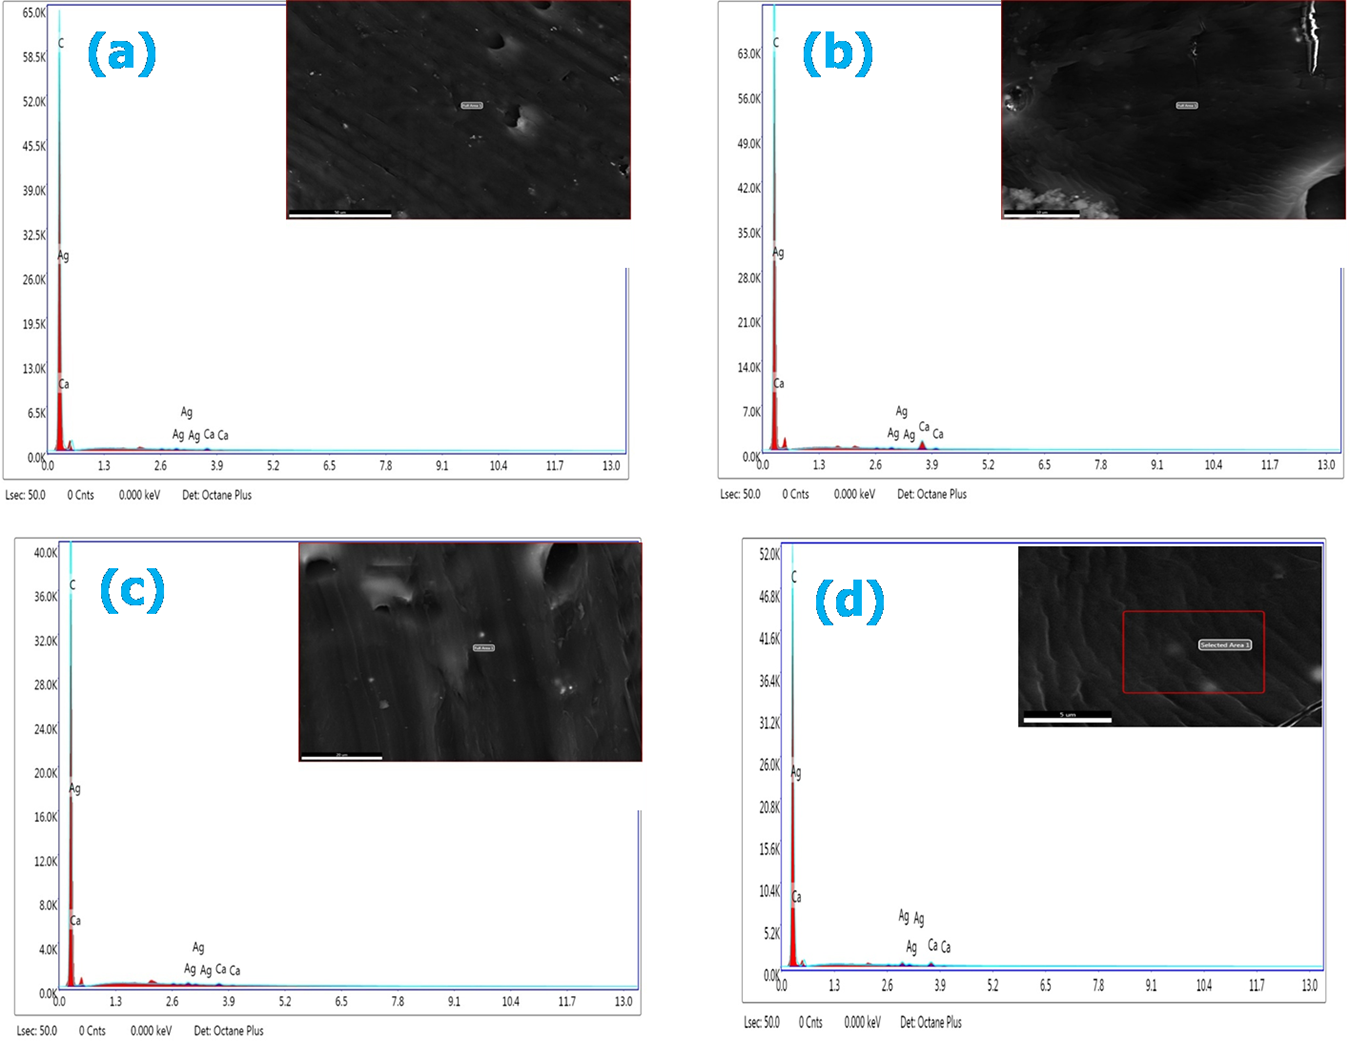
Cross-sectional EDX/SEM images of various EVA/Ag-CS composite samples: (a) sample C3, (b) sample C6, (c) sample C9, and (d) sample C12.
Tensile properties
Figure 8 shows the tensile strength of EVA/Ag-CS composite systems. It can be seen that the incorporation of Ag-CS particle improves tensile strength of EVA. Initially, the tensile strength increases with increase in the percentage of Ag-CS loading. It shows that tensile strength reaches the highest value up to 6% Ag-CS content. It is due to the strong interaction force between EVA matrix and Ag-CS particle. Further loading decrease the tensile strength. The excess loading creates uneven distribution and aggregation of particle in the bulk of EVA matrix. The presence of polar vinyl acetate content in EVA is responsible for the interaction of Ag-CS fillers. It is clear that the higher surface area of Ag-CS filler particles favors a high physical adhesion between Ag-CS and EVA matrix. Consequently, it results in the enhancement of the mechanical properties of EVA. The result clearly supports the observations in morphology analysis.
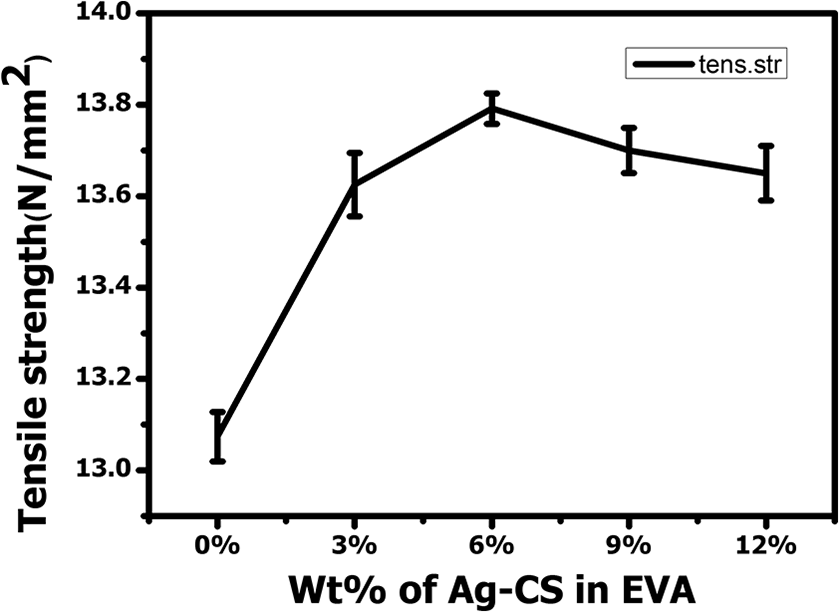
Effect of Ag-CS filler loading on the tensile strength of EVA polymer matrix.
Photocatalytic properties
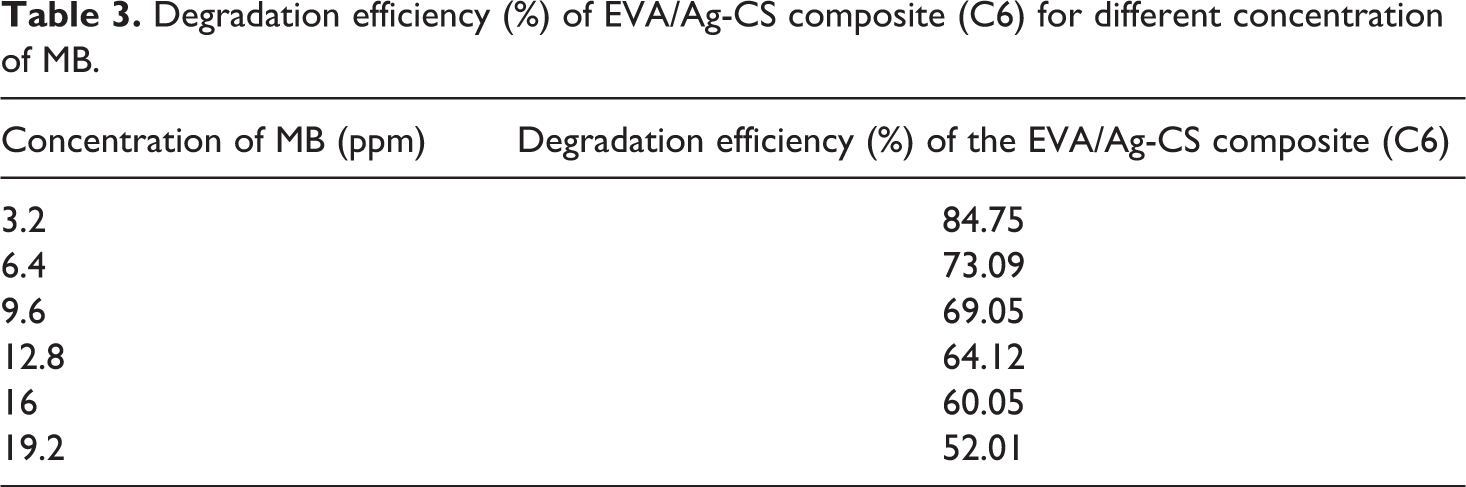
The photocatalytic properties of different EVA/Ag-CS composites films were analyzed on standard methylene blue (MB) dye in different concentrations in the presence of UV light. After a regular interval of time, the concentration of dye solution was measured. Initially, the catalytic degradation of the dye was observed visually by a change in color. The intensity of color gradually decreased from dark blue to pale blue color with concerning time, which establishes effective catalytic degradation capability of MB by the synthesized sample in the presence of UV–Visible light. Photocatalytic degradation of dye solution could be found from decreased intensity of the absorption maxima when it is exposed to UV–Visible light. Photo degradation of MB with various concentrations (3.2–19.2 ppm) by the catalytic activity of sample C6 is shown by the UV–Visible absorption spectra, Figure 9(a). Characteristic absorption peak intensity of MB at 664 nm has been decreased in all the cases, which indicate that disruption of the cyclic structure of MB by interaction with photocatalyt sample. The degradation efficiency of sample (1 g/L of C6) against the different concentrations of MB was shown in Table 3. From this, it can be seen that the lower concentration of dye, photocatalyst sample (C6) is more effective. The degradation efficiency of EVA/Ag-CS (C0–C12) using 3.2 ppm methylene blue dye under UV–Visible light for 60 min are shown in Figure 9(b). Similar to tensile strength and thermogravimetric analysis explained above, the degradation efficiency of the samples also optimized as C6 in EVA/Ag-CS from the above graph.
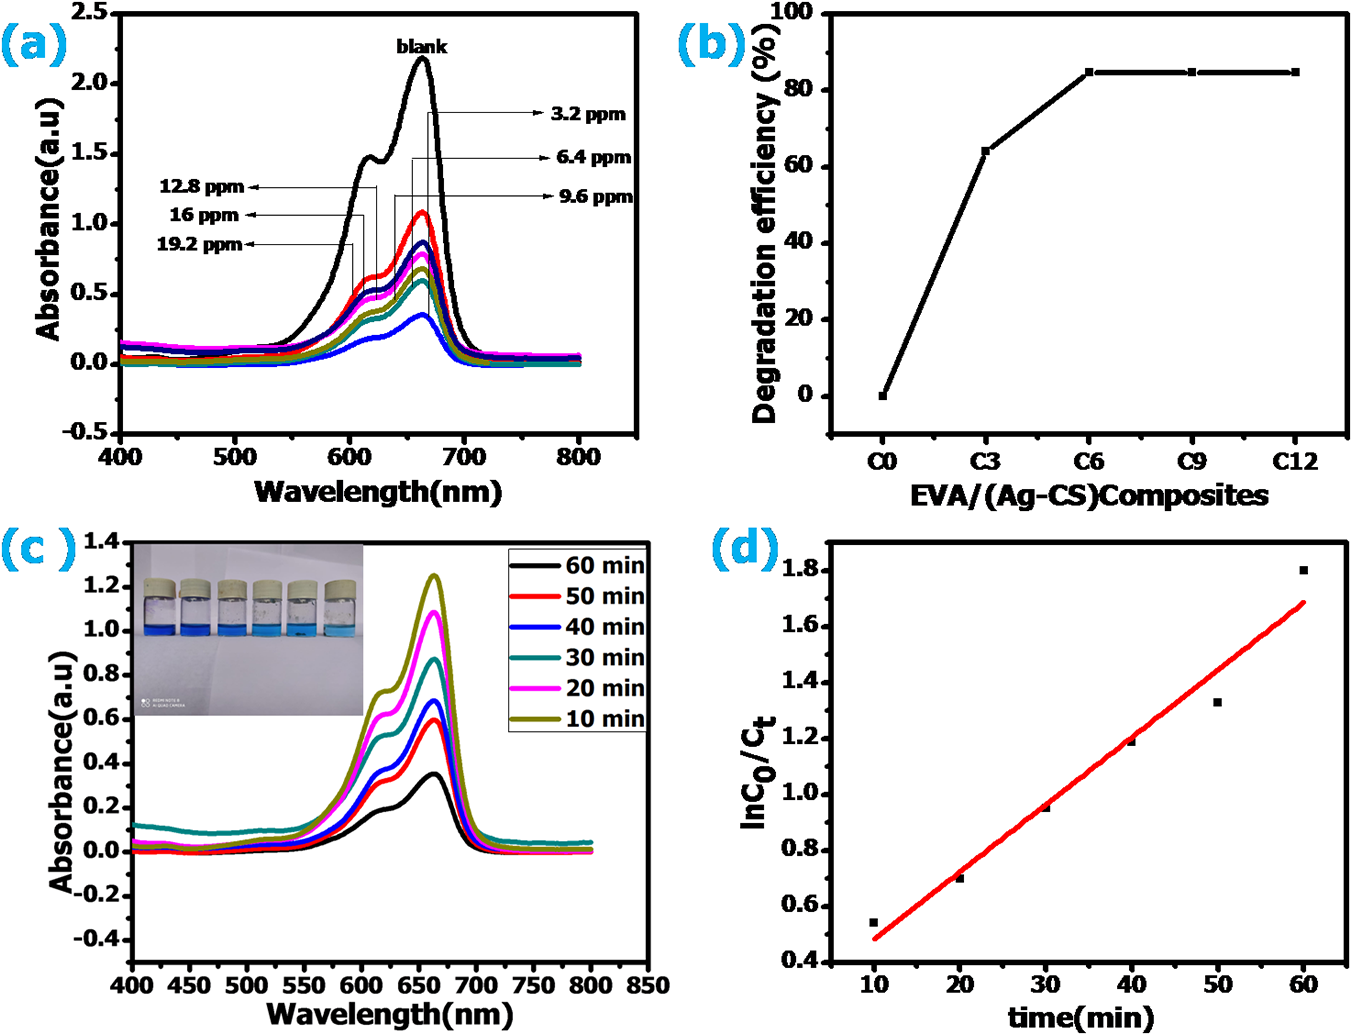
Photocatalytic studies (a) UV–vis spectra of various MB dye solutions of different concentration, (sample C6), (b) photo degradation efficiency of EVA/Ag-CS; C0–C12 for 3.2 ppm MB, (c) UV–visible absorbance of MB (3.2 ppm) for 60 min interval by EVA/Ag-CS composite, and (d) kinetic plot of EVA/Ag-CS degradation process.
Degradation efficiency (%) of EVA/Ag-CS composite (C6) for different concentration of MB.
It is shown that degradation efficiency increases with the increasing amount of silver up to an optimized sample. Photo generated holes and electrons in Ag-CS are responsible for excellent photo degradation efficiency. Here CS which mainly contains CaO and Ca(OH)2 acts as a semiconductor on which photocatalytic reaction takes place in the presence of a specific range of radiation. The photocatalytic degradation can be explained by the photocatalytic reaction of CS from which photo-induced electron-hole pairs are formed. Silver particle on CS improve separation of electron hole pair. This electron-hole pair is the basis of Hydroxyl radical formation and oxygen anion radical. This hydroxyl radical and oxygen anion radical result in the degradation of dyes resulting in the formation of carbon dioxide, water, and other ions. 46
The photocatalytic degradation process follows pseudo-first-order kinetics.

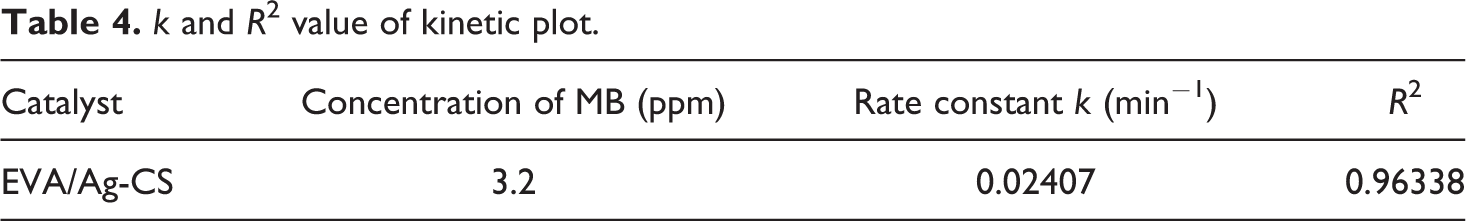
Plot for ln Co/Ct versus time of MB is shown in Figure 9(d), where Co and Ct are the initial concentration and concentration of the dye at any time t (mg/L) and k is the first-order rate constant (min−1). 47 In this case, straight lines are obtained, thus kinetics depends upon photo degradation efficiency and concentration of dyes. The obtained value of rate constant k and linear regression analysis (R 2 ) from the graph is shown in Table 4.
k and R 2 value of kinetic plot.
Antibacterial analysis
The antibacterial test of CS, Ag-CS, EVA, and EVA-Ag/CS were tested using E. coli and S. aureus. Figure 10 shows the growth of the inhibitory zone (mm) of the optimized samples. The zone of inhibition depends upon the nature of the samples. A considerable difference in the diameter of the zone of inhibition was observed with different samples. The prepared samples prevent cell growth of E. coli and S. aureus. From the antibacterial analysis, it is clear that CS, Ag-CS and EVA/Ag-CS has an antagonistic effect on the growth of both gram-positive (S. aureus) and gram-negative (E. coli) bacteria with the zone of inhibition ranging from 12 mm to 30 mm. In the antibacterial assay, the diameter of the zone of inhibition against E. coli for CS, Ag-CS, and EVA/Ag-CS measured as 12, 15, and 22 mm respectively. In Figure 10, the Ag-CS sample shows smaller zone of inhibition than that of EVA/Ag-CS sample. In the filler Ag-CS, Ag and CaO are responsible for antimicrobial property. The sample is more susceptible towards moisture and carbondioxide (CO2). When the Ag-CS sample is exposed in atmosphere, the CaO component reacts with water and CO2 to form Ca(OH)2 and CaCO3, respectively. It reduces the overall antibacterial properties of the sample. Since the Ag-CS sample in aggregated state, it will reduce the antibacterial properties. Whereas, EVA/Ag-CS composite sample has better antibacterial properties than Ag-CS filler. It is due to the homogeneous dispersion of filler in the polymer matrix. The polymer matrix can act as a coating on Ag-CS filler, it reduce the direct contact with water and CO2. It helps to retain CaO in the composite. Whereas the inhibitory zone was measured against S. aureus for CS, Ag-CS, and EVA/Ag-CS measured as 18, 23, 30, respectively. It shows that (Figure 11) all prepared samples exhibit higher growth of inhibitory action against S. aureus than against E. coli. It also evident that the antibacterial activity of CS increases by the incorporation of Ag. Antimicrobial properties of the samples are due to the diffusion of silver nanoparticles through the agar and enter through the bacterial cell membrane and damage cell wall. It is believed that this is due to the hydrophilic groups of the calcium particles in CS which facilitate the delivery of silver particles in aqueous solution. The hydrophilic nature of composite enhances silver-bacteria interaction. This results in the enhancement of antibacterial activity of the composite. The variation of antimicrobial activity in E. coli and S. aureus bacteria is due to the structural dissimilarity in their cell wall. 48 Similarly, EVA polymer does not show antibacterial activity but EVA/Ag-CS composite shows good antibacterial activity, which indicates that Ag/CS uniformly distributed in EVA polymer. So this antibacterial composite can be widely used for packaging applications.
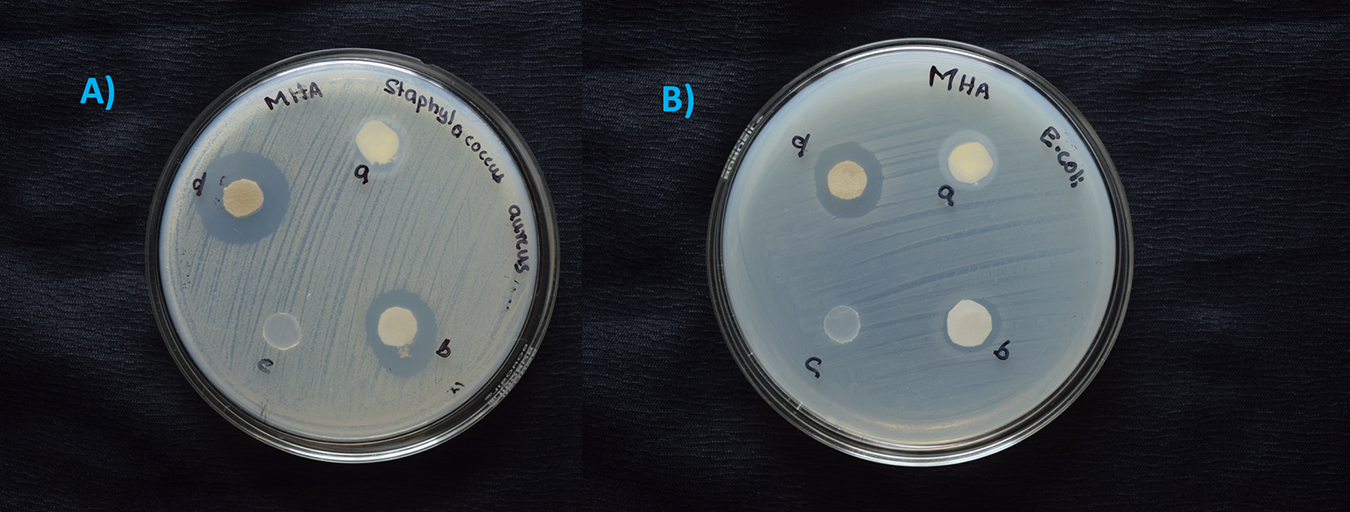
Zone of inhibition in nutrient agar plates by well diffusion method against (A) E. coli and (B) S. aureus where (a) CS; (b) Ag-CS; (c) EVA; and (d) EVA/Ag-CS.
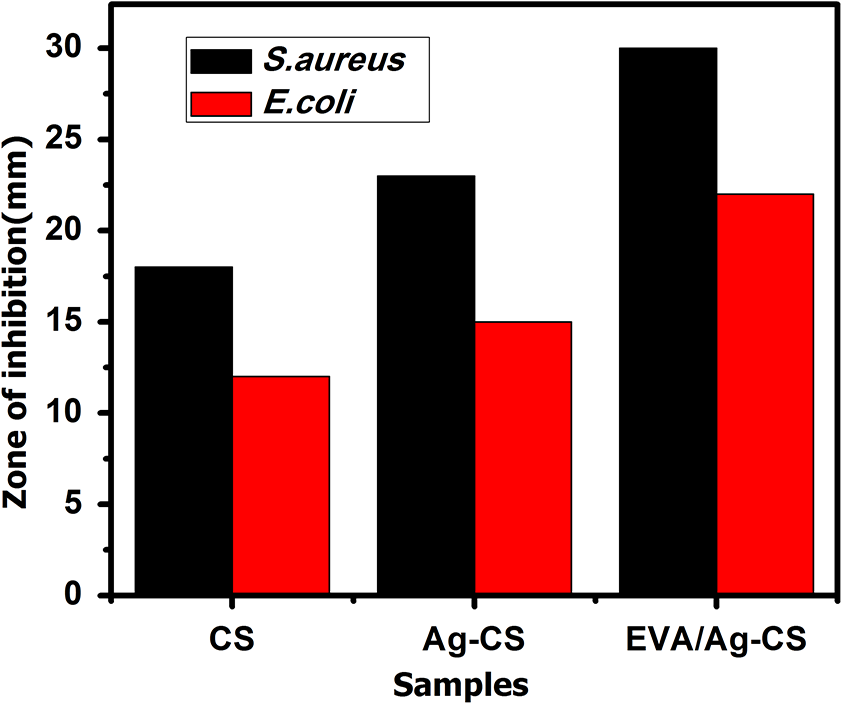
A comparative study of antibacterial activity of CS, Ag-CS, and EVA/Ag-CS.
Conclusion
Calcined scallop shell powder was prepared by the sol–gel method. Its antibacterial property and thermal stability were increased by the incorporation of Ag particles. The dispersion of the Ag/CS sample in the EVA matrix was confirmed by FTIR, FE-SEM, and XRD analysis. FTIR shows that CS and Ag particles merged in EVA/Ag-CS composite. SEM analysis of EVA/Ag-CS composite showed that Ag-CS samples uniformly distributed in the EVA matrix. TGA revealed that Ag-CS samples are thermally stable than CS, similarly EVA/Ag-CS composite is more stable than EVA sample. It was found that the addition of 6% Ag-CS sample has got maximum tensile strength of 13.8 MPa. Similarly, maximum photocatalytic degradation efficiency also found in this composite. The incorporation of CS and Ag in the EVA matrix impart antibacterial activity into EVA matrix against S. aureus and E. coli bacteria. This biocomposite films are economical and easily available in promising antibacterial and photocatalytic activity. Antibacterial polymeric materials have great acceptance in food packaging and biomedical sample storage applications. It increases the shelf life of the product. In addition to the antibacterial properties, the EVA/Ag-CS composite has photo degradation activities. It would further enhance the shelf life.
Footnotes
Declaration of conflicting interests
The author(s) declared no potential conflicts of interest with respect to the research, authorship and/or publication of this article.
Funding
The author(s) received no financial support for the research, authorship, and /or publication of this article.