
Abstract
Carbon nanotubes (CNTs) impart great multi-functionality when reinforced with a polymer matrix. This paper shows the qualitative and quantitative improvements of the mechanical, electrical, and electromagnetic interference shielding effectiveness properties with the additions of the multiwalled carbon nanotubes (MWCNTs) and functionalized MWCNTs (FMWCNTs) in ethylene methyl acrylate (EMA) polymer. Mechanical characterization is performed through tensile testing, and electromagnetic interference shielding effectiveness (EMI SE) is calculated from the scattering parameters obtained from the vector network analyzer. Both properties improve compared to neat polymer with the reinforcement loadings up to a critical value, from where the properties start to degrade due to the agglomeration of the CNTs. FMWCNTs provide better performance in terms of properties over the MWCNT reinforced nanocomposites. Morphological characterization using a scanning electron microscope justifies a lower percolation threshold of FMWCNT/EMA composite by better electrical conductive network formation. At 10 wt% of FMWCNT loading, the FMWCNT/EMA composite shows 25.1 dB of EMI shielding efficiency combined with excellent mechanical and electrical properties extending its potential use in both industry and academia as an excellent flexible EMI shielding material.
Keywords
Introduction
In the last decade, the extensive utilization of electronic equipment and electrical devices has emitted massive electromagnetic waves (EM), causing tremendous electromagnetic pollution in the environment. 1 The radiated and conducted electromagnetic signals interfere with the proper functioning of the nearby electronic gadgets and cause progressive radiative damage to living beings. 2 This increased EM pollution in the name of electromagnetic interference (EMI) has raised the thirst for designing and developing more advanced EMI shielding materials that can attenuate the intensity of the EM waves by shielding mechanisms. When this oscillating and self-propagating co-existing electromagnetic fields incident on the surface of a material, some EM waves get reflected due to impedance mismatch, and the unreflected ones get absorbed due to the material’s electrical conductivity and magnetic permeability. 3
Metals are conventional shielding materials due to their intrinsic electrical conductivity. However, they suffer a few drawbacks in corrosiveness in the harsh environment, high weight and material cost, rigidity, and limited tunability in EMI shielding effectiveness (EMI SE), 4 where the only shielding mechanism is reflection. Mitigating all the shortcomings possessed by metals, conductive fillers, when reinforced with electrically insulating polymers, can emerge as a flexible and lightweight shielding material that can be processed with ease and operated in a harsh environment. Due to the excellent electrical conductivity, the carbonaceous fillers such as carbon nanotubes (CNTs),5-7 short carbon fibers (SCF),8,9 carbon nanofibers (CNFs),10,11 graphene,12-15 graphite,16-22 conductive carbon black,8,23-27 and metal nanoparticles,28-32 have been extensively used in polymeric composites which exhibited outstanding EMI SE.
Due to the excellent electrical conductivity coupled with high specific strength, large surface area, and excellent chemical stability, CNT reinforced thermoplastic and thermosetting matrices such as epoxy,33-38 PS,5,39-42 PP, 43 PC,44-47 PMMA,5,37,48,49 PU,44,50-54 along with polymer blends of PP/PE, 55 PC/EMA, 56 and EMA/EOC, 57 have been extensively investigated for EMI shielding materials to be used in both industry and academia, where the main requirement is as a structural material. Recently, great attention has been given to developing CNT reinforced flexible EMI shielding materials for some specific applications where low bending stiffness is the principle criteria. There are few investigations for EMI SE of MWCNT reinforced flexible polymers such as polyethylene (PE), ethylene-vinyl acetate (EVA), polypropylene (PP), styrene-butadiene copolymer (SBC), thermoplastic polyurethane elastomer (TPU), and thermoplastic vulcanizate (TPV) composites. 15 wt% of MWCNT reinforced chlorinated polyethylene (CPE) exhibits an EMI SE of 36 dB for an MWCNT/CPE flexible nanocomposite of 2 mm thickness, 58 whereas an EMI SE of 23 dB is achieved by incorporating 15 wt% of SWCNT in ethylene-vinyl acetate (EVA) nanocomposite for a sample of 1.5 mm thick. 59 B. Shin et al investigated the EMI SE of short-length MWCNT, long-length MWCNT, and SWCNT reinforced highly flexible thermoplastic polyurethane (TPU) nanocomposite and obtained a total SE of 18 dB, 32 dB, and 26 dB for a sample thickness of 1.2 mm, respectively. Reinforcing 3 vol% of MWCNTs into polypropylene (PP) exhibits a SE of 13 dB along with excellent flexibility for a 0.87 mm thick sample, 60 while 10 phr functionalized MWCNT reinforced flexible styrene-butadiene rubber (SBR) facilitates a total EMI SE of 23 dB for a 5 mm thick MWCNT/SBR flexible nanocomposite. 61 L. Ma et al studied the effect of MWCNT in the 50:50 wt% of PP and EPDM blend thermoplastic vulcanizate (TPV) and observed that with the incorporation of 4.1 vol% of MWCNT reinforced highly stretchable TPV exhibits a SE of 29.8 dB for a sample thickness of 1 mm. 62 They all meet the industrial need of 20 dB of EMI SE with comparatively high filler loadings and thicker sample sizes, along with the drawbacks like low dispersion and breakage of MWCNTs involving some costly processing methods. The above limitations are met by adopting a facile and cost-effective solution mixing strategy, where at relatively lower MWCNT loading and thin samples, the industrial need for SE is attributed. Again, minimal comparative studies have been done to date to see the effect of functionalization on improving mechanical and physical properties, especially in flexible polymer matrix nanocomposites. In this study, ethylene methyl acrylate (EMA) has been used as a flexible polymer which is a copolymer of ethylene (non-polar) and methyl acrylate (polar) due to its good mechanical properties in low-temperature applications, resistance to degradability, weatherability, and thermal stability. When reinforced with both multiwalled carbon nanotubes (MWCNTs) and functionalized multiwalled carbon nanotubes (FMWCNTs), the two nanocomposites’ mechanical and electrical properties along with EMI SE have been investigated and compared both quantitatively and qualitatively.
In this contribution, the morphological characterization and mechanical, electrical, and EMI SE properties have been investigated extensively with nanofillers from 1 to 15 wt% for both the nanocomposites. With just 1 wt% of MWCNT and FMWCNT, the SE is enhanced by almost 13 dB and 16 dB, respectively, revealing better electrical conductive network formation using functionalized MWCNTs at comparatively lower percolation threshold value which is again justified by their morphographs. Here, the highest SE is obtained at around 28 dB for EMA/FMWCNT nanocomposite at 15 wt% for a 1 mm thick sample. This study aims to develop a low weight, highly flexible, EMI shielding efficient material with MWCNTs as filler to investigate the efficacy of functionalization on its mechanical, electrical, and EMI shielding performance.
Experimental
Materials
In the fabricated nanocomposites, ethylene methyl acrylate (EMA) is used as the polymer matrix. The commercial-grade of EMA copolymer (ElvaloyR AC1330 of DuPont) was procured in the form of pellets, and the nano reinforcements are MWCNTs and FMWCNTs, procured in the commercial name of UCNTTM from United Nanotech Innovations Pvt. Ltd in the form of powder seen in the naked eye. These were synthesized by the chemical vapor deposition (CVD) method. Toluene is the solvent used for EMA polymer dilution and dispersing the CNTs.
Preparation methods
A solution mixing strategy is adopted to fabricate the MWCNT/EMA (MER) and FMWCNT/EMA (FMER) nanocomposites. The calculated amount of CNTs were dispersed employing ultrasonication, and EMA polymer was dissolved using toluene as solvent separately. Dispersed CNTs in toluene were added dropwise with the EMA solution and stirred for 2 h. Finally, the solution was cast on a glass petri dish until the solvent evaporated at room temperature, followed by vacuum drying to ensure complete evaporation. For homogeneous distribution of the CNTs, the resultant composite was passed through a two-roll machine followed by compression molding at 130°C and 5 MPa pressure for 5 min using Moore Press, the UK, with water cooling. The entire composite preparation process is depicted schematically in Figure 1. The CNTs content varied from 1 to 15 wt%, and sample designation has been described in Tables 1 and 2. For clarity, 1MER is defined as 1 wt% of MWCNT (M) reinforced EMA (E) polymer nanocomposite where the reinforcements are Randomly (R) oriented. At the same time, 10FMER signifies 10 wt% of Randomly (R) oriented Functionalized (F) MWCNT (M) loaded EMA (E) matrix nanocomposite. Schematic representation of nanocomposite preparation. Designation of prepared nanocomposites at different loadings of MWCNTs in EMA polymer. Designation of prepared nanocomposites at different loadings of FMWCNTs in EMA polymer.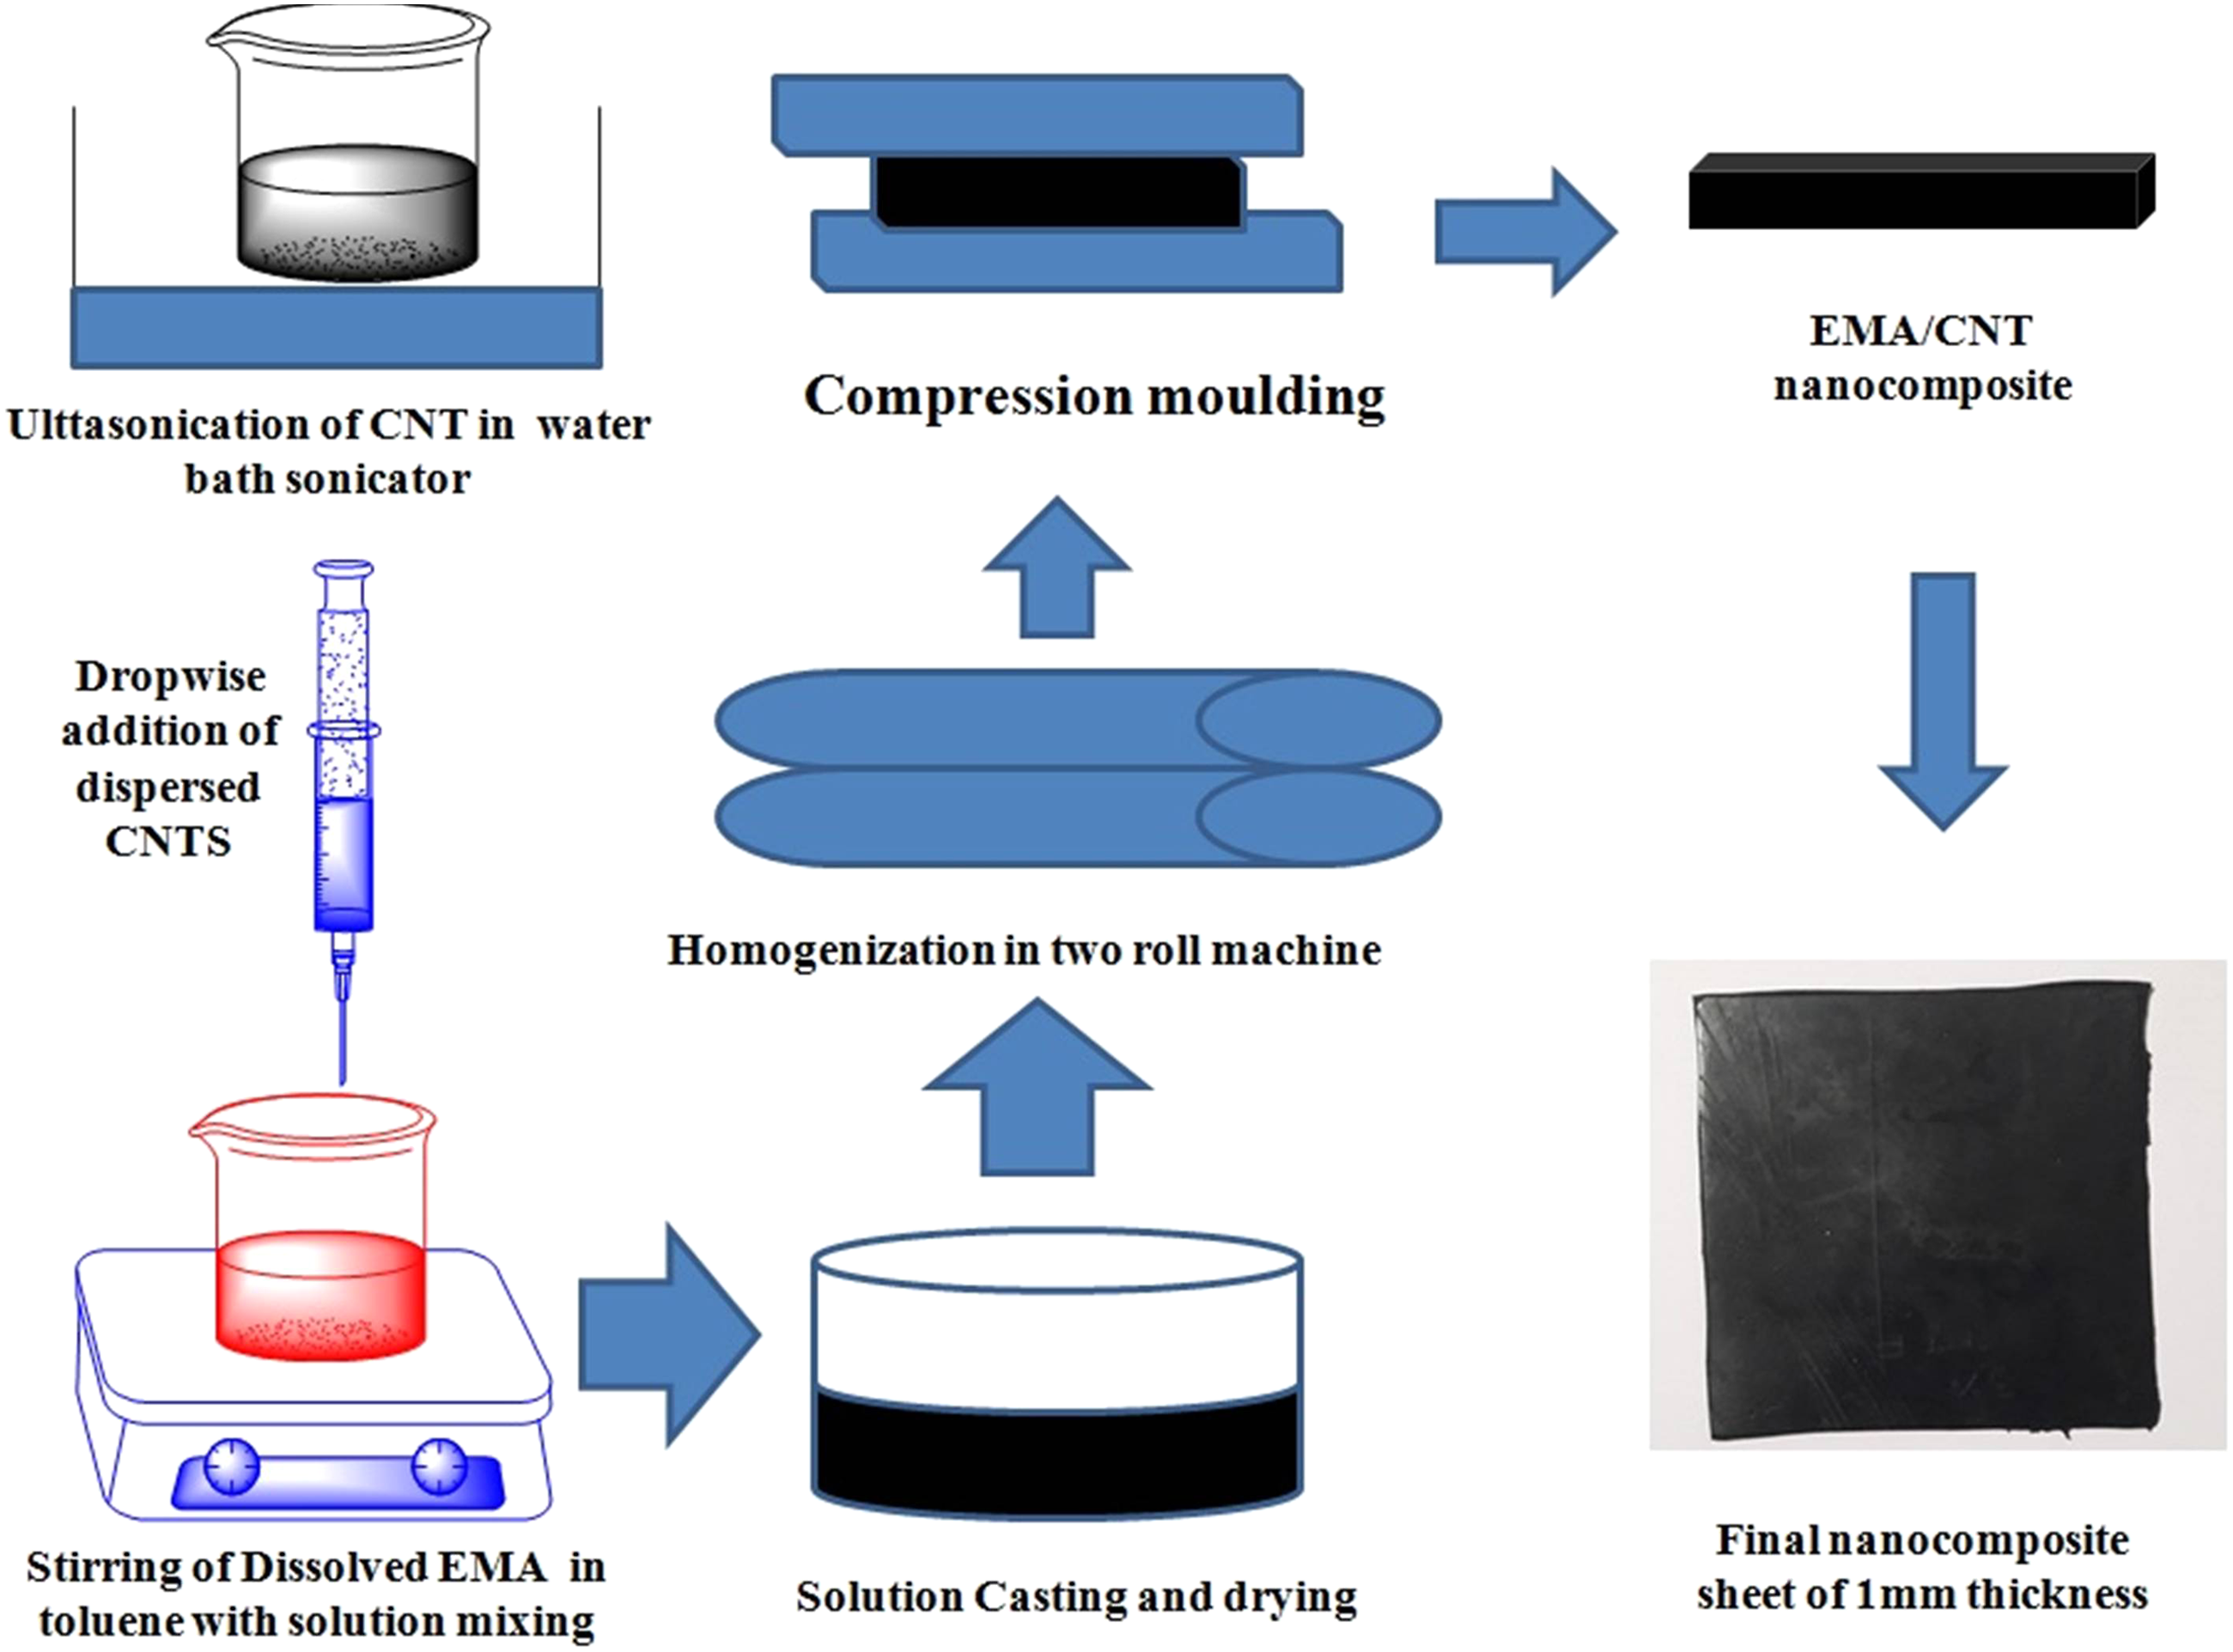
Material characterization
Morphology
Materials morphological characterization has been done on field emission scanning electron microscopy (FESEM) using Merlin FESEM, Carl Zeiss (Germany) machine. The material was cryofractured in liquid nitrogen, and gold-coated fractured surfaces were seen for CNT distribution, dispersion, and interaction.
Mechanical properties
The standard test method, ASTM D412-16, has been adopted for tensile tests with a tensile testing machine of model name H50KS (Tinius Olsen, UK) at a constant crosshead speed of 500 mm/min at room temperature. The dumbbell shape tensile specimens of 1 mm thickness have been used for mechanical testing. The average value of three measurements has been reported.
DC conductivity
The electrometer Keithley 6514 has been employed to measure the polymer composites’ DC resistance (R) at room temperature. DC resistivity (ρ) is calculated from the as obtained resistance (in ohm) using the relation,
AC conductivity
Adopting a high-performance AC impedance analyzer (Win deta Novotherm α), the AC conductivity has been evaluated by AC resistivity and impedance measurements in the frequency range of 1 Hz to 10 MHz at an electrical potential difference of 1V.
EMI shielding effectiveness
The measurement of EMI SE is performed by a VNA Network Analyzer whose model name is E5071C, My46109484, made by Agilent Technologies Inc, Santa Clara, California, USA. The tests are done in the X-Band frequency spectrum (8.2–12.4 GHz) with waveguide holders. The SE results are an average of three samples with 1 mm thickness where the error percentage is less than 5%.
Results and discussion
Morphological properties
The MER and FMER nanocomposites were fractured cryogenically, and the cryofractured transverse sections were studied in SEM. Figures 2(a), (c) and (e) depict the morphology of 1, 7, 15 wt% of MWCNT, while Figure 2(b), (d) and (f) show 1, 5, and 15 wt% of FMWCNT reinforced composites at the same length and magnification scales. With the increase in filler loading, the surface roughness of both the nanocomposites increases but the distribution and dispersion of fillers are more or less uniform in FMER nanocomposites, as seen in Figure 2(b), (d), and (f). At lower filler percentage, the CNTs are isolated with each other, as shown in Figure 2(a) and (b), while with the increase in filler loading, the close contact along with agglomeration of the fillers is more for MER, as depicted in Figure 2(c) and (e) compared to FMER nanocomposite as displayed in Figure 2(d) and (f). It can be seen that the conductive network formation occurs at 7 wt% for MER and 5 wt% for FMER nanocomposites, where the nomadic charge transfer from filler to filler occurs quickly, increasing the electrical conductivity along with mechanical and EMI shielding property improvements. The lower percolation threshold value of FMER nanocomposites compared to MER nanocomposites is attributed to the increase in dispersibility of FMWCNTs due to functionalization, as can be compared in Figure 2(c) and (d). With the further rise in filler loading, there is direct contact among the fillers, which results in more agglomeration in MER, as observed in Figure 2(e) against Figure 2(f). FESEM images showing the morphological (a, b) distribution of CNTs in 1MER and 1FMER (c, d) dispersion and network formation of 7MER and 5FMER, and (e, f) agglomeration formation of 15MER and 15FMER nanocomposites, respectively.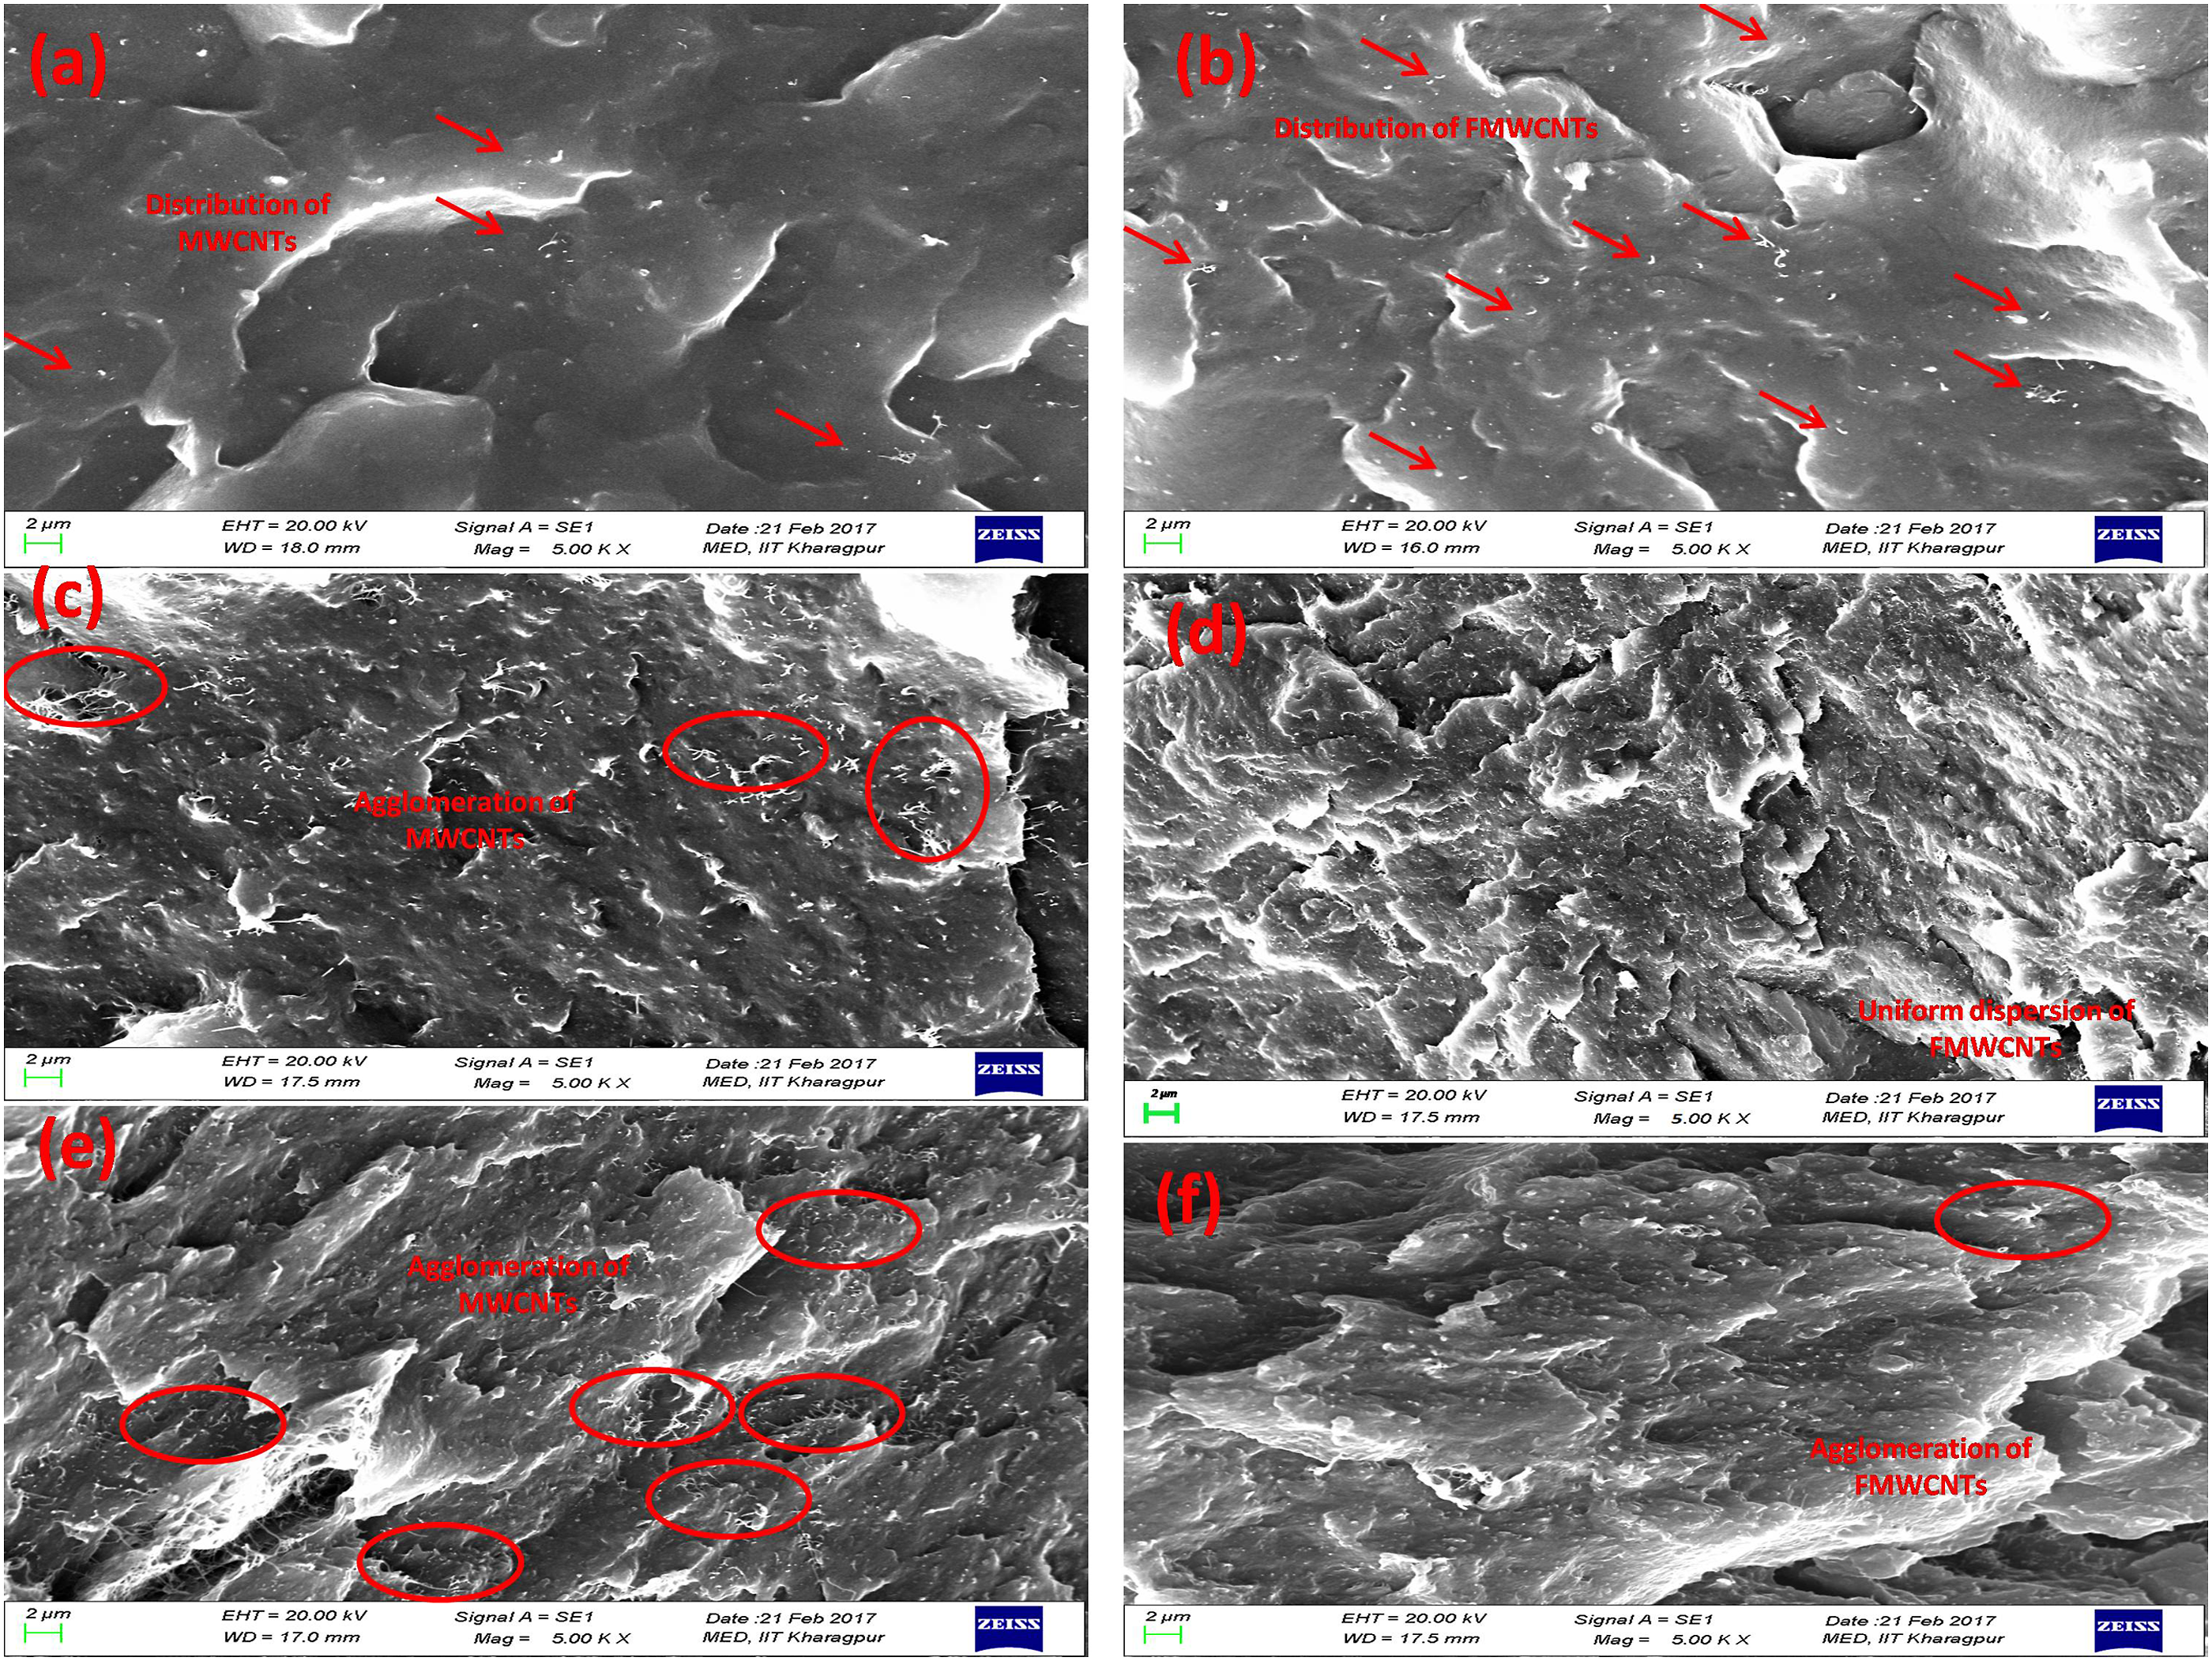
Mechanical properties
Effect of MWCNT loading on mechanical properties
The deciding factors on the mechanical properties of a composite are the strength, surface activity, proper distribution and dispersion of the fillers, and interfacial bond between the filler and the polymer matrix.63,64 The stress-strain plot of MER and FMER nanocomposites are displayed in Figure 3(a) and (b), respectively. In either case, with the increase in reinforcement loading, there is a gradual increase in the stiffness of the nanocomposites. The more the reinforcement loading, the greater the modulus and stiffness.
65
At higher loading, the predominant load transfer mechanism is filler to filler which hinders the uniform stress distribution compared to filler-polymer load transfer. Thus the material reaches the failure point early due to the rupture of the polymer chains with the same strain applied.66,67 The increase in tensile strength of a composite depends on many factors such as filler size, shape, aspect ratio, filler type, amount of reinforcement, distribution, dispersion, and the interaction of fillers with polymer. At externally applied load, the interface stress transfer plays a significant role in transferring stress from polymer to reinforcement, which is again governed by mechanical interlocking, type of bond, and Van der Waals force between the fillers and polymer matrix.
68
There is a high interfacial area at a low loading of fillers due to the uniform distribution and dispersion of CNTs, responsible for higher load transfer from polymer to CNTs, facilitating higher tensile strength. The trapped entanglement is the primary reinforcement mechanism, which depends on polymer chains’ labile (temporary) bonding with the MWCNTs. The polymer chain mobility increases with the rise in trapped entanglement, facilitating the more physical cross-linking with highly enhanced strength.
69
Few researchers have reported that the polymer chain mobility increases due to polymer chain de-entanglement. During this rearrangement of polymer chains, much energy is taken up from the externally applied loadings, increasing the material’s toughness and increasing the tensile strength of the nanocomposites.70-74 Stress-strain behavior of (a) MER and (b) FMER nanocomposites.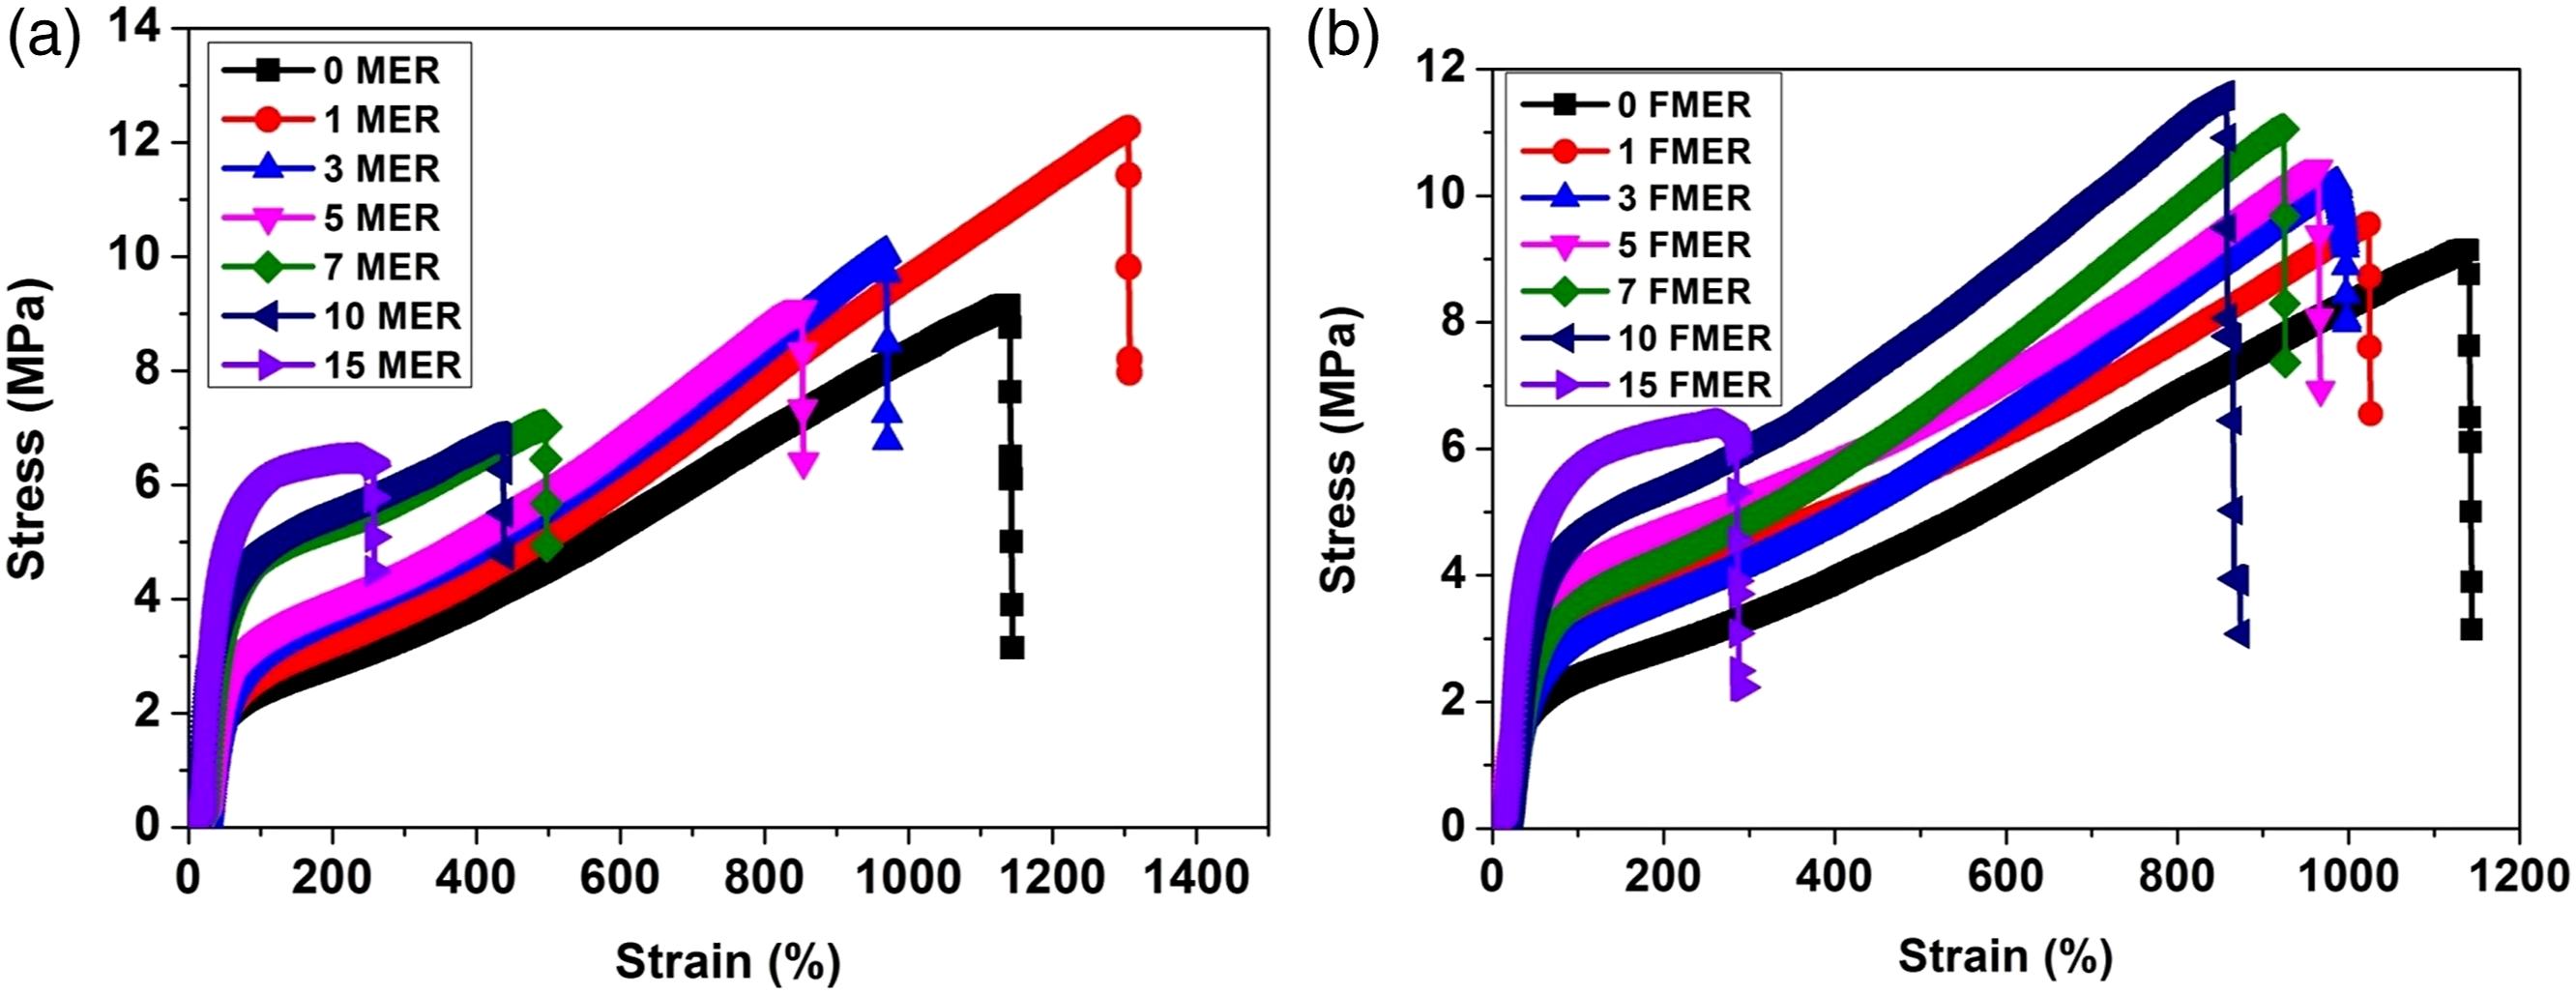
The stiffness of a material is attributed to the material’s ability to resist deformation. So, it is trivial that with the addition of MWCNT loading, the stiffness of the material increases due to the reinforcing effect. The more the stiffness of the composites, the more will be the resistance to deformation. Thus, the stretch-ability of the composites decreases, resulting in lower failure strains. Again, in tensile testing, the material’s strain and the corresponding stress are computed, and from the stress-strain values, the material’s stiffness is calculated. From this perspective, due to the decrease in failure strain, it is predicted that there is an increase in stiffness of the composite and can be justified by experimentally obtained stress-strain diagrams. Thus, the composite’s ability to take up more loads increases with the increase in MWCNT loading, contributing to the higher strength and stiffness. The quantitative variation of tensile strength, Young’s modulus, and elongation at break with MWCNT loading has been displayed in Figure 4(a)–(c), respectively. The percentage of elongation at break for pure EMA is 1140%, while the elongation percentage becomes 249% at 15 wt% of MWCNT. This reduction is proof of the increase in stiffness and modulus. Thus, the elongation percentage does not decrease drastically with the increase in reinforcement loading due to monotonically increasing stiffness. The tensile strength of neat EMA is 9.14 MPa, while there is a high rise in tensile strength with just 1 wt% of MWCNT loading. In comparison to pure polymer, the tensile strength value of EMA nanocomposite is increased by 10.2% at 3 wt% of MWCNT loading, and beyond that, the tensile strength starts decreasing due to low dispersion because of the agglomeration of the nanofillers leading to lower interfacial interaction with the polymer (Figure 4(a)). Although, Young’s modulus of the nanocomposite increases with the increase in MWCNT loading, as can be seen from Figure 4(b), the elongation at break (EB) value gets reduced (Figure 4(c)). The reason for increased stiffness and decrement in EB value can be explained by the fact that with the rise in nanofillers loading, the mobility of the polymer chains is restricted due to the entanglement of the polymer chains as the filler surface interference with the polymer increases resulting in less stretch of the polymer chains with the application of strains. As well, the superior modulus of the material depends on the filler distribution and dispersion, filler size and structure, matrix stiffness, and filler-matrix interaction.
64
Variation of (a) tensile strength, (b) Young’s modulus, and (c) elongation at break of MER nanocomposites with MWCNT loading.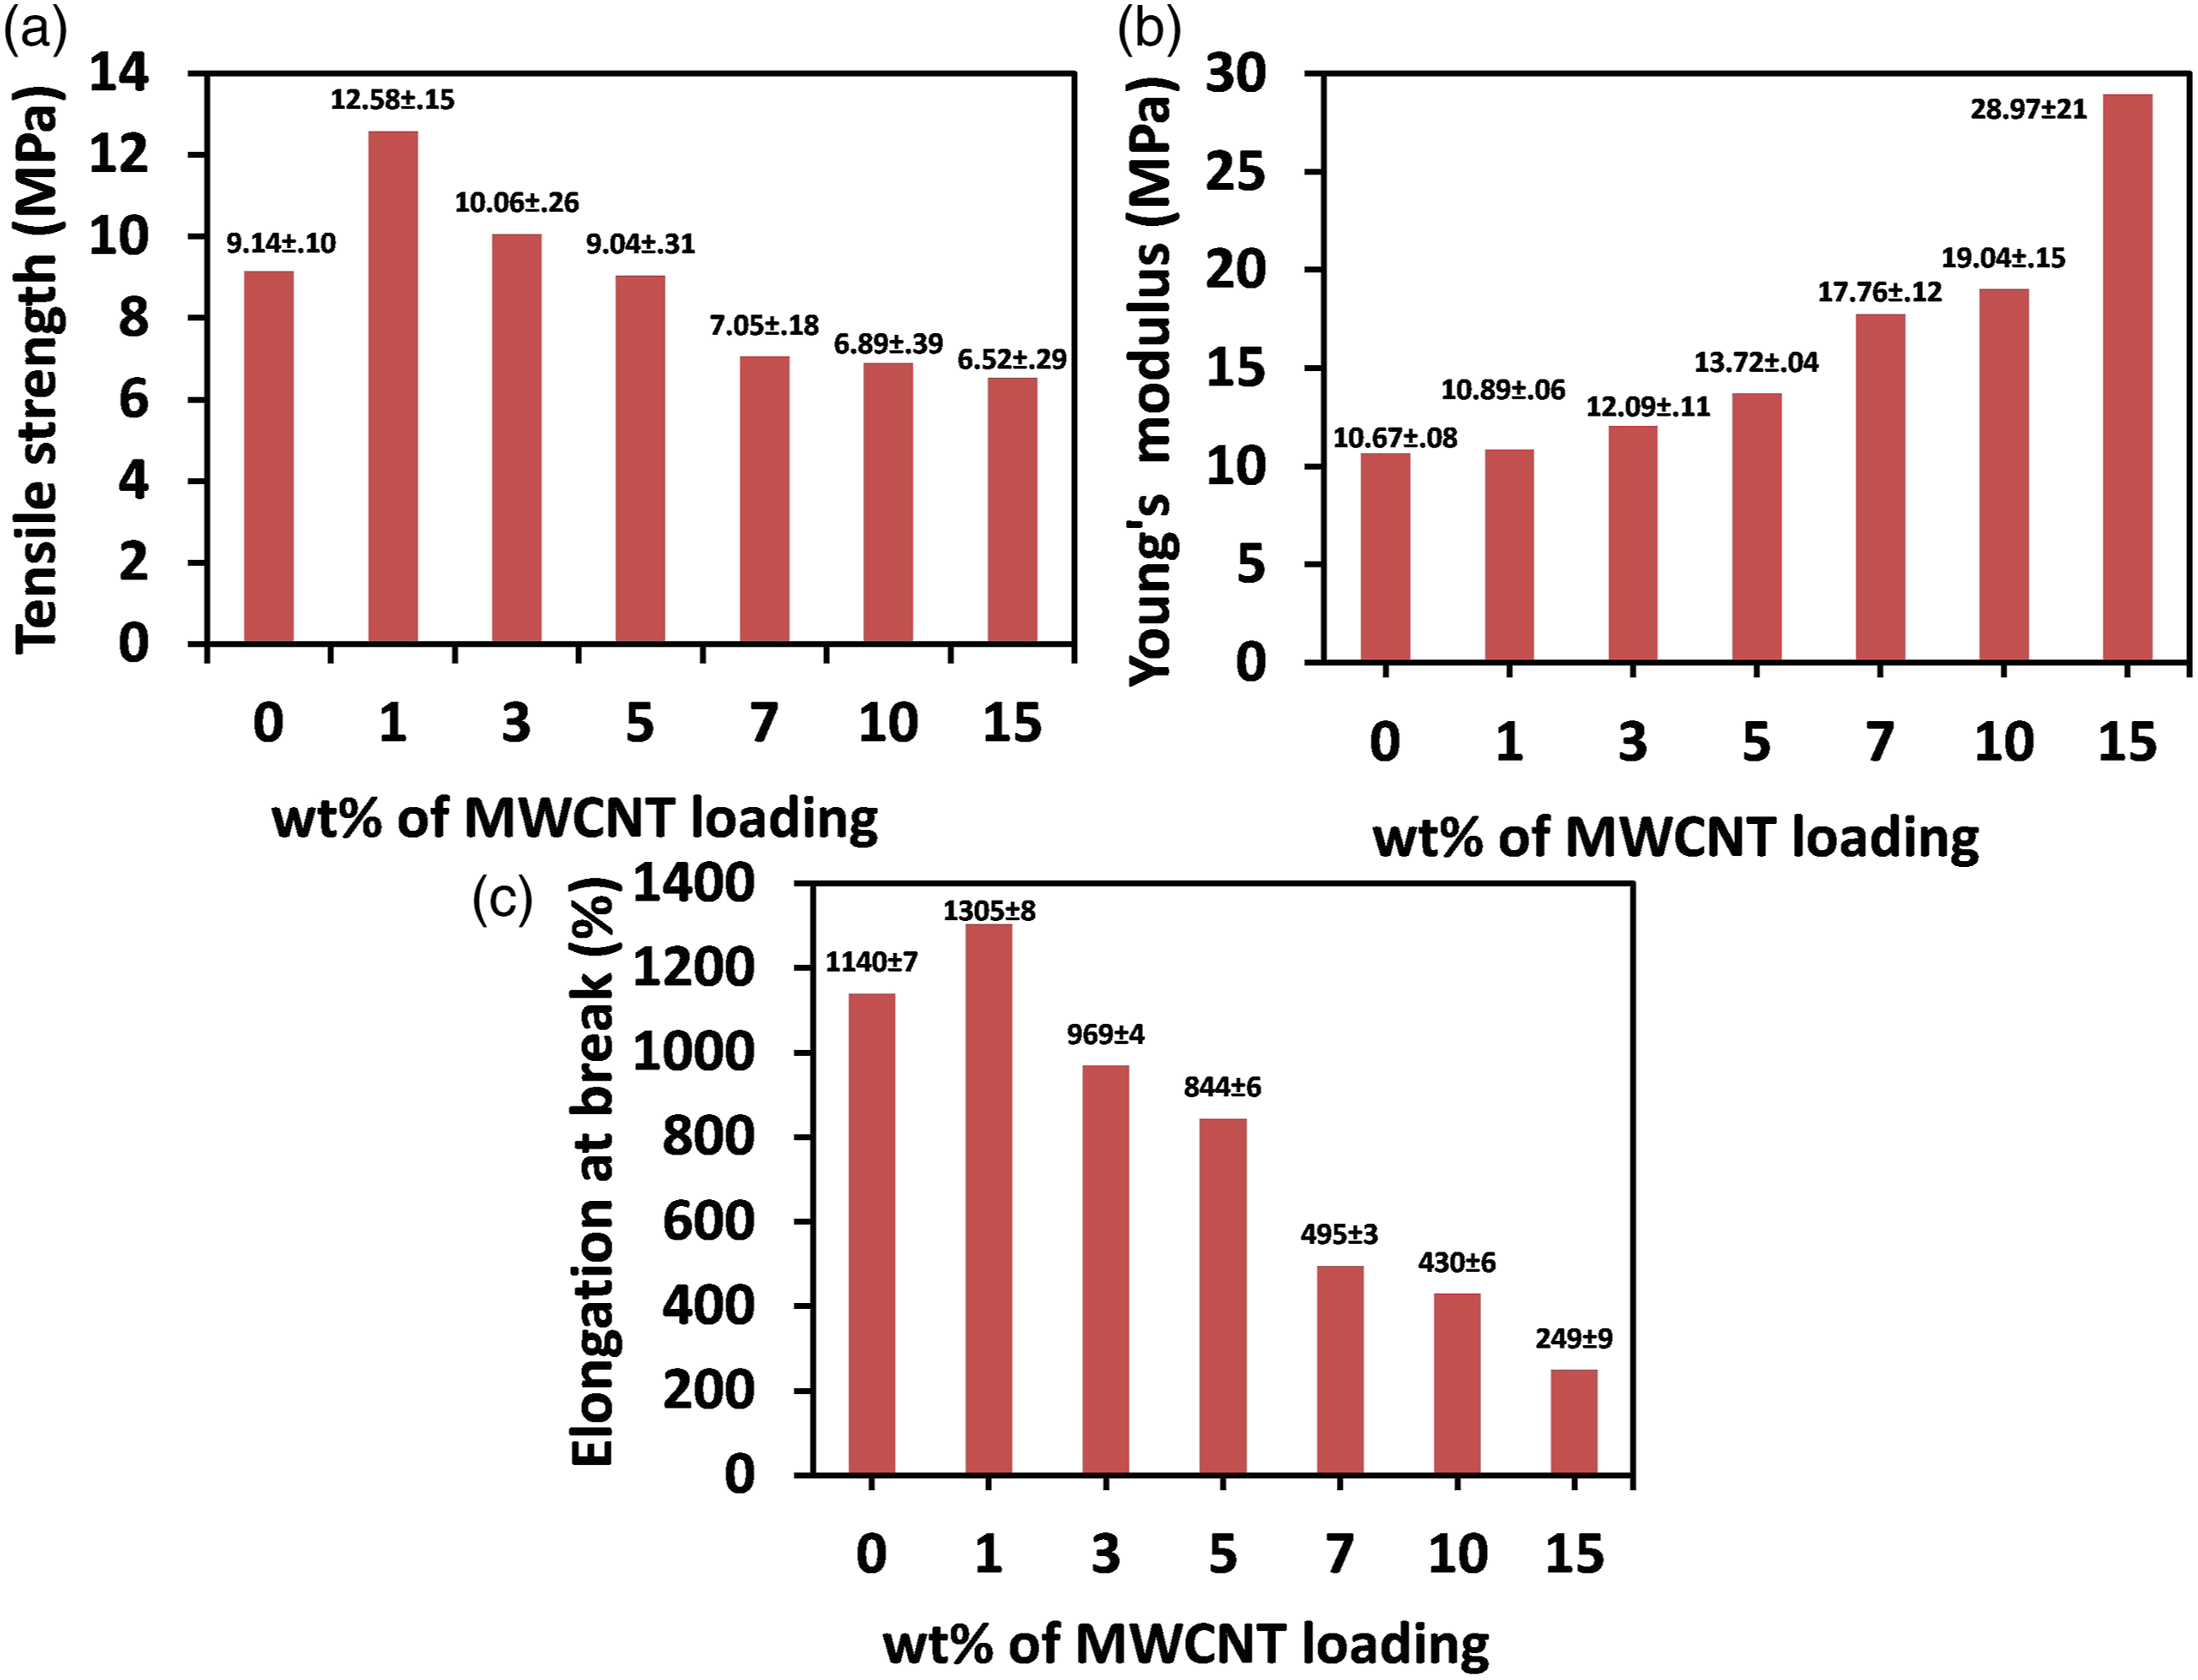
Mechanical properties after functionalization
The functionalization of MWCNTs allows the EMA nanocomposite to disperse the nanofillers more uniformly into the EMA matrix than the nonfunctionalized ones.
75
Due to the presence of functionalized groups on the MWCNTs, the distribution and dispersion become easy, enabling the functionalized nanocomposites with better mechanical properties. The enhanced performance can be explained by the following significant reasons: (i) the fillers and polymer chains will share an equal amount of strains, (ii) the extent of interfacial adhesion is excellent, (iii) excellent degree of dispersion and distribution of MWCNTs into the EMA matrix, (iv) available surfaces of the MWCNTs are entangled by the chains of polymer forming rigid shell structure, (v) the polymer shear strength is lower than the interaction between the polymer and fillers, (vi) excellent degree of interfacial adhesion, (vii) high specific surface area of MWCNTs due to their high aspect ratio, and (viii) excellent degree of defect distribution.75,76 After functionalization, the stress-strain plot is shown in Figure 3(b). From Figure 5(a) and (b), it is seen that with the increase in FMWCNT loading, both Young’s modulus and tensile strength increase monotonically, except at 15 wt%, the tensile strength suddenly decreases due to agglomeration at higher loadings of FMWCNTs. However, the elongation at the break (EB) value decreases with FMWCNT loadings, as can be seen from Figure 5(c). The increment in tensile strength and Young’s modulus is more in the case of functionalized MWCNT reinforced nanocomposites compared to the nonfunctionalized case. The tensile strength value of FMER nanocomposite is enhanced by 1.4%, 15.4%, 56.9%, and 68.5% with the incorporation of 3, 5, 7, and 10 wt% of FMWCNT compared to nonfunctionalized MER nanocomposite. This increment in tensile strength is due to better dispersion of MWCNTs due to functionalization.
65
Better dispersion of MWCNTs provides better load sharing with filler-matrix load transfer mechanism while avoiding the agglomeration of the nanofillers leading to premature matrix cracking. In comparison to MER nanocomposites, Young’s modulus of FMER nanocomposite increases by 10.7%, 19.3%, 17.8%, 15.9%, 18.2%, and 0.8% with the addition of 1, 3, 5, 7, 10, and 15 wt% of nanofillers. Though the elongation at break value reduces for both the nanocomposites (Figure 5(c)) with the incorporation of nanofillers but the reduction is less after functionalization compared to nonfunctionalized nanocomposites (Figure 5(c)). The amount of increment of elongation at break for FMER nanocomposite is 1.8%, 14.3%, 86.9%, 99.3%, and 9.64%, with the loading of 3, 5, 7, 10, and 15 wt% of nanofiller loading. The reason for the decrease in elongation at break may be due to the increase in stiffness and compactness of the material. In the case of MER nanocomposite, there is a different phenomenon that occurs at 1 wt% of loading where the elongation at break suddenly increases beyond the EMA polymer due to the sudden increase in polymer chain mobility with the incorporation of a tiny amount of CNTs. In order to understand the mechanical behavior of EMA nanocomposite, the above elucidations are believed to be enough. Comparison of (a) Young’s modulus, (b) tensile strength, and (c) elongation at break of MER and FMER nanocomposites with filler loadings.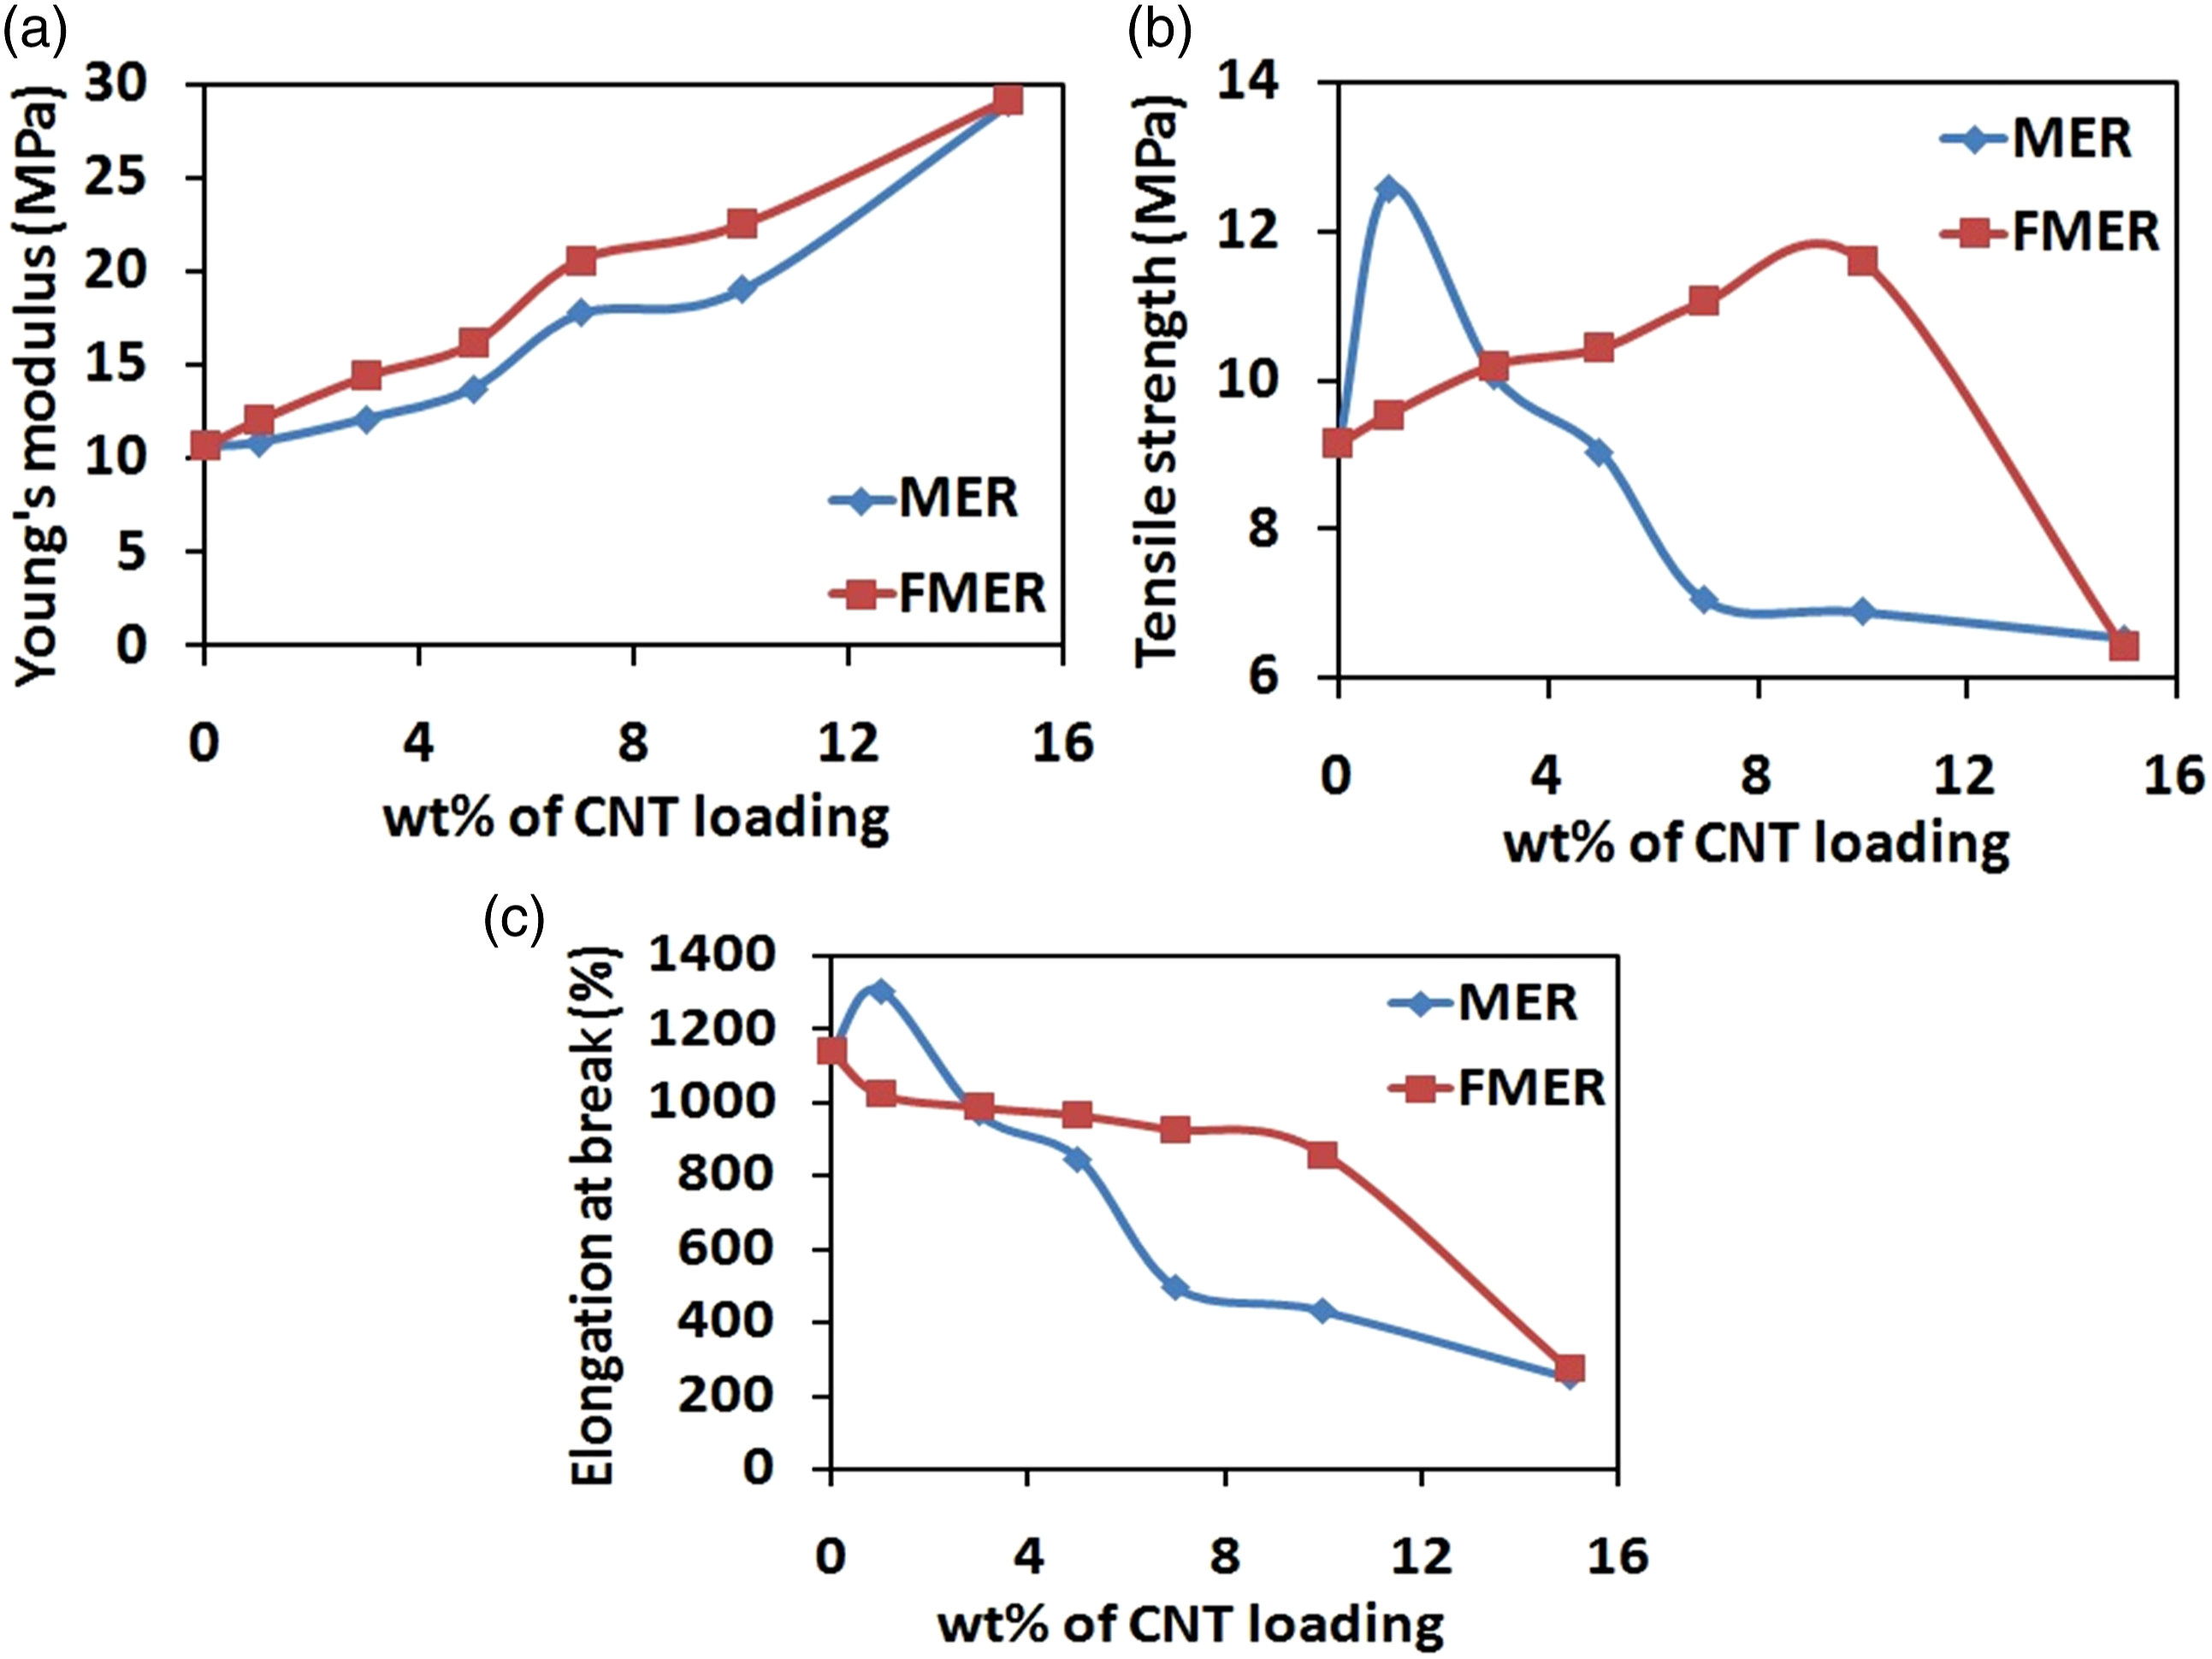
Electrical properties
Effect of MWCNT loading on DC conductivity
The DC electrical conductivity strongly influences the material’s EMI shielding efficiency. Figure 6(a) depicts the DC conductivity of the MER nanocomposite with varying filler loading. Being insulative, neat EMA has a conductivity value of more than 10−14 S/cm, while just 5 wt% of MWCNT addition increases the conductivity sharply into 1.67 × 10⁻⁷ S/cm. Additionally, there is a gradual increase of the DC conductivity in MER nanocomposite with the rise of MWCNT loadings. When the loading concentration reaches a critical value termed as percolation threshold, the nanofillers form a compact conductive network in the polymer matrix. There is a marginal change in conductivity with a further increase in the number of conductive networks. Classical percolation theory Comparison of DC conductivity of (a) MER and (b) FMER nanocomposites as a function of filler loading.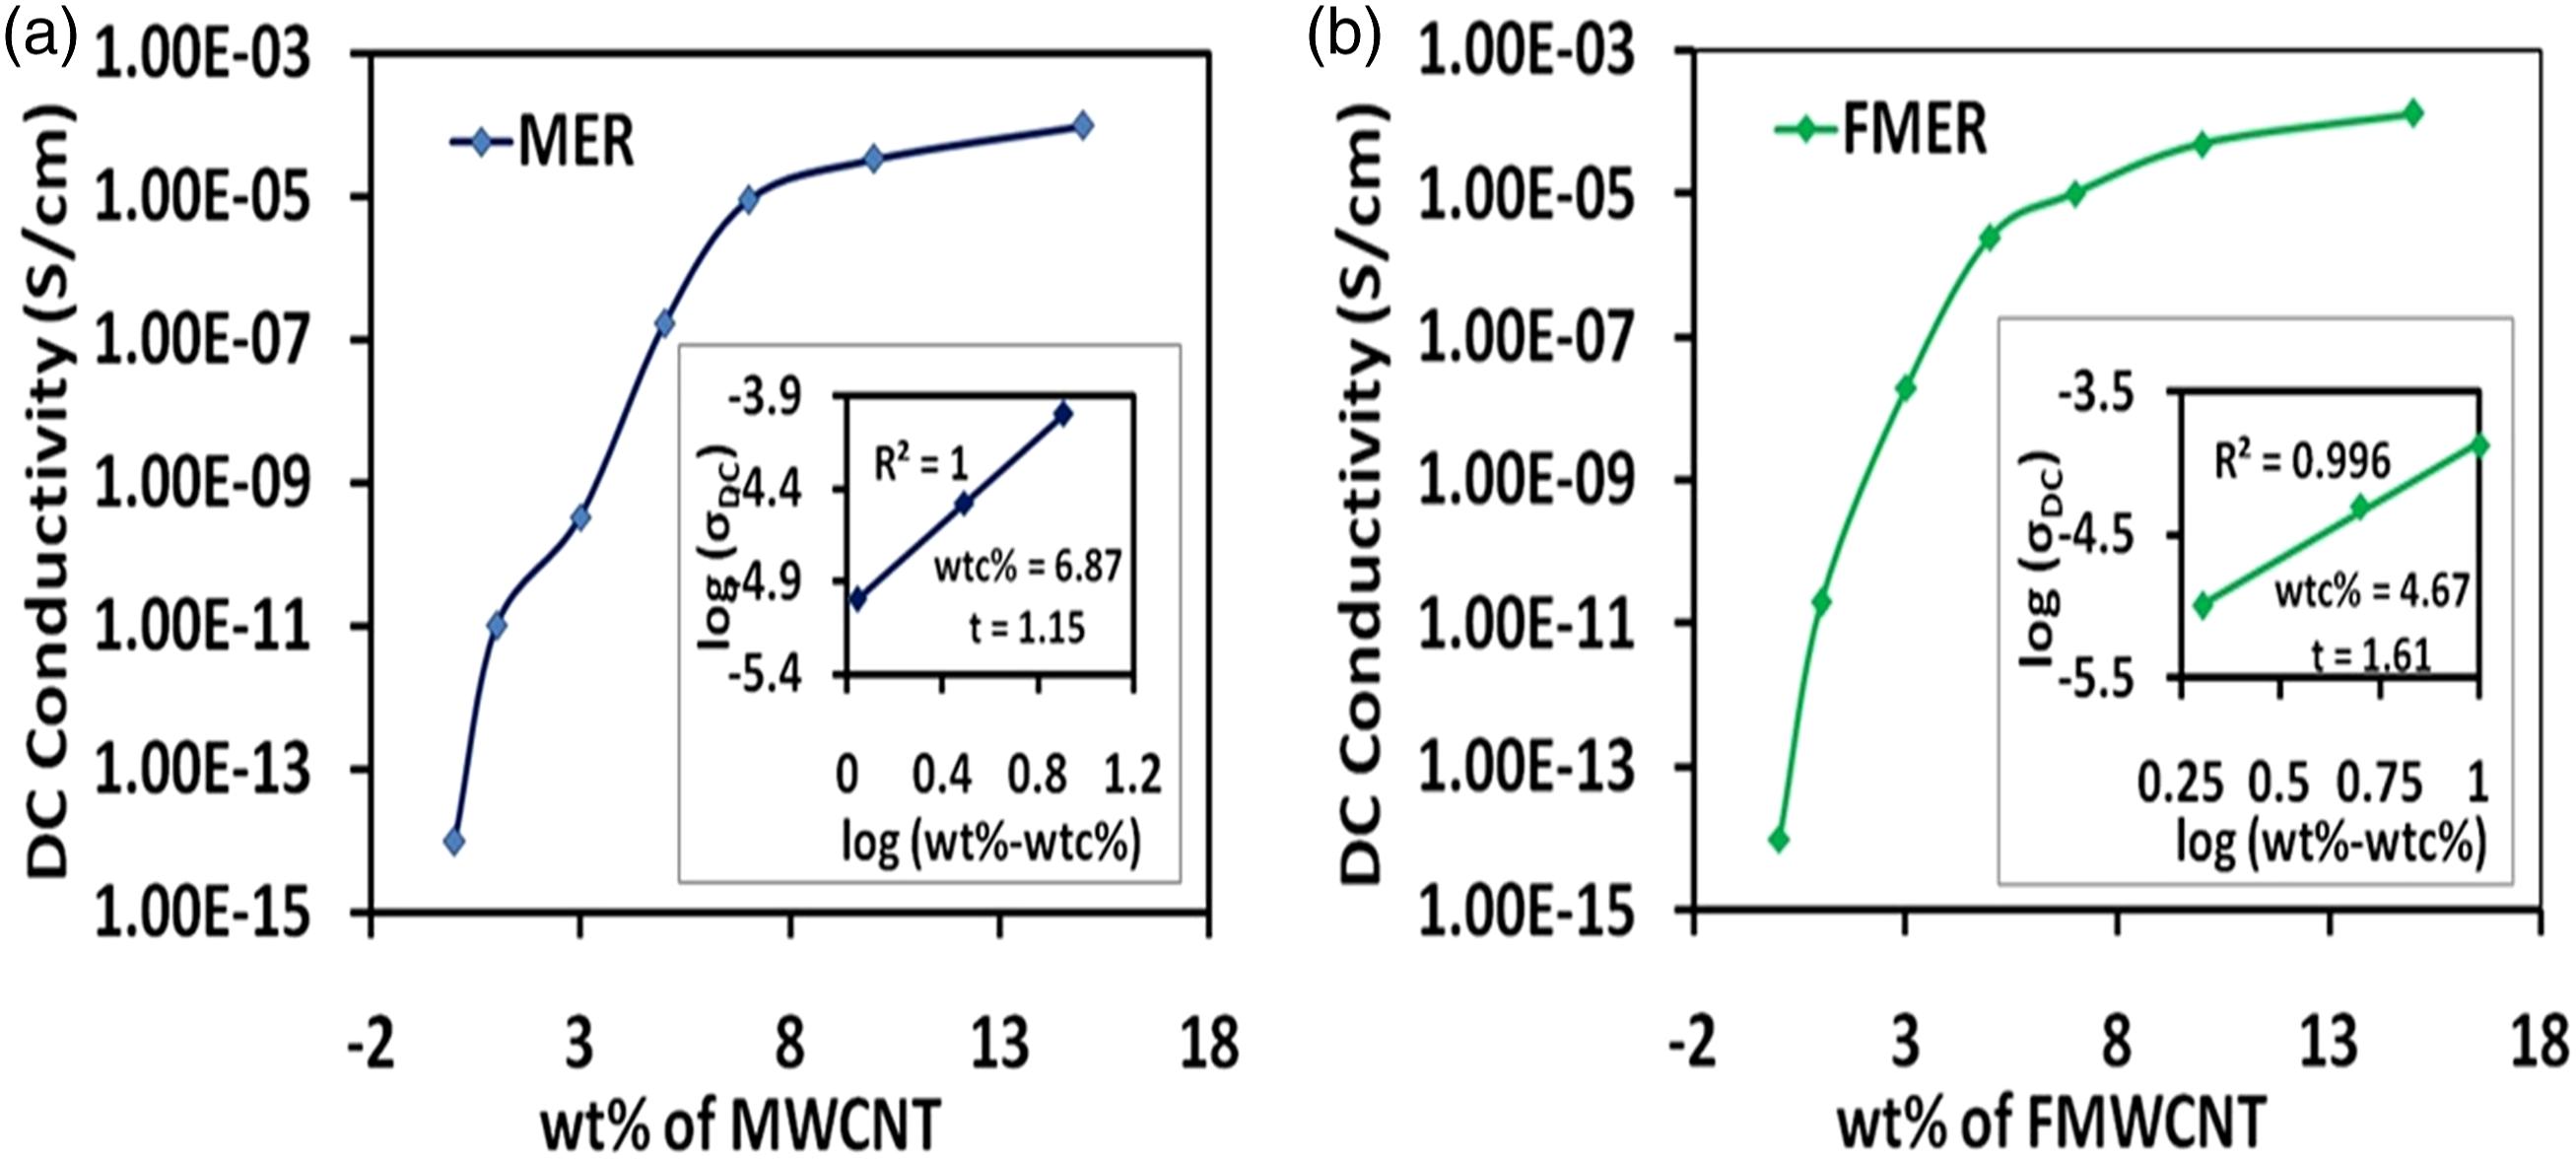
A linear, logarithmic plot of σDC and (wt%-wtc%) is drawn with a best-fit equation, which is depicted in the inset of Figure 6(a). The slope of the straight line gives the critical exponent value as 1.15, which lies between 1 and 1.43, facilitating a quasi 2-dimensional network formation where the electron transfer occurs from close contact of MWCNT-MWCNT and MWCNT-EMA and the corresponding percolation threshold is 6.87. Beyond the percolation value of 6.87, there is a marginal change in conductivity. Low percolation is attributed to the fact that there is a good formation of the compact conductive pathway at lower filler content.
DC conductivity after functionalization
The use of FMWCNTs in FMER nanocomposite facilitates more improved distribution and dispersion of the fillers, easing better conductive networks into the polymer matrix, resulting in a rise in conductivity, whereas diminution in the percolation threshold value of 4.64 as shown in Figure 6(b). The comparative lower value of the percolation threshold is justified by the higher value of exponent (t = 1.61), as shown in the inset of Figure 6(b), which is attributed to a 3-dimensional conductive network formation. For both the composites, the measured DC conductivity show improved conductivity compared to other conductive fillers, which is suitable for the application of EMI shielding.
Effect of MWCNT loading on AC conductivity
Figure 7(a) depicts the AC conductivity variation with frequency as a function of MWCNT reinforcement. With the increase of MWCNT loading from 1 to 15 wt%, the AC conductivity increases incessantly. Below the percolation threshold, there is a rising trend of AC conductivity with frequency. For pure EMA, there is no phase current flow at a lower frequency, but at a higher frequency, the current flow increases due to the mechanism of interfacial polarization. As well as at low filler concentration, most of the fillers are isolated, resulting in long-distance electron transport to have specific conductivity at low frequency. At a higher frequency, due to the electron’s dipole reorientation and the excitation of the electrons, the conductivity increases as electrons hop easily between the isolated fillers. However, there is frequency-independent behavior at higher filler loading, that is, above the percolation threshold. It is due to forming a compact conductive network when filler loading increases. The conductivity increases marginally as electrons do not need to hop, which can pass easily through the network at low frequency. However, around the percolation threshold, the electrons are inactive at a low frequency. Thus, the conductivity is independent of frequency, while at high frequency, the electrons get activated and excited, resulting in frequency-dependent conductivity. Comparison of AC conductivity of (a) MER and (b) FMER nanocomposites as a function of filler loading.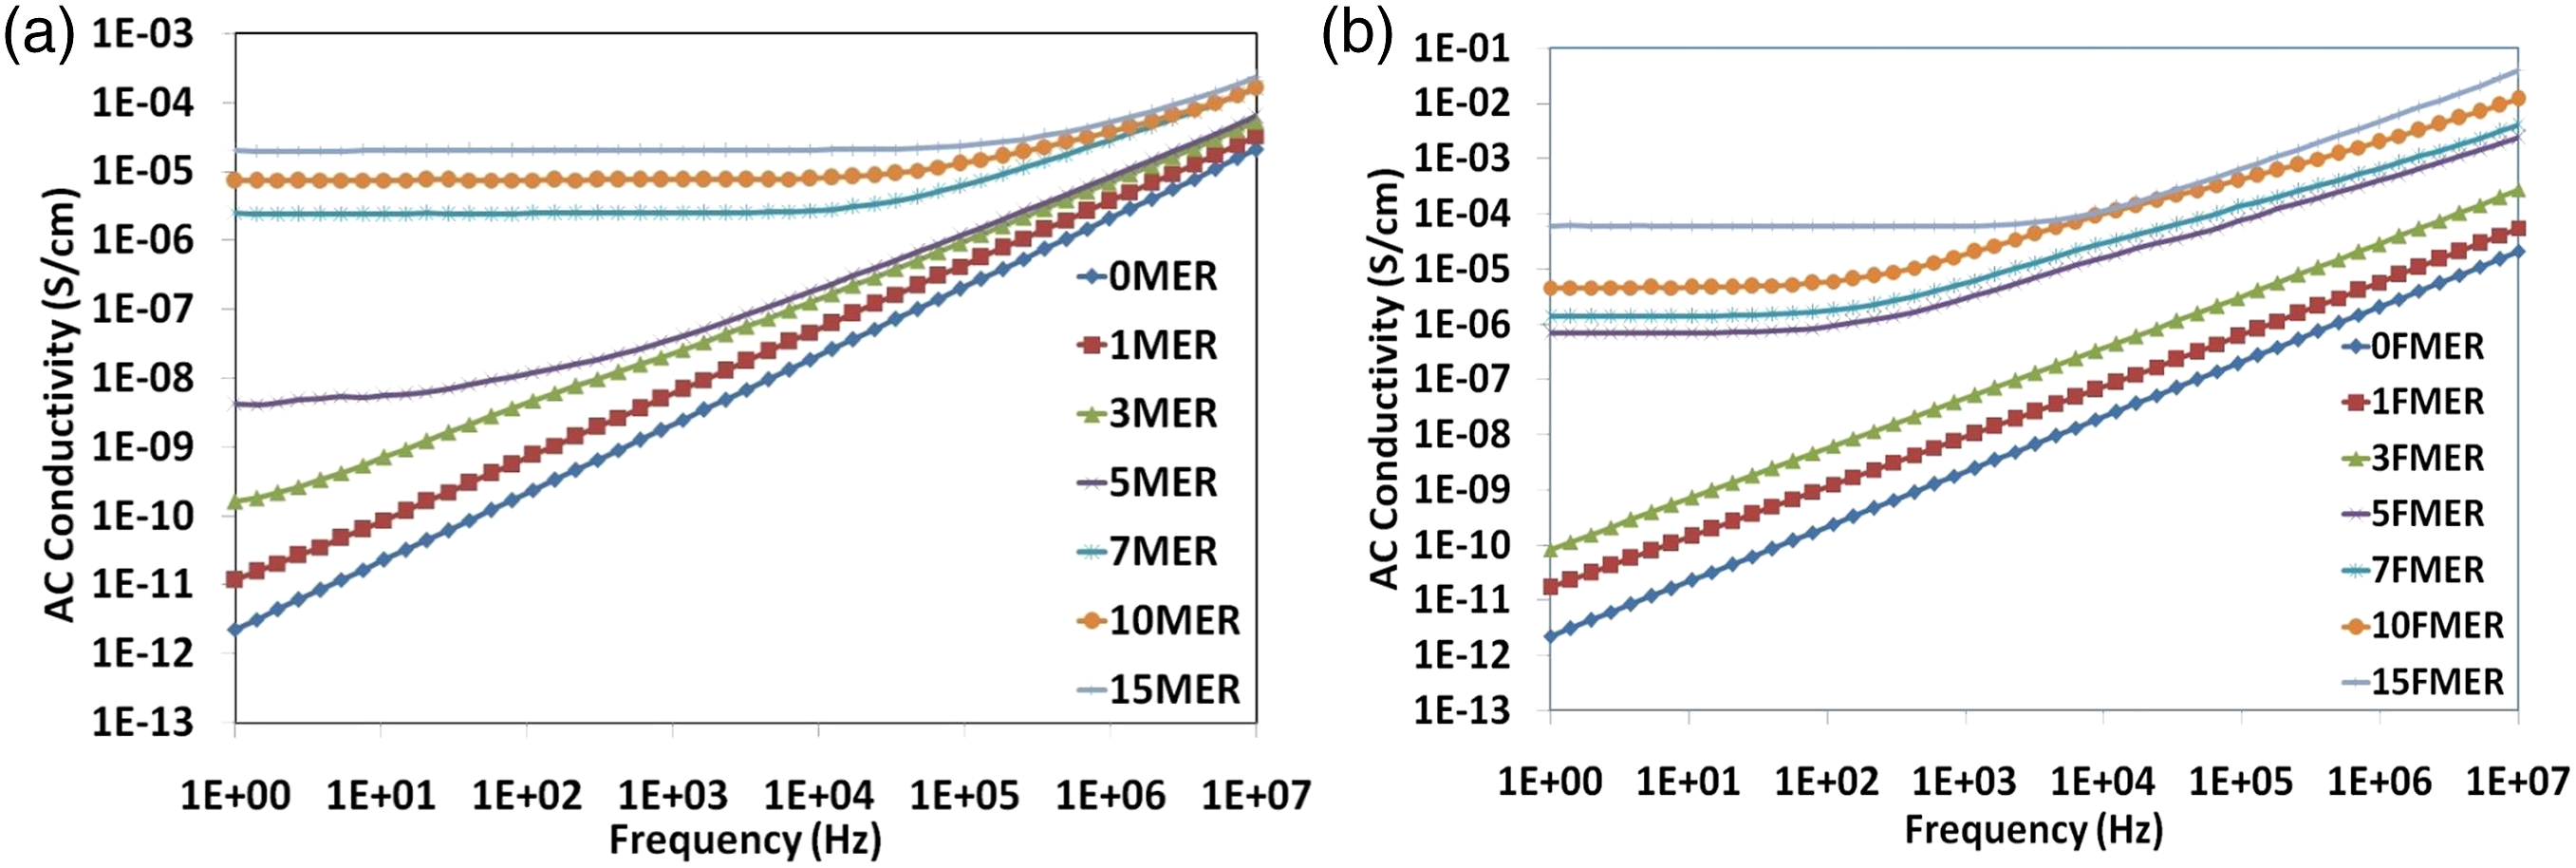
AC conductivity after functionalization
The AC conductivity of FMER nanocomposites with the variation of frequency as a function of FMWCNT loading is shown in Figure 7(b). Here, the conductivity increment is relatively more compared to MER composite for the same concentration of filler while the trend of increase is nearly the same with only difference in the diminution of percolation value as given by 4.67 wt% compared to 6.87 wt% in the case of MER nanocomposites again conceptualized as better conductive network formation in FMER nanocomposites.
Comparative study of electromagnetic interference shielding effectiveness
EMI shielding theory
Electromagnetic shielding is the technique used to reduce the electromagnetic radiation intensity by placing a shielding material when electromagnetic pollution from one source interferes with the malfunctioning of any nearby electronic objects or causes radiative damage to the living beings. The attenuation amount of electromagnetic wave coined as the EMI shielding efficiency depends on three shielding mechanisms such as reflection (R), absorption (A), and multiple reflections (MR) of the studied nanocomposites. The total shielding effectiveness SET consists of reflective SE (SER), absorbed SE (SEA), and multiple SE (SEMR), associated with the above three shielding mechanisms, respectively, as given in equation (1)
Shielding effectiveness due to multiple refection terms can be neglected if SET is greater than 15 dB or when the material thickness exceeds skin depth (δ).
The total shielding effectiveness SET can also be defined as the logarithmic ratio between transmitted power PT from the shielding material and the incident power PI on the shielding material as per equation (2)
Here, the total shielding effectiveness has been determined from the scattering parameters obtained from a vector network analyzer (VNA) when tested in the X band frequency regime (8.2–12.4 GHz) evaluated as equation (3)
At skin depth (δ), the intensity of the EM wave reduces to 1/eth of the incident EM wave, and it is given in equation (6)

EMI shielding properties
In the current environment of an increasing number of EM radiation sources, EM shielding is in high demand for the reliability of both electrical and electronic instruments and living beings. In order to understand the effect of MWCNT in the EMA matrix in terms of EMI shielding efficiency more prominently, the total EMI SE is compared with the contributions of absorbed and reflected EMI SE. The total EMI SE variation of the MER nanocomposite is seen with different loading percentages of MWCNT as a function of frequency in the X-band frequency (8.2–12.4 GHz), as depicted in Figure 8(a). As anticipated, the EMI SE of pure polymer is about 1 dB, that is, the virgin polymer is transparent to EM radiation and cannot attenuate the incoming EM radiation. While with the addition of MWCNTs into the polymer, there is a gradual increase in EMI SE. The EMI SE value increases a little above 10 dB with just 1 wt% of MWCNT addition. For 3MER nanocomposite, the value reaches about 20 dB, which is considered sufficient for applications in commercial shielding material. Nevertheless, beyond 3 wt% of loading, the improvement in shielding efficiency is slow and gradual up to 15 wt% of MWCNT loading, and the corresponding highest shielding efficiency is recorded at close to 25 dB. Thus, it is seen that at such low loading of 3 wt% of MWCNTs, almost 95% of EM radiation is blocked, while the attenuation is above 96% for 15MER nanocomposite. This gradual increase in EMI SE with the increase in MWCNT loading is explained by the fact that with the rise in MWCNT loading, the conductive network formation improves due to better distribution of CNTs throughout the polymer matrix.
57
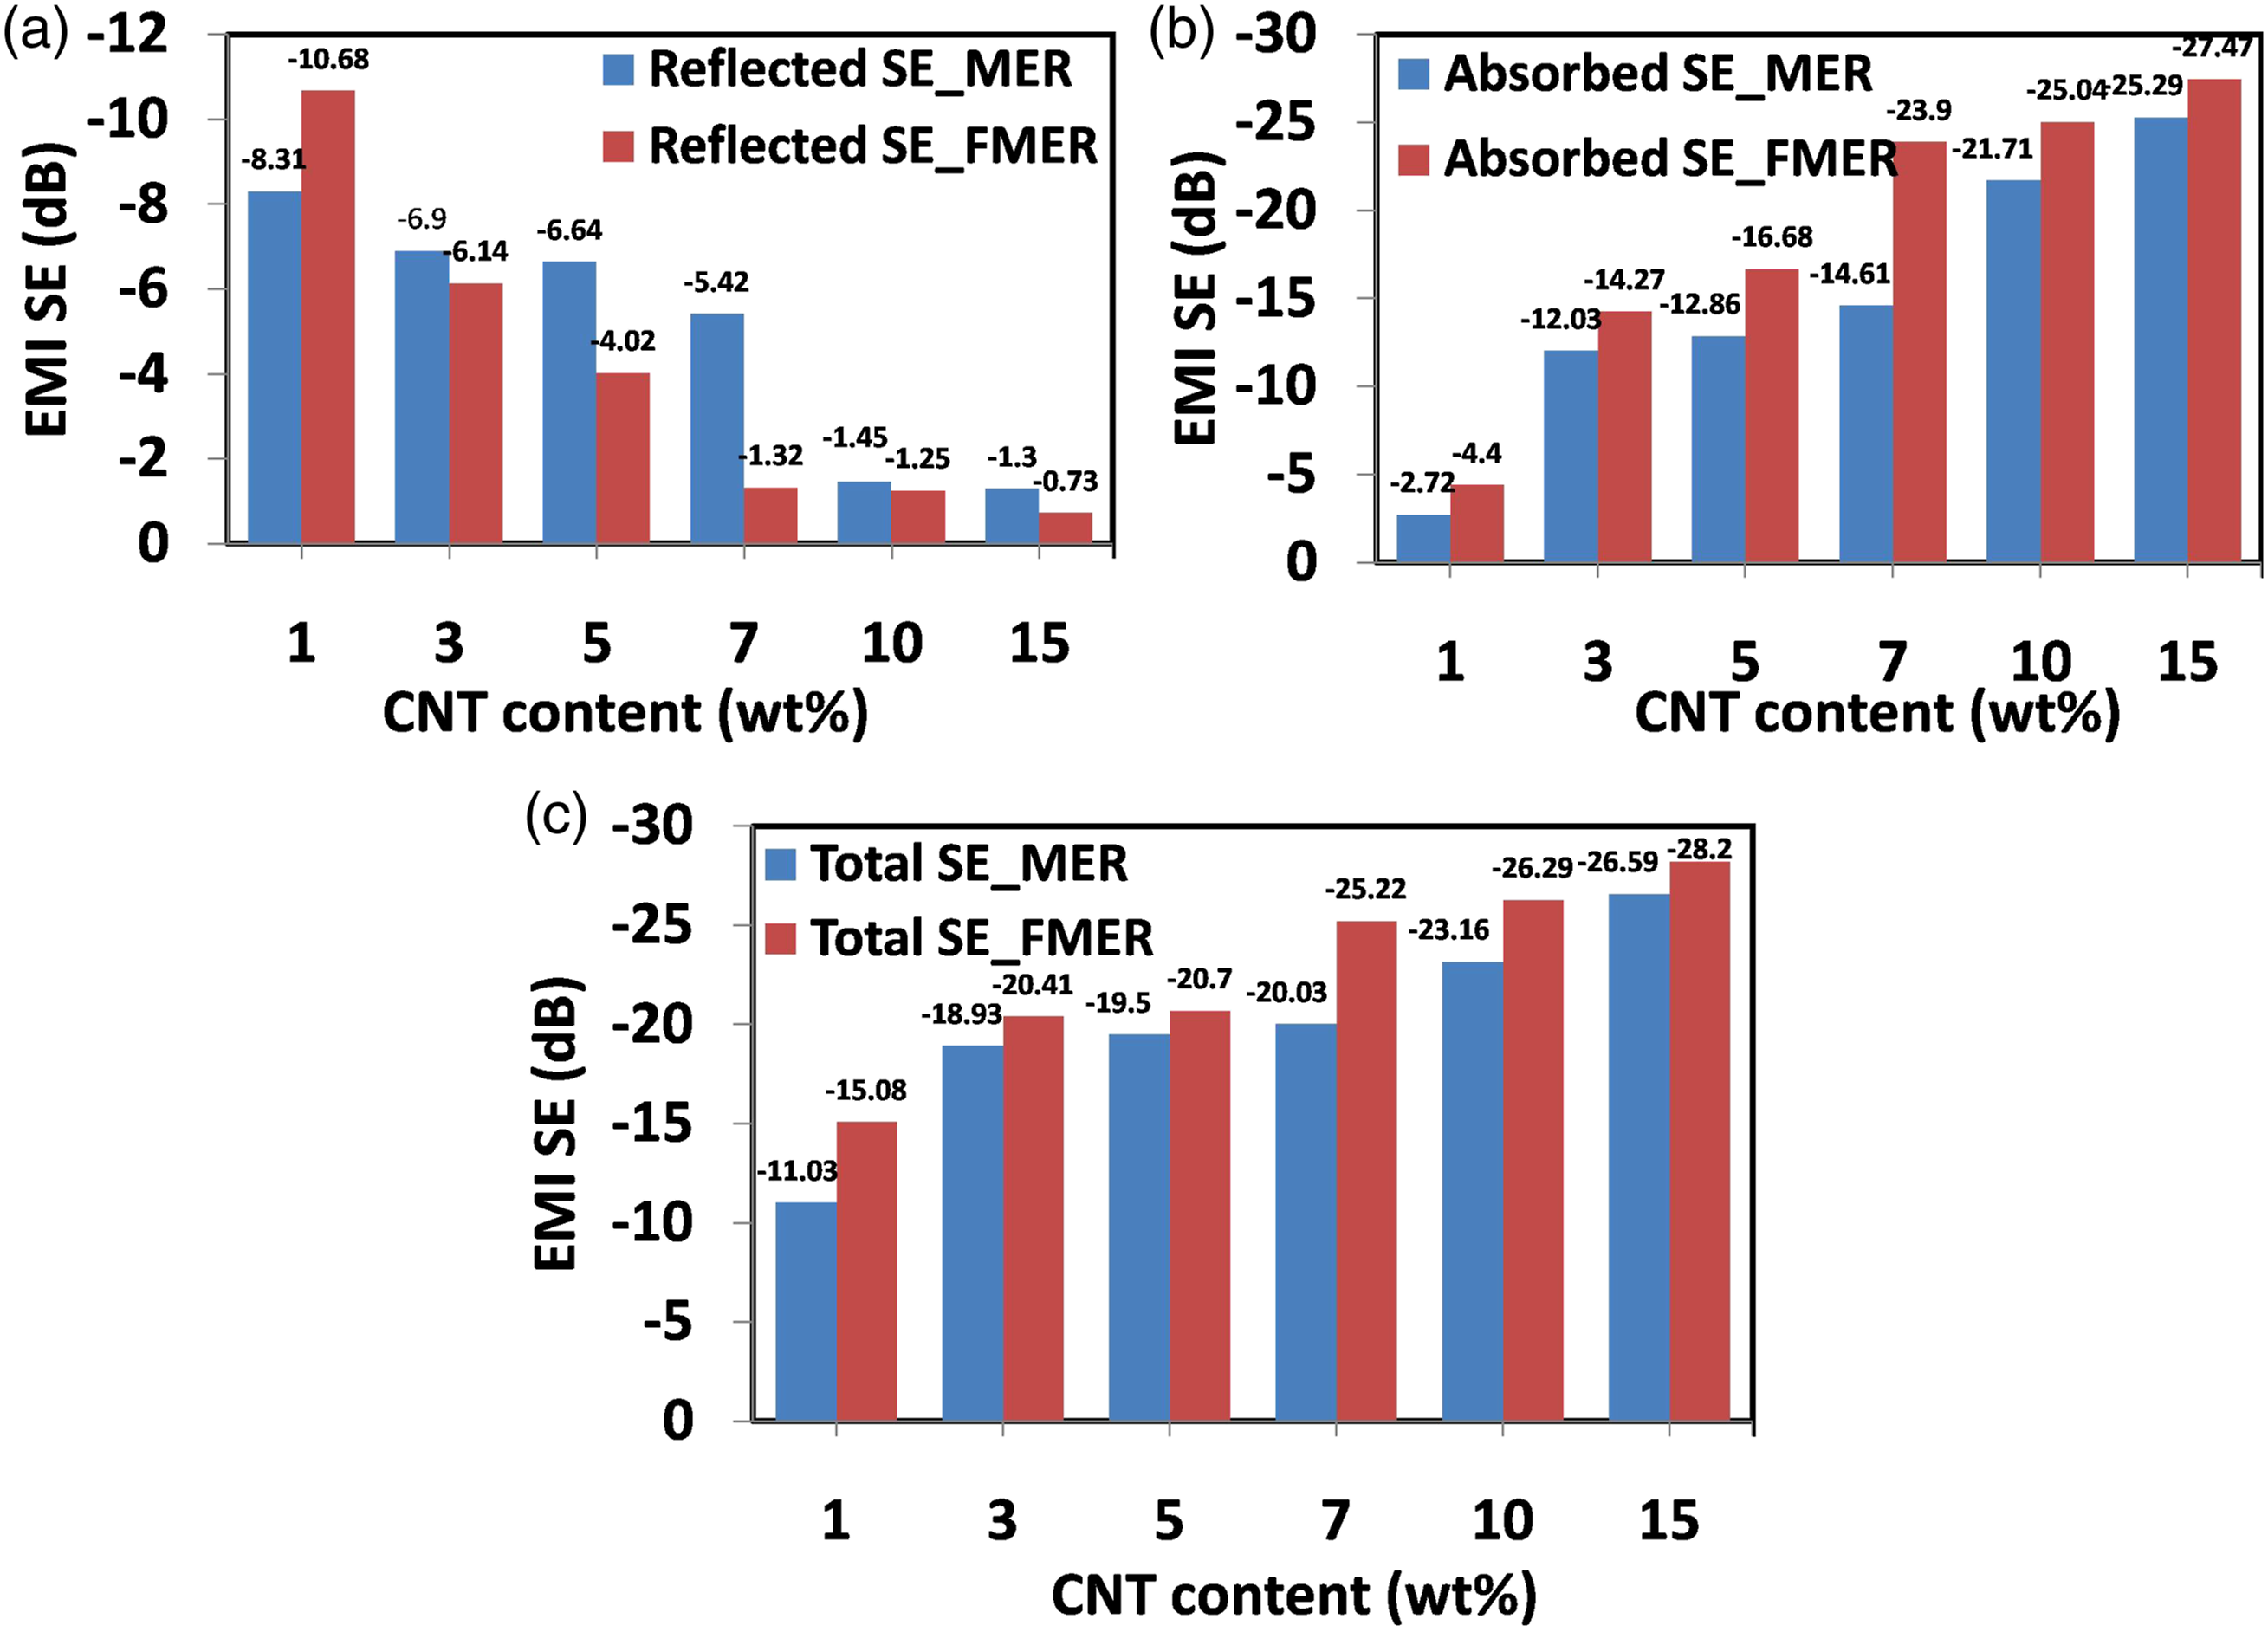
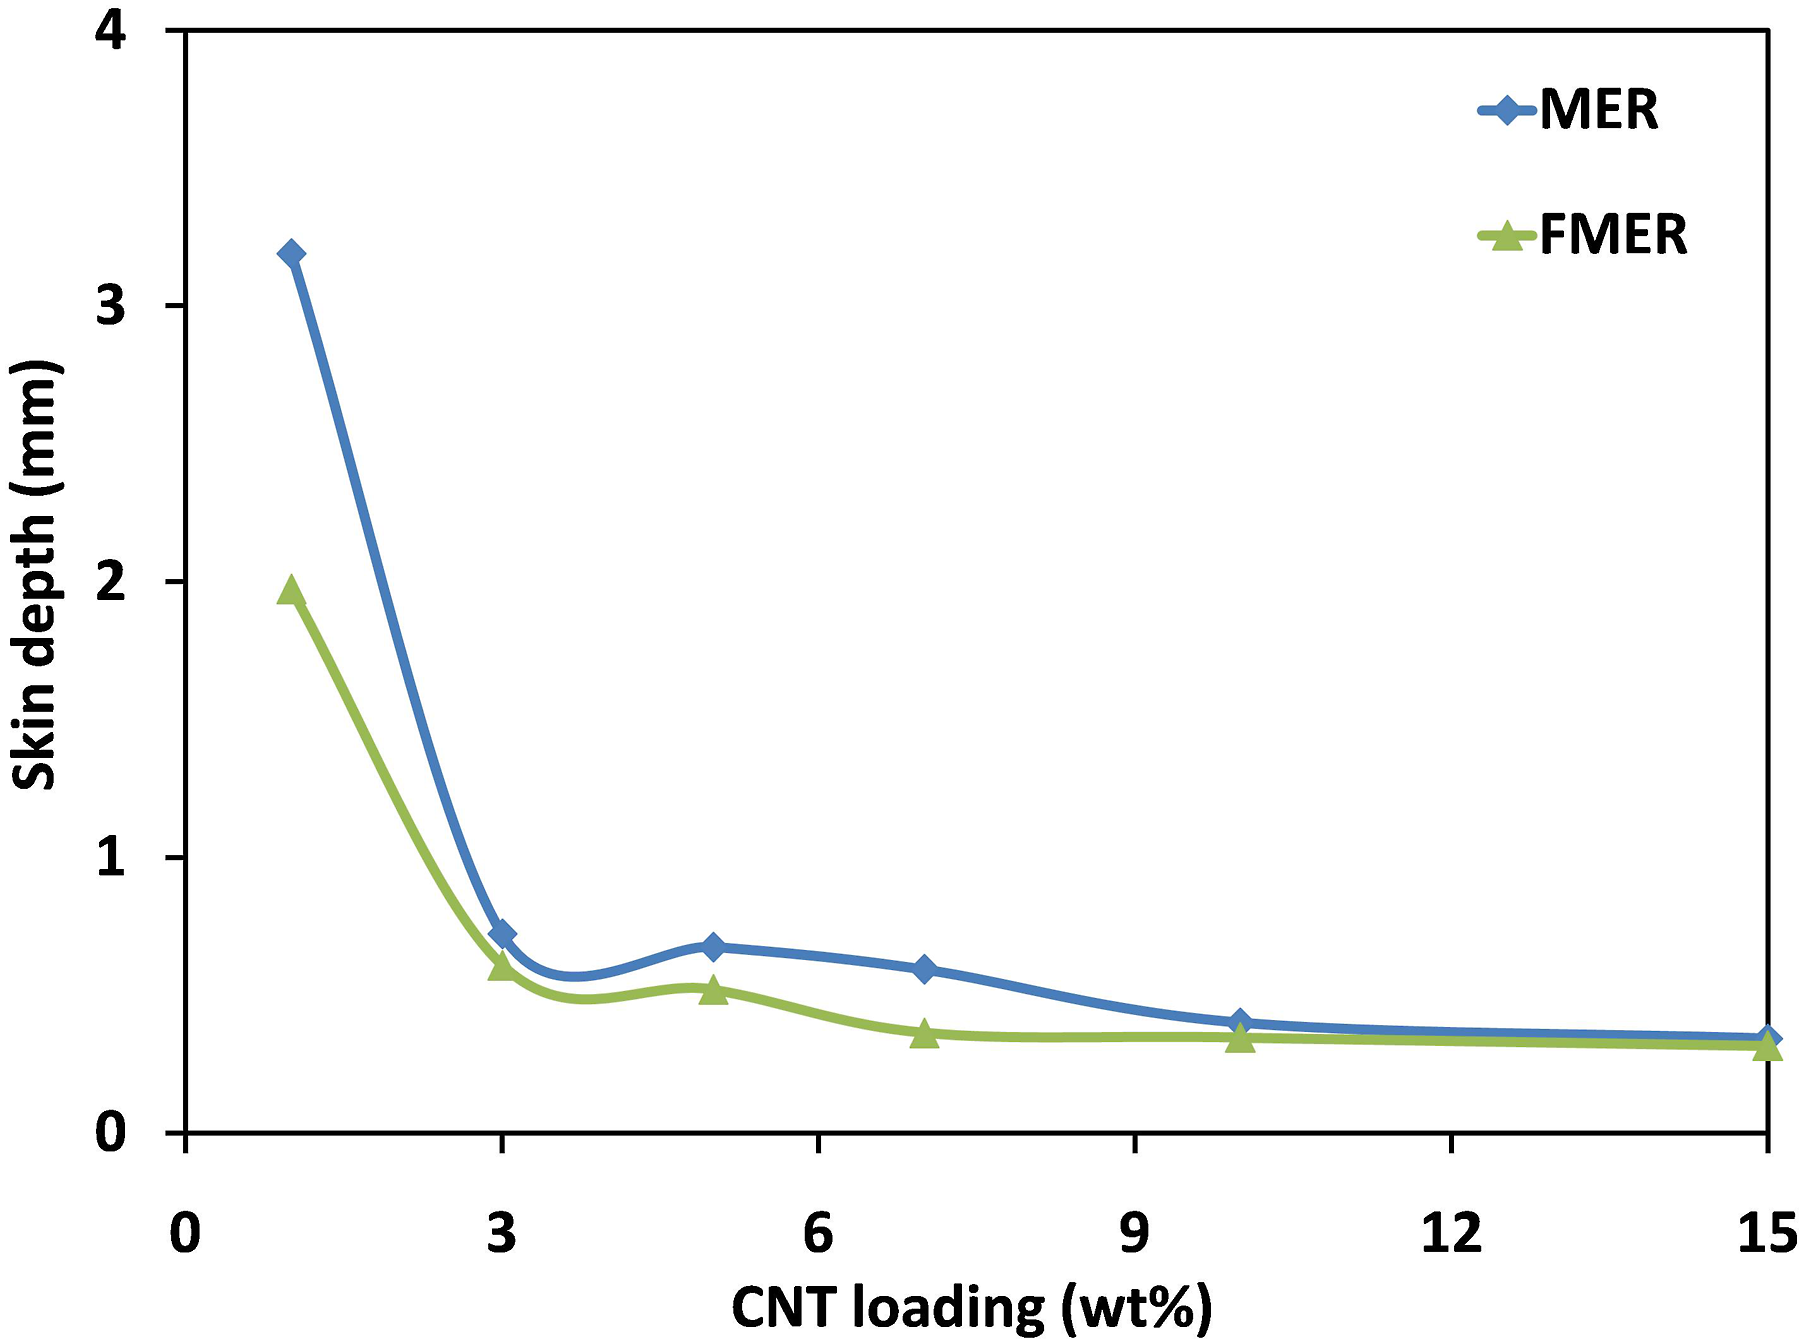
Additionally, from Figure 8(a), it can be observed that for all the MWCNT loading cases, the EMI SE is frequency independent in the tested frequency range. Figure 9(a) and (b) portrays the reflected SE (SER) as 8.3, 6.9, 6.6, 5.4, 1.5, and 1.3 dB. At the same time, the absorbed SE (SEA) are 2.7, 12.1, 12.9, 14.6, 21.7, and 25.3 dB with the addition of 1, 3, 5, 7, 10, and 15 wt% of MWCNT, which elucidate the fact that the contribution from absorbed shielding mechanism is dominant compared to reflection shielding mechanism at higher loading of MWCNTs. Figure 10 depicts the skin depth of MER nanocomposite, which presents that with the increase in MWCNT loading, the skin depth of the material decreases. At 1 wt% of MWCNT loading, the skin depth is 3.19 mm. At the same time, at 15 wt%, the same is 0.34 mm only, which tells that very thin material is sufficient to attenuate the EM radiation at the desired level by increasing the MWCNT loading percentage. EMI SE of (a) MER and (b) FMER nanocomposites as a function of frequency. Comparison of (a) reflected, (b) absorbed, and (c) total EMI SE of MER and FMER nanocomposites with CNT loading. Comparison of skin depth of MER and FMER nanocomposites with CNT loading.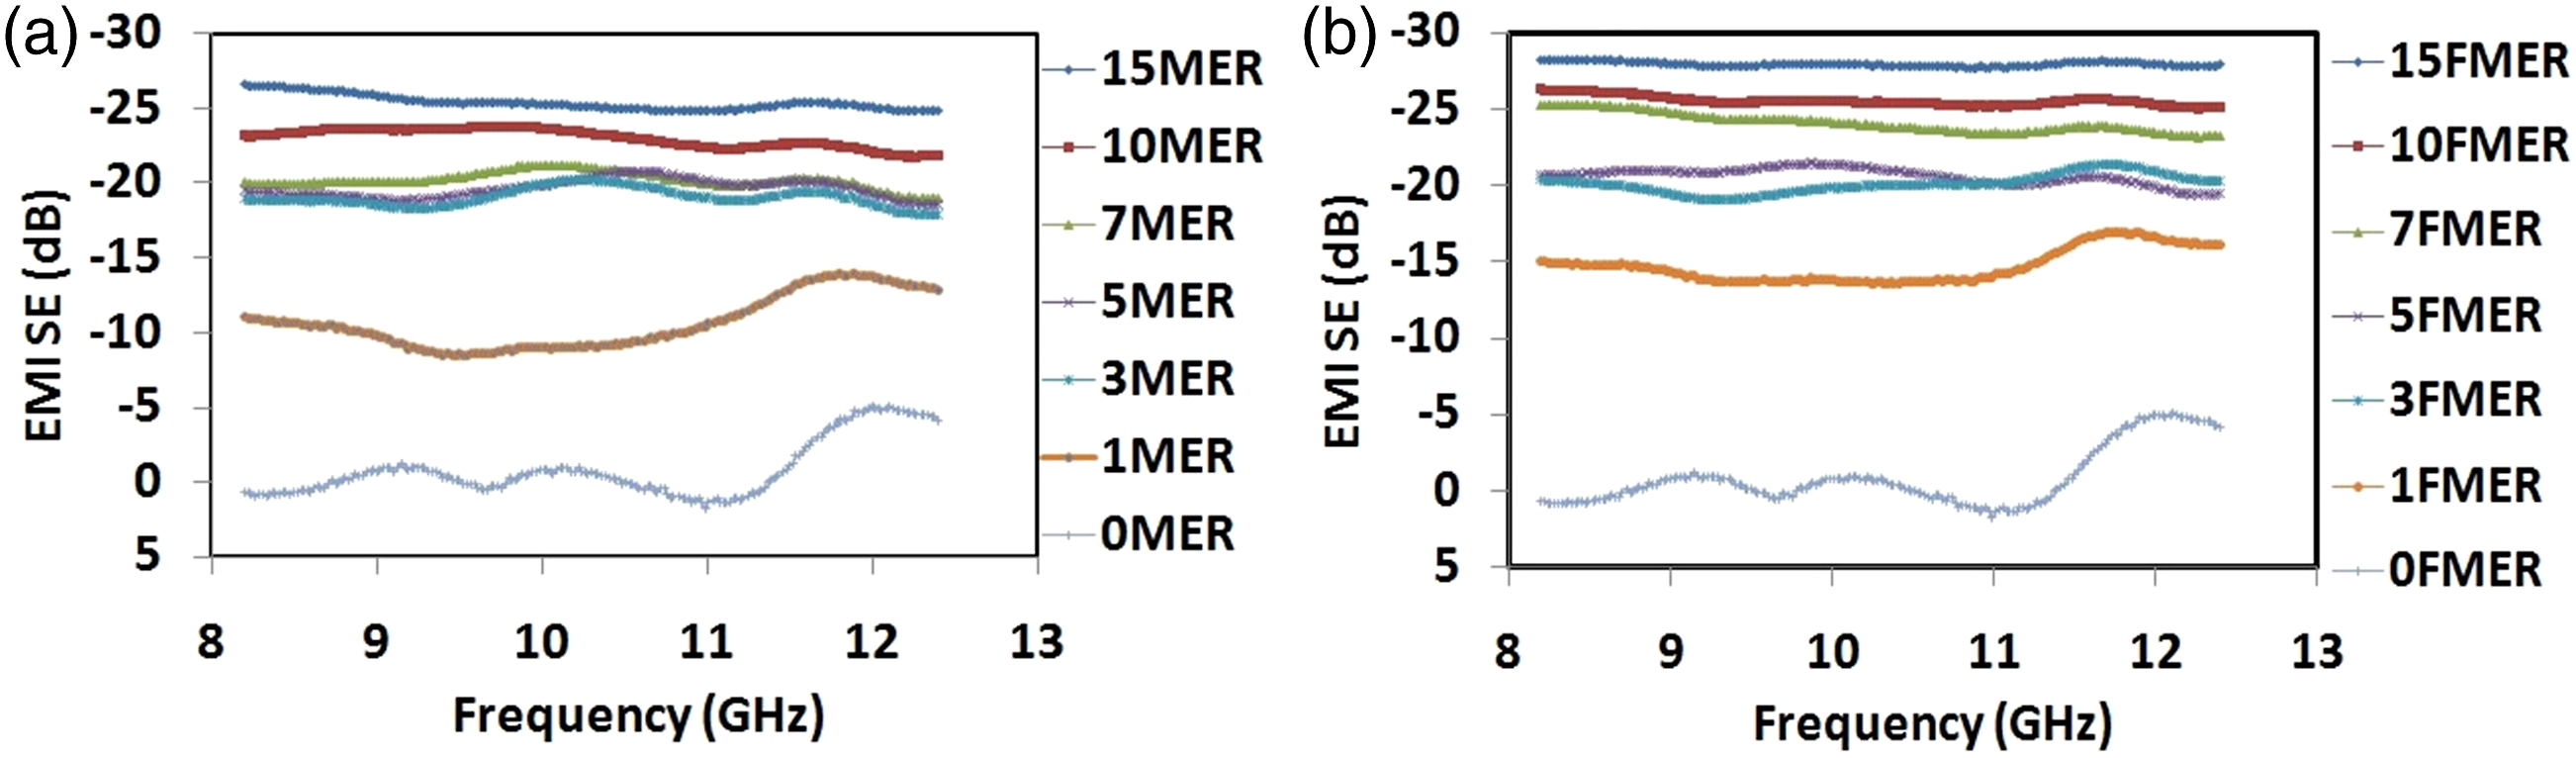
EMI shielding effectiveness after functionalization
In general, the shielding efficiency of a nanocomposite is controlled by the following four parameters such as (i) high conductivity of the fillers, (ii) proper distribution and dispersion of the nanofillers, (iii) better-interconnected network formations, and (iv) polarization of dipoles.
77
Dipole formation and nomadic charge accumulation at the composite interface increase interfacial polarization, which helps form a conductive network path throughout the EMA nanocomposite.
78
The formation of a conductive network path increases in the presence of oxygen functional groups like carboxyl, carbonyl, hydroxyl, and phenolic. In this study, the effect of carboxyl group MWCNT nanofiller (FMWCNT) on EMI SE of FMER nanocomposite has been shown in Figure 8(b). Herewith just 1 wt% of FMWCNT loading, the EMI SE reaches above 15 dB, unlike 10 dB for MER nanocomposite. Beyond 1 wt%, the increment of EMI SE is gradual with the increase in FMWCNT loading. Like the MER nanocomposite, the EMI SE value of the FMER composite is also independent of frequency in the measured frequency region. At 8.2 GHz, the contribution of reflected, absorbed, and total SE is shown in Figure 9(a)–(c), where the contribution of absorbed SE is much higher than SE due to reflection. The highest SE obtained is 27.9 dB for 15FMER nanocomposite. The variation of skin depth with FMWCNT loading is shown in Figure 10. With the rise in FMWCNT loading, the skin depth decreases. For 1FMER nanocomposite, the skin depth is 1.97 mm, while it is 0.32 mm for the 15FMER counterpart. The total SE of FMER nanocomposite is higher than MER nanocomposite, as shown in Figure 11. It is attributed to the increase in electrical conductivity due to a rise in conductive network formation because of the better distribution and dispersion of the functionalized MWCNTs throughout the EMA polymer. Comparison of total EMI SE of MER and FMER nanocomposite with CNT loading.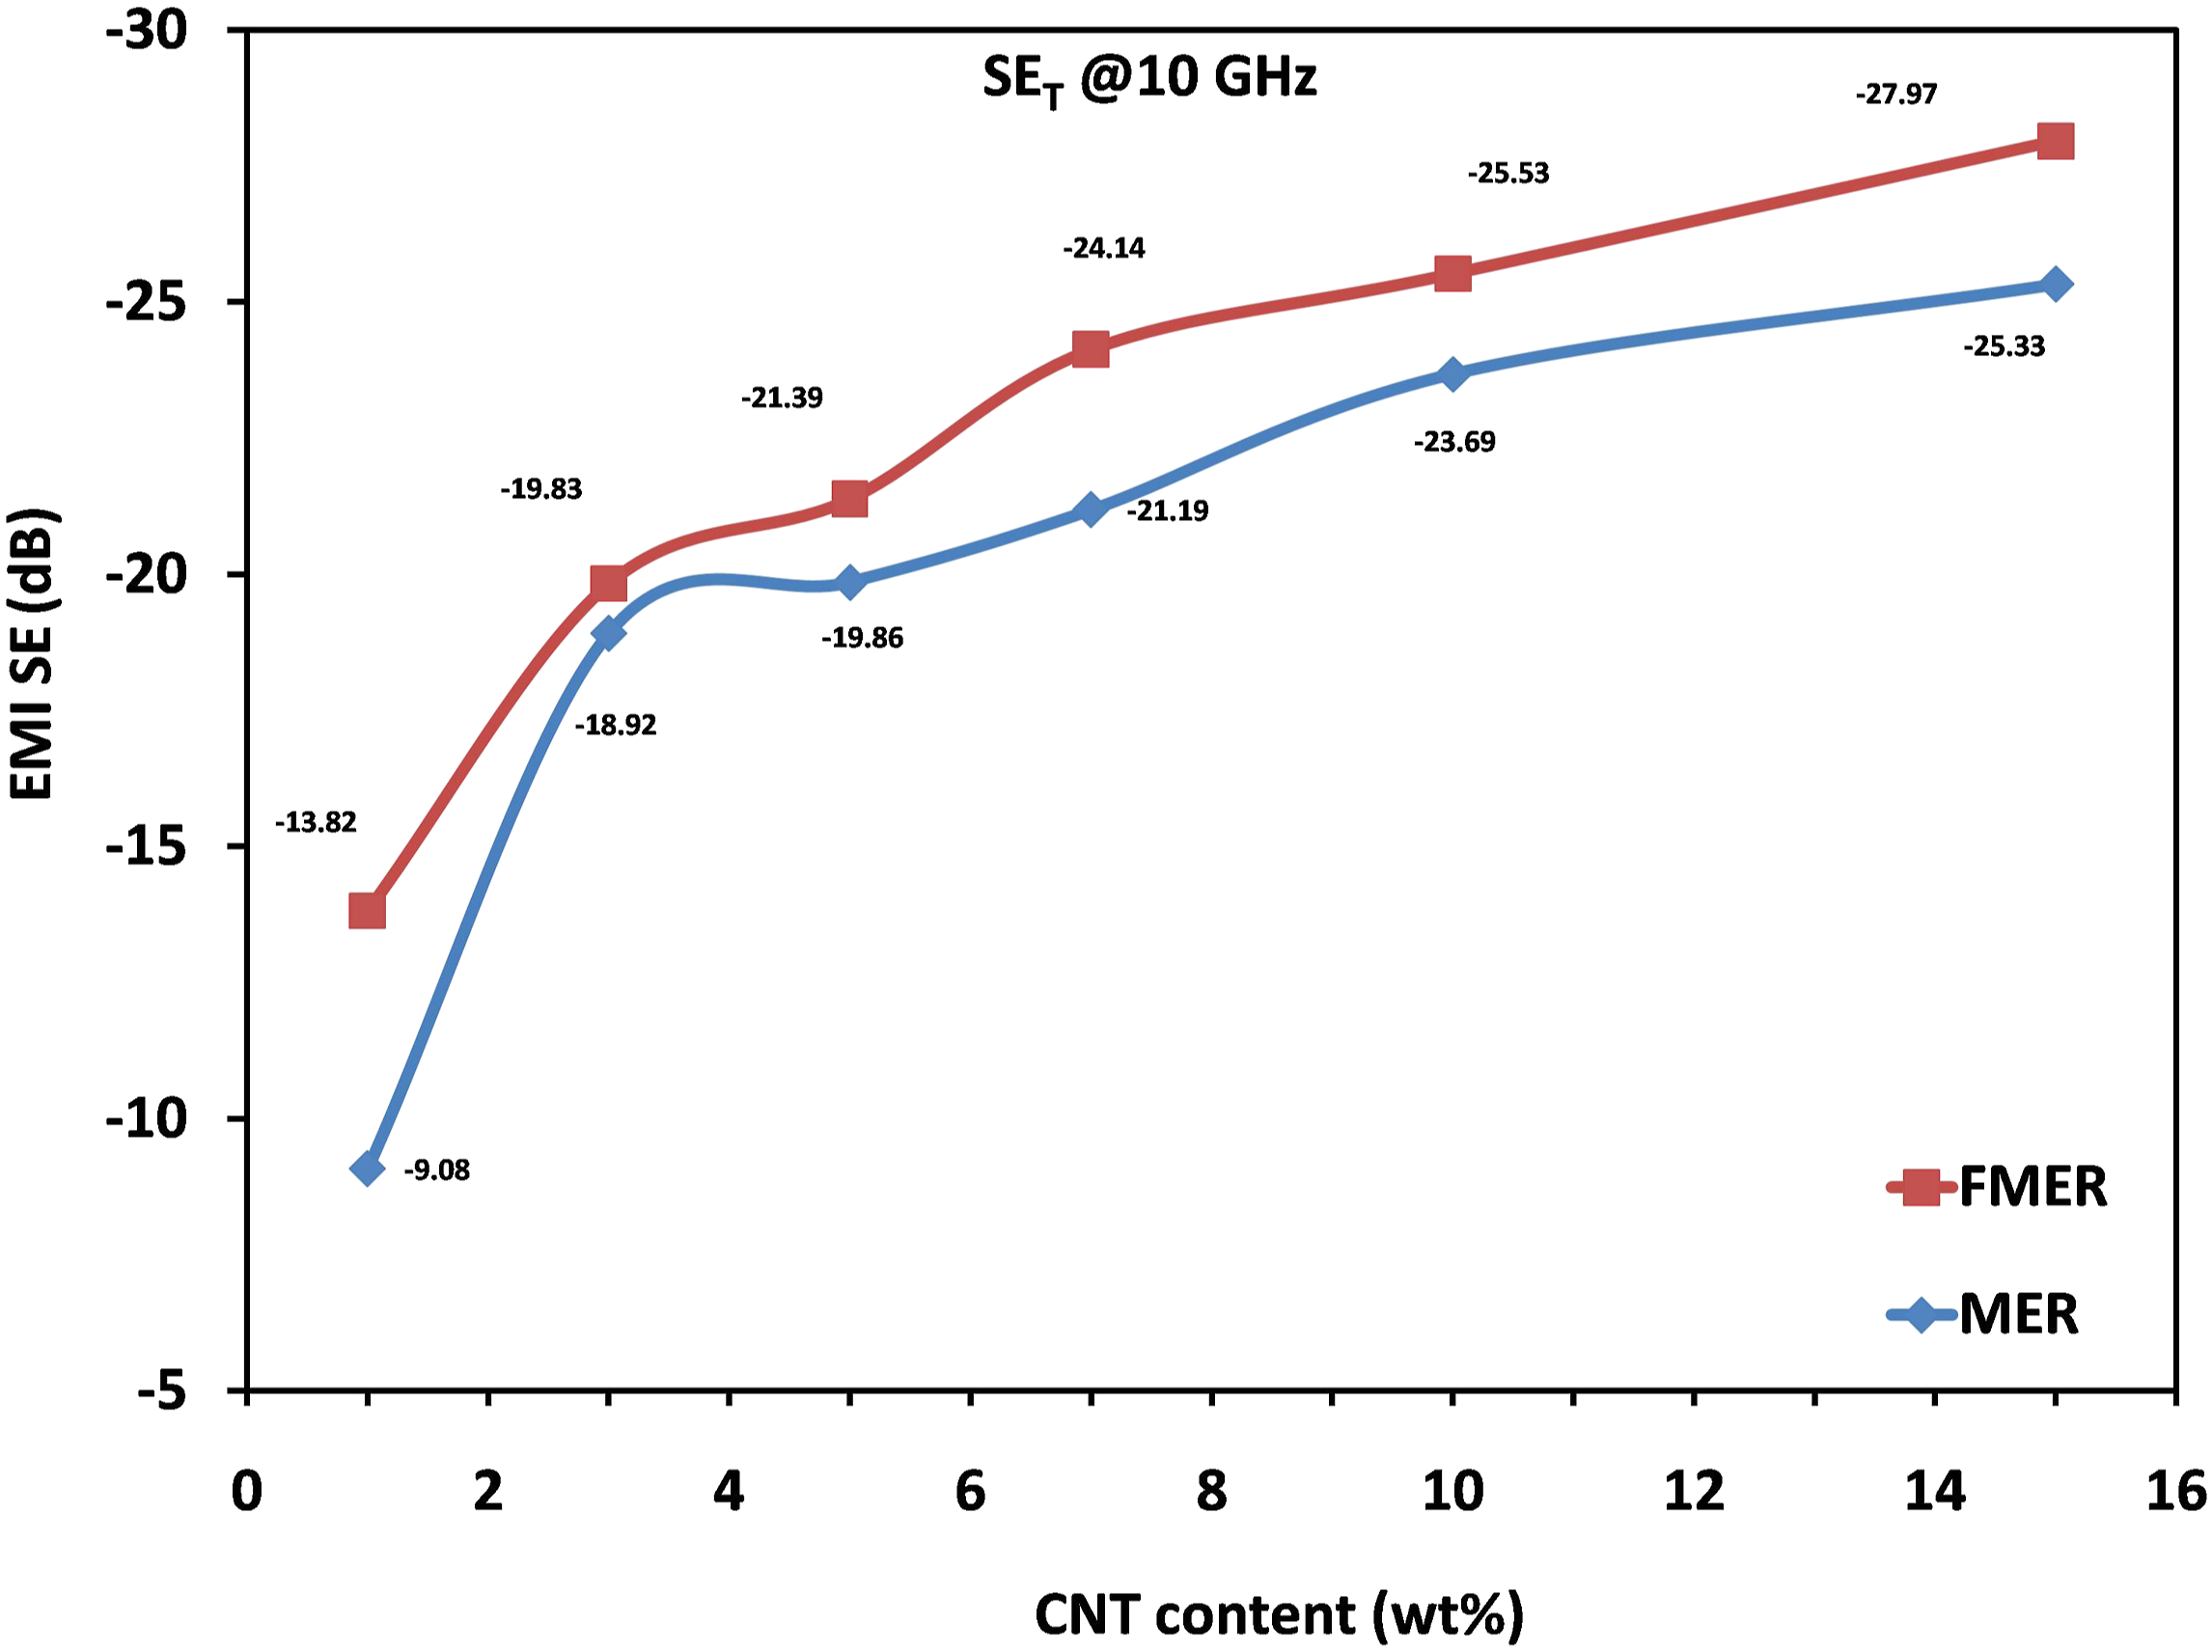
Comparison of EMI SE of various conductive filler/polymer matrix nanocomposites.
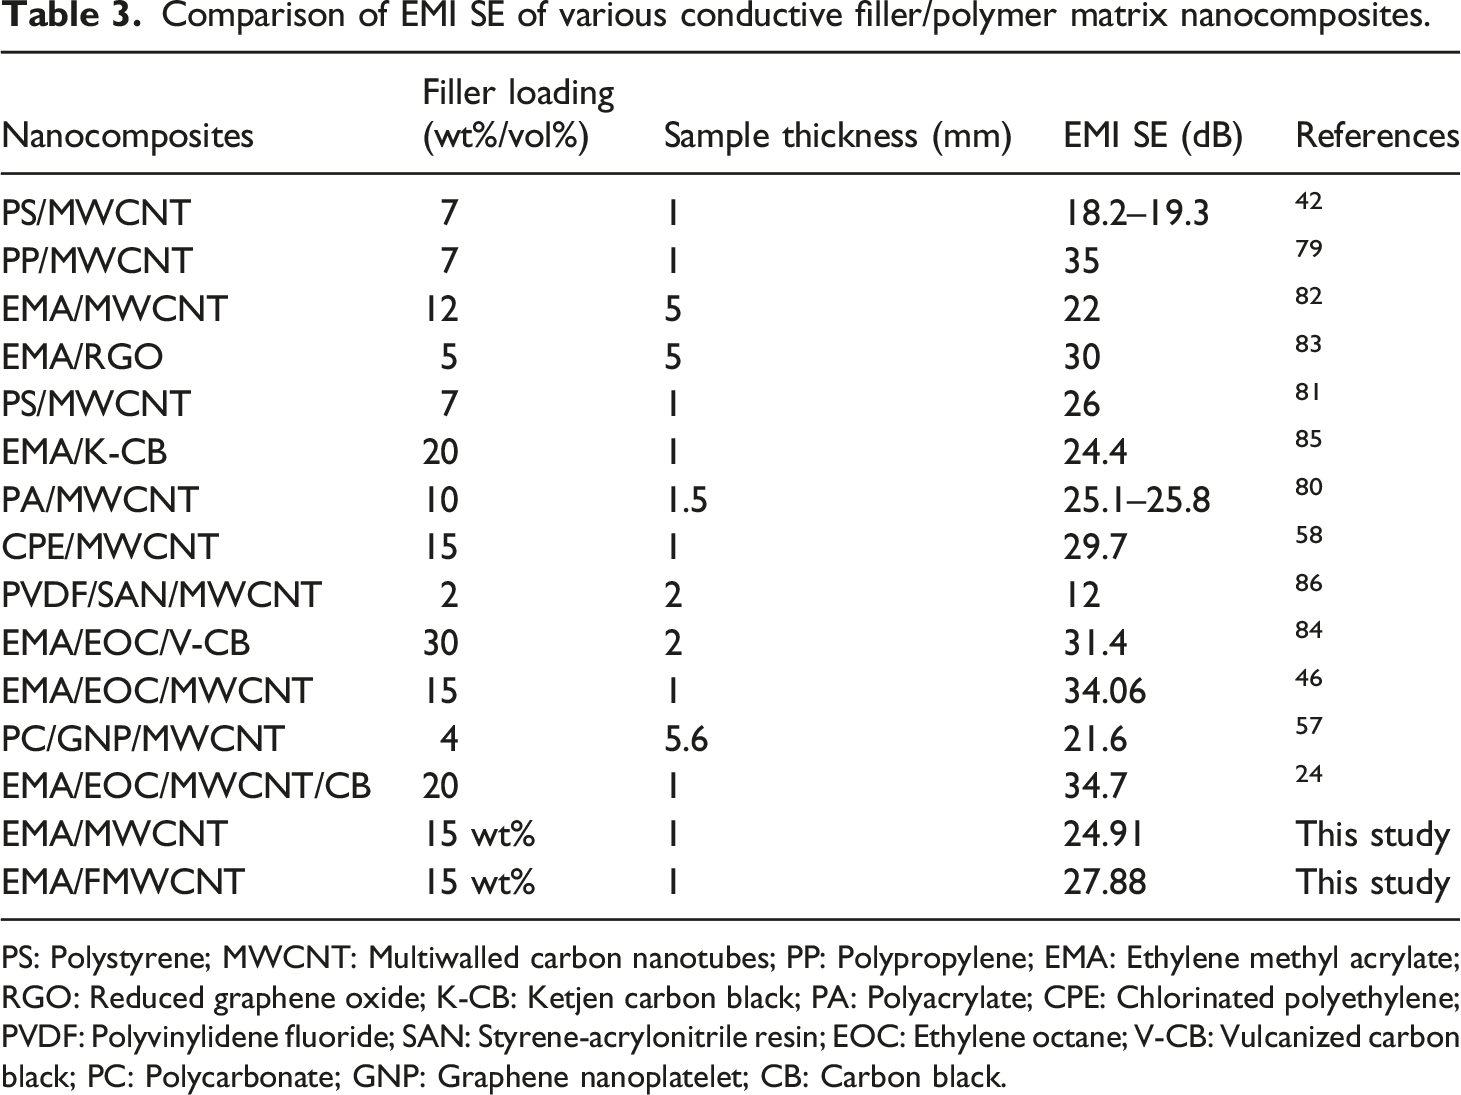
PS: Polystyrene; MWCNT: Multiwalled carbon nanotubes; PP: Polypropylene; EMA: Ethylene methyl acrylate; RGO: Reduced graphene oxide; K-CB: Ketjen carbon black; PA: Polyacrylate; CPE: Chlorinated polyethylene; PVDF: Polyvinylidene fluoride; SAN: Styrene-acrylonitrile resin; EOC: Ethylene octane; V-CB: Vulcanized carbon black; PC: Polycarbonate; GNP: Graphene nanoplatelet; CB: Carbon black.
From the above discussion, it is evident that different composite systems with different conductive fillers have different EMI SE values. In all these examples, MWCNTs are reinforced in different polymer matrices and have exhibited just around and above the commercial need of 20 dB of SE with either considerably higher loadings of MWCNTs or employing thick samples, resulting in early agglomerations, along with the complex and costly processing methods. All the above drawbacks are met by adopting a facile, industry viable, and cost-effective solution mixing strategy to fabricate highly flexible MER and FMER nanocomposite, which serves the EMI SE requirement of the industry as 20 dB at a very low loading of MWCNTs. Thus, compared with most of the previously reported values, the EMA nanocomposite disburses enhanced EMI shielding effectiveness which is obtained from industry viable, simple solution mixing technique with a very low amount of fillers. Again, FMER gives better EMI SE than MER nanocomposite for the same amount of MWCNT, which can be used in low-budget EM pollution attenuation applications in the X-band frequency region.
Conclusion
In summary, highly flexible EMI shielding materials have been developed by a unique and simple solution mixing strategy. EMA is the polymer matrix into which MWCNTs and FMWCNTs are reinforced individually, resulting in the fabrication of MER and FMER nanocomposites, respectively. The material’s morphological characterization reveals good distribution and dispersion of the fillers into the polymer matrix. The mechanical behavior study reveals that the stiffness increases and elongation at break decreased with the incorporation of nanofillers for both the nanocomposites, while the tensile strength value reaches the maximum at 10 and 3 wt% as 11.6 and 12.9 MPa for FMER and MER nanocomposites, respectively, and then decrease due to agglomeration beyond those filler loadings. Functionalization facilitates better distribution and dispersion for FMER nanocomposite, justifying enhanced Young’s modulus than MER nanocomposite at all loadings of fillers. Again, the study of both DC and AC electrical conductivities reveals that the addition of CNT does improve the electrical conductivities of both the composites. The DC electrical conductivity increased by eight decades as compared to pure polymer (1 × 10⁻¹⁴ S/cm) for both the 5FMER (2.5 × 10⁻⁶ S/cm) and 7MER (9.09 × 10⁻⁶ S/cm) nanocomposites, while at the highest loading of 15 wt%, there is an increment of 33% of DC conductivity for FMER nanocomposite compared to the MER nanocomposite. The functionalization of MWCNT facilitates better conductive network formation for the FMER over the MER nanocomposites, and that is justified by the lower percolation threshold value of nearly 5 and 7 wt% of FMWCNT (t = 1.61) and MWCNT (t = 1.15) loadings which attribute a 3-dimensional and 2-dimensional conductive network formation for FMER and MER nanocomposites, respectively. The comparative EMI SE study shows that with the increase of CNT loading, the SE increases for both the nanocomposites, but the rate of increment of SE is more for FMER nanocomposite than MER nanocomposite at all reinforcement loadings, and the highest shielding effectiveness is recorded as 25.5 and 28 dB corresponding to 15 wt% of CNT loadings for MER and FMER nanocomposites, respectively. FMWCNT’s dispersibility and conductive network formation is the driving force for the rise in mechanical performance and electrical properties, increasing EMI SE over the other candidate. For 10FMER nanocomposites, the shielding efficiency is 25.1 dB. After that, there is no significant improvement in SE of FMER nanocomposites proposing 10 wt% as the critical loading of reinforcement exhibiting maximum tensile strength with considerable stiffness and higher electrical conductivities. So it can be concluded that the 1 mm thick sample loaded with 10 wt% of functionalized MWCNT reinforced EMA polymer composite with excellent mechanical properties combined with good electrical conductivity exhibits superior EMI shielding effectiveness have been successfully developed to attenuate EM radiation to be useful for different industry and academia applications.
Footnotes
Acknowledgements
Dr N. C. Das would like to thank Science and Engineering Research Board (SERB)-DST (Grand no. CRG/2021/003146), Govt. of India for financially supporting this research works. Subhashis Sit acknowledges the MHRD scholarship, India for the PhD fellowship. Authors are also pleased to extend special thanks to carry out this work with the CRF, IIT Kharagpur as well as IIT Kharagpur regarding material characterizations facilities.
Declaration of conflicting interests
The author(s) declared no potential conflicts of interest with respect to the research, authorship, and/or publication of this article.
Funding
The author(s) disclosed receipt of the following financial support for the research, authorship, and/or publication of this article: This work was supported by the Science and Engineering Research Board (Grand no. CRG/2021/003146).